
Sensor Fault and Patient Anomaly Detection and ... · PDF fileIndex Terms—Wireless...
6
Sensor Fault and Patient Anomaly Detection and Classification in Medical Wireless Sensor Networks Osman Salem, Alexey Guerassimov and Ahmed Mehaoua † University of Paris Descartes – LIPADE Division of ITCE, POSTECH, Korea fi[email protected] Anthony Marcus and Borko Furht Department of Computer and Electrical Engineering and Computer Science Florida Atlantic University {amarcu10, bfurht}@fau.edu Abstract—Wireless Sensor Networks are vulnerable to a plethora of different fault types and external attacks after their deployment. We focus on sensor networks used in healthcare applications for vital sign collection from remotely monitored patients. These types of personal area networks must be robust and resilient to sensor failures as their capabilities encompass highly critical systems. Our objective is to propose an anomaly detection algorithm for medical wireless sensor networks. Our proposed approach firstly classifies instances of sensed patient attributes as normal and abnormal. Once we detect an abnormal instance, we use regression prediction to discern between a faulty sensor reading and a patient entering into a critical state. Our experimental results on real patient datasets show that our proposed approach is able to quickly detect patient anomalies and sensor faults with high detection accuracy while maintaining a low false alarm ratio. Index Terms—Wireless Sensor Networks, Sensor Faults, Per- sonal Area Networks, healthcare and remote patient monitoring, sensor management and regression tool framework I. I NTRODUCTION With current medical procedures and the healthy lifestyles of many, the average lifetime expectancy is ever increasing [1]. Doctors are able to better diagnose and treat patients while the ability of individuals to cope and recover from illnesses is staggering. Technological advances incorporated with vast and accurate knowledge of the human anatomy have allowed healthcare professionals the ability to handle almost any sce- nario they encounter in individuals at hospitals and emergency treatment facilities [1], [2]. As the average individual lifetime expectancy has increased, this has also directly impacted our planets population and as such, a shortage of qualified healthcare professionals to treat the sick and needy has become an issue. Scientists and researchers have developed numerous solu- tions to this problem, one of which allows patients to be remotely monitored utilizing networks of wireless sensors which relay, in real time, patient information to doctors and healthcare providers. Advances in sensor technologies and high throughput networks continue to refine the accuracy and increase the integrity and public trust of these systems. As a direct result, more individuals elect to utilize these systems as they allow greater freedom and mobility while maintaining † Visiting professor at CNRS LaBRI (France) research laboratory the quality of care equivalent to direct medical interaction and attention found previously only in hospitals, clinics, and other specialized care facilities. In medical applications, implementations of specialized Wireless Sensor Networks (WSN), known as personal area networks (PAN) and wireless body area networks (WBAN), are comprised of numerous small devices attached to or implanted in the body of a patient. In current days, many existing medical wireless devices are used to collect various patient metrics and vital signs, such as Heart Rate (HR), pulse, oxygen saturation (SpO2), Respiration Rate (RR), Body Tem- perature (BT), ElectroCardioGram (ECG), ElectroMyoGram (EMG), Blood Pressure (BP), Blood Glucose Levels (BGL) and Galvanic Skin Response (GSR). These networked sensors accumulate and transmit collected data to a central device (i.e. base station, PDA, smart phone) for processing and storage, which then may be used for alarms upon detection of anomalies and clinical deterioration [2]. The use of PANs and WBANs has been extended to mon- itor individuals having chronic illnesses (i.e. cardiovascular, Alzheimer’s, Parkinson’s, Diabetes, Epilepsy) where these networks have enhanced the quality of life by providing mobility, while continuously collecting and relaying critical physiological data to their associated healthcare providers, e.g. long-term monitoring of patient recovery from surgical procedure after leaving the hospital. These types of Personal Area Networks (PAN), while extremely useful, are not without problems such as faulty measurements, hardware failure, and security issues. These networked small, lightweight wireless sensing devices also have additional drawbacks such as reduced computational power and limited capacity and energy resources. Sensor measurements from these networks are prone to a variety of other types of anomalies including environmental noise, constant faults resulting from bad sensor connections, energy depletion, badly placed sensors, malicious attacks through data injection, modification or replay attacks which may cascade and directly affect the collection point leading to unexpected results, faulty diagnosis, and a reduction in public trust of these systems. A non-invasive device called pulse oximeter, measures the amount of infrared light reflected by the photo-sensor, to 978-1-4673-3122-7/13/$31.00 ©2013 IEEE IEEE ICC 2013 - Selected Areas in Communications Symposium 4373
Transcript of Sensor Fault and Patient Anomaly Detection and ... · PDF fileIndex Terms—Wireless...

Sensor Fault and Patient Anomaly Detection andClassification in Medical Wireless Sensor Networks
Osman Salem, Alexey Guerassimovand Ahmed Mehaoua†
University of Paris Descartes – LIPADEDivision of ITCE, POSTECH, [email protected]
Anthony Marcus and Borko FurhtDepartment of Computer and Electrical
Engineering and Computer ScienceFlorida Atlantic University{amarcu10, bfurht}@fau.edu
Abstract—Wireless Sensor Networks are vulnerable to aplethora of different fault types and external attacks after theirdeployment. We focus on sensor networks used in healthcareapplications for vital sign collection from remotely monitoredpatients. These types of personal area networks must be robustand resilient to sensor failures as their capabilities encompasshighly critical systems. Our objective is to propose an anomalydetection algorithm for medical wireless sensor networks. Ourproposed approach firstly classifies instances of sensed patientattributes as normal and abnormal. Once we detect an abnormalinstance, we use regression prediction to discern between a faultysensor reading and a patient entering into a critical state. Ourexperimental results on real patient datasets show that ourproposed approach is able to quickly detect patient anomaliesand sensor faults with high detection accuracy while maintaininga low false alarm ratio.
Index Terms—Wireless Sensor Networks, Sensor Faults, Per-sonal Area Networks, healthcare and remote patient monitoring,sensor management and regression tool framework
I. INTRODUCTION
With current medical procedures and the healthy lifestylesof many, the average lifetime expectancy is ever increasing [1].Doctors are able to better diagnose and treat patients whilethe ability of individuals to cope and recover from illnessesis staggering. Technological advances incorporated with vastand accurate knowledge of the human anatomy have allowedhealthcare professionals the ability to handle almost any sce-nario they encounter in individuals at hospitals and emergencytreatment facilities [1], [2]. As the average individual lifetimeexpectancy has increased, this has also directly impactedour planets population and as such, a shortage of qualifiedhealthcare professionals to treat the sick and needy has becomean issue.
Scientists and researchers have developed numerous solu-tions to this problem, one of which allows patients to beremotely monitored utilizing networks of wireless sensorswhich relay, in real time, patient information to doctors andhealthcare providers. Advances in sensor technologies andhigh throughput networks continue to refine the accuracy andincrease the integrity and public trust of these systems. As adirect result, more individuals elect to utilize these systemsas they allow greater freedom and mobility while maintaining
† Visiting professor at CNRS LaBRI (France) research laboratory
the quality of care equivalent to direct medical interaction andattention found previously only in hospitals, clinics, and otherspecialized care facilities.
In medical applications, implementations of specializedWireless Sensor Networks (WSN), known as personal areanetworks (PAN) and wireless body area networks (WBAN),are comprised of numerous small devices attached to orimplanted in the body of a patient. In current days, manyexisting medical wireless devices are used to collect variouspatient metrics and vital signs, such as Heart Rate (HR), pulse,oxygen saturation (SpO2), Respiration Rate (RR), Body Tem-perature (BT), ElectroCardioGram (ECG), ElectroMyoGram(EMG), Blood Pressure (BP), Blood Glucose Levels (BGL)and Galvanic Skin Response (GSR).
These networked sensors accumulate and transmit collecteddata to a central device (i.e. base station, PDA, smart phone)for processing and storage, which then may be used for alarmsupon detection of anomalies and clinical deterioration [2].The use of PANs and WBANs has been extended to mon-itor individuals having chronic illnesses (i.e. cardiovascular,Alzheimer’s, Parkinson’s, Diabetes, Epilepsy) where thesenetworks have enhanced the quality of life by providingmobility, while continuously collecting and relaying criticalphysiological data to their associated healthcare providers,e.g. long-term monitoring of patient recovery from surgicalprocedure after leaving the hospital.
These types of Personal Area Networks (PAN), whileextremely useful, are not without problems such as faultymeasurements, hardware failure, and security issues. Thesenetworked small, lightweight wireless sensing devices alsohave additional drawbacks such as reduced computationalpower and limited capacity and energy resources. Sensormeasurements from these networks are prone to a varietyof other types of anomalies including environmental noise,constant faults resulting from bad sensor connections, energydepletion, badly placed sensors, malicious attacks through datainjection, modification or replay attacks which may cascadeand directly affect the collection point leading to unexpectedresults, faulty diagnosis, and a reduction in public trust of thesesystems.
A non-invasive device called pulse oximeter, measures theamount of infrared light reflected by the photo-sensor, to
978-1-4673-3122-7/13/$31.00 ©2013 IEEE
IEEE ICC 2013 - Selected Areas in Communications Symposium
4373

measure SpO2 and pulse. This device provides informationabout cardiovascular system (asphyxia, hypoxia or insufficientoxygen and pneumonia). Normal SpO2 ratio is larger than95%. When this ratio is lower than 90%, an emergency alarmmust be triggered due to lung problems or respiratory failure.
An improperly attached device or an external fluorescentlight may cause inaccurate reading. In [3], the authors foundthat the sensing components were the first source of unreli-ability in medical WSNs, not networking issues. Abnormalvalues may be resulted from many reasons in WSNs, suchas hardware faults, corrupted sensors, energy depletion, cal-ibration, electromagnetic interference, disrupted connectivity,compromised sensors, data injection, patient with sweating,detached sensor, heart attacks or health degradation, etc.
Faulty measurements from sensors negatively influence themeasured results and lead to diagnosis errors. Furthermore,they may threaten the life of a patient after alerting emer-gency personnel for code blue. Therefore, an important taskis to detect abnormal measurements that deviate from otherobservations, and to distinguish between sensor faults andemergency situation to reduce false alarms.
Over time, these networks accumulate vast amounts ofhistorical data about an individual. Due to the enormity ofinformation, it often becomes difficult to observe and extractsensor metric correlations and to distinguish between a patiententering a critical state and faulty hardware. Therefore, ananomaly detection mechanism is required to identify abnormalpatterns and to detect faulty data.
In contrast to signature based intrusion detection systems,where signatures are required to detect attacks, anomaly basedsystems [4] look for unexpected patterns in data measurementsreceived from sensors. The abnormal pattern is a deviationfrom a dynamically updated normal model for sensed data, andis more adequate for WSNs given the lack of attack signatures.It is also important to note that anomaly based systems facechallenges related to the training phase as it is difficult to findnormal data to establish an appropriate normal profile.
In this paper, we focus on anomaly detection in medicalwireless sensor readings, and we propose a new approachbased on machine learning algorithms to detect abnormalvalues. First we use J48 [5] decision tree algorithm to de-tect abnormal records, and when detected, we apply linearregression [6] to pinpoint abnormal sensor measurements in anabnormal record. However, physiological attributes are heavilycorrelated, and changes occur typically in at least two or moreparameters, e.g. in Atrial Fibrillation (AF) & Asthma disease,the heart rate and respiration ratio increase simultaneously.
Our proposed solution is intended to provide reliability inmedical WSNs used for continuous patient monitoring, wherewe detect anomalies in a patient’s health, and differentiatebetween the individual entering a critical health state and faultyreadings (or sensor hardware). We seek to reduce the falsealarm rate triggered by inconsistent sensors readings.
The rest of this paper is organized as follows. In section II,we review related work on anomaly detection and machinelearning algorithms used in medical WSN. Section III de-
scribes briefly linear regression and decision tree algorithm(J48) used in our detection system. The proposed approach isexplained in section IV. In section V, we present our resultsfrom experimental evaluation, where we conduct performanceanalysis of the proposed solution over medical dataset. Finally,we conclude the paper in section VI.
II. RELATED WORK
WSNs are becoming a major center of interest as theyprovide many viable solutions to avoid unnecessary casu-alties in many fields such as military, civil protection ormedicine. Various vital sign monitoring systems have beenproposed, developed and deployed, such as MEDiSN [7] &CodeBlue [8], [9] for monitoring HR, ECG, SpO2 and pulse,LifeGuard [10] for ECG, respiration, pulse oximeter & BP,AlarmNet [11] & Medical MoteCare [12] for physiological(pulse & SpO2) & environmental parameters (temperature& light), Vital Jacket [13] for ECG & HR. A survey ofmedical applications using WSNs is available in [14], [15].Many approaches for anomaly detection in WSNs have beenproposed to detect abnormal deviation in collected data, and toremove faulty sensor measurements. Authors in [16] proposean algorithm for the identification of faulty sensors usingthe minimum and the maximum values of the monitoredparameters. Any received measurement outside the [min-max]interval is considered an outlier or inconsistent data. In medicalapplications, we can not assume that all patients will have thesame attribute interval ranges as the min-max values dependon sex, age, weight, height, health condition, etc.
Authors in [17] propose a hierarchical (cluster based) algo-rithm to detect outliers from compromised or malicious sen-sors. The proposed method is based on transmission frequency,and KNN distance between received values from differentsensors. However, it is impractical in medical applications toput redundant sensors for monitoring the same parameters.A simple prediction and fault detection method for WSNswas proposed in [18]. The proposed algorithm is based onthe detection of deviation between reference and the measuredtime series. The proposed approach uses a predefined thresholdand has been evaluated on 3 types of faults: short time, longtime and constant fault.
Authors in [19] explore four classes of methods for fault de-tection: rule-based, estimation-based, time series analysis, andlearning based methods. They investigate fixed and dynamicthreshold, linear least squares estimation, Auto RegressiveIntegrated Moving Average (ARIMA), Hidden Markov Model(HMM), etc. The authors found no best class of detectionmethods suitable for every type of anomaly.
Data mining techniques and machine learning algorithmshave also used in WSNs to detect anomalies in multidi-mensional data. For example, Naıve Bayes [20], Bayesiannetwork [21], Support Vector Machine (SVM [22]), Self-Organizing Map (SOM [23]) which is based on neural net-works.
Authors in [24] propose the use of logistic regressionmodeling with a static threshold to evaluate the reliability of
4374
a WSN in the industrial field with a large number of sensors,and without updating the training model to be able to identifythe cause of a potential loss of reliability. On the same scaleof large sensor networks, authors in [5] propose a diagnosismethod based on the enhanced C4.5 (J48 or decision treealgorithm) which merges the local classifiers into a largespanning tree to answer for the whole network accuracy.Another type of WSN deployment is presented in [20], whichshows how to monitor the physical activity of a person usingSun SpOT sensors attached to the thighs. Authors use naıveBayes based machine learning algorithm to determine if theperson is sitting, standing, lying or walking. However, theydo not take in consideration that the values can be corrupteddue to faulty hardware. Similarly, the authors in [25] presenta system capable of discerning between mental stress statesfrom relaxation states using logistic regression based on theheart rate variability.
In this paper, we will use decision tree (J48) and linearregression algorithms to detect abnormal record and to pin-point abnormal sensors reading. J48 is used to classify recordsand to reduce temporal complexity, and linear regression isused to predict current values. As physiological parametersare correlated, if only one monitored attribute deviates fromestimated value, we classify the reading as faulty and performdata cleaning, and in the other cases, we trigger an alarm forpatients entering into a critical state.
III. BACKGROUND
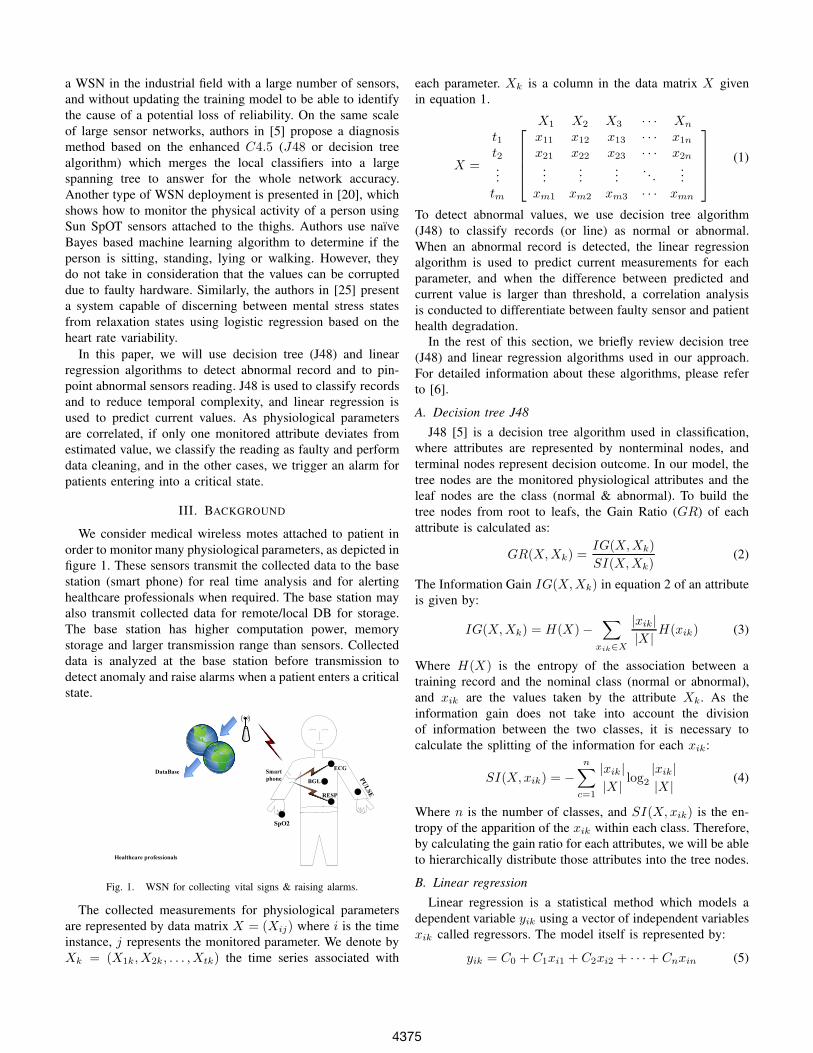
We consider medical wireless motes attached to patient inorder to monitor many physiological parameters, as depicted infigure 1. These sensors transmit the collected data to the basestation (smart phone) for real time analysis and for alertinghealthcare professionals when required. The base station mayalso transmit collected data for remote/local DB for storage.The base station has higher computation power, memorystorage and larger transmission range than sensors. Collecteddata is analyzed at the base station before transmission todetect anomaly and raise alarms when a patient enters a criticalstate.
SpO2
Smart
phone
ECG
DataBase
Healthcare professionals
RESP
BGL
PULSE
Fig. 1. WSN for collecting vital signs & raising alarms.
The collected measurements for physiological parametersare represented by data matrix X = (Xij) where i is the timeinstance, j represents the monitored parameter. We denote byXk = (X1k, X2k, . . . , Xtk) the time series associated with
each parameter. Xk is a column in the data matrix X givenin equation 1.
X1 X2 X3 · · · Xn
X =
t1t2...tm
⎡⎢⎢⎢⎣
x11 x12 x13 · · · x1n
x21 x22 x23 · · · x2n
......
.... . .
...xm1 xm2 xm3 · · · xmn
⎤⎥⎥⎥⎦
(1)
To detect abnormal values, we use decision tree algorithm(J48) to classify records (or line) as normal or abnormal.When an abnormal record is detected, the linear regressionalgorithm is used to predict current measurements for eachparameter, and when the difference between predicted andcurrent value is larger than threshold, a correlation analysisis conducted to differentiate between faulty sensor and patienthealth degradation.
In the rest of this section, we briefly review decision tree(J48) and linear regression algorithms used in our approach.For detailed information about these algorithms, please referto [6].
A. Decision tree J48
J48 [5] is a decision tree algorithm used in classification,where attributes are represented by nonterminal nodes, andterminal nodes represent decision outcome. In our model, thetree nodes are the monitored physiological attributes and theleaf nodes are the class (normal & abnormal). To build thetree nodes from root to leafs, the Gain Ratio (GR) of eachattribute is calculated as:
GR(X,Xk) =IG(X,Xk)
SI(X,Xk)(2)
The Information Gain IG(X,Xk) in equation 2 of an attributeis given by:
IG(X,Xk) = H(X)−∑
xik∈X
|xik|
|X |H(xik) (3)
Where H(X) is the entropy of the association between atraining record and the nominal class (normal or abnormal),and xik are the values taken by the attribute Xk. As theinformation gain does not take into account the divisionof information between the two classes, it is necessary tocalculate the splitting of the information for each xik:
SI(X, xik) = −
n∑c=1
|xik|
|X |log
2
|xik|
|X |(4)
Where n is the number of classes, and SI(X, xik) is the en-tropy of the apparition of the xik within each class. Therefore,by calculating the gain ratio for each attributes, we will be ableto hierarchically distribute those attributes into the tree nodes.
B. Linear regression
Linear regression is a statistical method which models adependent variable yik using a vector of independent variablesxik called regressors. The model itself is represented by:
yik = C0 + C1xi1 + C2xi2 + · · ·+ Cnxin (5)
4375

Where yik is the dependent variable in instance i, xik arethe regressors and Cn are the coefficients of the regressors(weights). These coefficients are calculated in the trainingphase as the covariance of Xk and Yk is divided by thevariance of Xk.
Ck =Cov(Xk, Yk)
V ar(Xk)=
∑(xik − Xk
) (yik − Yk
)∑
(xik − Xk)(6)
The linear regression is used to predict the value of yik byusing other attributes in the same instance xij|j �=k , and tocompare the predicted (yik) with the actual value of xik tofind if it fits within a small margin of error.
IV. PROPOSED APPROACH
We consider a general scenario for remote patient monitor-ing, as shown in figure 1, where many wireless motes witha restricted resources are used to collect data, and a portablecollection device (e.g. smart phone) with higher resources andhigher transmission capabilities than motes, is used to analyzecollected data, and to raise alarms for emergency team whenabnormal patterns are detected. We seek to detect abnormalvalues, in order to reduce false alarms resulted from faultymeasurements, while differentiating faults from patient healthdegradation.
The proposed approach is based on decision tree and linearregression. It builds a decision tree and looks for linear coeffi-cients from normal vital signs that fall inside restricted intervalrange of monitored attributes. In the rest of this paper, wefocus only on the following vital signs: HR ∈ [80−120], pulse∈ [80− 120], respiration rate ∈ [12− 30], SpO2 ∈ [90− 100],T◦ ∈ [36.5 − 37.5]. Attributes values that fall outside these(restricted) normal intervals are considered abnormal. HR andpulse reflect the same attribute from different sensors, wherepulse is obtained from the pulse oximeter and HR is measuredas the number of interbeat intervals (R-R) in ECG signal.
Algorithm 1 Detection Algorithm1: for each received record Ri during T do2: Classify Ri using J48;3: if Class(Ri) == 'ABNORMAL' then4: for each xik do5: xik =
∑n
j=1,j �=k Cjxij
6: ctr+ = (|xik − xik| ≥ 0.1 ∗ xik) ? 1 : 07: end for8: if ctr ≥ 2 then9: Raise alarm for healthcare;
10: end if11: end if12: end for
Equation 7 shows the residual threshold used to detectabnormal measurement:
ei = |xik − xik| ≥ 0.1 ∗ xik (7)
The proposed approach is based on two phases: training anddetection. In the training phase, machine learning methods
generate a model to classify data, and in the testing phase,inputs are classified as abnormal if they deviate from estab-lished model. The J48 decision tree model (built using trainingdata within restricted intervals) is used in our approach toclassify each received record as normal or abnormal. In ourexperiments, the decision tree was the most efficient classi-fication algorithm. The tree model is a set of rules (if-then)which is inexpensive to build, robust, and fast in processingas it is based on numerical comparisons for classification.Furthermore, abnormal instances detected by J48 will onlytrigger the forecasting with linear regression, and this is whywe use restricted small intervals for monitored attributes in thetraining phase.
If a record is classified as abnormal by J48, we recursivelyassume that an attribute (xik) is missing, and the coefficientsof linear regression are used to estimate the current value forthis attribute (xik) with respect to the others (xij|j �=k), as givenin equation 8 for heart rate estimation:
ˆHRi = C0 + C1Pulsei + C2RESPi + · · ·+ C5Ti (8)
If the Euclidian distance between current (HRi) and estimated( ˆHRi) values is larger than the predefined threshold (10% ofestimated value) for only one attribute, the measurement isconsidered faulty and replaced by estimated value with linearregression. However, if at least two readings are higher thanthe threshold, we trigger an alarm for response caregiver emer-gency team to react, e.g. heavy changes in the HR & reducedrate of SpO2 are symptoms of patient health degradation andrequires immediate medical intervention. We assume that theprobability of many attributes (2 in our experiments) beingfaulty is very low.
The J48 is used to reduce the computation complexity, andto prevent the estimation of each attribute for each instanceon the base station. J48 is based on few comparisons forclassification, and the combination of both approach for faultdetection and classification is used. Sliding window is not usedin our experiments to reduce the complexity. When the modelis well specified with the training data, updating or rebuildingthe model requires additional complexity (temporal & spatial)without large impact on the performance.
V. EXPERIMENTAL RESULTS
In this section, we present the performance analysis resultsof the proposed approach for anomaly detection in medicalWSN. Afterward, we conduct analysis to study the impact ofdecision threshold on true positive and false alarm ratio. Weused real medical dataset from the Physionet database [26],which contains 30392 records, and each record contains 12attributes (ABPmean, ABPsys, ABPdias, C.O., HR, PAPmean,PAPsys, PAPdias, PULSE, RESP, SpO2, T◦). We only focuson 5 attributes: HR, PULSE, RESP, SpO2 & T◦. The variationsof Heart Rate (in beat per minute - bpm), Pulse and Respirationrate are presented in figure 2. Figure 3 shows the variations ofSpO2 (oxygenation ratio) and the body temperature (constantvalue: 37◦C).
4376

0.5 1 1.5 2 2.5 3
x 104
0
20
40
60
80
100
120
140
160
180
Time
HRPULSERESP
Fig. 2. Heart rate, pulse & respiration rate
0.5 1 1.5 2 2.5 3
x 104
0
20
40
60
80
100
120
140
160
180
Time
SpO2Temp
Fig. 3. Oxygenation ratio & body Temperature
0.5 1 1.5 2 2.5 3
x 104
0
20
40
60
80
100
120
140
160
180
Time
bpm
Act HRPred HR (LinReg)Error
Fig. 4. Linear regression classifier
0.5 1 1.5 2 2.5 3
x 104
0
20
40
60
80
100
120
140
160
180
Time
bpm
Act HRPred HR (AddReg)Error
Fig. 5. Additive regression classifier
0.5 1 1.5 2 2.5 3
x 104
0
20
40
60
80
100
120
140
160
180
Time
bpm
Act HRPredicted HR (K−NN)Error
Fig. 6. KNN classifier (k=3)
0.5 1 1.5 2 2.5 3
x 104
0
20
40
60
80
100
120
140
160
180
Time
bpm
Act HRPred HR (DecTbl)Error
Fig. 7. Decision table classifier
Figure 4 shows the actual, predicted and difference betweenactual and predicted values (error) for HR with linear regres-sion. To test the efficiency of the used algorithms, we comparethe results (actual, predicted & error) with different classifiersthough the use of WEKA [27] tool: Decision Table, AdditiveRegression & KNN for K = 3.
Figure 5 shows the results with additive regression tree,where the error is higher than linear regression. Figure 6 showsthe results for KNN which is more computationally expensiveand has an error higher than additive regression. Figure 7shows the results of the decision table classifier, which had theworst results of all these classifiers. Figure 8 shows the meanabsolute error for each of these classifiers, where decisiontable achieves the prediction with the highest mean error rate,followed in descending order by KNN, additive and linearRegression. Linear regression had the lowest error percentageand the best overall performance out of the three classifiers,which is why we use this classifier in the rest of this paper.
Figure 9 shows the raised alarms by our proposed approach.The first alarm is raised when reported values for pulse andSpO2 are abnormal in the same instant (both attributes aremeasured by the same sensor). The second alarm is triggeredby the abnormal values of the HR attribute. These abnormalvalues are visible in figures 4 & 5 when correspondingattributes suddenly fluctuate or decrease to zero.
To evaluate the performance of the proposed approach, weused the ROC (Receiver Operating Characteristic) to show therelationship between the true positive rate (Eq. 9) and the false
positive rate (Eq. 10).
TPR =TP
TP + FN(9)
Where TP is the number of true positives, and FP is thenumber of false positives. The false positive rate (FPR) isdefined as :
FPR =FP
FP + TN(10)
The ROC curve is used for accuracy analysis when varying thevalue of the decision threshold. In general, a good detectionalgorithm must achieve a high detection ratio with the lowestfalse alarm rate. Figure 10 shows the ROC for the proposedapproach where the first nominal classifier is J48, Logisticregression, NaıveBayes & Decision Table respectively. TheJ48 classifier achieves the best performance with TPR=100%and FPR=7.4%. These results demonstrate that our proposedapproach can achieve very good accuracy for detecting motesanomalies.
VI. CONCLUSION AND PERSPECTIVES
In this paper, we proposed a new framework which in-tegrates decision tree and linear regression for anomaly de-tection in medical WSNs. The proposed approach achievesboth spatial and temporal analysis for anomaly detection. Wehave evaluated our approach on real medical data set withmany (real and synthetic) anomalies. Our experimental resultsdemonstrated the ability of the proposed approach to achievelow false alarm rate with a high detection accuracy.
4377

LinReg AddReg K−NN DecTable0
1
2
3
4
5M
ean
erro
r (%
)
Fig. 8. Mean error rate with # classifiers
0.5 1 1.5 2 2.5 3
x 104
0
20
40
60
80
100
120
140
160
180
Time
bpm
HRPULSEAlarms
Fig. 9. Raised alarms
0 0.2 0.4 0.6 0.8 10
0.2
0.4
0.6
0.8
1
False Positive Rate
Tru
e P
ositi
ve R
ate
J48LogisticNaïveBayesDecTbl
Fig. 10. ROC
We are currently investigating the performance of the pro-posed approach on real medical wireless sensor traffic usingShimmer platinum development kit [28].
VII. ACKNOWLEDGMENTS
This research was supported by Korea Science and Engi-neering Foundation, under the World Class University (WCU)program.
REFERENCES
[1] P. Kumar and H.-J. Lee, “Security Issues in Healthcare ApplicationsUsing Wireless Medical Sensor Networks: A Survey,” Sensors, vol. 12,no. 1, pp. 55–91, 2012.
[2] J. Ko, C. Lu, M. B. Srivastava, J. A. Stankovic, A. Terzis, and M. Welsh,“Wireless Sensor Networks for Healthcare,” Proceedings of the IEEE,vol. 98, no. 11, pp. 1947–1960, 2010.
[3] O. Chipara, C. Lu, T. C. Bailey, and G.-C. Roman, “Reliable ClinicalMonitoring using Wireless Sensor Networks: Experiences in a Step-down Hospital Unit,” in Proceedings of the 8th ACM Conference onEmbedded Networked Sensor Systems (SenSys’10), 2010, pp. 155–168.
[4] R. Jurdak, X. R. Wang, O. Obst, and P. Valencia, Wireless SensorNetwork Anomalies: Diagnosis and Detection Strategies. Springer,2011, vol. 10, ch. 12, pp. 309–325.
[5] X. Cheng, J. Xu, J. Pei, and J. Liu, “Hierarchical distributed dataclassification in wireless sensor networks,” Computer Communications,vol. 33, no. 12, pp. 1404–1413, 2010.
[6] I. H. Witten, E. Frank, and M. A. Hall, Data Mining: Practical MachineLearning Tools and Techniques (Third Edition). Morgan KaufmannPublishers Inc., 2011.
[7] J. Ko, J. H. Lim, Y. Chen, R. Musvaloiu-E, A. Terzis, G. M. Masson,T. Gao, W. Destler, L. Selavo, and R. P. Dutton, “Medisn: Medical emer-gency detection in sensor networks,” ACM Transactions on EmbeddedComputing Systems (TECS), vol. 10, no. 1, pp. 1–29, 2010.
[8] D. Malan, T. Fulford-jones, M. Welsh, and S. Moulton, “CodeBlue: AnAd Hoc Sensor Network Infrastructure for Emergency Medical Care,”in Proceedings of International Workshop on Wearable and ImplantableBody Sensor Networks, 2004.
[9] “CodeBlue: Wireless Sensors for Medical Care,”http://fiji.eecs.harvard.edu/CodeBlue, Last visited 2012.
[10] K. Montgomery, C. Mundt, G. Thonier, A. Thonier, U. Udoh, V. Barker,R. Ricks, L. Giovangrandi, P. Davies, Y. Cagle, J. Swain, J. Hines, andG. Kovacs, “Lifeguard – A personal physiological monitor for extremeenvironments,” in Proceedings of the IEEE 26th Annual InternationalConference on Engineering in Medicine and Biology Society, 2004, pp.2192–2195.
[11] A. Wood, G. Virone, T. Doan, Q. Cao, L. Selavo, Y. Wu, L. Fang, Z. He,S. Lin, and J. Stankovic, “ALARM-NET: Wireless sensor networks forassisted-living and residential monitoring,” University of Virginia, Tech.Rep., 2006.
[12] K. F. Navarro, E. Lawrence, and B. Lim, “Medical MoteCare:A Distributed Personal Healthcare Monitoring System,” in Proc.eTELEMED’09, 2009, pp. 25–30.
[13] J. P. S. Cunha, B. Cunha, A. S. Pereira, W. Xavier, N. Ferreira, andL. Meireles, “Vital-Jacket® : A wearable wireless vital signs monitor forpatients’ mobility in cardiology and sports,” in International Conferenceon Pervasive Computing Technologies for Healthcare, PervasiveHealth,2010.
[14] K. Grgic, D. Zagar, and V. Krizanovic, “Medical applications of wirelesssensor networks – current status and future directions,” MedicinskiGlasnik, vol. 9, no. 1, pp. 23–31, 2012.
[15] H. Alemdar and C. Ersoy, “Wireless sensor networks for healthcare: Asurvey,” Computer Networks, vol. 54, no. 15, pp. 2688–2710, 2010.
[16] T. Banerjee, B. Xie, and D. P. Agrawal, “Fault tolerant multipleevent detection in a wireless sensor network,” Journal of Parallel andDistributed Computing, vol. 68, no. 9, pp. 1222–1234, 2008.
[17] Y. Zhang, H.-C. Chao, M. Chen, L. Shu, C. hyun Park, and M.-S. Park,“Outlier Detection and Countermeasure for Hierarchical Wireless SensorNetworks,” IET Information Security, 2009.
[18] Y. Yao, A. Sharma, L. Golubchik, and R. Govindan, “Online AnomalyDetection for Sensor Systems: a Simple and Efficient Approach,”Performance Evaluation, vol. 67, no. 11, pp. 1059–1075, 2010.
[19] A. B. Sharma, L. Golubchik, and R. Govindan, “Sensor Faults: DetectionMethods and Prevalence in Real-World Datasets,” ACM Transactions onSensor Networks, vol. 6, no. 3, pp. 1–39, 2010.
[20] X. Yang, A. Dinh, and L. Chen, “Implementation of a WearerableReal-Time System for Physical Activity Recognition based on NaıveBayes Classifier,” in International Conference on Bioinformatics andBiomedical Technology (ICBBT’10), 2010.
[21] A. Farruggia, L. R. Giuseppe, and M. Ortolani, “Probabilistic AnomalyDetection for Wireless Sensor Networks,” in Proceedings of the 12thinternational conference on Artificial intelligence around man andbeyond, 2011, pp. 438–444.
[22] A. S. Raghuvanshi, R. Tripathi, and S. Tiwari, “Machine Learning Ap-proach for Anomaly Detection in Wireless Sensor Data,” InternationalJournal of Advances in Engineering & Technology, vol. 1, no. 4, pp.47–61, 2011.
[23] S. Siripanadorn, W. Hattagam, and N. Teaumroong, “Anomaly Detectionin Wireless Sensor Networks using Self-Organizing Map and Wavelets,”International Journal of Communications, vol. 4, no. 3, pp. 74–83, 2010.
[24] F. Huang, Z. Jiang, S. Zhang, and S. Gao, “Reliability Evaluation ofWireless Sensor Networks Using Logistic Regression,” in Proceedingsof the 2010 International Conference on Communications and MobileComputing (CMC’10), 2010, pp. 334–338.
[25] J. Choi, B. Ahmed, and R. Gutierrez-Osuna, “Developpement and Eval-uation of an Ambulatory Stress Monitor Based on Wearable Sensors,”IEEE Transaction and Information Technology in Biomedicine, vol. 16,no. 2, pp. 279–286, 2012.
[26] “Physionet,” http://www.physionet.org/cgi-bin/atm/ATM.[27] “Weka data mining tool,” http://www.cs.waikato.ac.nz/~ml/weka/.[28] A. Burns, B. R. Greene, M. J. McGrath, T. J. O’Shea, B. Kuris, S. M.
Ayer, F. Stroiescu, and V. Cionca, “SHIMMER™– A Wireless SensorPlatform for Noninvasive Biomedical Research,” IEEE Sensor Journal,vol. 10, no. 9, pp. 1527–1534, 2010.
4378