Sensor Failure Detection in Road Tunnel...
16
Sensor Failure Detection in Road Tunnel Ventilation April 24, 2012 by Nakahori, I, Sakaguchi, T., Mitani, A., and Vardy, A. E. Sohatsu Systems Laboratory Inc. University of Dundee
Transcript of Sensor Failure Detection in Road Tunnel...
Sensor Failure Detection in Road Tunnel Ventilation
April 24, 2012by
Nakahori, I, Sakaguchi, T., Mitani, A., and Vardy, A. E.Sohatsu Systems Laboratory Inc. University of Dundee
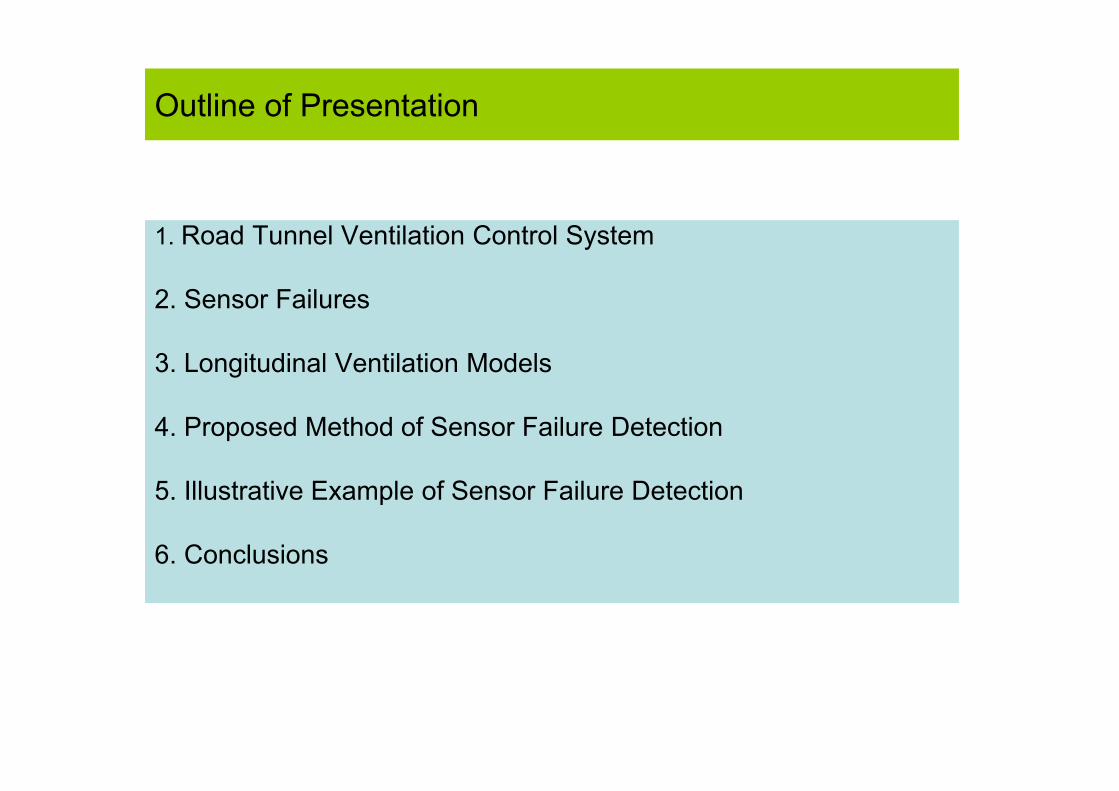
Outline of Presentation
1. Road Tunnel Ventilation Control System
2. Sensor Failures
3. Longitudinal Ventilation Models
4. Proposed Method of Sensor Failure Detection
5. Illustrative Example of Sensor Failure Detection
6. Conclusions
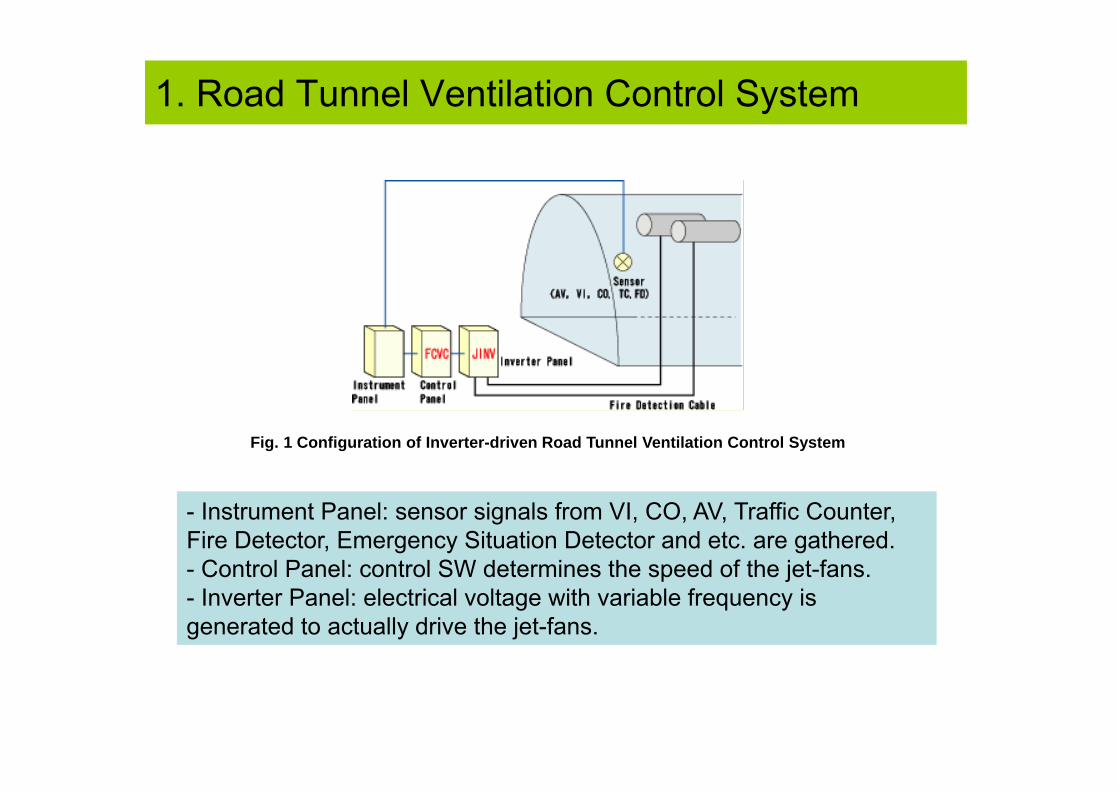
1. Road Tunnel Ventilation Control System
Fig. 1 Configuration of Inverter-driven Road Tunnel Ventilation Control System
- Instrument Panel: sensor signals from VI, CO, AV, Traffic Counter, Fire Detector, Emergency Situation Detector and etc. are gathered.- Control Panel: control SW determines the speed of the jet-fans. - Inverter Panel: electrical voltage with variable frequency is generated to actually drive the jet-fans.
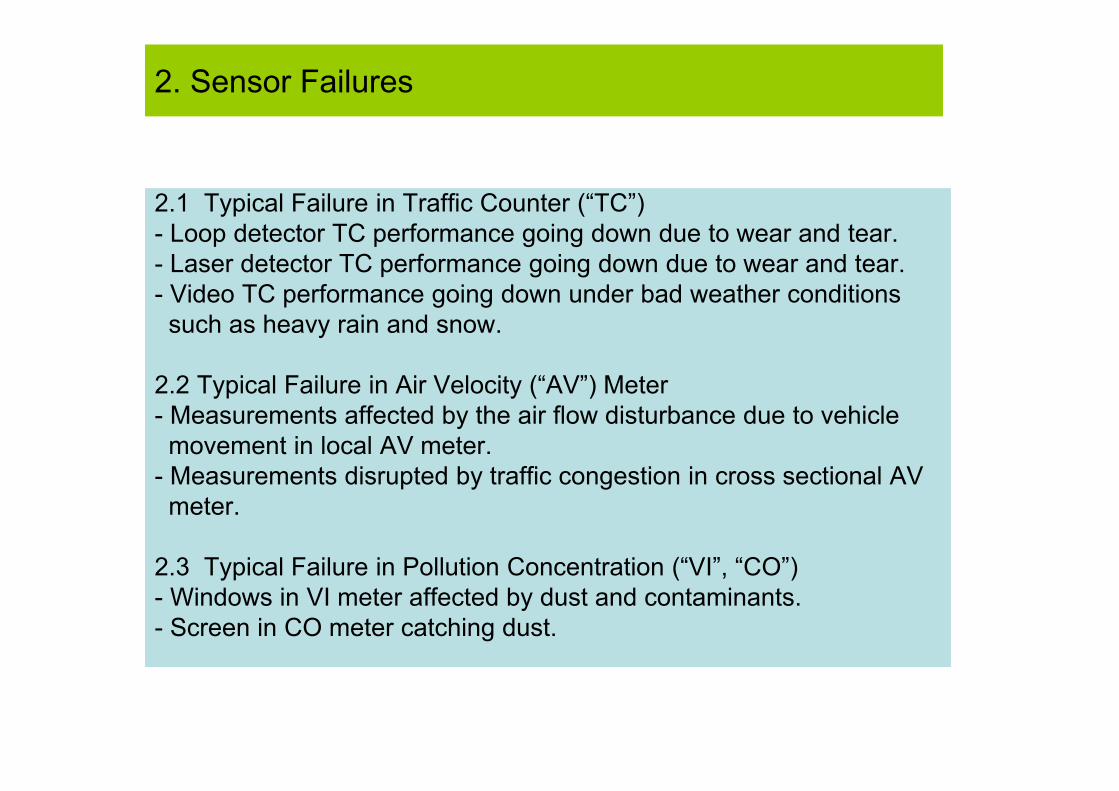
2. Sensor Failures
2.1 Typical Failure in Traffic Counter (“TC”)- Loop detector TC performance going down due to wear and tear.- Laser detector TC performance going down due to wear and tear.- Video TC performance going down under bad weather conditionssuch as heavy rain and snow.
2.2 Typical Failure in Air Velocity (“AV”) Meter- Measurements affected by the air flow disturbance due to vehiclemovement in local AV meter.
- Measurements disrupted by traffic congestion in cross sectional AVmeter.
2.3 Typical Failure in Pollution Concentration (“VI”, “CO”)- Windows in VI meter affected by dust and contaminants.- Screen in CO meter catching dust.
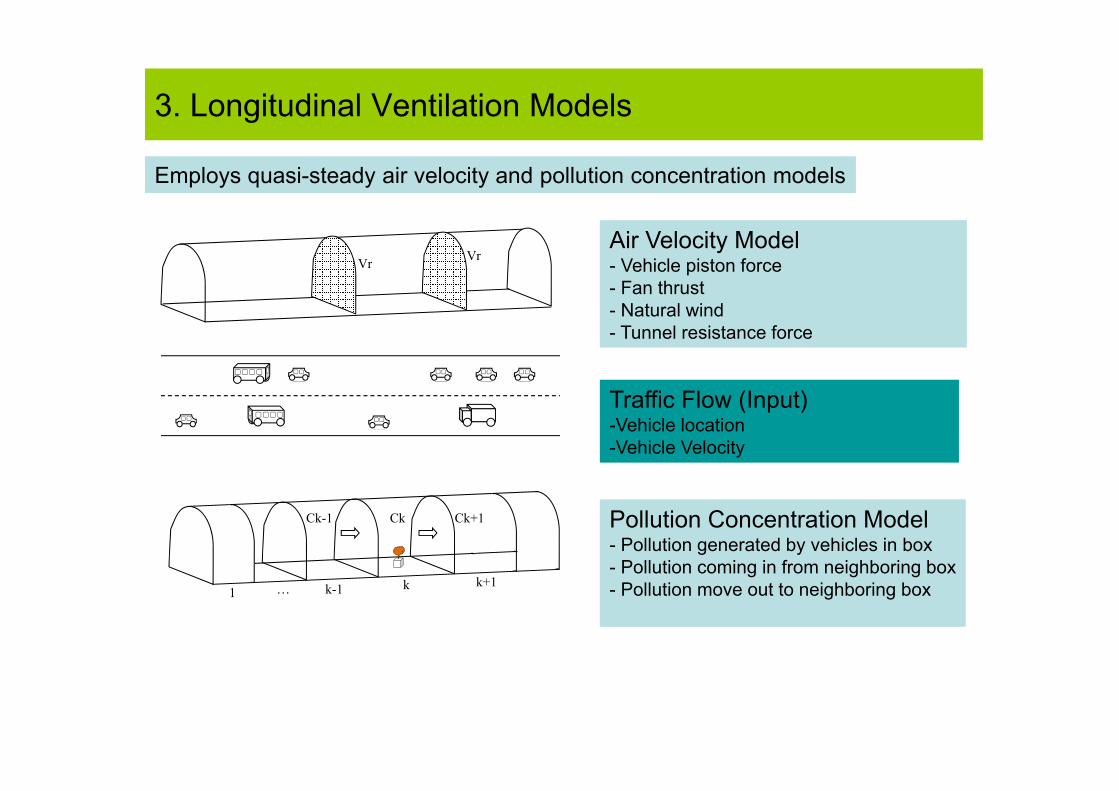
3. Longitudinal Ventilation Models
Vr Vr
Ck-1 Ck Ck+1
1 k-1 k k+1…
Air Velocity Model- Vehicle piston force- Fan thrust- Natural wind- Tunnel resistance force
Pollution Concentration Model- Pollution generated by vehicles in box- Pollution coming in from neighboring box- Pollution move out to neighboring box
Traffic Flow (Input)-Vehicle location-Vehicle Velocity
Employs quasi-steady air velocity and pollution concentration models
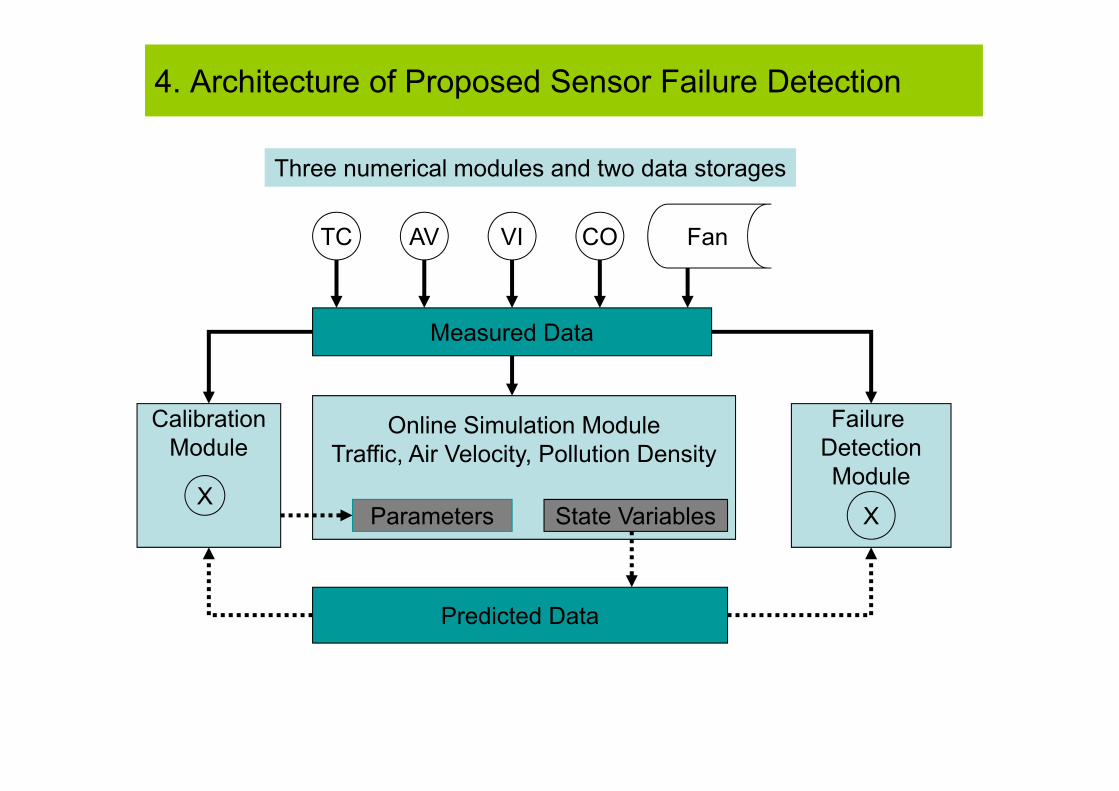
4. Architecture of Proposed Sensor Failure Detection
TC AV VI CO
Measured Data
Predicted Data
Online Simulation ModuleTraffic, Air Velocity, Pollution Density
Parameters State Variables
CalibrationModule
Failure DetectionModule
XX
Fan
Three numerical modules and two data storages

4.1 Calibration
JET FANS
Effective Resistance Area of Large& Small Vehicles
Pollution Gas Emission ofLarge & Small Vehicles
ATL, ATS
μL, μS
Objective is to revise the parameter values that best fit the measured data set
Calibration processprovides quantitative statistical data about deviation of measured and predicted values.
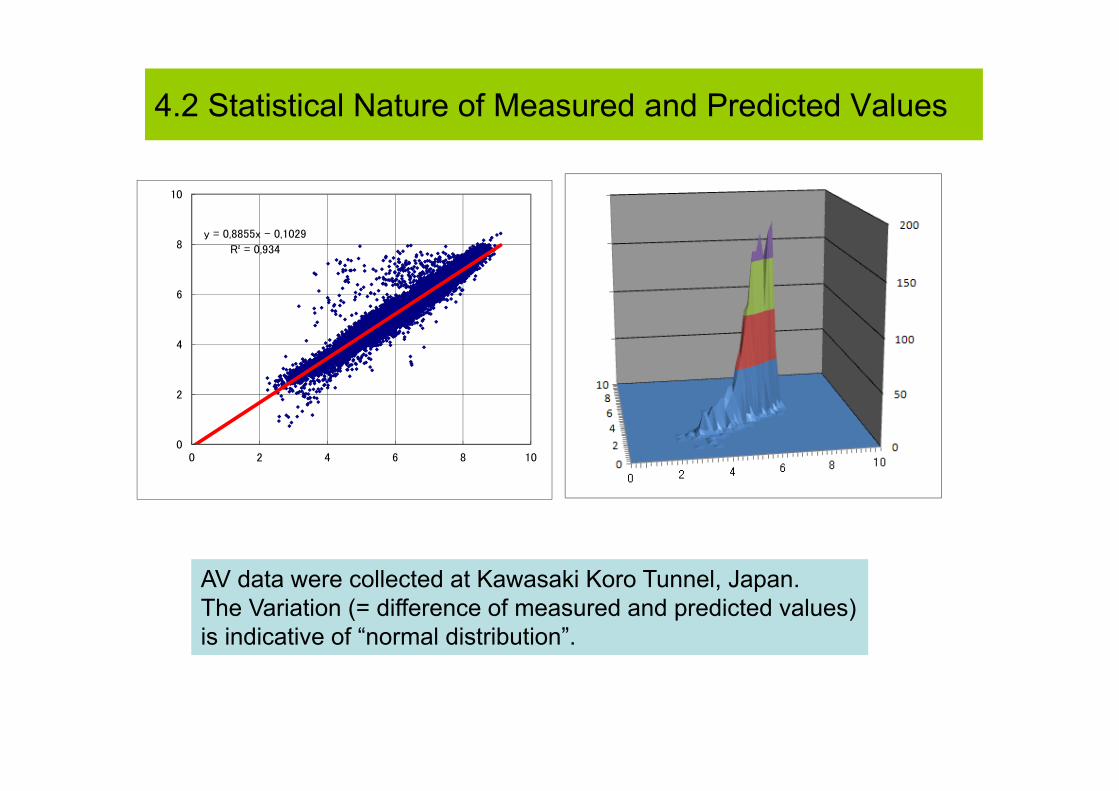
4.2 Statistical Nature of Measured and Predicted Values
AV data were collected at Kawasaki Koro Tunnel, Japan.The Variation (= difference of measured and predicted values)is indicative of “normal distribution”.
AV predicted value m/s
AV measured value m
/s
y = 0,8855x - 0,1029
R² = 0,934
0
2
4
6
8
10
0 2 4 6 8 10
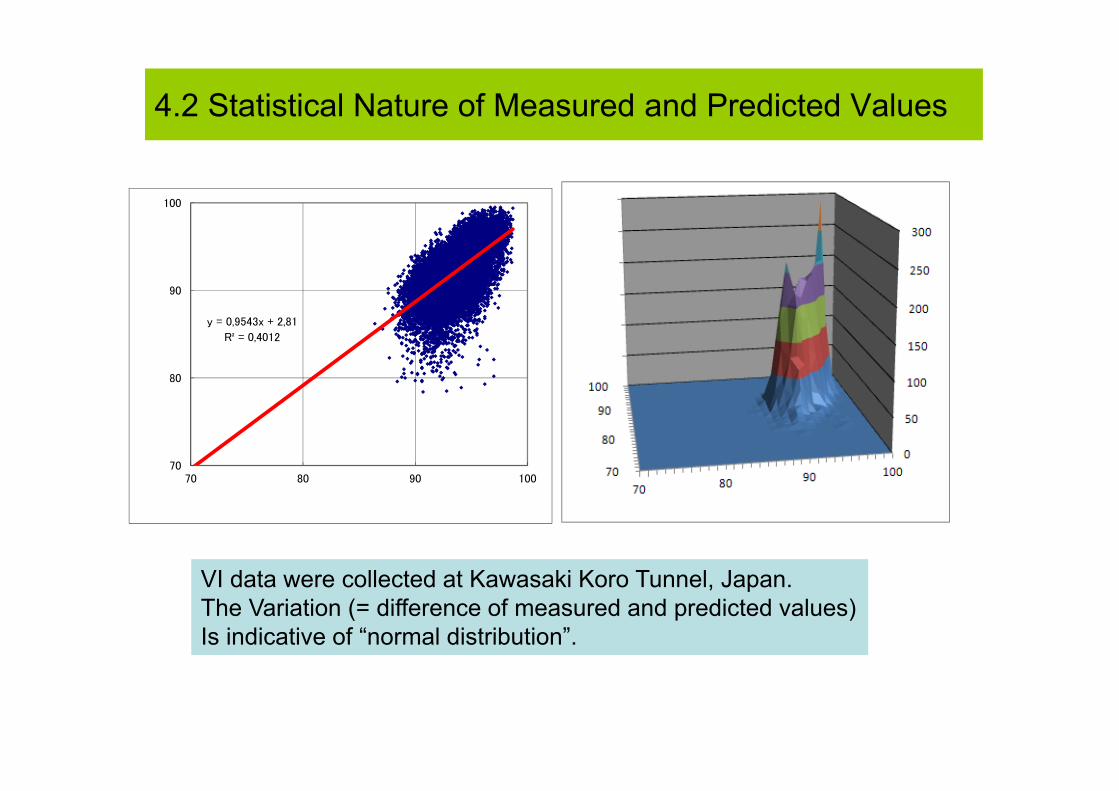
4.2 Statistical Nature of Measured and Predicted Values
VI data were collected at Kawasaki Koro Tunnel, Japan.The Variation (= difference of measured and predicted values)Is indicative of “normal distribution”.
VI m
easured value g/kg-air
VI predicted value g/kg-air
y = 0,9543x + 2,81
R² = 0,4012
70
80
90
100
70 80 90 100
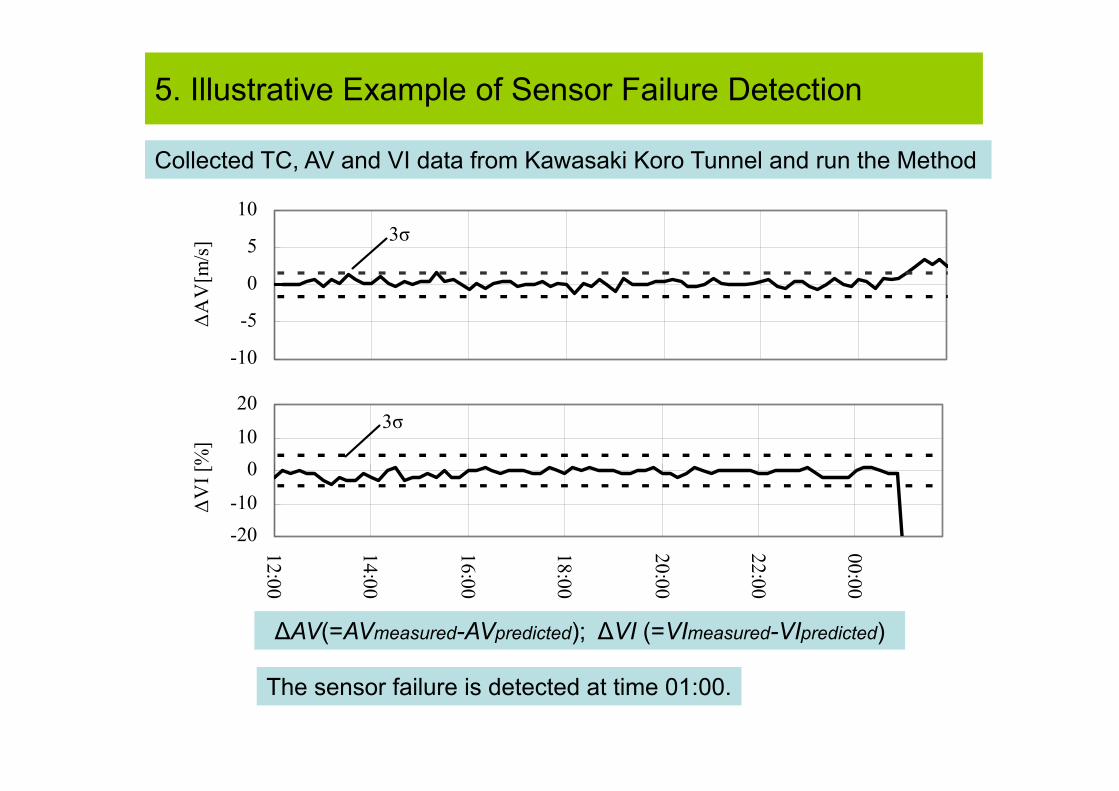
5. Illustrative Example of Sensor Failure Detection
-20-10
010
20
12:00
14:00
16:00
18:00
20:00
22:00
00:00
ΔV
I [%
]
-10
-5
0
5
10Δ
AV
[m/s
] 3σ
3σ
The sensor failure is detected at time 01:00.
∆AV(=AVmeasured-AVpredicted); ∆VI (=VImeasured-VIpredicted)
Collected TC, AV and VI data from Kawasaki Koro Tunnel and run the Method

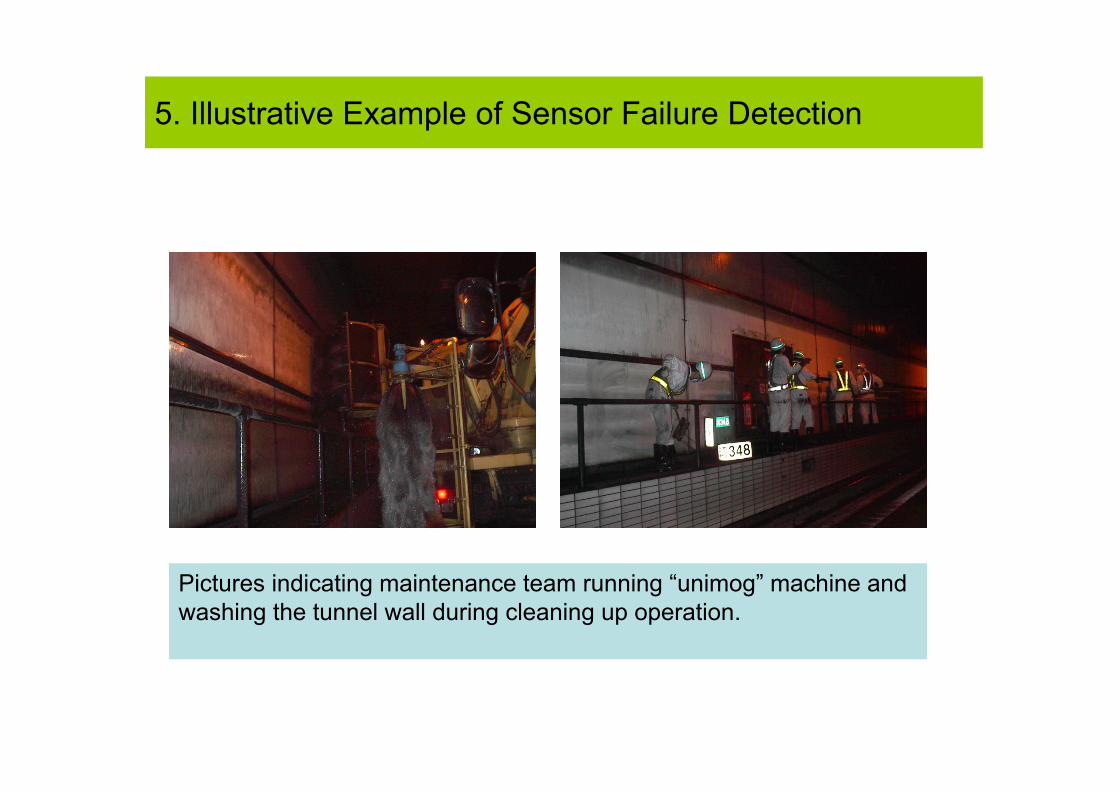
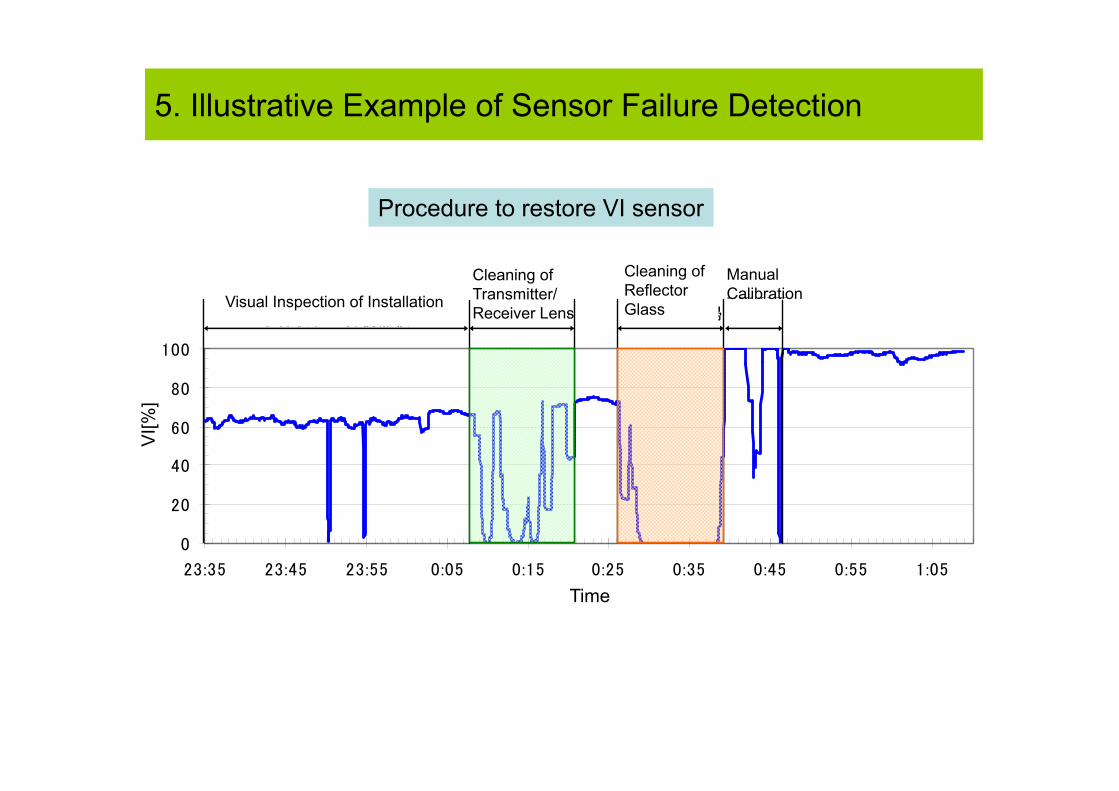
5. Illustrative Example of Sensor Failure Detection
5. Illustrative Example of Sensor Failure Detection
Pictures indicating maintenance team running “unimog” machine andwashing the tunnel wall during cleaning up operation.
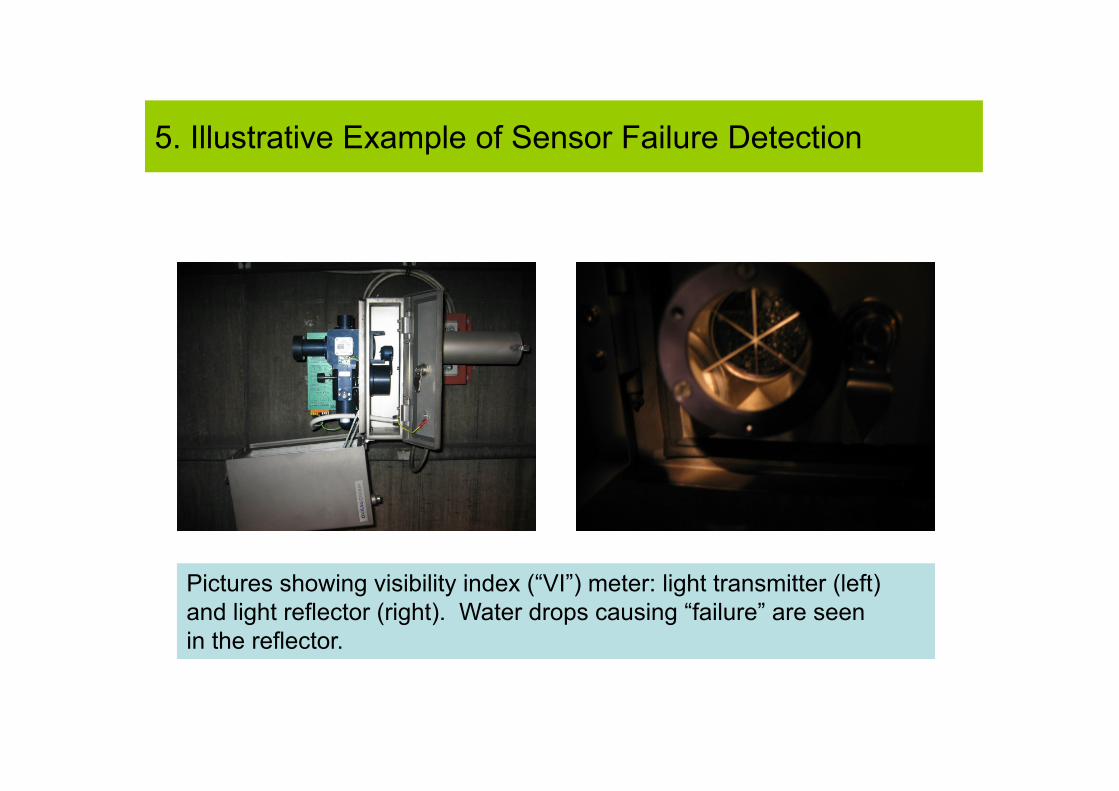
5. Illustrative Example of Sensor Failure Detection
Pictures showing visibility index (“VI”) meter: light transmitter (left) and light reflector (right). Water drops causing “failure” are seen in the reflector.
センサ調整状況とVI計測値
0
20
40
60
80
100
23:35 23:45 23:55 0:05 0:15 0:25 0:35 0:45 0:55 1:05
時刻
VI値
[%]
取付状況の目視点検
投受光部レンズの清掃
リフレクタ反射鏡の清掃
手動校正
5. Illustrative Example of Sensor Failure Detection
Time
VI[%
]
Cleaning of Transmitter/Receiver Lens
Cleaning of Reflector Glass
Manual CalibrationVisual Inspection of Installation
Procedure to restore VI sensor
6. Conclusions
• Has presented a sensor failure detection method in routine tunnel operations.
• Makes statistical comparisons between measured and predicted values based on quasi-steady approximations to air flow and pollution concentration model.
Summarizing statements:• Measurements of traffic data can be used to predict evolving air
velocities and pollution concentrations throughout the tunnel.• By analyzing measured data, it is possible to infer realistic
approximations for values of tunnel and vehicle parameters.• The method of determining optimal values for tunnel and vehicle
parameters provides quantitative statistical data about expected deviations between measured and predicted values at any sensor.
• By monitoring statistical variations of measured and predicted values of sensor during actual tunnel operation, it is possible to detect significant variations from normal behavior and thus to identify instances of probable sensor failures.

Thank you for your attention!