
Sensor Assisted Fire Fighting - CE Pro
15
Sensor Assisted Fire Fighting Adam Cowlard, Wolfram Jahn, Cecilia Abecassis Empis, Guillermo Rein and Jose L. Torero BRE Centre for Fire Safety Engineering The University of Edinburgh United Kingdom Abstract Fire detection and monitoring sensors, fire modelling, fire fighting and command control are usually perceived as independent issues only linked by their relevance to fire safety. Sensor data is associated to detection and alarm and to some minor extent as a source of very basic information for building management or emergency response. The streams of data emerging from sensors are deemed to lead to a rapid information overload, so the pervasive sensor deployment (now common in modern buildings) is entirely dislocated from procedures associated to emergency management. Fire modelling follows a similar path because current models can not be run fast enough to provide useful information, their output is not robust enough and the information that they generate, even if presented in graphical form, will rapidly escalate to quantities and complexity that no commander can digest. In this work, fire modelling has to include people movement, fire dynamics, structural behaviour and the interactions between them. This obviously increases the challenge. Fire fighting is therefore left as an isolated activity that does not benefit much from sensor data or the potential of modelling the event. This separation, naturally induced by the complexity of a fire event, represents the biggest barrier to the useful implementation of sophisticated sensor technology and fire models into emergency response. Therefore, current technology applied to fire is decades behind sensor development for other related areas. Given the constraints of the problem, it is clear that there is no obvious use for more complex and expensive sensors, but the need, in what concerns emergency response is clear. This presentation will describe the different processes that need to be studied to establish a path by which a collection of sensor data can be used to provide early detection, robust building management and adequate information to assist fire fighting operations. Introduction Fighting fires starts when buildings are designed, architects, engineers, local authorities and fire rescue services work together to define egress paths, signalling, smoke barriers (compartmentation), alarms, structural fire proofing, suppression and detection systems. These features are intended to provide an adequate response of the building to a fire and to steer occupants into safety in an effective way. This is the first line of response. Fire and rescue services will be notified and deployment of fire fighters will begin. If the fire escalates and the building and occupants are unable to terminate the threat when fire fighters arrive, then intervention will commence and management of the scene will be delegated to the fire service. Traditional buildings will offer no help to the fire fighters. Fire fighters will have to find their way through the smoke to bring all occupants to safety, control the fire and finally extinguish it. Modern buildings are more sophisticated, providing emergency responders with useful information. In most cases updated blue prints of the building will be available, emergency management plans would have been implemented and security cameras will provide some visual information. Alarm panels will indicate which detectors and fire suppression devices have activated establishing, in a crude manner, location and magnitude of the event. Commanding officers will incorporate all the available information into pre-defined emergency response procedures and deploy people and equipment in the most effective manner. Among commanders, it is accepted that the current density and nature of the information available makes the use of experience and intuition unavoidable [1]. Many believe that more information might not be helpful. Fire, in contrast to other emergencies like earthquakes or floods, is an event that rapidly unfolds in parallel with the intervention. Emergency responders have to assimilate large amounts of information in very short periods of time. The information is complex and difficult to link to the main intervention objectives.
Transcript of Sensor Assisted Fire Fighting - CE Pro

Sensor Assisted Fire Fighting Adam Cowlard, Wolfram Jahn, Cecilia Abecassis Empis,
Guillermo Rein and Jose L. Torero BRE Centre for Fire Safety Engineering
The University of Edinburgh United Kingdom
Abstract
Fire detection and monitoring sensors, fire modelling, fire fighting and command control are usually perceived as independent issues only linked by their relevance to fire safety. Sensor data is associated to detection and alarm and to some minor extent as a source of very basic information for building management or emergency response. The streams of data emerging from sensors are deemed to lead to a rapid information overload, so the pervasive sensor deployment (now common in modern buildings) is entirely dislocated from procedures associated to emergency management. Fire modelling follows a similar path because current models can not be run fast enough to provide useful information, their output is not robust enough and the information that they generate, even if presented in graphical form, will rapidly escalate to quantities and complexity that no commander can digest. In this work, fire modelling has to include people movement, fire dynamics, structural behaviour and the interactions between them. This obviously increases the challenge. Fire fighting is therefore left as an isolated activity that does not benefit much from sensor data or the potential of modelling the event. This separation, naturally induced by the complexity of a fire event, represents the biggest barrier to the useful implementation of sophisticated sensor technology and fire models into emergency response. Therefore, current technology applied to fire is decades behind sensor development for other related areas. Given the constraints of the problem, it is clear that there is no obvious use for more complex and expensive sensors, but the need, in what concerns emergency response is clear. This presentation will describe the different processes that need to be studied to establish a path by which a collection of sensor data can be used to provide early detection, robust building management and adequate information to assist fire fighting operations. Introduction
Fighting fires starts when buildings are designed, architects, engineers, local authorities and fire rescue services work together to define egress paths, signalling, smoke barriers (compartmentation), alarms, structural fire proofing, suppression and detection systems. These features are intended to provide an adequate response of the building to a fire and to steer occupants into safety in an effective way. This is the first line of response. Fire and rescue services will be notified and deployment of fire fighters will begin. If the fire escalates and the building and occupants are unable to terminate the threat when fire fighters arrive, then intervention will commence and management of the scene will be delegated to the fire service.
Traditional buildings will offer no help to the fire fighters. Fire fighters will have to find their way through the smoke to bring all occupants to safety, control the fire and finally extinguish it. Modern buildings are more sophisticated, providing emergency responders with useful information. In most cases updated blue prints of the building will be available, emergency management plans would have been implemented and security cameras will provide some visual information. Alarm panels will indicate which detectors and fire suppression devices have activated establishing, in a crude manner, location and magnitude of the event.
Commanding officers will incorporate all the available information into pre-defined emergency response procedures and deploy people and equipment in the most effective manner. Among commanders, it is accepted that the current density and nature of the information available makes the use of experience and intuition unavoidable [1].
Many believe that more information might not be helpful. Fire, in contrast to other emergencies like earthquakes or floods, is an event that rapidly unfolds in parallel with the intervention. Emergency responders have to assimilate large amounts of information in very short periods of time. The information is complex and difficult to link to the main intervention objectives.

An increase in sensor density and complexity could provide orders of magnitude more information that could serve to assist intervention, but could also result in rapid information-overload.
Sensors can track the evolution of physical variables such as temperatures, concentrations, stresses, light intensity that then can be interpreted in a manner that provides relevant information. The images of cameras can be treated to define detection criteria, to count people or to assess the magnitude of a fire. Nevertheless, the interpretation is complex. There are some examples in the literature where different cameras have been used for this purpose, but while good punctual results have been obtained, generalization has always been proven difficult. Other sensors, like thermocouples or strain gauges provide punctual measurements of physical variables that in isolation provide information of little value or could mislead conclusions. Higher sensor density can portray a clearer picture of the nature of the event, but as mentioned before, a large flow of data becomes difficult to interpret and can rapidly result in information overload. Tracking of the evolution of physical variables is therefore not a viable option to assist intervention in a fire.
An alternate approach that has been suggested is the use of the output of fire models to assist emergency response. The use of fire models to provide predictions of how the event will unfold has been predicated by many but has not received wide acceptance by the fire service. Models could potentially have the capability of recreating the scene but they have never been used for this purpose. Models capable of delivering information faster than the progression of the event (i.e. Analytical and Zone Models) do not reproduce the physics of the problem with enough accuracy. More complex models that include all necessary detail (i.e. CFD Models) are too slow, generally taking hours to resolve a fraction of an event that will evolve in minutes [2]. Furthermore, both sets of models include many input variables (material properties, fuel lay-out, ventilation, etc.) that could potentially carry significant uncertainty. This becomes even clearer when the output of egress, fire and structural models is necessary. Models are currently, not fast enough, not precise enough and not robust enough to serve to orient decision making during a fire emergency. While technological progress could eventually make them fast and precise enough, given the inherent uncertainty of the input variables, many question that the output of fire models could ever be robust enough.
Sensor and image processing technologies have evolved very rapidly in the last decade and new technologies have found great acceptance in building health monitoring, indoor quality management and security of infrastructure [3]. Independently, fire models have become of generalized used in the design of modern buildings and its use in forensic analysis, equivalencies and performance based design is accepted by building control, fire service and building managers. Nevertheless, most of these advances have found no market with the fire service where operations are still managed on the basis of limited information and intuition.
It has become quite clear that sensor data and fire modelling can not independently be used for emergency response. Nevertheless, in conjunction they have the potential to supplement each other to achieve required speed, precision and robustness. Sensor data can be used as a substitute for detailed models enabling simpler approaches to provide fast and precise outputs. Continuous assessment of the model output by means of sensor data can also allow steering of the models to account for uncertainty in the input variables. The model output can then be used to forecast the evolution of the event and to test different intervention strategies. The information can then be summarized and delivered to the fire service in a useful form. This study provides an analysis of the factors limiting the use of fire models and sensor output for emergency response. It provides brief descriptions of a series of studies conducted to determine the limitations of existing approaches, to establish gaps of knowledge and to define potential methodologies that could enable modern sensor technology and computational tools to provide assistance in the management of a fire emergency. Objectives and Current Status
The ideal tools to assist emergency response provide, on the basis of physical models and/or data, predictions of the evolution of an event. These predictions are presented as a series of potential outcomes given different intervention strategies. The outcomes are then optimized and a preferred intervention strategy is defined. The information is relayed with enough lead time that emergency responders can digest the information, make decisions on the path to be followed and implement the

strategy in a manner that is most effective. Furthermore, the information is presented in a succinct form that is compatible with the training and knowledge of emergency responders, thus making interpretation of the output effective and reliable. Continuous updating of the predictions enables changes of strategy on the basis of the evolution of the event. The decision making process is a faculty of the emergency responders, thus weighted alternatives need to be presented for commanders to choose what they deem is the more desirable outcome. Finally, the information needs to be reliable with minimal uncertainty.
Currently, the status of emergency response tools is far from being a good match to the scenario described above. Several of the required components have been developed for different purposes but have never been integrated in a manner that satisfies the needs of the fire service. Furthermore, the components are not necessarily adequate or compatible among themselves and it is clear significant gaps still exist. Finally, Fire Service training practises do not include the necessary knowledge to be able to adequately exploit these tools. In this section sample problem will be broken down and the individual components of an emergency response assistance tool will be identified. An example of a large scale test will be used to illustrate many of the points, but when necessary, other examples will be introduced. The Dalmarnock Fire Tests
Three tests were conducted to reproduce a realistic fire scenario within a high rise building in Dalmarnock (Glasgow, UK) [4]. Two tests corresponded to a simple apartment fire and the third one to a stairwell filling with smoke. The two apartment tests were intended to provide a measure of reproducibility, therefore layout and fuel were identical but ignition and ventilation conditions were varied drastically to assess how different the fires could potentially be. Here only the two apartment tests will be discussed.
The apartment tests were designed to follow a well defined sequence. A first item (sofa) was ignited with a strong ignition source (waste paper basket with accelerant) to minimize the uncertainty during ignition. The flames were allowed to propagate over the sofa until ignition of a secondary item (bookshelf) occurred. The ignition of the secondary item was followed by rapid surface flame spread from the bottom to the top of the bookshelf leading to flashover. The fire was allowed to continue burning almost until burnout in one of the tests (Test One) and extinguished after flashover in the second test (Test Two).
The experiments were carried out in a council estate in Dalmarnock. The structure was built in 1964 as a 23-storey residential tower comprising mostly of cast in-situ reinforced concrete. There were six flats per storey, three either side of an access corridor which also lead to two stairwells and elevator shafts. The two main experiments were held in identical apartments, located on different floors of the building but with identical layout and orientation. A plan view of the apartment and the layout of the furniture are presented in Figure 1.
The main compartment was instrumented with more than 400 sensors that included fire and structural related sensors. For the characterization of the fire a grid of thermocouples for gas phase measurements was developed to have compatible resolution with numerical field models. Heat fluxes and in-depth temperature measurements served to characterize heating of walls, ceiling and floor. Velocity probes in each opening enable to establish a mass balance for air and smoke flows and light obscuration measurements (at a number of different locations) provided detailed characterization of soot concentrations. Several cameras provide multiple views of the room and adjacent areas. Structural monitoring was done via strain gauges and displacement probes. Figure 2 provides two views of the main compartment as well as a detailed description of the layout. The protocols, distribution of sensors and experimental observations can be found in reference [4].
The Dalmarnock Tests provide a setting that is representative of a typical fire in a high rise building. Time scales and fire characteristics are consistent with conditions that the fire service will encounter in a standard home fire. This could be deemed as very simple conditions for intervention, thus an environment that is representative but does not pose severe challenges to fire fighting intervention protocols. In contrast, the instrumentation has significantly higher density and is much more comprehensive than what will be expected of any modern building now or in the near future.

The tests were pre-modelled using several engineering tools, thus a series of potential evolutions of the event existed creating the possibility of scenario matching. All data from sensors and cameras was downloaded to two independent command control units that attempted simultaneous interpretation of the information. The information was not transferred to the fire fighters, who were allowed to perform their operations in a standard manner.
(a)
(b) The particular conditions of this tests where defined to have a scenario that poses no challenge
to existing fire fighter protocols but nevertheless enables idealized conditions for the deployment of sensor driven assistance tools. This was believed as being an adequate scenario to assess the limitations of existing tools and protocols. This assessment and its implications will be presented as follows. A Priori Modelling
A series of models were developed to attempt prediction of the evolution of the fires. These models included analytical calculations, zone models and CFD models. A library of different tests conditions was constructed providing a clear idea of the potential evolution of the fire. The model results indicated that ventilation will have a minor impact on the fire growth, but as expected, will determine the conditions of the post-flashover fire. Analytical and zone models provided information that was mostly consistent with the CFD results, thus only the outcome of the CFD simulations will be presented here. The CFD simulations were done using FDS version 4.0 [5].
A key aspect of this analysis is to establish the importance of different input variables on the outcome. This is critical because, in a real intervention, many of the input variables have a large uncertainty. Constructing these CFD models requires that all parameters associated to fuel and ventilation have to be defined. To simplify modelling, all air inlets were pre-specified and only one window was allowed to break. It was established that window breakage currently carries great uncertainty, thus the glass was broken completely at a pre-specified time after ignition. In what concerns the different components generating the fuel load, a well defined list of objects, their origin and general composition was specified. Many of the details of chemical composition, weight and geometry were omitted. No prior testing of the components was introduced in the models. It was
Figure 1 (a) Flat layout showing basic dimensions (to scale), rooms and windows (b) Furniture Layout in the main compartment

deemed that this was significantly more information that what would be available in a real intervention. Figure 2 Distribution of different sensors throughout the main compartment (above). Below,
two views of the compartment showing the distribution of fuel and thermocouple racks. The dots in the back wall are heat flux meters.
The ignition source consisted of a can with paper and heptane that served to ignite a sofa
(mostly made out of polyurethane) in a repeatable and well defined manner. Initial models indicated that the heat release rate of the sofa will define the room conditions, thus independent tests were done in a furniture calorimeter to provide an estimate of the heat release rate of the sofa during the growth period of the fire and the repeatability of the ignition protocol.
To complement the in-house models, an international round robin was conducted. All the above information was provided and several members of the fire research and professional community were invited to provide results. The model outputs were analyzed and compared among each other to establish the level of uncertainty that a priori modelling of the scenario could have [6].
Figure 3 shows an extract of the results presented in the round-robin study and Table 1 a brief summary of some critical quantities. The results include those obtained by the authors. Heat Release Rates (HRR), time to flashover and typical compartment average temperatures were deemed as being representative variables that could be of utility for the fire service. Experimental values were estimated from the sensor data and are presented for comparison but not with the objective of establishing the correct answer.

0 200 400 600 800 1000 12000
2000
4000
6000
8000
10000
time [s]
HR
R [k
W]
A2D1E2BF1A1E1F2D2CEXP
D2
E1
F1
D1
CA1
A2
B
F2
E2
Figure 3 Predicted heat release rate in the whole compartment. The legend presents the different
submissions following the nomenclature of reference [6]. For the different curves: continuous line for field models; dashed line for zone models; and dots is for experimental data.
Despite the wealth of information provided to reduce modelling uncertainty, it is clear from
the outputs presented in Figure 3 and Table 1 that the accuracy is in general poor and the potential variation is extremely large. Models by themselves can not predict the outcome of a fire to a level of precision and consistency required by intervention. Furthermore, with the exception of the zone models, all CFD tools required several hours of computations before being able to provide results for a single compartment. A discussion of the details of this study and the reasons behind the uncertainty is presented by Rein et al. [6].
Time to
Flashover[s]Maximum SmokeLayer Temp [°C]
A1 850 792 A2 780 1026 B 841 1070 C no flashover 211 D1 200 720 D2 77 1153 E1 180 900 E2 180 1170 F1 720 590 F2 850 650 avg 591 828 exp 300 750
Table 1 Comparison of times to flashover and the maximum temperatures in the main compartment.
Sensor Data
Data from all sensors was collected during the fire and downloaded to the command and control unit. Information on temperature fields, heat fluxes, obscuration, images and velocities were presented in a numerical and graphic form. Figure 4 represents two examples of temperature outputs. Up to twelve temperature slices could be produced and updated every two seconds. These slices provide a detailed representation of the temperature distributions within the compartment. In a similar

manner, the data could be averaged in space and average compartment temperatures could be produced as a function of time. The average looses the spatial distribution, thus leads to incomplete information, but the time evolution of the temperature provides and indication of the growth of the fire.
(a) (b) Figure 4 Two examples of gas temperature contours (in oC) taken from a specific section, axes
values reading distances from the global origin (cf. Figure 2). Plots correspond to a time step of a) 251s, and b) 901s.
Figure 5 presents an average temperature evolution with time. Two curves are presented, one
for the first test and one for the second test. It is clear from both plots that the main features of the fire remained consistent. The curves present the average value and the range of values measured. The robustness of the ignition protocol can be observed by the minor inconsistencies emerging from different quantities of accelerant used. These differences are visible in the first few seconds but then disappear. The increased ventilation resulted in lower temperatures in the growth period, but time to flashover was almost unaffected. This is an important characteristic of this particular experiment that needs to be emphasized. Fuel layout and ignition protocol were designed to reduce uncertainty. The test to the robustness of the experimental set-up was to vary ignition and ventilation as much as possible and observing very similar results.
0
150
300
450
600
750
900
0 100 200 300 400Time from Ignition [s]
Tem
pera
ture
[˚C]
.
Test 1
Test 2
Figure 5 Comparison of the average room temperature (˚C) variation in time (s) of Test One and
Test Two. Data is only presented until extinction of Test Two (400 seconds).
In a similar manner, heat flux mappings on all walls ceiling and floor as well as local extinction coefficients could be provided. The velocity probes delivered punctual measurements of the flow in and out of the compartment. These measurements deserve to be further discussed because velocity is a different form of measurement. Temperatures, heat fluxes and extinction coefficients are physical variables that can not be easily translated into a general description of the state of the compartment. While critical heat fluxes and temperatures have been established as indicators of
KEY
flashover, Figure 5 clearly show that these simple translations are not possible. At 300 seconds Test One shows an average temperature exceeding 350oC while Test Two does not reach 150oC. Nevertheless, both scenarios are equally far away from reaching flashover. The interpretation of these physical variables requires detailed models and a precise definition of all input parameters. In contrast, velocities can be converted into Heat Release Rates and therefore provide a direct indication of the magnitude of the fire. The calculation of the Heat Release Rate from a mass balance at the air inlets requires the assumption that the incoming air has ambient oxygen concentration and the outgoing smoke is void of oxygen. Typical results of this simple calculation are provided in Figure 3 (black symbols). The addition of oxygen concentration measurements could have improved the precision of the calculation but was not done in the present tests. This example is of great importance to the overall objectives of this study because it makes two very important points. The first is that a computed or measured data point can be translated faster than the event to provide a variable that is useful for intervention. Second, the addition of further data and/or computations (oxygen concentrations) can improve the accuracy of the result. Thus, this is a good illustration of super real time calculations that can provide useful information and that could be improved by increased sensor density.
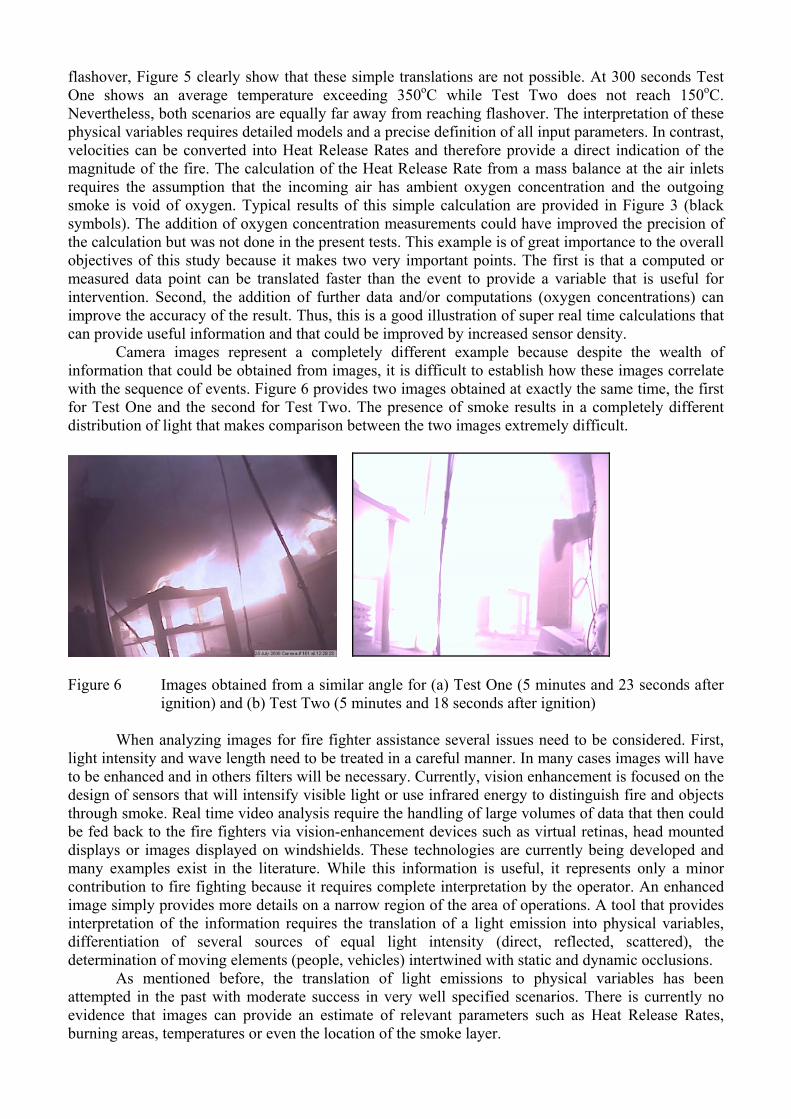
Camera images represent a completely different example because despite the wealth of information that could be obtained from images, it is difficult to establish how these images correlate with the sequence of events. Figure 6 provides two images obtained at exactly the same time, the first for Test One and the second for Test Two. The presence of smoke results in a completely different distribution of light that makes comparison between the two images extremely difficult.
Figure 6 Images obtained from a similar angle for (a) Test One (5 minutes and 23 seconds after
ignition) and (b) Test Two (5 minutes and 18 seconds after ignition)
When analyzing images for fire fighter assistance several issues need to be considered. First, light intensity and wave length need to be treated in a careful manner. In many cases images will have to be enhanced and in others filters will be necessary. Currently, vision enhancement is focused on the design of sensors that will intensify visible light or use infrared energy to distinguish fire and objects through smoke. Real time video analysis require the handling of large volumes of data that then could be fed back to the fire fighters via vision-enhancement devices such as virtual retinas, head mounted displays or images displayed on windshields. These technologies are currently being developed and many examples exist in the literature. While this information is useful, it represents only a minor contribution to fire fighting because it requires complete interpretation by the operator. An enhanced image simply provides more details on a narrow region of the area of operations. A tool that provides interpretation of the information requires the translation of a light emission into physical variables, differentiation of several sources of equal light intensity (direct, reflected, scattered), the determination of moving elements (people, vehicles) intertwined with static and dynamic occlusions.
As mentioned before, the translation of light emissions to physical variables has been attempted in the past with moderate success in very well specified scenarios. There is currently no evidence that images can provide an estimate of relevant parameters such as Heat Release Rates, burning areas, temperatures or even the location of the smoke layer.

In what concerns object identification, the surveillance literature has many examples of complex algorithms developed to track moving objects through fields with static and dynamic occlusions [7] nevertheless, this problem remains far from being solved. When the dynamic occlusions are random natural processes such as moving smoke or falling objects, then the image processing becomes even more complicated. Data Interpretation and Command Control
An attempt to predict the evolution of the fire and to define the outcome of a series of intervention strategies was performed in Test Two. Two windows and three doors could be opened and closed to modify the ventilation of the room. The objective for the Command Control unit was to isolate the fire from adjacent compartments, improve the conditions within the compartment and to delay flashover. Initially the objectives were attained, obscuration and temperature sensor data was analyzed to establish the evolution of these variables and to attempt scenario matching with pre-run models. When the VESDA system established the presence of the fire the main doors of the fire compartment were closed isolating the adjacent corridors from smoke. As the sensors closed to the ceiling detected an increase in light attenuation and temperatures several pre-run scenarios indicated that ventilation should be increased. The main window of the compartment was then opened (50 seconds into the test (Figure 5)). The result was a temporary decrease in the rate of increase temperature and obscuration. Given that the ventilation increase was not sufficient the kitchen door was opened (100 seconds) and the outcome was the desired one. At this point, the changes made had eliminated al possibility of scenario matching and any subsequent decision was left to the operators. Approximately 175 seconds into the test temperature and light attenuation started to increase again. The corridor door was then opened sacrificing the containment objective. The outcome was not the desired one, and temperatures continued to increase, this time at a much faster rate. Video cameras provided evidence that the fire was now following he same path as Test One but none of the information available enabled prediction of the outcome. At this point the command unit had reached information overload and all that could be done was to monitor the outcome. As indicated in Figure 5, flashover conditions were attained almost at the same time as for Test One. None of the initial objectives were attained.
The above example makes it clear that without a detailed data analysis unit that condenses and simplifies the information it is impossible to use sensor and model outputs to support emergency response. The magnitude and complexity of the data flow makes it unmanageable.
It is important to add that during this test, fire fighters followed standard procedures independent of the actions being taken and the information available. Fire fighting strategies and practises are based on pre-defined protocols that are aided only by information conveyed by direct observation. The information is simple in nature and could not be supplemented by the information being extracted by the sensors. Standard training and practises of the fire service follow traditional guidelines that currently incorporate very little real-time information. This has been the standard procedure since the initial structuring of the fire service [8]. None of the existing tools justify any departure from existing practises. Summary
In summary, existing models can not overcome the uncertainty associated to input variables, even in idealized conditions. The output is not accurate enough or robust enough. In a similar manner, sensor data provides a wealth of information but the information can not be linked to the progression of the event. Furthermore, higher sensor density can provide more and more varied information, but these details do not necessary help to reconstruct or project the event. Thus, in itself it can only serve as validation of observations. This has inherent value but does not represent an effective assistance to intervention. The data flow from models and sensors is too complex, large and varied to be handled by commanding officers. No adequate tools are available to manage and interpret this information in an appropriate manner, thus, the fire service is currently in no position to include real time information into their operations and training practises.

Towards the Development of Adequate Tools The clear conclusion of the previous section is that current sensors and models are not capable
of providing the information required to assist emergency response. This section explores several potential improvements to the tools and the expected outcome. Reducing Model Uncertainty
The first important issue to address are the sources of model uncertainty. Models could have many input variables and these variables can carry significant uncertainty. If the model output is not sensitive to a particular input variable, then the uncertainty is not relevant, nevertheless if the output is extremely sensitive to a particular variable this variable then needs to be defined precisely. As an example, a study was conducted using FDS 4.0 and the Dalmarnock Tests to establish the sensitivity of the model to the different input variables.
A two level approach was followed, first all individual material properties were characterized using the cone calorimeter. Ignition parameters (Ignition temperature (Tig) and thermal inertia (kρC)) and Heat Release Rate per Unit Area (HRRPUA) were measured. For the bookshelves and sofa their HRR was established directly. As an example, Figure 7 shows the tests conducted for the bookshelf and the measured HRR. The fire was extinguished before total fuel consumption to avoid collapse of the shelf so the HRR decay period required extrapolation. A similar test was conducted for the sofa.
Figure 7 Test to estimate the HRR of a bookshelf.
A detailed analysis was conducted on the sensitivity of a broad range of variables (material properties, external wind, fuel placement, etc.) but will not be presented here [4]. The detailed analysis of the test data indicated that the critical event that leads to flashover was the ignition and flame spread rate of the bookshelf. Thus the interaction between the sofa (initial burning item) and the bookshelf will be discussed for illustration purposes. The post flashover condition was also analyzed but will not be presented here.
Independent analysis of the bookshelf showed that the properties of all materials involved were fairly consistent and that the HRR depended mostly on modelling adequately the flame spread rate. Although FDS could not model adequately the spread rate, the model allowed establishing that the surface temperature of the combustibles involved was the parameter to which the output was most sensitive. Given that the physical model does not have the required precision, here focus will be given to the definition of the surface temperatures.
It is commonly stated that the HRR is the most important parameter characterizing fire growth. Nevertheless, it is not clear how precise the definition of the HRR has to be. As a sensitivity analysis, the HRR was kept constant and the burning surface and heat of combustion were modified independently. Analysis of the temperature histories and images showed that in the period prior to the ignition of the bookshelf (t<250 seconds) the burning surface of the sofa was limited to approximately 30% of the total area. Figure 8(a) shows the evolution of the average hot layer temperature for the HRR distributed over the full area of the sofa and over approximately 30%. It is clear that the average hot layer temperature is almost unaffected by the distribution of the HRR. In contrast, Figure 8(b) shows that the surface temperature of the bookshelf is significantly affected by the burning area. A

reduction in the burning surface results in higher fuel production per unit area and consequently a taller flame. Radiation from the flames to the bookshelf increases leading to an increased preheating of the bookshelf surface. Given that the average smoke layer results simply from an energy balance, it remains unaffected by the flame geometry. Similar observations could be made when reducing the heat of combustion.
(a) (b) Figure 8 Effect of the sofa burning area, entire sofa and 30% area (reduced area). Bookshelf
ignition occurs between 200 and 250 seconds (a) Average upper layer temperature (b) bookshelf surface temperature at 0.1 m above the floor.
Figure 9 shows that the bookshelf surface temperature is unaffected by the smoke layer. Figure
9(a) represents the Test One and Test Two scenarios where the compartment ventilation was drastically changed. While the smoke layer temperatures were much lower, only minor differences could be observed on the bookshelf temperatures. This is ratified by changing the soot yield over a wide range (Figure 9(b)). These tests were conceived to attain flashover rapidly after the involvement of the bookshelf, and the sofa was placed close enough to emphasize flame radiation and minimize the effect of smoke radiative feedback. These observations are consistent with the design of the experiment.
(a) (b) Figure 9 Evolution of the bookshelf temperature with different parameters (a) compartment
ventilation (b) Soot yield.
Greater detail on the input parameters of a model can eventually result in better precision than that presented in Figure 3, Thus predictions that incorporated well characterized properties, geometry and sofa flame characteristics reproduced HRR, temperatures and time to flashover consistent with the experiments. Nevertheless, the complexity of the processes implies that the information required is extensive and difficult to organize. While certain outputs like the average smoke layer temperature might be attained by proper definition of the sofa HRR, other outputs like the HRR of the second burning item can only be achieved if sofa HRR and burning area are well characterized. The minor

effect of heat feedback from the smoke layer to the fuel is an artifice of the present configuration, for other compartment distributions, heat feedback might have been more important. This would have coupled a coarse variable (average smoke temperature) with a refined variable (flame heat flux) increasing the complexity of the analysis. It is important to reiterate, that while the effect of the first burning item on the surface temperature of the bookshelf was established, the flame spread model still was incapable of reproducing the HRR of the bookshelf. Increasing Model Speed
The previous section indicates that for many of the processes involved, the detailed required from the models forces the use of CFD tools. Nevertheless, these models all require several hours of computations to model the present example. Furthermore, the computational needs will significantly increase as the fire emerges from the compartment of origin. The escalation of the event represents a further challenge to these computations.
The direct mechanism to increase computational speed and to allow for escalation is the use of High Power Computers (HPC) within a Grid configuration. HPC will allow running parallelized versions of the models at increased speed and the Grid will enable to use off site computational resources on demand. Currently, an extensive effort is being devoted to achieve these goals in a programme called FireGrid [9]. Despite the potential of these resources to decrease computation times, it is clear that CFD tools, in their current state, will not provide super-real time results.
A more complex mechanism to gain speed is to rely on sensor data to calibrate simpler models that will allow faster computations while still achieving the required precision. These techniques are grouped under the label of “Data Assimilation” (DA) and are commonly used in weather forecasting. Fire problems represent an important challenge for these techniques because the problem is non-linear, requires equal precision at very different time and length scales and is controlled by critical events such as flashover or ignition.
The objective of DA is to introduce sensor data into sub-models so that predictions can be benchmarked continuously. Input parameters can be calibrated by means of the available data resulting at each stage in a better prediction. A schematic of the process that uses flame spread as an application example is presented in Figure 10. A simple model is initially used to predict the flame length while data on the flame length is collected in a continuous way. The data obtained in the initial period (time 1) is then used to calibrate the input variables of the model resulting, the model is then used with the new constants to provide a second prediction (time 2) while data continues to be collected. The entire ensemble of data is then used for recalibration of the model and a third prediction can be made (time 3). At this point convergence between data and predictions is achieved, nevertheless a change in conditions results in a new divergence. The new data is then used to recalibrate the model (time 4) and a new prediction is produced. The process is then repeated until convergence is attained again (time 9). At this point a new forecast can be made. The following section will provide an application example in greater detail.
Figure 10 Schematic showing data assimilation concept as applied to prediction of flame length
evolution [10].

Sensor Model Integration Upward flame spread was the critical process that FDS 4.0 could no provide adequate results
even with all input variables well resolved. Thus this process will be used as detailed application example. A simple algebraic expression from the literature [11] linking flame spread, flame characteristics and pyrolysis is used to model the process. The expression is very similar to that used in FDS 4.0. For thermally thick materials flame spread velocity (Vf) is defined as:
( )[ ]
20psss
p
2
rsefrpf2/1
ppgg1f )TT(ck
lqqq)TT(l/uckcc4V
−ρπ
′′−′′+′′+−ρ= ∞ &&&
(1)
Where k is the thermal conductivity, cp the specific heat and ρ the density. The gas phase is denoted with a sub-index “g” while the solid with a sub-index “s.” A characteristic flow velocity u∞ represents the flow close to the surface while lp is a characteristic pyrolysis length. Tp, Tf and T0 are pyrolysis, flame and ambient temperature respectively and the heat fluxes from the flame, from an external source and re-radiated from the surface are given by frq ′′& , eq ′′& and rsq ′′& . Two unknown constants appear in equation (1) “c” and “c1.” The constants and variables within the model can be classified into four categories: material properties, scenario-specific dimensional constants, scenario specific non-dimensional parameters and sensor measured quantities that vary with time.
The thermal properties present in Equation (1) are assumed to be constant. These vary with temperature but it is assumed that this variation is spatial and that the distribution does not significantly change in time. Equation (1) was developed for forced flow concurrent flame spread thus can not be applied directly to upward flame spread. The differences are all concentrated on the definition of u∞. Here u∞ will be derived from measurements, thus there is no need to include an expression that accounts for buoyancy. Temperatures and heat fluxes will be measured directly. The flame height (lf) is generally assumed to be directly proportional to the pyrolysis length (Equation 2) therefore, given the knowledge of the evolution of the pyrolysis and flame lengths, the non-dimensional parameter “c” can be directly obtained from Equation (2).
cll
p
f = (2)
The final unknown in the Fernandez-Pello model (Equation (1)) is the non-dimensional parameter c1. This parameter can be obtained from the model itself, being the only unknown at any instant in time over the data collection period. Experiments show that c1 varies in time so a fit should be applied to this parameter in order to predict its future value. Once values and trends for all constants and time variant parameters have been established, Equation (1) can then be used to predict the evolution of the flame spread velocity for the rest of the test.
A series of experiments were conducted with PMMA to demonstrate how a simple model can be used to predict the experimental results [10]. The experiment included gas and solid phase thermocouples, heat flux sensors, a PIV system to characterize the velocity field and CCD cameras to obtain estimates of lp and lf. These measurements were incorporated into equation (2) to calculate “c” and the value of “c1” was optimized from the data and equation (1). Figure 11 shows the process by which an initial set of data (60 seconds) provides an initial value of “c1,” this allows the use of equation (1) for extrapolation of the time evolution of Vf. Subsequent sets of data allow to narrow down the predictions until good convergence is achieved after 240 seconds of data assimilation.
Although simple in nature, these experiments serve to illustrate the potential of this approach. If the CFD code would have been allowed to model upward flame spread in a predictive mode, it would have had to solve the complete fluid mechanics within a range of length scales from the boundary layer thickness to the compartment level. Combustion and heat transfer would have had to be resolved to obtain flame lengths, soot concentrations and flame temperatures. Complex heat

transfer models for the solid and gas phase would have had to be coupled and their interactions quantified. This approach would have required many input variables and extensive computations.
0
0.2
0.4
0.6
0.8
1
0 50 100 150 200 250 300 350time (s)
Vf (m
m/s
) .
Prediction 6060 dataPrediction 120120 dataPrediction 180180 dataPrediction 240240 data
Figure 11 Evolving flame spread prediction obtained from 60 seconds of data (60 data), 120
seconds of data (120 data), 180 seconds of data (180 data), and 240 seconds of data (240 data). Predictions shown by lines labelled “Prediction XX”.
Artificial Intelligence Tools for Command Control
If the goal of super-real time robust predictions could be attained, the available information will be enormous. To manage this information it is essential to mix physical understanding of the processes involved with structured techniques of data management. Currently, Command and Control systems draw upon Artificial Intelligence concepts, specifically knowledge-based and planning techniques. Much modern AI research is focused on providing support to human agents. The impetus for this lies in an acknowledgement of the differing capabilities of humans and computers, and its aim is to engineer environments where these capabilities will complement each other to greatest effect [12]. Humans and computers, thus, collaborate towards the solution of a task.
Process Panels are designed to [13] provide the user with different levels of information. In the upper layers there will be a description of the status of the “collaboration.” The status is described on the basis of variables relevant to the user. In the case of a fire, it could be individuals within the building, sprinklers activated, rooms having reached flashover, areas covered with toxic smoke, etc. More detailed information can be found in deeper layers. This information could be physical variables such as temperatures, obscuration or oxygen concentrations. It could also be “interpreted” information, such as time to flashover for a specific compartment. The “interpreted information” could be based on the output of a model or sensor data. Libraries of “standard operating procedures” can also be accessed to provide model plans for archetypal activities (such as “best practice” responses to particular types of fire). The implementation of response strategies can be tested and the potential outcomes represented as a projected outcome. Current systems rely entirely on very simple information (equivalent to alarm panels) and provide no “data interpretation” thus simply represent a combination of a very basic description of “status of the collaboration” with some direct physical evidence based on a very restricted number of sensors (water flow, smoke detectors and cameras). There are no mechanisms to test the outcome of response strategies other than visualization of the “expected outcome” given standard operating practises. The “expected outcome” will be purely based on historical data. The development of an interpretation unit on the basis of physical understanding, models and sensor data is the only mechanism that will enable the use of AI tools to support fire fighting. Conclusions
The accuracy and robustness of model outputs can be significantly increased by guaranteeing that the adequate input variables for modelling are introduced. If all material properties are carefully evaluated, reasonable accuracy can be achieved. Nevertheless, the sensitivity of the model output to

each input is significant therefore for an accurate and robust prediction it is necessary to know room contents and distribution with great precision. The evaluation also indicated that certain physical processes still need improvement and in many cases the output is strongly affected by inaccurate modelling of these processes. Given the inherent uncertainties in a fire event, it is clear that steering of the models will always be necessary. A reduction of computation times and the capability of escalating computational resources can be achieved by deploying these tools in the Grid. Nevertheless, the current status of the models and the available middleware does not permit achieving the required speed. The complexity of CFD models might never allow sufficient computational speed without some significant simplifications to the models. It is currently unclear how these simplifications can affect the accuracy of the output. Interpretation and amalgamation of sensor data requires an analysis of the physical processes involved. Without physical models the data will not provide forecasting capabilities. Combination of complex calculations, simple sub models and optimization of parameters from sensor data represent the core of the information management process that will enable the use of AI tools to support intervention. Acknowledgements
The work reported in this paper has formed part of FireGrid, www.firegrid.org. This research has been funded by the Technology Strategy Board along with contributions from the other partners in FireGrid. Contributions from Prof. Usmani, Dr. Welch and many other unnamed partners of FireGrid have made this work possible. References 1. Snell, J. (BFRL, NIST) Towards a Global Agenda for Fire Research, Proceedings of the United
Engineering Foundation Conference, Cox, G., Editor, San Diego, 2001. 2. Cox, G. & Kumar, S., Modelling enclosure fires using CFD modelling, in DiNenno (ed.), SFPE handbook
of fire protection engineering, 3rd ed., NFPA, Quincy, MA, 2002, pp. 3-194 to 3-218. 3. Sohn, H., A review of structural health monitoring literature 1996-2001, Proceedings of the Third World
Conference on Structural Control. Vol. Vol. 2, pp. 9-15. 2003. 4. The Dalmarnock Fire Tests: Experiments and Modelling, G. Rein, C. Abecassis-Empis, R. Carvel, Editors,
November 2007. 5. McGrattan, KB. & Forney, G. Fire Dynamics Simulator (Version 4) User's Guide, NIST Special
Publication 1019, National Institute of Standards and Technology, Gaithersburg, MD, USA, 2006. 6. Rein G., Abecassis-Empis C., Amundarain A., Biteau H., Cowlard A., Chan A., Jowsey A.I., Reszka P.,
Steinhaus T., Welch S., Torero J.L., Stern-Gottfried J., Coles A., Lazaro M., Alvear D., Capote J.A., Ryder N.L., Mowrer F., Hostika S., Lautenberger C., Joyeux D., Kumar S. Round-Robin Study of Fire Modelling Blind-Predictions Using the Dalmarnock Fire Experiments. Proceedings of the 5th International Seminar on Fire and Explosion Hazards, Edinburgh, UK, April 2007.
7. R. Bodor, B. Jackson, N.P. Papanikolopoulos, "Vision-based human tracking and activity recognition," in Proc. of the 11th Mediterranean Conf. on Control and Automation, Jun. 2003.
8. Braidwood, J. On the Construction of Fire-Engines and Apparatus-The Training of Firemen, and the Method of Proceeding in Cases of Fire, Oliver & Boyd, 1st Edition, 1830.
9. Berry, D., Usmani, A., Torero, JL., Tate, A., McLaughlin, S., Potter, S., Trew, A., Baxter, R., Bull, M. & Atkinson, M., FireGrid: Integrated emergency response and fire safety engineering for the future built environment, UK e-Science Programme All Hands Meeting (AHM-2005), 19-22 September 2005.
10. Cowlard, A., Auersperg, L., Richon, J-B, Rein, G. Welch, S., Usmani, A, Torero, J.L., “Sensor-driven Prediction of Upward Flame Spread,” 5th Mediterranean Combustion Symposium, Tunisia, 2007.
11. Fernandez-Pello A.C, The Solid Phase, Chapter 2 of Combustion Fundamentals of Fire, Ed. G. Cox, Academic Press Ltd, ISBN 0-12-194230-9. 1995
12. Tate, A., Intelligible AI planning, in Research and Development in Intelligent Systems XVII, Proc. ES2000, The Twentieth British Computer Society Special Group on Expert Systems International Conference on Knowledge Based Systems and Applied Artificial Intelligence, Cambridge, UK, December 2000.
13. Tate, A., <I-N-C-A>: an ontology for mixed-initiative synthesis tasks. Proc. Workshop on Mixed-Initiative Intelligent Systems (MIIS) at the International Joint Conference on Artificial Intelligence (IJCAI-03). Acapulco, Mexico, August 2003.


![Legacy Fighting Championship 33 [Legacy Fighting Championship 39]](https://static.fdocuments.in/doc/165x107/55c5abb6bb61eb601f8b4749/legacy-fighting-championship-33-legacy-fighting-championship-39.jpg)


