Sensitivity of the WRF Model Simulation of the East Asian ...
14
Asia-Pacific J. Atmos. Sci., 47(2), 167-180, 2011 DOI:10.1007/s13143-011-0006-y Sensitivity of the WRF Model Simulation of the East Asian Summer Monsoon in 1993 to Shortwave Radiation Schemes and Ozone Absorption Hyung-Jin Kim 1 and Bin Wang 2 1 Research Institute for Global Change, Japan Agency for Marine-Earth Science and Technology, Kanazawa-ku, Yokohama, Japan 2 International Pacific Research Center and Department of Meteorology, School of Ocean and Earth Science and Technology, University of Hawaii at Manoa, Hawaii, U.S.A. (Manuscript received 5 April 2010; revised 17 November 2010; accepted 21 November 2010) © The Korean Meteorological Society and Springer 2011 Abstract: Sensitivity of the Weather Research and Forecasting (WRF) model simulation of the East Asian summer monsoon (EASM) in 1993 to solar radiation parameterizations and ozone absorption was investigated. Three numerical experiments were conducted using the National Centers for Environmental Prediction/Department of Energy (NCEP/DOE) and the European Centre for Medium-Range Weather Forecasts (ECMWF) reanalysis data as time-varying surface and lateral boundary forcings, respectively: (a) a control run (“CTL”) with the Dudhia radiation scheme and the model top placed at 50 hPa, (b) the “SWG” experiment which is the same as the CTL except the Goddard radiation scheme, and (3) the “SWT” run which is the same as the SWG but the model top was raised to 5 hPa and the vertical levels increased from 31 to 35. The use of the Goddard scheme results in considerable improvement in reproducing the model’s thermal structures, such as zonal mean air temperature, its latitudinal gradient and vertically integrated temperature. This leads to better agreements in the simulation of the upper tropospheric zonal winds through the thermal wind relationship which, in turn, rectifies the low- level circulations through dynamical coupling between the upper and lower troposphere. The Taylor diagram analysis quantitatively indicates that the SWT and the SWG are discernable from each other with slightly improved simulations in the SWT. This suggests a nontrivial role of ozone absorption and accompanied stratospheric heating in EASM simulation. Key words: East Asian summer monsoon, WRF model, shortwave radiation, maximum ozone height, ozone absorption, model-top layer 1. Introduction Changes in the intensity and location of the upper-level westerly jet significantly affect the activity and displacement of the subtropical front known as Meiyu (China), Changma (Korea) or Baiu (Japan). During the summer of 1994, for example, the severe drought was prevailed over central China, South Korea and southern Japan in association with the northward shift of the suppressed jet (Park and Schubert, 1997; Lee and Suh 2000; Lee et al., 2002). Meanwhile the southward migration of the enhanced 200-hPa westerly winds was concurrent with serious summer- time flooding in 1991, 1993 and 1998 over the aforementioned regions (Lee and Suh, 2000; Wang et al., 2000; Lee et al., 2004; Yoo et al., 2004; Kang et al., 2005). The anomalous water vapor transport associated with the southward shift of the upper level jet is deemed essential for the abundant precipitation (Zhou and Yu, 2005). The upper air confluence also more often modulates frontal activity through inducing secondary circulations that favor instability on the right (left) side of the jet entrance (exit) (Blackmon et al., 1977). At the surface, a large-scale low formed over the Asia continent drives low-level monsoon flows which regulate the moisture transport from the South China Sea to East Asia and largely control the monsoon rainfall amount in an interactive sense (Ding 1992; Kawamura and Murakami, 1998). Of note is that both upper- and low-level circulations are closely related to large-scale temperature structures. The upper air jet is a balanced response to the northward temperature gradient (Zhang et al., 2006) and the low-level monsoon flows are accentuated by the differential heating between the Asia continent and the adjacent oceans. From the numerical modeling viewpoint, therefore, the realistic simulation of the large-scale temperature is imperative to better represent the intensity and displacement of the East Asia summer monsoon (EASM). Numerical model consists of various physical parameteriza- tions. Among others, careful consideration should be placed on the radiation processes for the simulation on timescales from subseasonal to annual because in these timescales radiative heating rate could be significant compared to advective and condensational heating rate (Giorgi and Mearns, 1999). In the present study, the authors investigate the sensitivity of the simulated regional summer climate to solar radiation parameterizations by utilizing regional climate model (RCM) simulations. Also examined are the effects of the model’s top and stratospheric vertical resolution that determines ozone absorption of shortwave radiation. The observed ozone profile generally shows a maximum between 10 hPa and 5 hPa (Fortuin and Kelder, 1998). In a large body of previous RCM studies, however, the upper boundary was set at a level much lower than the ozone maximum height. To test model sensitivity, the EASM in 1993 was simulated and validated against observation as rainfall and atmospheric circulations in this particular summer were deviated from their climatology over the large parts of East Asia (Lee and Suh, Corresponding Author: Hyung-Jin Kim, Research Institute for Global Change, Japan Agency for Marine-Earth Science and Technology, 3173- 25 Showa-machi, Kanazawa-ku, Yokohama, Kanagawa 236-0001, Japan. E-mail : [email protected]
Transcript of Sensitivity of the WRF Model Simulation of the East Asian ...

Asia-Pacific J. Atmos. Sci., 47(2), 167-180, 2011
DOI:10.1007/s13143-011-0006-y
Sensitivity of the WRF Model Simulation of the East Asian Summer Monsoon in
1993 to Shortwave Radiation Schemes and Ozone Absorption
Hyung-Jin Kim1 and Bin Wang
2
1Research Institute for Global Change, Japan Agency for Marine-Earth Science and Technology, Kanazawa-ku, Yokohama, Japan2International Pacific Research Center and Department of Meteorology, School of Ocean and Earth Science and Technology,
University of Hawaii at Manoa, Hawaii, U.S.A.
(Manuscript received 5 April 2010; revised 17 November 2010; accepted 21 November 2010)© The Korean Meteorological Society and Springer 2011
Abstract: Sensitivity of the Weather Research and Forecasting (WRF)
model simulation of the East Asian summer monsoon (EASM) in
1993 to solar radiation parameterizations and ozone absorption was
investigated. Three numerical experiments were conducted using the
National Centers for Environmental Prediction/Department of Energy
(NCEP/DOE) and the European Centre for Medium-Range Weather
Forecasts (ECMWF) reanalysis data as time-varying surface and
lateral boundary forcings, respectively: (a) a control run (“CTL”) with
the Dudhia radiation scheme and the model top placed at 50 hPa, (b)
the “SWG” experiment which is the same as the CTL except the
Goddard radiation scheme, and (3) the “SWT” run which is the same
as the SWG but the model top was raised to 5 hPa and the vertical
levels increased from 31 to 35. The use of the Goddard scheme
results in considerable improvement in reproducing the model’s
thermal structures, such as zonal mean air temperature, its latitudinal
gradient and vertically integrated temperature. This leads to better
agreements in the simulation of the upper tropospheric zonal winds
through the thermal wind relationship which, in turn, rectifies the low-
level circulations through dynamical coupling between the upper and
lower troposphere. The Taylor diagram analysis quantitatively indicates
that the SWT and the SWG are discernable from each other with
slightly improved simulations in the SWT. This suggests a nontrivial
role of ozone absorption and accompanied stratospheric heating in
EASM simulation.
Key words: East Asian summer monsoon, WRF model, shortwave
radiation, maximum ozone height, ozone absorption, model-top layer
1. Introduction
Changes in the intensity and location of the upper-level
westerly jet significantly affect the activity and displacement of
the subtropical front known as Meiyu (China), Changma (Korea)
or Baiu (Japan). During the summer of 1994, for example, the
severe drought was prevailed over central China, South Korea
and southern Japan in association with the northward shift of the
suppressed jet (Park and Schubert, 1997; Lee and Suh 2000; Lee
et al., 2002). Meanwhile the southward migration of the enhanced
200-hPa westerly winds was concurrent with serious summer-
time flooding in 1991, 1993 and 1998 over the aforementioned
regions (Lee and Suh, 2000; Wang et al., 2000; Lee et al., 2004;
Yoo et al., 2004; Kang et al., 2005). The anomalous water
vapor transport associated with the southward shift of the upper
level jet is deemed essential for the abundant precipitation (Zhou
and Yu, 2005). The upper air confluence also more often
modulates frontal activity through inducing secondary circulations
that favor instability on the right (left) side of the jet entrance (exit)
(Blackmon et al., 1977). At the surface, a large-scale low formed
over the Asia continent drives low-level monsoon flows which
regulate the moisture transport from the South China Sea to East
Asia and largely control the monsoon rainfall amount in an
interactive sense (Ding 1992; Kawamura and Murakami, 1998).
Of note is that both upper- and low-level circulations are
closely related to large-scale temperature structures. The upper
air jet is a balanced response to the northward temperature
gradient (Zhang et al., 2006) and the low-level monsoon flows
are accentuated by the differential heating between the Asia
continent and the adjacent oceans. From the numerical modeling
viewpoint, therefore, the realistic simulation of the large-scale
temperature is imperative to better represent the intensity and
displacement of the East Asia summer monsoon (EASM).
Numerical model consists of various physical parameteriza-
tions. Among others, careful consideration should be placed on
the radiation processes for the simulation on timescales from
subseasonal to annual because in these timescales radiative heating
rate could be significant compared to advective and condensational
heating rate (Giorgi and Mearns, 1999). In the present study, the
authors investigate the sensitivity of the simulated regional
summer climate to solar radiation parameterizations by utilizing
regional climate model (RCM) simulations. Also examined are the
effects of the model’s top and stratospheric vertical resolution that
determines ozone absorption of shortwave radiation. The observed
ozone profile generally shows a maximum between 10 hPa and 5
hPa (Fortuin and Kelder, 1998). In a large body of previous RCM
studies, however, the upper boundary was set at a level much
lower than the ozone maximum height.
To test model sensitivity, the EASM in 1993 was simulated
and validated against observation as rainfall and atmospheric
circulations in this particular summer were deviated from their
climatology over the large parts of East Asia (Lee and Suh,
Corresponding Author: Hyung-Jin Kim, Research Institute for GlobalChange, Japan Agency for Marine-Earth Science and Technology, 3173-25 Showa-machi, Kanazawa-ku, Yokohama, Kanagawa 236-0001, Japan. E-mail : [email protected]

168 ASIA-PACIFIC JOURNAL OF ATMOSPHERIC SCIENCES
2000; Yoo et al., 2004). The regional model used is the Weather
Research and Forecasting (WRF) model that has recently taken
the priority of regional model development from many institutes,
centers, and universities. Though the WRF is primarily aimed to
short-term prediction, the use of it in regional climate study has
been rapidly increased in recent years (Davis et al., 2003;
Knievel et al., 2004; Lo et al., 2008; Salathé et al., 2010).
This paper is organized as follows. Section 2 presents the
observed characteristics of the anomalous summer monsoon in
1993. Model description and design of sensitivity tests are
presented in section 3. Sensitivity to solar radiation schemes and
top boundary layers is illustrated and discussed in section 4. The
last section gives summary with concluding remarks.
2. East Asian summer monsoon in 1993
The observed features of the atmospheric circulation and
precipitation were briefly documented by using the ECMWF 40-
year reanalysis (ERA, Uppala et al., 2005) and the Chinese
station data merged with the Global Precipitation Climatology
Project (GPCP) version 2 data (Alder et al., 2003). The station
precipitation was recorded at about 700 meteorological stations
across China and archived by the Climate Data Center of National
Meteorological Information Center, China Meteorological Ad-
ministration. To construct anomalies, a 20-year average over
1981-2000 was used as a climatology.
a. Zonal mean air temperature and westerly jet
Figure 1 shows the observed June-July-August (JJA) zonal
mean air temperature and its anomaly. The air temperature
decreases upward and poleward in the mid-latitude troposphere,
whereas above 100 hPa opposite tendency is seen owing to the
existence of the upper-level cold core. The anomaly patterns
display colder (warmer)-than-normal temperature in middle
latitude troposphere (stratosphere), implying an intensification
of meridional temperature gradient.
Figure 2 represents latitude-height cross sections of the
northward temperature gradient (shadings) and zonal winds
(contours) for the climatological JJA mean (Fig. 2a), the 1993
JJA mean (Fig. 2b), and the anomalous zonal winds in 1993
(Fig. 2c). The temperature gradient was estimated by
= (∆φ is 2.5o and j is a latitudinal index) so that
positive (negative) temperature gradient denotes westerly
(easterly) shear. The axis of the climatological jet is located at
200 hPa around 40oN with maximum speed of about 25 m s−1. In
1993, the upper-level westerly jet is intensified by about 5 m s−1
in association with the enhanced tropospheric temperature
gradient (Fig. 2b). The thermal wind relationship is robust in
that the height where the meridional temperature gradient
vanishes (the thick lines in Figs. 2a and 2b) coincides well with
the maximum westerly winds height. Also evident is the slight
southward displacement of jet streak, resulting in positive
anomalies in the extra-tropics and negative anomalies to the
north and the south (Fig. 2c).
Shown in the left and right panels of Fig. 3 are the monthly
anomaly of 850-hPa relative vorticity superimposed with the
200-hPa zonal winds and precipitation anomaly, representing the
upper- and low-level dynamical linkage and the impacts of low-
level circulation on precipitation, respectively. In June 1993, little
evidences are found for the dynamical coupling between the
upper- and low-level anomalous circulations (Fig. 3a). During the
rest two months, on the other hand, positive vorticity anomaly
occurs in a narrow band of intensified westerly jet located mostly
over the southern Korea and Japan (Figs. 3b and 3c). It is also
seen that the cyclonic vorticity anomaly coexists with the
increased rainfall over Korea and Japan (Figs. 3e and 3f). Thus,
the intensified westerly winds aloft tend to induce positive
vorticity anomaly which results in the increased precipitation.
Another interesting feature is that the above-normal rainfall in
June and July over southern China seems to have nothing to do
with 850-hPa vorticity anomaly, implying that the “rain-
enhancing” mechanism over south China is likely different from
that over Korea and Japan.
∆T– ∆φ( )⁄
Tj 1+ Tj–( )– ∆φ⁄
Fig. 1. Latitude-height cross section of (a) the JJA air temperature in 1993 and (b) its anomaly obtained from the ECMWF 40-year reanalysis. Unitsare in oC.

28 February 2011 Hyung-Jin Kim and Bin Wang 169
b. Atmospheric heat source and monsoon circulations
The Asian summer monsoon circulations characterized by upper
air northeasterly and low-level southwesterly are closely related to
the atmospheric heat source induced by a differential heating
between land and ocean. The spatial patterns and temporal
evolution of the monsoon flows can be traced by the middle
tropospheric temperature (Ueda and Yasunari, 1998; He et al.,
2003; Goswami and Xavier, 2005). In this respect, the vertically
integrated temperature between 600 and 200 hPa (VIT hereinafter)
was examined by using the ERA to reveal the anomalous features
of the atmospheric thermal structure and associated monsoon
circulations.
Figure 4a represents the JJA VIT in 1993 over the Asian
monsoon regions. The shaded areas delineate the warm core with
temperature warmer than −16oC, while the thick lines denote the
locations where the direction of the 200-hPa zonal winds
changes (in other words, the ridge of the South Asian high). The
major heat sources are resided on the South Asian continent and
the upper-level ridge is aligned with the local temperature
maxima. Figure 4b shows the VIT anomaly (shadings) and 200-
hPa wind anomaly (vectors). The VIT anomaly warmer than
0.1oC is found only in the southeastern parts of China and
accompanied with the enhanced anticyclone. The anomalous
heat source also results in an intensified heat low and leads to the
increased low-level southerly on the southeast coast of China
(Fig. 4c), providing an enhanced moisture transport. This could
be responsible for the larger-than-normal precipitation over
southeastern China mentioned previously in section 2a.
3. Model description and numerical experiments
a. The WRF model
The WRF model is developed for both research purpose and
operational prediction of mesoscale atmospheric phenomena
with the horizontal grid scale from several to hundreds km. The
WRF model consists of a fully compressible, three-dimensional,
nonhydrostatic core formulated using terrain-following mass
vertical coordinate (Skamarock et al., 2005). The governing
equations are written in a flux form. The Runge-Kutta schemes
and high-order advection schemes are adopted for numerical
integration of prognostic equations (Wicker and Skamarock,
2002).
The Monin-Obukhov surface-layer scheme (Dyer and Hicks,
1970; Paulson, 1970; Webb, 1970), the Noah land surface model
(Chen and Dudhia, 2001), and the Yonsei University (YSU)
boundary-layer parameterization (Hong et al., 2006) are selected
Fig. 2. Latitude-height cross section of the JJA zonal winds (contours, m s−1
) and latitudinal temperature gradient (shadings, oC/deg-lat) (a) for 20-
year climatology and (b) in 1993. (c) is for the zonal winds anomaly (m s−1) in 1993. In (a) and (b), contour intervals are 5 within ± 20 and 2.5outside, and positive (negative) temperature gradient denotes westerly (easterly) shear. Thick solid line in (a) and (b) indicates zero temperaturegradient.

170 ASIA-PACIFIC JOURNAL OF ATMOSPHERIC SCIENCES
from the various built-in packages to represent near surface
processes. The Betts-Miller-Janji scheme (Janji , 1994) and the
Lin Microphysics scheme (derived from the original scheme
described in Lin et al.,, 1983) are chosen for convective and
microphysical processes, respectively. Terrestrial radiation is
parameterized by the rapid radiative transfer model (Mlawer et
al., 1997; Iacono et al., 2000). Table 1 gives a brief description of
the numerical configurations and the selected parameterizations.
b. Numerical experiments
The model domain consists of 145 by 115 grid points in the
zonal and meridional directions, respectively, with a grid resolu-
tion of 50 km centering at 35oN and 120oE (Fig. 5). It covers the
′c ′c
Fig. 3. The observed anomaly of 850-hPa relative vorticity (105
s−1
, shadings in left and contours in right) with (left) 200-hPa zonal winds (contours,m s−1) and (right) precipitation (shadings, mm d−1). (a, d), (b, e) and (c, f) are for June, July and August in 1993, respectively. Contour intervals are± 5, ± 7.5 and ± 10 for zonal winds and ± 1, ± 1.5 and ± 2 for relative vorticity, respectively.

28 February 2011 Hyung-Jin Kim and Bin Wang 171
majority of the East Asia continent, including most part of the
Tibetan Plateau and the Indochina Peninsula. Also included are a
part of Bay of Bengal, the South China Sea and the western
Pacific Ocean where the differential heating between land and
adjacent ocean is prominent (He et al., 2003). Thus, the domain
is large enough to consider the land-sea thermal contrast and
modulation of upper air flows due to high topography.
The selected grid distance of 50 km is in the range of the
suggested ratio of 3-8 between driving data and model re-
solution (Giorgi and Mearns, 1999) because the NCEP/DOE
reanalysis (NRA2, Kanamitsu et al., 2002) for surface boundary
condition and the ERA for lateral boundary condition has the
resolution of 1.875o × ~2o and 2.5o × 2.5o, respectively. The
model simulations with the integration time step of ∆t = 180 s
are initialized on 1 May 1993 and performed to 31 August 1993
with lateral boundary data updated every 6 hours. Time-varying
sea surface temperatures are also prescribed for water surface
with the same interval.
Three numerical experiments were carried out to test model’s
sensitivity to the shortwave radiation schemes and shortwave
absorption of ozone. First, a control run (“CTL”) was conducted
with the simple shortwave radiation scheme (Dudhia, 1989)
with the top boundary placed at 50 hPa. Second, the “SWG”
experiment was performed in which the Goddard shortwave
scheme (Chou and Suarez, 1999) was employed with the same
vertical configuration as the CTL. The last numerical integration
(“SWT”) also utilized the Goddard shortwave scheme but with
the upper boundary at 5 hPa. The number of total vertical levels
is 31 for the first two simulations and 35 for the last. Each
simulation has one “effective layer” that extends from the
prescribed model top to about 0.0006 hPa to calculate incident
Fig. 4. (a) The observed JJA mean VIT (oC) over the Asian monsoonregions in 1993 with shadings for the regions warmer than −16
oC. (b)
VIT (shadings, oC) and 200-hPa wind (vectors, m s−1
) anomaly in 1993.(c) 850-hPa wind (vectors, m s−1) and precipitation (shadings, mm d−1)anomaly in 1993. In (a) and (b) thick solid lines indicate zero lines of200-hPa zonal winds.
Table 1. Numerical configurations and physics parameterizations forthe numerical experiments.
Features Selected value/option
Integration time stepHorizontal resolutionIntegration periodAnalysis period Surface B. C.Lateral B. C.Cumulus convectionCloud microphysicsSurface layerPBLLand surfaceLongwave radiationSolar constant
180 s50 km1 May 1993 - 31 August 19931 June 1993 - 31 August 1993Reanalysis-2 (6-hour interval)ERA (6-hour interval)Betts-Miller-Janji (cudt = 30 min)LinMonin-ObukhovYSU (bldt = 180 s)NoahRRTM (radt = 30 min)1365 W m−2
′c
Fig. 5. Model domain and topographic height (m) with a grid spacingof 50 km. Contour interval is 600 m. The boxed region denotes theanalysis domain.

172 ASIA-PACIFIC JOURNAL OF ATMOSPHERIC SCIENCES
shortwave flux reaching at the model’s top layer. If the surface
pressure in the WRF model varies from 1000 hPa to 900 hPa,
the SWT would have additional 7 levels between 50 hPa and 5
hPa (see Table 3). Note that the number of levels in PBL (below
850 hPa) is not significantly different between the 50-hPa and 5-
hPa experiments. A summary of the numerical experiments and
the vertical levels are given in Table 2 and 3, respectively.
The shortwave parameterization of Dudhia (1989) (Dudhia
scheme, hereafter) has no spectral bands and, thus, is not able to
reflect the rapidly varying shortwave flux with wavenumber.
Further simplification is the implicit treatment of the absorption
of ozone and minor gases such as O2 and CO
2. In contrast,
shortwave fluxes in Chou and Suarez (1999) (Goddard scheme,
hereafter) are integrated from 0.175 to 10 µm which are divided
further into eleven sub-bands. Especially, attenuation of ozone
that is important in determining the stratospheric temperature is
explicitly calculated in the ultraviolet and visible regions.
4. Results
The model simulations except for the precipitation were
regridded onto ERA’s grid system of 2.5o × 2.5o for validation.
For the precipitation, finer resolution (0.5o × 0.5o) was used
thanks to a dense observational network of China station data set.
a. Zonal mean structures
Figure 6 shows latitude-height cross section of the JJA mean
air temperature and its bias for the CTL (Figs. 6a and 6d), the
SWG (Figs. 6b and 6e) and the SWT (Figs. 6c and 6f),
respectively. In these figures, air temperature below 850 hPa is
excluded owing to the missing values of the model solution over
the high topography. Common errors include moderate negative
biases in the troposphere (about −1oC) and relatively large warm
biases in the upper atmosphere (3-5oC). Salient differences,
however, exist in the simulation of the upper-level cold core. In
the CTL, the temperature inversion observed in the extra-
tropical lower stratosphere is absent (Fig. 6a). In contrast, it is
reproduced better in the simulations with the Goddard scheme,
and in particular in the SWT (Figs. 6b and 6c).
The improved temperature inversion in the SWG and SWT is
most likely due to the advanced radiation parameterizations, and
hence readily understandable. But why does the SWT outperform
the SWG? The stratospheric temperature is mainly controlled by
the longwave cooling due to ozone and carbon dioxide and the
solar heating by ozone (Liou 2002). The longwave cooling is
generally similar in all simulations regardless of the specified top
layer since the cooling profiles of carbon dioxide and ozone
change little from 50 hPa up to 5 hPa (Fu and Liou, 1992).
Unlike the longwave cooling rate, however, the ozone solar
heating varies greatly from several degrees per day at 50 hPa to
an order of ten degrees per day at 5 hPa (Chou and Suarez,
1999; Liou, 2002). Therefore, it can be inferred that the upper
air temperature inversion reproduced better in the SWT than in
the SWG is the result of the realistic ozone absorption and
associated heating rate due to the extended layers.
Then the next question is how does the extended vertical
boundary give rise to the warmer stratospheric temperature in
the SWT? It should be first mentioned that the absorbed solar
radiation fluxes above 50 hPa may not be substantially different
between the SWG and the SWT since the SWG also takes into
account ozone shortwave absorption in the “effective layer”
based on the mass-weighted ozone concentration (recall the
Table 2. Design of the numerical experiments.
CTL SWG SWT
Shortwave radiationTop boundaryVertical levels
Dudhia50 hPa
31
Goddard50 hPa
31
Goddard5 hPa
35
Table 3. The prescribed vertical σ (pressure normalized by surfacepressure) levels and corresponding pressures used in the CTL, theSWG and the SWT experiment. Here, the pressure levels are obtainedusing the given top boundary in Table 2 and the assumed surfacepressures of 1000 hPa and 900 hPa. Shaded values indicate additionalpressure levels in 50 hPa to 5 hPa used in the SWT.
Levelindex
CTL and SWG SWT
σpressure
(ps= 1000)
pressure(p
s= 900)
σpressure
(ps= 1000)
pressure(p
s= 900)
12345678910111213141516171819202122232425262728
1.0000.9930.9800.9660.9500.9330.9130.8920.8690.8440.8160.7860.7530.7180.6800.6390.5960.5500.5010.4510.3980.3450.2900.2360.1880.1450.1080.075
1000.0993.4981.0967.7952.5936.4917.3897.4875.5851.8825.2796.7765.4732.1696.0657.0616.2572.5525.9478.5428.1377.8325.5274.2228.6187.8152.6121.3
900.0894.0883.0871.1857.5843.1826.0808.2788.7767.4743.6718.1690.0660.3628.0593.2556.6517.5475.8433.4388.3343.3296.5250.6209.8173.3141.8113.8
1.0000.9930.9800.9660.9500.9330.9130.8920.8690.8440.8160.7860.7530.7180.6800.6390.5960.5500.5010.4510.3980.3450.2900.2360.1880.1450.1080.064
1000.0993.0980.1966.2950.3933.3913.4892.5869.7844.8816.9787.1754.2719.4681.6640.8598.0552.3503.5453.7401.0348.3293.5239.8192.1149.3112.568.7
900.0893.7882.1869.6855.3840.0822.1803.3782.8760.4735.3708.5678.9647.6613.6576.9538.4497.3453.4408.6361.2313.8264.5216.2173.3134.8101.762.3
29303132333435
0.0460.0210.000
93.769.950.0
89.167.850.0
0.0420.0280.0170.0100.0060.0020.000
46.832.921.914.911.07.05.0
42.630.120.213.910.46.85.0

28 February 2011 Hyung-Jin Kim and Bin Wang 173
definition of “effective layer” in section 3b). In fact, further
analysis indicates a slight increase of the surface incoming
shortwave flux in the SWT (figure not shown), suggesting that
the attenuation by ozone is likely reduced in the SWT compared
to the SWG. We speculate that the increased number of vertical
layers above 50 hPa and the dependency of ozone heating rate
on air density are responsible for the improved simulation in the
SWT. Air density exponentially decreases in altitude and heating
rate is inversely proportional to it. Therefore, heating rate in the
lower stratosphere would be very sensitive to the small variation
of air density. The SWT has additional 7 layers above 50 hPa
(see Table 3), thereby, for the heating rate calculation, it is able
to reproduce a more detailed density profile than the SWG
which has only one representative value above 50 hPa. As a
consequence, the SWT simulates better the ozone heating rate
and air temperature in the upper troposphere.
The modeled latitudinal temperature gradient, balanced winds
and its anomaly are presented in Fig. 7. The WRF model repro-
Fig. 6. Latitude-height cross section of the JJA mean air temperature in 1993 (left panels) and its bias (right panels) for (a, d) the CTL, (b, e) theSWG and (c, f) the SWT. Units are in o
C.

174 ASIA-PACIFIC JOURNAL OF ATMOSPHERIC SCIENCES
duces reasonably well the theoretical thermal-wind relationship:
the zero line of the temperature gradients is located at the
maximum westerly winds. In the CTL, however, the intensity of
the temperature gradients and associated zonal winds are weaker
than observed and the three-cell structure in zonal wind anomaly
is not properly simulated (Figs. 7a and 7d). These deficits are
obviously relieved in the SWG and SWT simulations in which
the intensity of the temperature gradient and zonal winds are
comparable to the observation (Figs. 7b and 7c) and the spatial
patterns of the zonal wind anomaly are adequately organized
(Figs. 7e and 7f).
Fig. 7. (Left) Latitude-height cross section of the JJA mean of zonal winds (contours, m s−1) and meridional temperature gradient (shadings, oC/deg-lat) in 1993. Contour intervals are 5 within ± 20 and 2.5 outside, and positive (negative) temperature gradient denotes westerly (easterly) shear. Thicksolid line is for zero temperature gradient. (Right) Latitude-height cross section of the JJA zonal winds anomaly (m s
−1). Top, middle and bottom
panels are for the CTL, the SWG and the SWT, respectively.

28 February 2011 Hyung-Jin Kim and Bin Wang 175
b. Linkage between upper- and low-level circulations
Due to the substantial changes in the modeled air temperatures
among the three experiments, the upper air flows (for example,
200-hPa zonal winds) also exhibit noticeable alteration and so
do the low-level circulations through dynamical coupling.
Figure 8 displays the observed and simulated JJA mean 200-hPa
zonal winds and 850-hPa vorticity in the summer of 1993. In the
observations (Fig. 8a), jet cores are located at 37-40oN with
maximum intensities of 30-34 m s−1. When compared to the
climatology (figure not shown), they migrates southward and
are intensified by about 5 m s−1. Jet streams are important source
regions for the development of low-level cyclones. The accel-
eration (deceleration) of zonal winds at the entrance (exit) of the
jet stream requires ageostrophic meridional flows. These induce
vertical circulations on the plane across the jet stream, which
connects upper- and low-level circulations (Blackmon et al.,
1977). The JJA mean may smooth out the transient activity of
the secondary circulations. Nonetheless, considering the modest
meandering of the summertime subtropical westerly jet, the gen-
eration of the low-level vorticity due to the secondary circulation
should be confined near the JJA mean jet streams. In fact, the
observed 850-hPa cyclonic vorticity over Korea and Japan is
placed around the upper-level jet streak and is generally running
parallel with the activity center of the eastward winds. This may
be indicative of close connection between the upper- and low-
level circulations. Two more local extremes could be also
identified: the cyclonic vorticity over Manchuria and the negative
vorticity over the northwestern Pacific Ocean. The former is
related to the synoptic-scale transient motions, whereas the
western Pacific subtropical high (WPSH) is the cause of the
latter.
Obviously the CTL fails to capture the positive vorticity around
the jet core as well as the negative vorticity over the western
North Pacific (Fig. 8b). Further analysis on monthly fields reveals
that in July the simulated 200-hPa jet with a maximum strength of
about 25 m s−1 migrates toward higher latitude (figure not shown),
while the observed one yet stays over South Korea and central
Japan with an enhanced intensity of about 30 m s−1. Recently
Sampe and Xie (2010) showed that the westerly jets anchor the
frontal rainband by steering weather disturbances and promote
convection through convective instability and adiabatic updrafts.
Fig. 8. The JJA mean 200-hPa zonal winds (contours, m s−1
) and 850-hPa relative vorticity (shadings, 105
s−1
) in 1993 for (a) the observation, (b) theCTL, (c) the SWG and (d) SWT. Contour intervals for observation (simulations) are 5 within ± 30 (25) and 1.5 (2.5) outside.
176 ASIA-PACIFIC JOURNAL OF ATMOSPHERIC SCIENCES
As such, the rapid movement and the weak intensity of the jet
would be a primary reason for the poor performance of the 850-
hPa vorticity. In contrast, the results of the Goddard scheme in
Figs. 8c and 8d display appreciable improvements. The 200-hPa
westerly winds tend to become stronger. Furthermore, the
northeast-southwest tilt of the monsoon front and the subtropical
high over the western north Pacific depicted by the low-level
vorticity are reproduced reasonably well.
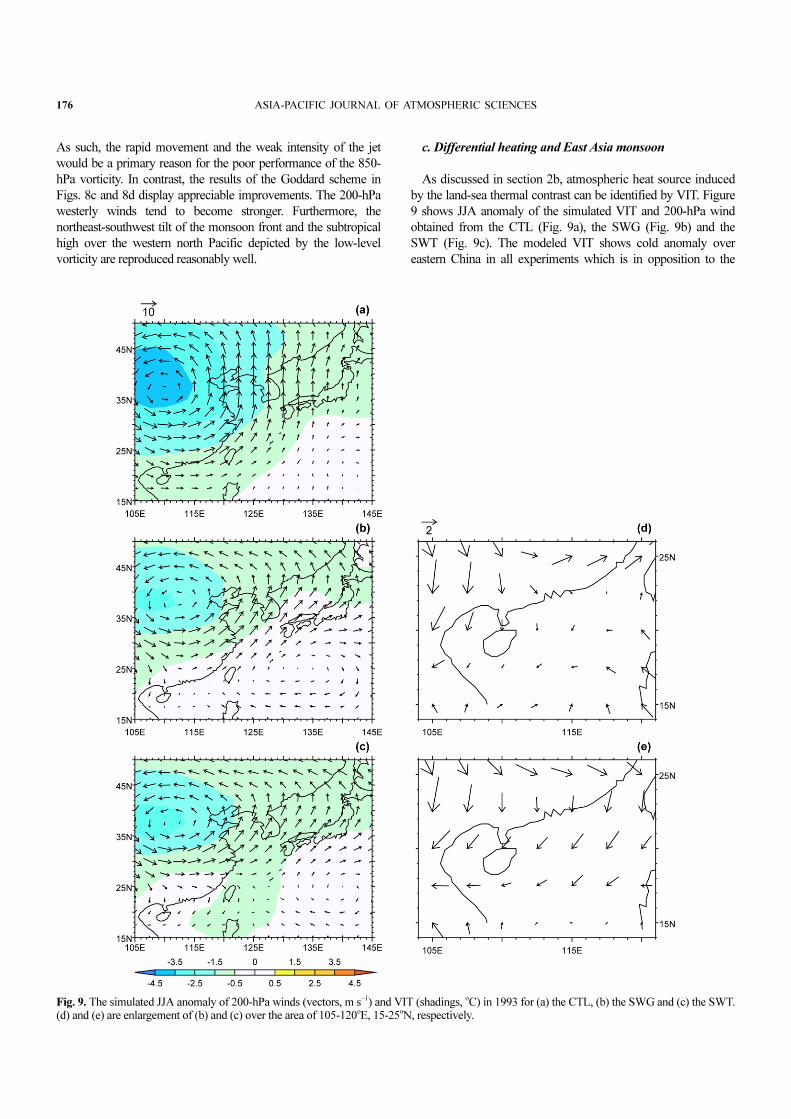
c. Differential heating and East Asia monsoon
As discussed in section 2b, atmospheric heat source induced
by the land-sea thermal contrast can be identified by VIT. Figure
9 shows JJA anomaly of the simulated VIT and 200-hPa wind
obtained from the CTL (Fig. 9a), the SWG (Fig. 9b) and the
SWT (Fig. 9c). The modeled VIT shows cold anomaly over
eastern China in all experiments which is in opposition to the
Fig. 9. The simulated JJA anomaly of 200-hPa winds (vectors, m s−1
) and VIT (shadings, oC) in 1993 for (a) the CTL, (b) the SWG and (c) the SWT.
(d) and (e) are enlargement of (b) and (c) over the area of 105-120oE, 15-25oN, respectively.

28 February 2011 Hyung-Jin Kim and Bin Wang 177
observed warm anomaly. However, the simulated 200-hPa wind
anomalies differ among the experiments. The CTL simulation,
for example, is amiss with the observed features of the
northeasterlies over southern China, showing prevailing eastward
wind anomalies. Meanwhile, the rest illustrates improved wind
anomalies due to the weakening of the cold VIT anomaly. And
again, the SWT is in best agreements with observation, repro-
ducing to some degree the enhanced northeasterly over southern
China (see Figs. 9d and 9e for close-ups of Figs. 9b and 9c).
The accompanied low-level branch of the monsoon flows
also becomes relatively realistic in the SWG and the SWT. In
observations, the anomalous northwesterly and southwesterly
meet around 30oN over eastern China and coincide with the
enhanced rainfall. This convergence zone extends farther to the
east (Fig. 10a). In the CTL, in comparison, the anomaly conver-
gence zone reaches far more northward, resulting in unrealistic
negative rainfall over central and eastern China, South Korea,
and southern Japan where the observation shows normal or
above-than-normal precipitation (Fig. 10b). On the other hand,
the anomalous low-level winds in the SWG and the SWT
converge at below 35oN and the confluent winds extend to the
east of Japan (Figs. 10c and 10d). This rectifies the fictitious
negative rainfall anomaly over South Korea and southern Japan
simulated in the CTL. However, the southwesterly flows over
southeastern China and related precipitation are seriously
exaggerated regardless of the choice of radiation scheme and top
boundary.
d. Quantitative evaluations
In order to quantitatively assess the sensitivity of the WRF
model, the Taylor diagram analysis (Taylor 2001) is applied to
the seasonal anomaly (Fig. 11). The Taylor diagram is able to
provide three statistics such as ratio of the variances, pattern
correlation, and centered root-mean-square (RMS) difference
between the model-simulated and observed patterns in a concise
and easily interpretable manner. Note that all statistics shown in
Fig. 11 are area-weighted values.
The correlation coefficient measured by the angle that each
symbol makes with abscissa is increased from the CTL (black)
to the results with the Goddard scheme (blue for the SWG and
red for the SWT). This is especially the case for the temperature
fields, such as temperature gradient and VIT, due to the primary
impact of shortwave radiation parameterization on a model’s
thermal structure. The normalized standard deviation gauged by
the radial distance from the origin to each symbol also tends to
Fig. 10. The simulated JJA anomaly of 850-hPa winds (vectors, m s−1) and precipitation (shadings, mm d−1) in 1993 for (a) the observation, (b) theCTL, (c) the SWG and (d) the SWT.

178 ASIA-PACIFIC JOURNAL OF ATMOSPHERIC SCIENCES
approach the observed.
Of particular note is that the SWG and the SWT are distin-
guishable from each other with the SWT showing slightly
improved simulations. The stratospheric thermal structure of the
SWT would be influenced additionally by diffusion processes as
the elevated top boundary is also favorable for them to occur.
However, radiative effects (especially, ozone heating) generally
outstrip vertical mixings. Hence it can be said that inclusion of
ozone maximum height in association with the extended model
top could play a nontrivial role in the EASM simulation.
5. Summary and concluding remarks
Shortwave radiation is one of the fundamental driving forces
on seasonal or longer timescale numerical simulation (Kim et
al., 2009). In spite of its essential role, very few studies have
been devoted to the effects of solar radiation parameterization on
RCM simulation. In this context, the authors examined the
WRF model’s sensitivity in simulating the EASM in 1993 to the
different choice of solar radiation parameterizations. Furthermore,
it was investigated that to what extent the model simulations are
affected by ozone absorption of shortwave radiation. To this end,
atmospheric large-scale features obtained from three different
numerical experiments were analyzed and compared with the
observations with particular focus on the fidelity of the repro-
duced summertime mean and its climatological anomaly.
The use of the Goddard scheme exerts profound influence on
representing the observed seasonal mean and anomaly of zonal
mean air temperature and its latitudinal gradient as well as the
VIT in the summer of 1993. As a consequence, the SWG and the
SWT compare more favorably than the CTL to the observations
in modeling the upper- and lower level winds. Besides, the
contributing role of ozone attenuation and vertical resolution is
unveiled by comparing the SWG and the SWT. A plausible
explanation is the means by which the increased vertical layers
above 50 hPa leads to a refined and realistic shortwave heating
rate in the SWT, which after all results in the improved air
temperature. A statistical evaluation confirms the nontrivial role
of the advanced radiation scheme and the inclusion of ozone
maximum height on the EASM simulation.
However, it should be pointed out that our study uses the
Betts-Miller-Janji and the Lin schemes for convective and non-
convective rain processes, even though there are many other
parameterizations in the WRF model. The different combination
of the precipitation schemes may result in different precipitation
patterns, which affects the atmospheric temperature through
latent heat release. In addition, the choice of an abnormal case
could undermine the generality of the present study. Therefore
further sensitivity tests to precipitation parameterizations and
weather conditions (e.g., dry and/or normal years) are needed to
′c
Fig. 11. Taylor diagram for the modeled JJA anomaly obtained from the CTL (black), the SWG (blue) and the SWT (red) experiment. The cross atthe unit point on the abscissa indicates observation (U: Latitude-height cross section of zonal winds, V200: Meridional winds at 200 hPa, DELT:Latitudinal temperature gradient, VIT: Vertically integrated temperature, RV850: Relative vorticity at 850 hPa, PR: Precipitation).

28 February 2011 Hyung-Jin Kim and Bin Wang 179
assure the results discussed here.
Despite of such limitations, the importance of inclusion of
ozone maximum height has a considerable implication. Yu et
al. (2004) showed observational evidences for the relationship
between the lower stratospheric temperature change and upper
tropospheric cooling trend over East Asia during July and
August. Xin et al. (2006) further suggested that the upper-trop-
ospheric cooling induces an anomalous meridional cell with
descending (ascending) motion occurring beneath (to the south
of) the cooling region, which explains the decadal change of the
precipitation over South China. These features appear to be
reproducible in a numerical model (Xin et al., 2008). Further-
more, the Tibetan Plateau -the origin of the elevated heat source
for the Asian monsoon- is known as an active region of
troposphere-stratosphere interaction due to extremely active deep
convection during summer. As a result, ozone depletion was
found to be significant (Tobo et al., 2008). The impact of ozone
variation and its radiative effects on EASM, however, has been
overlooked for decades. Therefore careful treatment for the
ozone solar heating conducted in this study could be used as an
effective methodology to fill such gap.
Acknowledgments. We thank the anonymous reviewers for
valuable and insightful comments which significantly help to
improve the manuscript. This study was supported by Ministry of
Environment of Korea as "The Eco-technopia 21 project". B.
Wang also acknowledges support from the Korea Meteorological
Administration Research and Development Program under Grant
RACS 2010-2017.
REFERENCES
Adler, R. F., and Coauthors, , 2003: The Version 2 Global Precipitation
Climatology Project (GPCP) monthly precipitation analysis (1979-
present). J. Hydrometeorol., 4, 1147-1167.
Blackmon, M. L., J. M. Wallace, N.-C. Lau, and S. L. Mullen, 1977: An
observational study of the Northern Hemisphere wintertime circulation.
J. Atmos. Sci., 34, 1040-1053.
Chen, F., and J. Dudhia, 2001: Coupling an advanced land-surface/hydrology
model with the Penn State/NCAR MM5 modeling system. Part I: Model
description and implementation. Mon. Wea. Rev., 129, 569-585.
Chou, M.-D., and M. J. Suarez, 1999: A shortwave radiation param-
eterization for atmospheric studies. NASA Tech. Memo., 15(104606),
40 pp.
Davis, C. A., K. W. Manning, R. E. Carbone, S. B. Trier, and J. D. Tuttle,
2003: Coherence of warm season continental rainfall in numerical
weather prediction model. Mon. Wea. Rev., 131, 2667-2679.
Ding, Y.-H., 1992: Summer monsoon rainfall in China. J. Meteor. Soc.
Japan., 70(1B), 373-396.
Dudhia, J., 1989: Numerical study of convection observed during the winter
monsoon experiment using a mesoscale two-dimensional model. J.
Atmos. Sci., 46, 3077-3107.
Dyer, A. J., and B. B. Hicks, 1970: Flux-gradient relationships in the
constant flux layer. Quart. J. Roy. Meteor. Soc., 96, 715-721.
Fortuin, A. P. F., and H. Kelder, 1998: An ozone climatology based on
ozonesonde and satellite measurements. J. Geophys. Res., 103, 31, 706-
31, 734.
Fu, Q., and K. N. Liou, 1992: On the correlated k-distribution method for
the radiative transfer in nonhomogeneous atmospheres. J. Atmos. Sci.,
49, 2139-2156.
Giorgi, F, and L. O. Mearns, 1999: Introduction to special section:
Regional climate modeling revisited. J. Geophys. Res., 104, 6335–6352.
Goswami, B. N., and P. K. Xavier, 2005: ENSO control on the south Asian
monsoon through the length of the rainy season. Geophys. Res. Lett.,
32, L18717, doi:10.1029/2005GL023216.
He, H., C.-H. Sui, M. J. Jian, Z. Wen, and G. Lan, 2003: The evolution of
tropical temperature field and its relationship with onset of Asian
summer monsoon. J. Meteor. Soc. Japan., 81, 1201-1223.
Hong, S.-Y., Y. Noh, and J. Dudhia, 2006: A new vertical diffusion
package with an explicit treatment of entrainment processes. Mon. Wea.
Rev., 134, 2318-2341.
Iacono, M. J., E. J. Mlawer, S. A. Clough, and J.-J. Morcrette, 2000: Impact
of an improved longwave radiation model, RRTM, on the energy budget
and thermodynamic properties of the NCAR community climate model,
CCM3. J. Geophys. Res., 105(D11), 14, 873-14, 890, doi:10.1029/
2000JD900091.
Janji , Z. I., 1994: The step-mountain Eta coordinate model: Further
developments of the convection, viscous sublayer, and turbulence closure
schemes. Mon. Wea. Rev., 122, 927-945.
Kanamitsu, M., W. Ebisuzaki, J. Woollen, S.-K. Yang, J. J. Hnilo, M.
Fiorino, and G. L. Potter, 2002: NCEP-DOE AMIP-II Reanalysis (R-2).
Bull. Amer. Meteor. Soc., 83, 1631-1643.
Kang, H.-S., D.-H. Cha, and D.-K. Lee, 2005: Evaluation of the mesoscale
model/land model (MM5/LSM) coupled model for East Asian summer
monsoon simulations. J. Geophys. Res., 110, D10105, doi:10.1029/
2004JD005266.
Kawamura, R., and T. Murakami, 1998: Baiu near Japan and its relation to
summer monsoons over Southeast Asia and the western North Pacific.
J. Meteorol. Soc. Jpn., 76, 619-639.
Kim, H.-J., I.-U. Chung, and K.-T. Lee, 2009: Effects of an advanced
radiation parameterization on a troposphere-stratosphere AGCM
simulation. Asia-Pacific J. Atmos. Sci., 45, 439-462.
Knievel, J. C., D. A. Ahijevych, and K. W. Manning, 2004: Using temporal
modes of rainfall to evaluate the performance of a weather prediction
model. Mon. Wea. Rev., 132, 2995-3009.
Lee, D.-K., and M.-S. Suh, 2000: Ten-year East Asian summer monsoon
simulation using a regional climate model (RegCM2). J. Geophys. Res.,
105, 29,565-29,577.
______, H.-S. Kang, and K.-H. Min, 2002: The role of ocean roughness in
regional climate modeling: 1994 East Asia summer monsoon case. J.
Meteor. Soc. Japan., 80, 171-189.
______, D.-H. Cha, and H.-S. Kang, 2004: Regional climate simulation of
the 1998 summer flood over East Asia. J. Meteor. Soc. Japan., 82, 1735-
1753.
Lin, Y-L, R. D. Farley, and H. D. Orville, 1983: Bulk parameterization of
the snow field in a cloud model. J. Climate. Appl. Meteor., 22, 1065-
1092.
Liou, K. N., 2002: An Introduction to Atmospheric Radiation., Elsevier.,
583pp
Lo, J. C.-F., Z.-L. Yang, and R. A. Pielke Sr., 2008: Assessment of three
dynamical climate downscaling methods using the Weather Research
and Forecasting (WRF) model. J. Geophys. Res., 113, D09112,
doi:10.1029/2007JD009216.
Mlawer, E. J., S. J. Taubman, P. D. Brown, M. J. Iacono, and S. A. Clough,
1997: Radiative transfer for inhomogeneous atmospheres: RRTM, a
validated correlated-k model for the longwave. J. Geophys. Res.,
102(D14), 16, 663-16, 682, doi:10.1029/97JD00237.
Park, C.-K., and S. D. Schubert, 1997: On the nature of the 1994 East Asian
summer drought. J. Climate, 10, 1056-1070.
Paulson, C. A., 1970: The mathematical representation of wind speed and
temperature profi les in the unstable atmospheric surface layer. J. Appl.
Meteor., 9, 857-861.
′c

180 ASIA-PACIFIC JOURNAL OF ATMOSPHERIC SCIENCES
Salathé, E. P., L. R. Leung, Y. Qian, and Y. Zhang, 2010: Regional climate
model projections for the State of Washington. Climatic Change, 102,
51-75.
Sampe, T. and S.-P. Xie, 2010: Large-scale dynamics of the Meiyu-Baiu
rain band: Environmental forcing by the westerly jet. J. Climate, 23,
113-134.
Skamarock, W. C., J. B. Klemp, J. Dudhia, D. O. Gill, D. M. Barker, W.
Wang, and J. G. Powers, 2005: A Description of the Advanced Research
WRF Version 2. NCAR/TN-468+STR, 88 pp.
Taylor, K. E., 2001: Summarizing multiple aspects of model performance in
a single diagram. J. Geophys. Res., 106, 7183-7192.
Tobo, Y., Y. Iwasaka, D. Zhang, G. Shi, Y.-S. Kim, K. Tamura, and T.
Ohashi, 2008: Summertime ‘‘ozone valley’’ over the Tibetan Plateau
derived from ozonesondes and EP/TOMS data. Geophys. Res. Lett., 35,
L16801, doi:10.1029/2008GL034341.
Ueda, H. and T. Yasunari, 1998: The role of warming over the Tibetan
Plateau in early onset of the summer monsoon over the Bay of Bengal
and the South China Sea. J. Meteor. Soc. Japan., 76, 1-12.
Uppala, S. M., P. W. Kallberg, A. J. Simmons, U. Andrae, V. da Costa
Bechtold, M. Fiorino, J. K. Gibson, J. Haseler, A. Hernandez, G. A.
Kelly, and X. Li, 2005: The ERA-40 Reanalysis. Quart. J. Roy. Meteor.
Soc., 131, 2961-3012.
Wang, W.-C., W. Gong, and H. Wei, 2000: A regional model simulation of
the 1991 severe precipitation event over the Yangtze-Huai river valley.
Part I: Precipitation and circulation statistics. J. Climate, 13, 74-92.
Webb, E. K., 1970: Profile relationships: The log-linear range, and
extension to strong stability. Quart. J. Roy. Meteor. Soc., 96, 67-90.
Wicker, L. J., and W. C. Skamarock, 2002: Time-splitting methods for
elastic models using forward time schemes. Mon. Wea. Rev., 130, 2088-
2097.
Xin, X., R. Yu, T, Zhou, and B. Wang, 2006: Drought in late spring of
South China in recent decades. J. Climate, 19, 3197-3206.
______, Z. Li, R. Yu, and T. Zhou, 2008: Impacts of upper tropospheric
cooling upon the late spring drought in East Asia simulated by a regional
climate Model. Adv. Atmos. Sci., 25, 555-562.
Yoo, S.-H., C.-H. Ho, S. Yang, H.-J. Choi, and J.-G. Jhun, 2004: Influence
of tropical western and extratropical Pacific SST on East and Southeast
Asia climate in the summer of 1993-94. J. Climate, 17, 2673-2687.
Yu, R., B. Wang, and T. Zhou, 2004: Tropospheric cooling and summer
monsoon weakening trend over East Asia. Geophys. Res. Lett., 31,
L22212, doi:10.1029/2004GL021270.
Zhang, Y., X. Kuang, W. Guo, and T. Zhou, 2006: Seasonal evolution of the
upper-tropospheric westerly jet core over East Asia. Geophys. Res. Lett.,
33, L11708, doi:10.1029/2006GL026377.
Zhou, T.-J., and R.-C. Yu, 2005: Atmospheric water vapor transport
associated with typical anomalous summer rainfall patterns in China. J.
Geophys. Res., 110, D08104, doi:10.1029/2004JD005413.