
Sensitivity of Investor Reaction to Market Direction and ...
31
Sensitivity of Investor Reaction to Market Direction and Volatility: The Case of Dividend Change Announcements Diane Scott Docking Northern Illinois University Department of Finance DeKalb, IL 60115 (815)-753-6396 [email protected] Paul D. Koch School of Business University of Kansas Lawrence, KS 66045 (913)-864-7503 [email protected] February 2004 ____________________ JEL classification: G14; G19 We acknowledge the helpful comments of William Beedles, G. Robert Bowman, O. Maurice Joy, Donald Lien, David Plumlee, Scott Bauman, William Chittenden, Graham Partington, Ashok Robin, and an anonymous referee. We also gratefully acknowledge support from the University of Kansas GRF Grant #3487. Please do not quote without permission.
Transcript of Sensitivity of Investor Reaction to Market Direction and ...
Sensitivity of Investor Reaction to Market Direction and Volatility: The Case of Dividend Change Announcements
Diane Scott Docking Northern Illinois University
Department of Finance DeKalb, IL 60115
(815)-753-6396 [email protected]
Paul D. Koch School of Business
University of Kansas Lawrence, KS 66045
(913)-864-7503 [email protected]
February 2004 ____________________ JEL classification: G14; G19 We acknowledge the helpful comments of William Beedles, G. Robert Bowman, O. Maurice Joy, Donald Lien, David Plumlee, Scott Bauman, William Chittenden, Graham Partington, Ashok Robin, and an anonymous referee. We also gratefully acknowledge support from the University of Kansas GRF Grant #3487. Please do not quote without permission.

2
Sensitivity of Investor Reaction to Market Direction and Volatility: The Case of Dividend Change Announcements
Abstract
This study examines whether investor reactions are sensitive to the recent direction and/or volatility of underlying market movements. We find dividend change announcements elicit a greater change in stock price when the nature of the news (good or bad) goes against the grain of the recent market direction during volatile times. For example, announcements to lower dividends elicit a significantly greater decrease in stock price when market returns have been up and more volatile. Similarly, announcements to raise dividends tend to elicit a greater increase in stock price when market returns have been normal or down and more volatile, although this latter tendency lacks statistical significance. We suggest an explanation for these results that combines the implications of a dynamic rational expectations equilibrium model with behavioral considerations that link the responsiveness of investors to market direction and volatility. Key Words: dividend policy, rational expectations, overreaction, behavioral finance.
1
I. Introduction
Several studies document that economic and market conditions affect investor reactions
to otherwise identical events.1 These studies indicate that the recent direction of the market or
the recent state of the economy may have a bearing on the extent to which investors respond to
new information.
This paper contributes to the dialogue by considering the market’s recent volatility, as
well as its direction, to examine whether these market conditions affect investors’ responsiveness
to firm-specific news. We conduct an event study to assess investor reaction to dividend
increases or decreases. We partition a sample of dividend change announcements along two
dimensions, according to whether the recent market direction has been up, normal, or down, and
whether recent market volatility has been high, medium, or low. If these market conditions do
not affect investors’ responsiveness to firm-specific news, then we would expect identical event
study results across all subsamples of events. Instead, our results indicate the firm’s stock price
reaction to new information depends on the interaction of both market conditions.
First, we find announcements to reduce dividends elicit a significantly greater decline in
stock price when market returns have been up and volatile. Specifically, when the subsample of
dividend decrease announcements in an up and volatile market is compared with other
subsamples of events, the negative abnormal return is significantly larger in magnitude. Second,
we find announcements to increase dividends tend to elicit a greater increase in stock price when
recent market returns have been normal or down, and volatile. However, this second tendency
lacks statistical significance across subsamples based on different combinations of market
conditions.
1 See Fabozzi and Francis (1977), Goldberg and Vora (1981), Klein and Rosenfeld (1987), Bowman et al. (1995), and Boyd et al. (2001).

2
The first result is consistent with implications of the dynamic rational expectations
equilibrium model by Veronesi (1999), while the second tendency is not. The lack of statistical
significance of the second tendency makes it more palatable in light of Veronesi’s model. Still,
this latter tendency calls for an explanation beyond that provided in Veronesi’s model. We
suggest an explanation that reconciles both results, based on behavioral considerations that build
upon the probabilistic framework in Veronesi (1999). These behavioral considerations are
motivated by the work of Epstein and Turnbull (1980) and Robichek and Myers (1966).2
II. Background
An explanation for the results found in this study requires a linkage between the nature of
the news about the firm (i.e., whether it is good or bad news) and the recent direction and
volatility of the market (i.e., the economic backdrop against which the news is announced). We
develop this linkage by first contrasting the implications of market efficiency with the growing
literature on behavioral finance. We then establish a link between market direction and the
nature of firm-specific news, by summarizing recent work that documents and models divergent
market behavior in up versus down markets. Finally, we build upon the spirit of Veronesi’s
(1999) model by introducing the potential influence of recent market volatility on the extent of
investors’ reaction to good or bad firm-specific news, as discussed in Epstein and Turnbull
(1980) and Robichek and Myers (1966).
A. Recent Market Conditions, Market Efficiency, and Behavioral Finance
Our results indicate that firm-specific news is perceived as more important (i.e., has a
greater impact on stock returns) when the nature of the news goes against the recent direction of
2 For both sides of the behavioral finance dialogue, see Barberis et al. (1998), Daniel et al. (1998), DeBondt and Thaler (1985, 1987), Elton et al. (1998), Fama (1998), Fama and French (1996), and Odean (1998). An extensive review of this literature can be found in Shefrin (2000).

3
the market during volatile times. In particular, we find good (bad) news tends to be perceived as
better (worse) news when the underlying market is down (up) and more volatile. Thus, identical
economic events tend to provoke different market reactions depending upon the recent direction
and volatility of the market. These results initially appear inconsistent with the basic premise of
market efficiency, that investment decisions reflect investors' rationally formed expectations.
Following this premise, the notion of semi-strong form efficiency suggests that security prices
should adjust identically to identical information events, within limits reflecting transactions
costs and information costs.
One counter viewpoint is that group psychology and irrational behavior may also drive
investment decisions to some degree.3 Daniel et al. (1998) and Barberis et al. (1998) construct
models of investor sentiment aimed at reconciling the empirical findings of overreaction and
underreaction. Both studies use concepts from psychology to support their framework.4
Psychologists have long understood that no piece of information stands alone, arguing
that information cannot be interpreted unless one knows the context in which it has been related.
The psychological term, “frame reference,” expresses the importance of context and implies that
information is colored by the circumstances in which it is presented (Allport 1940). Similarly,
behavioral finance theories postulate that investors’ perceptions of risk and return are influenced
by how decision problems are framed. Shefrin (2000) terms this behavior “frame dependence.”
3 Shiller (1987) argues that the 1987 crash is related to the internal dynamics of investor thinking. Scharfstein and Stein (1990) suggest that investors and professional managers will "follow the herd." Consistent with this view, Jegadeesh and Titman (1993) identify a short-term momentum effect in which stocks with high returns over the past year tend to have high returns over the following three to six months. 4 Daniel et al. (1998) base their theory on the notion of overconfidence and biased self-attribution. Their theory implies that investors overreact to private information signals and underreact to public information signals. Barberis et al. (1998) propose a model in which a run of earnings changes with the same sign leads investors to perceive an earnings trend. Once investors are convinced that a trending regime holds, they may incorrectly extrapolate the trend so that the stock price overreacts. To the extent that earnings follow a random walk or are mean-reverting, there will be an eventual reversal of long-term returns that exposes the overreaction.

4
Behavioral finance theories assume that framing effects may cause market prices to
deviate from fundamental values. Burr (1997) shows that people alter choices depending on how
a problem is framed, and they tend to be more concerned about losses than gains. Evidence of
frame dependence is also provided by Kahneman and Tversky (1979) in their work on prospect
theory. In this light, firm-specific information (such as a dividend change announcement)
received in a market context of good times and high uncertainty can be interpreted differently
than if it is received in a context of bad times and low uncertainty.
B. Recent Market Direction and Market Behavior
An empirical link between prevailing market direction and event study results has been
established in the recent literature. Fabozzi and Francis (1977) first questioned whether bull and
bear markets influenced individual security returns, but found that bull and bear markets yield
similar market model estimates. In contrast, Goldberg and Vora (1981) found security returns
varied with the magnitude and direction of stock market returns, and high β securities displayed
higher estimates of β in up markets than in down markets while low β securities displayed lower
estimates of β in up markets than in down markets.
Klein and Rosenfeld (1987) expanded upon the research of Fabozzi and Francis (1977)
by showing that certain event study models produced divergent results if the events took place
during either bull (up) or bear (down) markets.5 Bowman et al. (1995), also investigate the
effect of underlying market conditions on a sample of major dividend change announcements.6
Both the Klein and Rosenfeld (1987) and Bowman et al. (1995) studies imply that event study
5 To ascertain if the underlying market direction influenced an individual firm’s returns, Klein and Rosenfeld (1987) conducted a simulation and analyzed a sample of voluntary corporate sell-off announcements. 6 Bowman et al. (1995) show that for the [-1, 0] announcement period the market model and market-adjusted returns model yield abnormal returns that are mostly independent of underlying market conditions, while the mean-adjusted returns and raw market returns models do not.

5
results can be influenced by the general direction of underlying market movements prevailing at
the time of the announcement.
C. Recent Market Direction, Volatility, and Abnormal Returns
Several studies suggest that security price behavior may be sensitive to the recent
volatility of the underlying market.7 For example, Robichek and Myers (1966) and Epstein and
Turnbull (1980) show that the pattern of expected returns over time partly depends upon the
resolution of overall uncertainty. They argue that early resolution of uncertainty has a positive
effect upon price, for it allows individuals to revise their consumption and investment decisions
to compensate for unfavorable outcomes or take advantage of possible favorable outcomes.
These latter two studies suggest that news arriving in a context of greater overall market
uncertainty (high volatility) resolves more ambiguity than when the same information is received
in a more certain (low volatility) environment. Firm-specific news may be more informative
during periods of high market volatility because individuals are willing to more drastically revise
their subjective beliefs regarding future cash flows in times of greater overall uncertainty.8
D. Veronesi’s Dynamic Rational Expectations Equilibrium Model
Veronesi (1999) builds a dynamic model of asset prices based on rational economic
decision-making, to establish a theoretical linkage between market direction and the extent of
investors’ responsiveness to firm-specific information. According to Veronesi’s model, firm-
specific news that goes against the grain of the recent market direction increases investor
uncertainty about the future course of events, causing investors to discount the new information
7 See, for example, Campbell and Hentschel (1992), Epstein and Turnbull (1980), Randolph (1991), and Robichek and Myers (1996). 8 Epstein and Turnbull (1980) state that the overall market risk associated with a firm is reduced by the arrival of asset-specific information. This implies that, the greater the overall market risk (volatility), the greater the impact of the asset-specific information received.

6
at a higher rate. That is, investors discount good news at a higher rate if it is announced during
bad times, and investors discount bad news at a higher rate if it is announced during good times.
For example, consider an announcement to decrease dividends when the market has been
up. According to Veronesi (1999), the fact that this bad news arrives during good times increases
uncertainty about the firm’s prospects. This increase in uncertainty leads investors to discount
the lower expected future stream of dividends at a higher rate, exacerbating the downward
adjustment in stock price. Thus, bad news is perceived as worse news when times are good.
Similarly, investors apply a higher discount rate to good news if the recent market
direction has been down. Since this good news is announced during bad times, the information
once again increases investors’ uncertainty about the future course of dividends, leading them to
discount the higher expected future stream of dividends at a higher rate. However, in this case
the higher uncertainty and discount rate attenuate the upward adjustment in stock price resulting
from the good news. Thus, Veronesi’s model implies asymmetric behavior for investors: they
will overreact to bad news in good times, but underreact to good news in bad times.9
E. The Influence of Both Market Direction and Volatility
We build upon the framework of Veronesi (1999) by suggesting that, in addition to recent
market direction, market volatility reflects an important dimension of uncertainty that also has a
bearing on how investors perceive firm-specific news. We focus on the notion that any firm-
specific news may be perceived as more important or informative if announced in a more volatile
marketplace (Epstein and Turnbull 1980, Robichek and Myers 1966). The presence of higher
market volatility likely reflects greater uncertainty about overall equity valuation that may
translate into greater uncertainty about individual firm performance, which can be resolved with

7
firm-specific information. Thus, in a volatile market, firm-specific good or bad news may
represent a “greater surprise” and serve to go further in alleviating the greater uncertainty about
individual firm performance, leading to a greater change in expected future cash flows for the
firm. As a result, good or bad firm-specific news may elicit a greater investor reaction if
announced in a more volatile market.10
In this scenario, firm-specific news is more informative when the overall market is more
volatile, magnifying investors’ revisions of expected future cash flows after a firm-specific
announcement. When this effect of market volatility is combined with Veronesi’s (1999)
influence of market direction, both market conditions become important in determining the
extent of the market’s revised valuation following a firm-specific announcement. It is
noteworthy that, while both market direction and volatility may now influence the extent of the
market’s reaction to firm-specific information, one condition works on the numerator of market
value while the other condition influences the denominator. That is, greater market volatility
increases the importance of firm-specific information by magnifying the change in expected
future cash flows. This effect on the numerator of market value contrasts with the discount rate
effect in Veronesi’s model, in which good or bad news that goes against the grain of the market’s
direction increases uncertainty and thus the rate at which investor’s discount the expected future
cash flows following a firm-specific announcement.
In this light, when both recent market direction and volatility are considered, we deduce
the following two contrasting implications for the arrival of bad news and good news,
9 Veronesi’s (1999) first result coincides with our first finding that investors overreact to bad news (dividend decreases) in good times (an up market), but his latter result is inconsistent with our second finding that investors also tend to overreact to good news (dividend increases) in bad times (a down market). 10 These ideas are consistent with the recent behavioral finance theory that focuses on “frame dependence” (Allport, 1940, and Shefrin, 2000), and related theories that emphasize how the resolution of overall market uncertainty affects asset-specific valuation (Epstein and Turnbull, 1980, and Robichek and Myers, 1966).

8
respectively. First, the market’s reaction to bad news is unambiguously exacerbated if the
overall market has been up and more volatile. If bad news is announced in an up market, the
increased discount rate applied by investors to account for the greater uncertainty (according to
Veronesi, 1999) implies that bad news is perceived as worse news. In addition, the presence of
greater overall market volatility exacerbates this effect, as investors perceive the bad news as
being more informative in a volatile market. Together, these two forces reinforce one another,
leading to an unambiguous tendency for investors to overreact to bad news in this situation.
Second, the market’s tendency to over- or underreact to good news is ambiguous if
announced in a down and volatile market. If good news is announced in a down market, the
increased discount rate applied by investors to account for the greater uncertainty (according to
Veronesi, 1999) diminishes the increase in value resulting from the good news. On the other
hand, if the market is more volatile this effect is counteracted by investors’ perception that the
good news is more informative in a volatile market. These two countervailing forces lead to an
ambiguous result in which the market may over- or underreact, depending upon which force
outweighs the other in this situation.
Our first documented event study result provides statistical support for the first situation
discussed above, in which bad news is unambiguously perceived as worse news in an up and
volatile market. The lack of statistical significance of our second result is consistent with our
explanation for the second situation discussed above, in which the countervailing forces tend to
offset one another, leading to an ambiguous tendency for market over- or underreaction, and a
lack of statistical significance or robustness across subsamples in that situation.11
11 Other explanations for these results might include the concern that traditional event study methodology is fundamentally flawed, or that results represent a short-horizon market efficiency anomaly. That is, the single-index market model may not adequately account for expected returns for a given firm since it ignores the potential influence of recent market conditions, as well as firm-specific characteristics such as book-to-market equity, size,

9
III. Data
A. The Data
Dividend changes are chosen for this analysis because they: (i) represent an important
economic event, (ii) have attracted considerable prior research, (iii) occur frequently enough to
produce adequate samples for testing, (iv) can produce either positive or negative reactions, and
(v) allow one to form a priori theoretical expectations of event study results; i.e., dividend
increases (decreases) are typically associated with positive (negative) abnormal returns.12
We use the 1997 NYSE, AMEX, and NASDAQ distribution files from the Center for
Research in Security Prices (CRSP) listing stocks from July 2, 1962 through December 31, 1997.
We identify changes in ordinary, quarterly cash dividends occurring between consecutive
quarters. The percentage change in dividends serves as the dividend surprise variable. To
enhance the power of the test, only substantial dividend changes are included in the sample.
Consistent with Aharony and Swary (1980) and Bowman et al. (1995), substantial dividend
changes are defined as those events meeting the following criteria: (i) the absolute change in
and dividend yield (Fama and French 1988, 1992, 1993, 1995). Since all models for expected returns are incomplete descriptions of the systematic patterns in average returns during any sample period, all tests of efficiency are contaminated by the inadequate-model problem. Fama (1998) suggests the inadequate-model problem is less serious in event studies that focus on short return windows. 12In this study, we assume that dividend increases are normally associated with in increase in stock price (good news); while dividend decreases are normally associated with a decline in stock price (bad news). This assumption is grounded in considerable prior research. For example, see Pettit (1972); Aharony and Swary (1980); Asquith and Mullins (1983); Eades, Hess, and Kim (1985); Kalay and Loewenstein (1985); Ghosh and Woolridge (1989); Bajaj and Vijh (1990); Dhillon and Johnson (1994); Guay and Harford (2000), and Best and Best (2001). Of course, individual investors may not always interpret a dividend increase (decrease) as good (bad) news. Often it is the circumstances surrounding an action that make it either good or bad. For example, a firm might decide to cut its dividend in an up market because an up market implies better growth opportunities in the form of new profitable projects, and it might make sense for a company to cut dividends (rather than issue stock) to fund these new profitable projects. So a cut in dividends might signal better growth opportunities. Similarly, an increase in dividends might signal a lack of growth opportunities. The bad news in this case is lack of growth opportunities, while the good news is that the company would not waste money on unprofitable projects, instead returning it to shareholders in the form of higher dividends. So an increase in dividends might send two messages, one negative (no growth opportunities) and one positive (we will not waste your money on unprofitable projects). It is not clear what the net effect of such mixed signals would be. For further discussion of these issues, see Statman and Sepe (1989). The authors wish to thank an anonymous referee for this insight.

10
dividends is at least three cents per share, and (ii) the absolute percentage change in dividends is
at least 50%. This screen initially yields 5,153 regular dividend change announcements. Since
CRSP does not report when a dividend amount equals zero, we cannot distinguish dividend
omissions or re-initiations. This study examines only regular dividend announcements,
excluding the initial dividend and any subsequent omissions and re-initiations.13
A firm can have two or more consecutive quarterly substantial dividend announcements.
In such cases, the first dividend change announcement lies in the estimation period of the second
dividend change announcement being tested. We define confounding events as two substantial
dividend changes occurring within six months (130 trading days). In such cases, we exclude the
subsequent announcement from the sample. We find a total of 654 confounding events, thus
decreasing the sample of dividend changes to 4,499 events.
We further screen the sample to ensure that complete returns are available beginning 130
days prior to the dividend announcement date. We also eliminate eight outliers (greater than five
standard deviations from the mean). These screens yield a final sample of 4,336 regular
announcements: 1,436 dividend increases and 2900 dividend decreases.14
B. Sample Partitioning
Suppose that investors price assets based in part on their expectations of the future trend and
volatility of the market. Furthermore, suppose that investor forecasts of expected market trend
and volatility are a function of recent market trend and volatility. In this light, we partition the
4,336 announcements according to the underlying market direction and volatility experienced
during the 30 trading day interval (approximately six weeks) preceding the event date [days -31,
13 Several dividend studies have shown that dividend initiations and omissions are different from regular dividend changes. See Sant and Cowan (1994), Christie (1994), Michaely et al. (1995), Szewczyk et al. (1997), and Robin (1998). 14 The analysis was also performed including the outliers, with similar results.

11
-2]. We label this interval the pre-announcement period, consistent with Klein and Rosenfeld
(1987) and Bowman et al. (1995). For this time frame, we calculate the mean and standard
deviation of daily value-weighted market index returns for each announcement. We then
partition the sample as follows:
(1) We rank the full sample of events according to the mean market returns experienced over this pre-announcement period, and partition the sample into quartiles. The up market is then defined as the quartile with the highest mean market returns, the down market as the lowest quartile, and the normal market as the middle 50%.
(2) We rank the full sample of events according to the standard deviations of market returns experienced over this pre-announcement period and partition the sample into quartiles. The high volatility market is then defined as the quartile with the highest standard deviations, the low volatility market as the lowest quartile, and the medium volatility market as the middle 50%.
(3) Within each category of market direction, we also classify into the analogous three categories of market volatility. That is, the sample is partitioned into nine cells to investigate the possible interactive influence of both market direction and volatility.
(4) For every cell in each partitioning scheme, we divide the sample into two parts to be analyzed separately: dividend increases and dividend decreases.
We then apply event study methodology to every subsample in this partitioning scheme.15
C. Pre-Announcement Period Sample Characteristics
Table 1 provides summary statistics for the sample of pre-announcement periods when
partitioning events by market direction and/or volatility.16 It is possible that the particular type
15 Klein and Rosenfeld (K&R, 1987) and Fabozzi and Francis (1977) follow a partitioning method where they define and identify historical bull and bear markets first, and then place the selected event dates in their respective pre-defined categories of market direction. Fabozzi and Francis (1977) use three alternative partitioning schemes to define bull and bear markets. Briefly, K&R's preferred scheme is as follows: for the 1970-1983 period, K&R define substantial up and substantial down months. Substantial moves are arbitrarily defined as months when the absolute value of the market's average monthly return is larger than half of one standard deviation of the market's average return measured over the total sample period. Months in which the market does not make substantial up or down movements are classified as normal markets. K&R then place all of the months over the sample period into either bull, normal, or bear categories based on trends; i.e., bull (bear) markets must contain a minimum of two consecutive upswings (downswings). Finally, K&R classify events by the type of month into which they fall. K&R's method of partitioning is not without faults. First, in their scheme, whether a market is classified as up or down depends upon the time period under scrutiny (e.g., 1970-1983 versus 1960-1997 versus 1930-1997). For example, March 1980 could be normal for the 1970-1983 period, but up for the 1960-1997 period. Second, using

12
of dividend change announced (increase or decrease) is associated with the market direction or
market volatility classification for that event. For example, it is possible that dividend increases
tend to be announced in up markets, or that dividend decreases are more often announced in
down markets. However, this does not appear to be the case in our sample. We find that firms
are only slightly more likely to announce a dividend increase in an up market (n = 374) rather
than in a down market (n = 350). Similarly, firms are only slightly more likely to announce a
dividend decrease in a down market (734) rather than in an up market (710). In a similar vein,
firms are roughly equally likely to announce a dividend increase in a high volatility market (363)
or low volatility market (369). Likewise, for dividend decreases, firms are almost as likely to
announce when market volatility is high (721) as when it is low (715).
When we partition the sample of events by either market direction or market volatility,
several empirical regularities appear. Randolph (1991) points out that market volatility tends to
be higher when stock prices are declining and lower when stock prices are advancing. Similarly,
Lockwood and McInish (1990) document that the variance of returns is greater during bear
markets than during bull markets. Thus, one might expect higher volatility (avg σ(Rm)) in a
down market (when the mean market return, avg(Rm), is low). This expectation is born out in
our results. Likewise, when the market is partitioned by volatility, the high volatility market
displays the lowest average market returns. These results characterize both dividend increases
and decreases, and corroborate the findings of Lockwood and McInish, and Randolph.
K&R's partitioning scheme, it is possible that all sample events could fall into the same category of underlying market direction. Our partitioning scheme is less sensitive to these concerns. 16 In Tables 1 – 4, for the 1,436 dividend increases, one might expect the (25%) - (50%) - (25%) partitioning scheme to yield proportional subsample sizes of (359) - (718) - (359). Likewise, for the 2,900 dividend decreases, one might expect proportional subsample sizes of (725) - (1,450) - (725). This is not the case in Tables 1 - 4 because the entire sample of 4,336 events is first ranked by market mean or market standard deviation, and the entire ranked sample is partitioned into quartiles. Only after this ranking and partitioning is the entire sample segregated into dividend increases and dividend decreases. Hence, while the entire sample of 4,336 events is partitioned according to the
13
When we partition by both market direction and volatility, Table 1 shows that, holding
market direction constant, the high volatility market produces the largest positive mean returns in
the up market and the largest negative mean returns in a down market. Likewise, holding
volatility constant, the down market in each volatility category usually has the greatest
volatility.17
IV. Empirical Results
A. Partitioning by Market Direction Alone
We use the standard event study methodology of Patell (1976) and Dodd and Warner (1983)
to estimate abnormal stock returns around the announcement of dividend changes, along with
their corresponding test statistics. We estimate the regression parameters using the single-index
model, and a 100-day estimation period that begins 130 trading days before the event date and
ends 31 trading days before the event date, [-130, -31].18 The event date (t = 0) is the dividend
declaration date listed on the CRSP Distribution File.
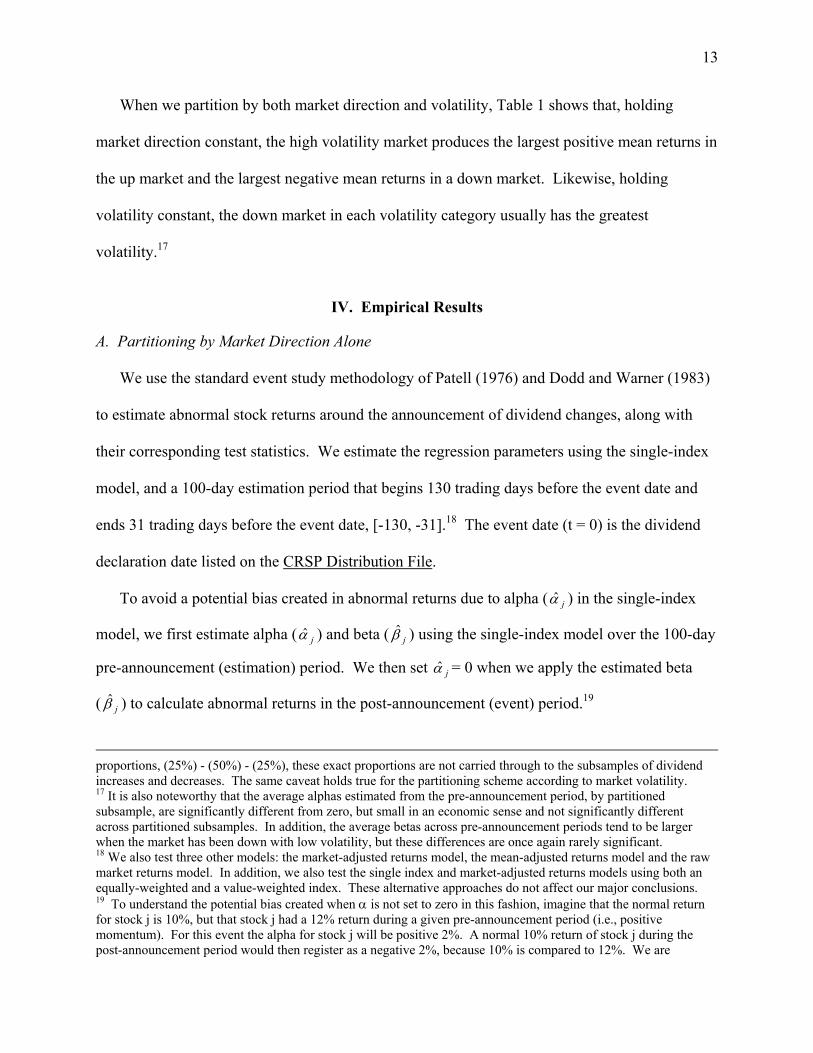
To avoid a potential bias created in abnormal returns due to alpha ( jα̂ ) in the single-index
model, we first estimate alpha ( jα̂ ) and beta ( jβ̂ ) using the single-index model over the 100-day
pre-announcement (estimation) period. We then set jα̂ = 0 when we apply the estimated beta
( jβ̂ ) to calculate abnormal returns in the post-announcement (event) period.19
proportions, (25%) - (50%) - (25%), these exact proportions are not carried through to the subsamples of dividend increases and decreases. The same caveat holds true for the partitioning scheme according to market volatility. 17 It is also noteworthy that the average alphas estimated from the pre-announcement period, by partitioned subsample, are significantly different from zero, but small in an economic sense and not significantly different across partitioned subsamples. In addition, the average betas across pre-announcement periods tend to be larger when the market has been down with low volatility, but these differences are once again rarely significant. 18 We also test three other models: the market-adjusted returns model, the mean-adjusted returns model and the raw market returns model. In addition, we also test the single index and market-adjusted returns models using both an equally-weighted and a value-weighted index. These alternative approaches do not affect our major conclusions. 19 To understand the potential bias created when α is not set to zero in this fashion, imagine that the normal return for stock j is 10%, but that stock j had a 12% return during a given pre-announcement period (i.e., positive momentum). For this event the alpha for stock j will be positive 2%. A normal 10% return of stock j during the post-announcement period would then register as a negative 2%, because 10% is compared to 12%. We are

14
In Table 2 we present the results for dividend increases and decreases when partitioning
by underlying market direction only. First consider the results for dividend increases shown in
Panel A of Table 2. Mean cumulative abnormal returns (MCARs) are significantly positive for
the total sample and for all three subsamples partitioned by market direction. The MCAR is
smallest for the up market (1.22%), slightly larger for the down market (1.34%), and largest for
the normal market (1.64%). However, these differences are not statistically significant
(F=1.44).20
According to Veronesi’s (1999) model, when a dividend increase(good news) is
announced during a down market (bad times), the new information increases investors’
uncertainty about the future course of dividends, leading them to discount the higher expected
future stream of dividends at a higher rate. This implies investors underreact to good news in
bad times. Thus, according to Veronesi’s model, the down market should experience the
smallest positive MCAR. Our results show little evidence to support this implication of
Veronesi’s (1999) model.
Next consider dividend decreases in Panel B of Table 2. In this Panel we show MCARs
that are significantly negative for the total sample and for all subsamples. The up market yields
the largest negative MCAR (-1.08%), while the normal and down markets yield smaller negative
indebted to a referee for pointing out this potential source of bias in our event study results. We provide the results setting alpha to zero, but the overall event study results and conclusions are robust when we do not set alpha to zero. 20 Additionally, we perform analysis of variance (ANOVA) to test for differences in the cumulative abnormal returns (CARs) across the various subsamples. This ANOVA test is conducted by regressing the CARs generated for the two entire samples of dividend increases (1,436 events) or dividend decreases (2,900 events) on various dummy variables that indicate whether a given event occurs in a down, normal, or up market, or in a low, medium, or high volatility market. The first ANOVA tests for differences in CARs due to underlying market direction only, the second ANOVA tests for differences in CARs due to underlying market volatility only, and the third ANOVA tests for the interaction of both market direction and volatility. An F-test and two sample t-tests are also performed, comparing the MCARs across the market direction subsamples. Results are robust with the ANOVA tests, and are available upon request.

15
MCARs (-0.87% for both). However, once again analysis of variance indicates these differences
are not statistically significant (F=0.55).
According to Veronesi’s (1999) model, when a dividend decrease (bad news) is
announced during good times (up market), the new information once again increases investor
uncertainty, leading them to discount the lower expected future stream of dividends at a higher
rate. Thus, bad news is perceived as worse news when times are good in Veronesi’s (1999)
model. Consequently, the up market should yield the largest negative MCAR as investors
overreact to bad news in good times. Our results support this assertion in an economic sense,
though not in a statistical sense.
In summary, Veronesi’s (1999) model implies asymmetric behavior for investors: they will
overreact to bad news in good times, but underreact to good news in bad times. The relative
magnitudes of the MCARs in Panel B of Table 2 are consistent with Veronesi, although the
results in Panel A are not. In both Panels, ANOVA tests fail to detect significant differences in
MCARs across subsamples partitioned by market direction alone. Apparently, for both dividend
increases and decreases, there is too much noise or market turbulence surrounding these events
to detect statistically significant differences across subsamples when partitioning by market
direction alone.
B. Partitioning by Market Volatility Alone
Panels A and B of Table 3 present the results for dividend increases and decreases,
respectively, when partitioning by underlying market volatility only. Again, dividend increases
(decreases) reveal MCARs that are significantly positive (negative) for the total sample and for
all three subsamples partitioned by market volatility. For dividend increases, the high volatility
market yields the largest positive MCARs (1.64%), while the medium and low volatility markets

16
yield smaller MCARs (1.36% and 1.46%, respectively). Likewise, for dividend decreases, the
high volatility market yields the largest negative MCAR (-1.12%), while the medium and low
volatility markets yield smaller negative MCARs (-0.89% and -0.79%, respectively). However,
for both cases analysis of variance indicates these differences are not statistically significant
(F=0.53 for dividend increases, F=0.97 for dividend decreases).21 Thus, once again there is
apparently too much noise or turbulence around this phenomenon to obtain robust, significant
results when we partition by market volatility alone.
C. Partitioning by Market Direction and Volatility
When we partition by market direction and volatility, both market conditions are statistically
important for the sample of dividend decreases, but not for dividend increases. First consider the
results for dividend increases, presented in Panel A of Table 4 and Figure I. The greatest
positive abnormal returns occur in two cells – when market volatility is high and market
direction is either down or normal (MCAR=1.76% and 1.77%, respectively). This outcome is
consistent with the results in Tables 2 and 3, indicating that investors tend to react more
positively to good news in a normal or down market when there is high volatility. The difference
in abnormal returns between these two cells and several of the remaining seven cells is large in
economic terms. For example, this difference is 0.46% when the down-high market is compared
to the up-high market direction-volatility combination, and as large as 0.82% when compared
with the down-low market direction-volatility combination.
At first glance, these results in Panel A would appear to support the view that, when market
volatility is high, good news (such as a dividend increase) may be “more informative” in
alleviating uncertainty, especially if the market is normal or trending down. Nonetheless,
21 Once again, an F-test and two sample t-tests are also performed, comparing the MCARs across the market direction subsamples. Results are robust with the ANOVA tests, and are available upon request.

17
ANOVA tests indicate that these differences in Panel A are not statistically significant across all
cells in each row or column of Panel A. Hence, for dividend increases there is once again too
much noise surrounding this phenomenon to obtain robust statistically significant results across
each row or column of Panel A, when we partition by both market direction and volatility.
According to Veronesi (1999), if good news is announced in a down market, the increased
discount rate applied by investors to account for the greater uncertainty diminishes the change in
value resulting from the good news. On the other hand, if the market is more volatile this effect
is counteracted by investors’ perception that the good news is more informative in a volatile
market. These two countervailing forces lead to an ambiguous result in which the market may
over- or underreact, depending upon which force outweighs the other in this situation. These
countervailing effects of the larger price increase due to greater informativeness, when market
volatility is high, and the smaller price increase due to the increased discount rate, when the
announcement goes against the grain of the market’s direction (as in Veronesi’s model) tend to
offset one another. As a result we cannot distinguish statistically whether there is a net over- or
underreaction across cells in each row or column of Panel A in Table 4 and Figure I.
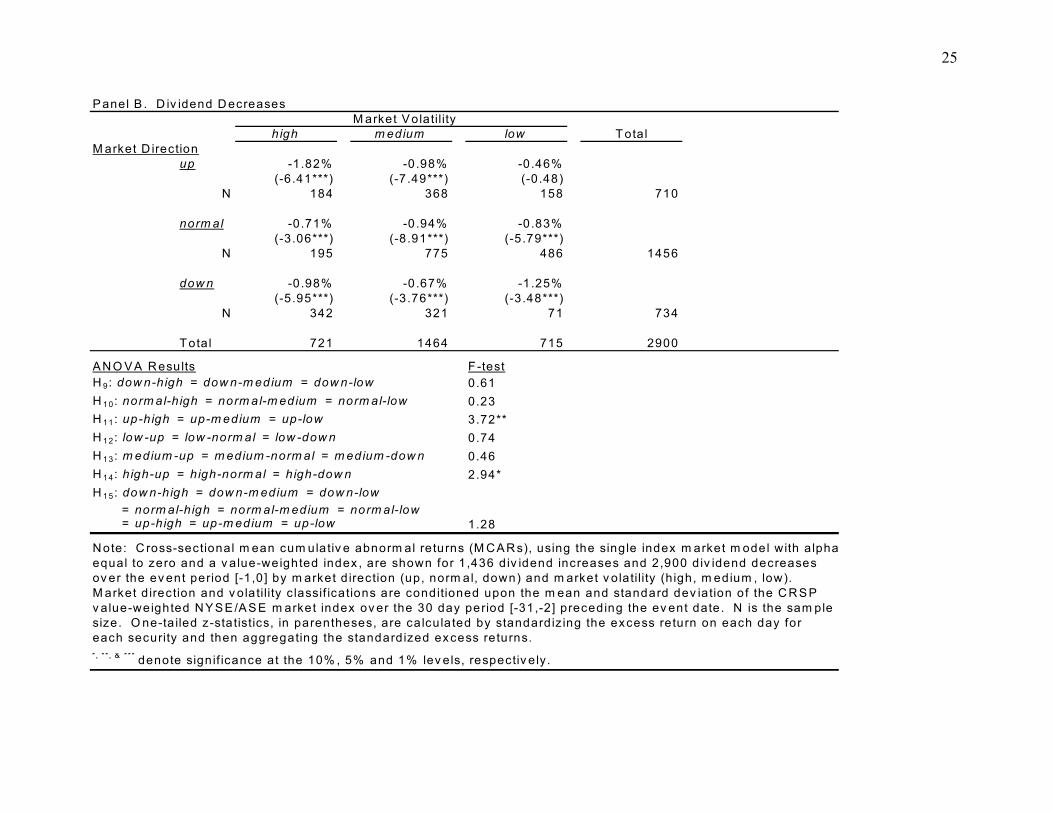
In Panel B of Table 4 and Figure I, we provide analogous results for dividend decreases. In
this case, the subsample of events in an up market with high volatility yields a negative MCAR
that is dramatically larger in magnitude than all other cells. ANOVA results reveal that, when
this {up market - high volatility} combination is compared with the other two cells in that row or
that column of the table, these two ANOVA tests reject the hypothesis of equality across cells.
These two tests imply that, when market direction is up, differences in market volatility are
relevant (F=3.72); and when market volatility is high, differences in market direction are
important (F=2.94).22 It is noteworthy that the largest negative MCAR in Panel B appears when

18
the market direction is up and volatility is high (MCAR=-1.82%), while the smallest negative
MCAR occurs when the market direction is up and volatility is low (-.46%).
These results support the implication of Veronesi’s (1999) model that, if bad news is
announced in an up market, the increased discount rate applied by investors to account for the
greater uncertainty means that bad news is perceived as worse news. Furthermore, these results
also suggest that an environment of greater overall market volatility reinforces the implication of
Veronesi’s model, as investors perceive the bad news as being more informative in a volatile
market. Together, these two forces reinforce one another when bad news is announced in an up
and volatile market. As a result of these reinforcing effects, we can distinguish a statistically
significant market overreaction across cells in Panel B of Table 4 and Figure I.
V. Conclusions
In this study we investigate the sensitivity of investor reactions to recent market direction and
volatility. In particular, we examine whether the stock market’s reaction to dividend change
announcements is systematically associated with the direction and/or volatility of the underlying
market during the six weeks prior to the announcement.
When the sample of dividend change announcements is partitioned by both market direction
and volatility, two empirical regularities stand out. First, announcements to increase dividends
tend to elicit greater positive abnormal returns when the market direction is normal or down and
volatility is high. That is, good news tends to be perceived as better news in a normal or down
market with high volatility. However, these tendencies are not statistically significant or robust
across all subsamples. Apparently, there is substantial noise across events that limits the
statistical significance and robustness of these tendencies. Second, announcements to decrease
dividends elicit significantly greater negative abnormal returns when market direction has been

19
up and volatility high. That is, investors react more strongly to bad news when the market has
been up and highly volatile.
Our first result contrasts with one major implication of Veronesi’s (1999) model - that
investors will underreact to good news (a dividend increase) in bad times (a down market). On
the other hand, our second result is consistent with the other major implication of Veronesi’s
model - that investors will overreact to bad news (a dividend decrease) in good times (an up
market).
We reconcile both results with the implications of Veronesi’s (1999) model, by
introducing market volatility as a second factor that may influence the extent to which investors
perceive news as good or bad (as in Epstein and Turnbull, 1980, and Robichek and Myers,
1966). We suggest a highly volatile marketplace embodies greater overall uncertainty that may
translate into greater firm-specific uncertainty, which can be relieved by firm-specific news
(such as a dividend change announcement).
In the first situation, when good news (a dividend increase) is announced in bad times (a
down market), the tendency for investors to underreact implied by Veronesi’s (1999) model is
offset by a tendency for investors to react more when the market is more volatile. That is, the
influences of market direction and volatility are countervailing in this situation, so that whether
the market under- or over-reacts to good news in bad and volatile times depends upon which
effect dominates. The lack of statistical significance we find for this situation is consistent with
our expansion of Veronesi’s (1999) framework to incorporate, both, the influence of market
direction and volatility. If these two forces offset one another in this situation, it should be more
difficult to find statistically significant differences across subsamples partitioned by market
direction and/or volatility.

20
In the second situation, when bad news (a dividend decrease) is announced in good times
(an up market), the overreaction implied by Veronesi’s (1999) model is exacerbated when the
market is more volatile. That is, the influences of market direction and volatility reinforce each
other in this situation, strengthening Veronesi’s implication that bad news is perceived as worse
news in an up (and volatile) market. The robust statistical significance of our second result is
consistent with this expansion of Veronesi’s framework to include market volatility.

21
TABLE 1. Summary Sample Statistics for Pre-Announcement Period
Panel A. Dividend Increases Panel B. Dividend DecreasesN N
Market Direction up 374 9.79E-04 *** 0.747 *** 0.25% *** 0.78% *** $0.13 *** 399.61% *** 710 4.05E-04 *** 0.690 *** 0.25% *** 0.73% *** -$0.20 *** -55.67% ***
normal 712 1.10E-03 *** 0.768 *** 0.05% *** 0.66% *** $0.13 *** 183.26% *** 1456 7.38E-04 *** 0.693 *** 0.05% *** 0.65% *** -$0.21 *** -55.33% ***
down 350 9.65E-04 *** 0.824 *** -0.18% *** 0.93% *** $0.13 *** 146.52% *** 734 6.78E-04 *** 0.715 *** -0.18% *** 0.92% *** -$0.20 *** -55.43% ***
Total 1436 1.04E-03 *** 0.776 *** 0.05% *** 0.75% *** $0.13 *** 230.65% *** 2900 6.41E-04 *** 0.698 *** 0.04% *** 0.74% *** -$0.21 *** -55.44% ***
Market Volatility high 363 7.55E-04 *** 0.782 *** 0.00% 1.24% *** $0.17 *** 285.32% *** 721 4.45E-04 *** 0.693 *** -0.02% ** 1.16% *** -$0.20 *** -56.88% ***
medium 704 1.16E-03 *** 0.766 *** 0.07% *** 0.67% *** $0.12 *** 157.86% *** 1464 6.78E-04 *** 0.679 *** 0.05% *** 0.68% *** -$0.21 *** -55.12% ***
low 369 1.08E-03 *** 0.789 *** 0.07% *** 0.43% *** $0.11 *** 315.75% ** 715 7.65E-04 *** 0.743 *** 0.08% *** 0.44% *** -$0.21 *** -54.64% ***
Total 1436 1.04E-03 *** 0.776 *** 0.05% *** 0.75% *** $0.13 *** 230.65% *** 2900 6.41E-04 *** 0.698 *** 0.04% *** 0.74% *** -$0.21 *** -55.44% ***
Market Direction& Volatility up-high 98 7.87E-04 *** 0.744 *** 0.30% *** 1.17% *** $0.15 *** 456.34% ** 184 -2.39E-04 0.723 *** 0.30% *** 1.08% *** -$0.21 *** -58.37% ***
up-medium 217 1.17E-03 *** 0.757 *** 0.25% *** 0.69% *** $0.13 *** 212.58% *** 368 5.97E-04 *** 0.677 *** 0.24% *** 0.69% *** -$0.20 *** -54.66% ***
up-low 59 6.02E-04 *** 0.713 *** 0.20% *** 0.44% *** $0.13 *** 993.25% 158 7.09E-04 *** 0.682 *** 0.20% *** 0.44% *** -$0.20 *** -54.87% ***
normal-high 115 7.85E-04 *** 0.805 *** 0.05% *** 1.16% *** $0.20 *** 337.56% *** 195 4.28E-04 *** 0.745 *** 0.05% *** 1.11% *** -$0.18 *** -56.91% ***
normal-medium 336 1.20E-03 *** 0.761 *** 0.04% *** 0.67% *** $0.12 *** 113.94% *** 775 7.68E-04 *** 0.644 *** 0.05% *** 0.68% *** -$0.21 *** -55.24% ***
normal-low 261 1.12E-03 *** 0.760 *** 0.07% *** 0.42% *** $0.12 *** 204.52% *** 486 8.15E-04 *** 0.752 *** 0.06% *** 0.43% *** -$0.22 *** -54.83% ***
down-high 150 7.11E-04 *** 0.789 *** -0.24% *** 1.35% *** $0.16 *** 133.53% *** 342 8.23E-04 *** 0.646 *** -0.22% *** 1.24% *** -$0.21 *** -56.06% ***
down-medium 151 1.06E-03 *** 0.790 *** -0.14% *** 0.67% *** $0.11 *** 176.97% *** 321 5.53E-04 *** 0.766 *** -0.15% *** 0.67% *** -$0.21 *** -55.35% ***
down-low 49 1.44E-03 *** 1.034 *** -0.09% *** 0.47% *** $0.07 *** 92.43% *** 71 5.42E-04 ** 0.817 *** -0.11% *** 0.48% *** -$0.18 *** -52.78% ***
Total 1436 1.04E-03 *** 0.776 *** 0.05% *** 0.75% *** $0.13 *** 230.65% *** 2900 6.41E-04 *** 0.698 *** 0.04% *** 0.74% *** -$0.21 *** -55.44% ***
Note: Sample statistics are shown for 1,436 dividend increases and 2,900 dividend decreases over the 30-day pre-announcement partitioning periods. Market direction classifications (up, normal, down) andmarket volatility classifications (high, medium, low) are conditioned upon the mean and standard deviation, respectively, of the CRSP value-weighted NYSE/ASE market index over this 30-day period [-31, -2].N is the sample size, avg(a) and avg(b) are the average alpha and beta estimated from the pre-announcement period by partition subsample, avg(Rm) is the average daily percentage return in the CRSPvalue-weighted NYSE/ASE market index from the pre-announcement period by partition subsample, avg(s(Rm)) is the average of the standard deviations of the CRSP value-weighted NYSE/ASE marketindex from the pre-announcement period by partition subsample, and avg($Divchg) and avg(%Divchg) are the average dollar and percentage dividend change for those events in the pre-announcementperiod by partition subsample. *, **, & *** denote t-test significance at the 10%, 5%, and 1% levels, respectively, for testing the hypothesis that the population mean is 0.
avg(Rm) avg(σ(Rm))avg(Rm) avg(σ(Rm))avg(α) avg(β) avg(α) avg(β)avg($Divchg) avg(%Divchg) avg($Divchg) avg(%Divchg)

22
TABLE 2. Mean Cumulative Abnormal Returns of Substantial Dividend Changes for Subsamples Partitioned by Market Direction.
Panel A. Dividend Increases Market Direction
up normal down Total MCARs 1.22% 1.64% 1.34% 1.46% z-statistic 8.47 *** 15.42 *** 8.22 *** 19.24 *** N 374 712 350 1436
ANOVA Results F-testH1: normal = down 1.23H2: up = down 0.15H3: up = normal 2.52H4: up = normal = down 1.44
Panel B. Dividend Decreases Market Direction
up normal down Total MCARs -1.08% -0.87% -0.87% -0.92% z-statistic -8.88 *** -10.97 *** -7.63 *** -16.00 *** N 710 1456 734 2900
ANOVA Results F-testH1: normal = down 0.00H2: up = down 0.73H3: up = normal 0.98H4: up = normal = down 0.55
Note: Cross-sectional mean cumulative abnormal returns (MCARs), using the singleindex market model with alpha equal to zero and a value-weighted index, are shown for1,436 dividend increases and 2,900 dividend decreases over the event period [-1,0],partitioned by market direction (up, normal, down). Market direction classification isconditioned upon the mean of the CRSP value-weighted NYSE/ASE market index overthe 30 day period [-31,-2] preceding the event date. N is the sample size. One-tailedz-statistics are calculated by standardizing the excess return on each day for eachsecurity and then aggregating the standardized excess returns.*, **, & *** denote significance at the 10%, 5% and 1% levels, respectively.

23
TABLE 3. Mean Cumulative Abnormal Returns of Substantial Dividend Changes for Subsamples Partitioned by Market Volatility.
Panel A. Dividend Increases Market Volatility
high medium low Total MCARs 1.64% 1.36% 1.46% 1.46% z-statistic 9.64 *** 13.59 *** 9.62 *** 19.24 *** N 363 704 369 1436
ANOVA Results F-testH5: medium = low 0.14H6: high = low 0.32H7: high = medium 1.05H8: high = medium = low 0.53
Panel B: Dividend Decreases Market Volatility
high medium low Total MCARs -1.12% -0.89% -0.79% -0.92% z-statistic -8.93 *** -12.00 *** -6.10 *** -16.00 *** N 721 1464 715 2900
ANOVA Results F-testH5: medium = low 0.25H6: high = low 1.82H7: high = medium 1.14H8: high = medium = low 0.97
Note: Cross-sectional mean cumulative abnormal returns (MCARs), using the single indexmarket model with alpha equal to zero and a value-weighted index, are shown for 1,436dividend increases and 2,900 dividend decreases over the event period [-1,0], partitionedby market volatility (high, medium, low). Market volatility classification is conditioned uponthe standard deviation of the CRSP value-weighted NYSE/ASE market index over the 30day period [-31,-2] preceding the event date. N is the sample size. One-tailed z-statisticsare calculated by standardizing the excess return on each day for each security and thenaggregating the standardized excess returns.*, **, & *** denote significance at the 10%, 5% and 1% levels, respectively.

24
TABLE 4. Mean Cumulative Abnormal Returns of Substantial Dividend Changes for Subsamples Partitioned by Both Market Direction and Market Volatility.
Panel A. Div idend IncreasesMarket Volatility
high medium low TotalMarket Direction
up 1.30% 1.11% 1.48%(3.51***) (6.33***) (4.67***)
N 98 217 59 374
normal 1.77% 1.66% 1.56%(6.07***) (11.51***) (8.38***)
N 115 336 261 712
down 1.76% 1.05% 0.94%(6.85***) (4.59***) (1.93**)
N 150 151 49 350
Total 363 704 369 1436
ANOVA Results F-testH9: down-high = down-medium = down-low 1.34H10: normal-high = normal-medium = normal-low 0.11H11: up-high = up-medium = up-low 0.21H12: low-up = low-normal = low-down 0.45H13: medium-up = medium-normal = medium-down 1.68H14: high-up = high-normal = high-down 0.44H15: down-high = down-medium = down-low = normal-high = normal-medium = normal-low = up-high = up-medium = up-low 0.78
(continued)
25
P anel B . D iv idend D ecreasesM arket V olatility
high m edium low T otalM arket D irection
up -1.82% -0.98% -0.46%(-6.41***) (-7 .49***) (-0.48)
N 184 368 158 710
norm al -0.71% -0.94% -0.83%(-3.06***) (-8 .91***) (-5.79***)
N 195 775 486 1456
dow n -0.98% -0.67% -1.25%(-5.95***) (-3 .76***) (-3.48***)
N 342 321 71 734
Total 721 1464 715 2900
A N O V A R esults F -testH 9: dow n-high = dow n-m edium = dow n-low 0.61H 10: norm al-h igh = norm al-m edium = norm al-low 0.23H 11: up-high = up-m edium = up-low 3.72**H 12: low -up = low -norm al = low -dow n 0.74H 13: m edium -up = m edium -norm al = m edium -dow n 0.46H 14: high-up = high-norm al = high-dow n 2.94*H 15: dow n-high = dow n-m edium = dow n-low = norm al-h igh = norm al-m edium = norm al-low = up-high = up-m edium = up-low 1.28
Note: C ross-sectional m ean cum ulativ e abnorm al returns (M CA R s), using the single index m arket m odel with a lphaequal to zero and a v alue-weighted index , are shown for 1 ,436 div idend increases and 2,900 div idend decreasesov er the ev ent period [-1,0 ] by m arket d irection (up, norm al, down) and m arket v olatility (h igh, m edium , low). M arket d irection and v ola tility c lassif ications are conditioned upon the m ean and standard dev iation of the C R S Pv alue-weighted N Y S E /A S E m arket index ov er the 30 day period [-31,-2] preceding the ev ent date. N is the sam plesize. O ne-ta iled z-sta tistics, in parentheses, are ca lcula ted by standardiz ing the excess return on each day foreach security and then aggregating the standardized excess returns.*, **, & *** denote signif icance at the 10% , 5% and 1% lev els, respectiv ely.

26
low
medium
high
up
normal
down
1. 7 6 %
1. 5 6 % 1. 6 6 % 1. 7 7 %
0.00%
0.20%
0.40%
0.60%
0.80%
1.00%
1.20%
1.40%
1.60%
1.80%
M C AR
v ol a t i l i t y
di r e c t i on
Fi gur e I , P a ne l A : S i ngl e I nde x M ode l R e sul t s Whe n P a r t i t i oni ng by M a r k e t D i r e c t i on a nd Vol a t i l i t y - D i v i de nd I nc r e a se s
lowmedium
high
up
normal
down
- 1. 2 5 %
- 0 . 9 8 %
- 0 . 4 6 %
- 0 . 9 8 %
- 1. 8 2 %
-2.00%
-1.80%
-1.60%
-1.40%
-1.20%
-1.00%
-0.80%
-0.60%
-0.40%
-0.20%
0.00%
M C AR
v ol a t i l i t y
di r e c t i on
Fi gur e I , P a ne l B : S i ngl e I nde x M ode l R e sul t s Whe n P a r t i t i oni ng by M a r k e t D i r e c t i on a nd Vol a t i l i t y - D i v i de nd De c r e a se s

27
REFERENCES Aharony, J. and I. Swary, 1980, Quarterly dividend and earnings announcements and
stockholder's returns: An empirical analysis, Journal of Finance 35, 1-12. Allport, G.W., 1940, The psychologists frame of reference, Psychological Bulletin 37, 1-28. Asquith, P. and D.W. Mullins, Jr., 1983, The impact of initiating dividend payments on
shareholders� wealth, Journal of Business 56, 77-96. Bajaj, M. and A.M. Vijh, 1990, dividend clienteles and the information content of dividend
changes, Journal of Financial Economics 26, 193-219. Barberis, N., A. Shleifer, and R. Vishny, 1998, A model of investor sentiment, Journal of
Financial Economics, 49, 307-343. Best, R. and R. Best, 2001, Prior information and the market reaction to dividend changes,
Review of Quantitative Finance and Accounting 17, 361-376. Bowman, G. R., A.J. Robin, and J. Weintrop, 1995, The robustness of event study methodologies
to varying market conditions, Working paper, Auckland University, New Zealand. Boyd, J.H., J. Hu, and R. Jagannathan, 2001, The stock market’s reaction to unemployment
news: Why bad news is usually good for stocks, Working paper, University of Minnesota, Minneapolis, MN.
Burr, B.B., 1997, More light shining on the whys of investing, Pensions and Investments 25, 32-
35. Campbell, J.Y. and L. Hentschel, 1992, No news is good news: An asymmetric model of
changing volatility in stock returns, Journal of Financial Economics 31, 281-318. Christie, W.G., 1994, Are dividend omissions truly the cruelest cut of all?, Journal of Financial
and Quantitative Analysis 29, 459-480. Daniel, K., D. Hirshleifer, and A. Subrahmanyam, 1998, Investor psychology and security
market under- and overreactions, Journal of Finance 53, 1839-1885. Day, R.H. and W. Huang, 1990, Bulls, bears and market sheep, Journal of Economic Behavior &
Organization 14, 299-329. DeBondt, W.F.M. and Richard H. Thaler, 1987, Further evidence of investor overreaction and
stock market seasonality, Journal of Finance 42, 557-581.

28
DeBondt, W.F.M. and R.H. Thaler, 1985, Does the stock market overreact?, Journal of Finance 40, 793-808.
Dhillon, U.S. and H. Johnson, 1994, The effect of dividend changes on stock and bond prices,
Journal of Finance 49, 281-289. Dodd, P. and J.B. Warner, 1983, On corporate governance: A study of proxy contests, Journal
of Financial Economics 11, 401-438. Eades, K.M., P.J. Hess and E.H. Kim, 1985, Market rationality and dividend announcements,
Journal of Financial Economics 14, 581-604. Elton, E.J., M.J. Gruber, and J.A. Busse, 1998, Do investors care about sentiment?, Journal of
Business 71, 477-500. Epstein, L.G., and S.M. Turnbull, 1980, Capital asset prices and the temporal resolution of
uncertainty, Journal of Finance 35, 627-643. Fabozzi, F., and J.C. Francis, 1977, Stability tests for alphas and betas over bull and bear market
conditions, Journal of Finance 32, 1093-1099. Fama, E.F, 1998, Market efficiency, long-term returns, and behavioral finance, Journal of
Financial Economics 49, 283-306. Fama, E.F. and K.R. French, 1996, Multifactor explanations of asset pricing anomalies, Journal
of Finance 51, 55-84. Ghosh, C. and J.R. Woolridge, 1989, Stock-market reaction to growth-induced dividend cuts:
Are investors myopic?, Managerial and Decision Economics 10, 25-35. Goldberg, M.A. and A. Vora, 1981, The inconsistency of the relationship between
security and market returns, Journal of Economics & Business 33, 97-107. Guay, W. and J. Harford, 2000, The cash-flow permanence and information content of
dividend increases versus repurchases, Journal of Financial Economics 57, 385-415.
Jegadeesh, N. and S. Titman, 1993, Returns to buying winners and selling losers: Implications
for stock market efficiency, Journal of Finance 48, 65-91. Kalay, A. and U. Lowenstein, 1985, Predictable events and excess returns, Journal of Financial
Economics 14, 423-449. Kahneman, D., and A. Tversky, 1979, Prospect theory: An analysis of decision-making under
risk, Econometrica 47, 171-185.

29
Klein, A. and J. Rosenfeld, 1987, The influence of market conditions on event-study residuals, Journal of Financial and Quantitative Analysis 22, 345-351.
Li, Y., 1998, Time variations in risk premia, volatility, and reward to volatility, Journal of
Financial Research 21, 431-446. Michaely, R., R.H. Thaler, and K.L. Womack, 1995, Price reactions to dividend initiations and
omissions: Overreaction or drift?, Journal of Finance 50, 573-608. Odean, Terrance. 1998, Volume, volatility, price, and profit when all traders are above
average, Journal of Finance 56, 1887-1934. Patell, J.M., 1976, Corporate forecasts of earnings per share and stock price behavior: Empirical
tests, Journal of Accounting Research 14, 246-276. Pettit, R.R., 1972, Dividend announcements, security performance, and capital market efficiency,
Journal of Finance 27, 993-1007. Randolph, W.L., 1991, Use of the mean reversion model in predicting stock market
volatility, Journal of Portfolio Management 17, 22-26. Robichek, A.A., and S.C. Myers, 1966, Valuation of the firm: Effects of uncertainty in a market
context, Journal of Finance 21, 215-227. Robin, A.J., 1998, Dividend omissions: Rationale and market impact, American Business
Review 16, 1-8. Sant, R. and A.R. Cowan, 1994, Do dividends signal earnings? The case of omitted dividends,
Journal of Banking and Finance 18, 1113-1133. Scharfstein, D.S. and J.C. Stein, 1990, Herd behavior and investment, American
Economic Review 80, 465-479. Shefrin, H., 2000, Beyond Greed and Fear (Harvard Business School Press, Boston, MA). Shiller, R.J., 1987, Investor behavior in the October 1987 stock market crash: Survey evidence,
Working Paper No.2446 (NBER, Cambridge, MA). Statman, M. and J.F. Sepe, 1989, Project termination announcements and the market value of the
firm, Financial Management 18, 74-81. Szewczyk, S.H., G.P. Tsetsekos, and Z.Z. Zantout, 1997, Do dividend omissions signal future
earnings or past earnings, Journal of Investing 6, 40-53. Veronesi, Pietro, 1999, Stock market overreaction to bad news in good times: A rational
expectations equilibrium model, Review of Financial Studies 12, 975-1007.