SENSITIVITY AND SPECIFICITY OF AN EEG … AND SPECIFICITY OF AN EEG NORMATIVE DATABASE: Validation...
39
SENSITIVITY AND SPECIFICITY OF AN EEG NORMATIVE DATABASE: Validation and Clinical Correlation (see also J. Neurotherapy 7(3/4): 87-121, 2003) R.W. Thatcher, Ph.D., R.A. Walker, B.A. C.J. Biver, Ph.D., D. M. North, M.A. and R. Curtin, B.A. We each had different contributions as a team to compute and test these databases. Robert Thatcher was the program director and P.I., Rebecca Walker, Richard Curtin, Duane North and Dr. Carl Biver were the database managers and analysists and colleague scientists who spent years analyzing these data (Walker and Thatcher = 22 years and no one for less than 5 years). Dr. Biver was responsible for writing of IDL and C programs for the Interpolations, sliding averages, digital signal processing and, with Duane North, for the cross-validation procedures. Rebecca Walker computed the means and standard deviations of EEG values in the database and grouped and tabulated subjects, and oversaw the organization of the clinical database and Richard Curtin helped edit and archive data and organize the databases. Duane North, Rebecca Walker and Richard Curtin were the data analyzers for the computation of sliding averages and for writing Excel programs to compute and tabulate the Skewness and Kurtosis and the parametric and non-parametric sensitivity and specificity statistics in the cross-validation studies as well as the clinical correlations.
Transcript of SENSITIVITY AND SPECIFICITY OF AN EEG … AND SPECIFICITY OF AN EEG NORMATIVE DATABASE: Validation...

SENSITIVITY AND SPECIFICITY OF AN EEG NORMATIVE DATABASE:
Validation and Clinical Correlation (see also J. Neurotherapy 7(3/4): 87-121, 2003)
R.W. Thatcher, Ph.D., R.A. Walker, B.A.
C.J. Biver, Ph.D., D. M. North, M.A. and R. Curtin, B.A.
We each had different contributions as a team to compute and test these databases. Robert Thatcher was the program director and P.I., Rebecca Walker, Richard Curtin, Duane North and Dr. Carl Biver were the database managers and analysists and colleague scientists who spent years analyzing these data (Walker and Thatcher = 22 years and no one for less than 5 years). Dr. Biver was responsible for writing of IDL and C programs for the Interpolations, sliding averages, digital signal processing and, with Duane North, for the cross-validation procedures. Rebecca Walker computed the means and standard deviations of EEG values in the database and grouped and tabulated subjects, and oversaw the organization of the clinical database and Richard Curtin helped edit and archive data and organize the databases. Duane North, Rebecca Walker and Richard Curtin were the data analyzers for the computation of sliding averages and for writing Excel programs to compute and tabulate the Skewness and Kurtosis and the parametric and non-parametric sensitivity and specificity statistics in the cross-validation studies as well as the clinical correlations.

2
Abstract
The digital Electroencephalogram (EEG) was recorded from19 scalp locations
from 625 screened and evaluated normal individuals ranging in age from 2 months to 82
years. After editing to remove artifact; one year to 5 year groupings were selected to
produce different average age groups.. Estimates of Gaussian distributions and
logarithmic transforms of the digital EEG were used to establish approximate Gaussian
distributions when necessary for different variables and age groupings. The sensitivity of
the lifespan database was determined by Gaussian Cross-Validation for any selection of
age range in which the average percentage of Z scores ± 2 st. dev. equals approximately
2.3% and the average percentage for ± 3 st. dev. equals approximately .13%. It was
hypothesized that measures of Gaussian cross-validation of Z scores is a common metric
by which the statistical sensitivity of any normative database for any age grouping can be
calculated. This notion was tested by computing eyes closed and eyes open Average
Reference and Current Source Density norms and independently cross-validating and
comparing to the Linked Ears norms. The results indicate that age dependent Digital
EEG normative databases are reliable and stable and behave like different Gaussian
lenses that spatially focus the Electroencephalogram. Clinical correlations of a
normative database are determined by content validation and correlation with
neuropsychological test scores and discriminate accuracy. Non-parametric statistics
were presented as an important aid to establish the alpha level necessary to reject a
hypothesis and to estimate Type I and Type II errors, especially when there are multiple
comparisons of an individual’s EEG to any normative EEG database.
Key Words: EEG Normative Databases, Gaussian Distributions, Error Estimates
3
1.0- Introduction
There are many potential uses of a normative EEG database among the most
important being a statistical “guess” as to the “error rate” or to the probability of finding a
particular patient’s EEG measure within a reference normal population. 1 Most other uses
of a reference EEG database also involve statistics and the same statistics that all of
modern clinical medicine relies upon. For example, null hypothesis testing, measures of
reliability, sensitivity, power, predictive validity, content validity, etc. all depend on
specific assumptions and statistical procedures.
Predictive accuracy and error rates depend on the data that make up a given EEG
database and the statistics of the database. The statistical foundations of the scientific
method were visited by the Supreme Court in Daubert, 1993 regarding admissibility of
scientific evidence. The Four Daubert Factors for scientific standards of admissibility
in Federal Courts were: 1- hypothesis testing, 2- error estimates of reliability and
validity, 3- peer reviewed publications and 4- general acceptance (Mahle, 2001) 2.
These four Daubert factors for several EEG normative database have already been met.
The minimal standards are publication of: 1- inclusion/exclusion criteria, 2- methods to
remove artifact and adequate sample sizes per age groups, 3- demographic
representativeness (e.g., balanced gender, ethnicity, socioeconomic status, etc.), 4-
means and standard deviations as being normally distributed or “Gaussian” including
Gaussian Cross-Validation and, 5- Content validity by correlations with
Neuropsychological test scores and school achievement scores, etc. as validation.
Predictive validity is determined by regression and classification statistics. Predictive
validity relates to the classification accuracy, clinical severity, clinical outcome, etc.
estimates. The sensitivity and specificity of any EEG database is directly proportional to
its adherence to the established statistical principals in the history of statistics (Hayes,
1973).
1 The phrase ‘reference normal’ is used to emphasize: that the term “normative” when used alone tends to obscure or mask the fundamental fact that only a “sample” of subjects drawn from a much larger population are contained in any data base. 2 The court benefited by input from the American Academy of Science and 13 Nobel Laureates.

4
1.1 – General Method to Produce a Valid Normative EEG Database
Figure 1 is an illustration of a step by step procedure by which any normative
EEG database can be validated and sensitivities calculated. The left side of the figure is
the edited and artifact clean and reliable Digital EEG Time Series which may be re-
referenced or re-Montaged, which is then analyzed in either the time domain or the
frequency domain.
Fig. 1 - Illustration of the step by step procedure to Gaussian cross-validate and then validate by correlations with clinical measures in order to estimate the predictive and content validity of any EEG normative database. The feedback connections between Gaussian Cross Validation and the means and standard deviations refers to transforms to approximate Gaussian if the non-transformed data is less Gaussian (see section 6). The Clinical

5
Correlation and Validation arrow to the Montage stage represents repetition of clinical validation to a different montage or reference or condition such as eyes open, active tasks, eyes closed, etc. to the adjustments and understanding of the experimental design(s) (see sections 6 to 8).
The selected normal subjects are grouped by age with sufficiently large sample
size and the means and standard deviations of the EEG time series and/or Frequency
domain analyses are computed for each age group. Transforms are applied to
approximate a Gaussian distribution of the EEG measures that comprise the means.
Once approximation to Gaussian is completed, then Z scores are computed for each
subject in the database and leave one3 out Gaussian Cross-Validation is computed in
order to arrive at an optimum Gaussian Cross-validation sensitivity. Finally the
Gaussian validated norms are subjected to content and predictive validation procedures
such as correlation with Neuropsychological test scores and intelligence, etc. and also
discriminant analyses and neural networks and outcome statistics, etc. The content
validations are with respect to clinical measures such as intelligence, neuropsychological
test scores, school achievement, clinical outcomes, etc. The predictive validations are
with respect to the discriminative, statistical or neural network clinical classification
accuracy. Both parametric and non-parametric statistics are used to determine the content
and predictive validity of a normative EEG database..
1.2- Example of a Normative EEG Database and the Procedure in Section 1.1
An example of the step-by-step procedure in Figure 1 to produce a validated
normative digital EEG database will be provided to show how any normative reference
3 The leave-one-out is a bit over sold, because the fact is that leave-one-out is self-referential with respect to the particular population that was selected and it is the nearly the same as simply computing the Z scores

6
database can be constructed to meet measurable standards of reliability and validity. The
Steps in Figure 1 can be repeated for different selections of subjects
2.0 - Subject and Variable Selection
Nineteen (19) channels of EEG and a EOG (Electro-Oculogram) channel, a two
hour battery of evoked potential tests and active challenges, psychometric tests, dietary
evaluations, anthrometric measurements, demographic and trace element measurements
from a population of 1,015 rural and urban children were collected (Thatcher et al, 1983;
1987; Thatcher, 1997). The principal goal of this project was to evaluate the effects of
environmental toxins on child development and to determine the extent to which good or
poor diets may ameliorate or exacerbate the deleterious effects of environmental toxins.
Two data acquisition centers were established, one at the rural University of Maryland
Eastern Shore campus and one at the urban campus of the University of Maryland School
of Medicine in Baltimore, Maryland. Identical data acquisition systems were built and
calibrated, a staff was trained using uniform procedures and a clinical and psychometric
protocol were utilized in the recruitment of normal subjects. The total of 1,015 subjects
ranging in age from 2 months to 82 years were tested during the period from 1979 to
1987. Of these subjects, 564 met the criteria of normalcy and were included in the
normative reference database (Thatcher et al, 1987; Thatcher 1997). In 2000 the original
digital EEG was revisited and a different selection of individuals was selected that also
spanned the same interval from 2 months to 82 years and included 61 additional adult
subjects to give rise to a total sample size of 625 subjects. The expanded selection
without replacement. Multiple independent validations are impractical, therefore, reliance on the clinical correlations are more important, whether or not leave-one-out procedures were used.

7
contained more individuals between the ages of 25 and 55 years of age.
Figure 2 shows the number of subjects per year in the normative EEG lifespan
database. It can be seen that the largest number of subjects are in the younger ages (e.g.,
1 to 14 years, N = 470) when the EEG is changing most rapidly. As mentioned
Fig. 2 - The number of subjects per year in the Lifespan EEG reference normative database. The database is a “life-span” database with the 2 months of age being the youngest subject and 82.3 years of age being the oldest subject. This figure shows the number of subjects constituting mean values which range from a mean of .5 years to 62.6 years of age and constituting a total number of subjects = 625.
previously, a proportionately smaller number of subjects represents the adult age range
from 14 to 83 years (N = 155). Fifteen one-year groupings of subjects were computed
with reasonable sample sizes from birth to 15 years of age. Thirteen out of the 15 one
year age groups have N > 20 with the largest sample size at age 3 to 4 years, N = 45. The
smallest one year sample size was between age 2 and 3 when N = 16.

8
For each subject, original selections of the original digital EEG occurred by
different artifact procedures involving the use of NeuroGuide editing selections in 2001.
Original arrangements of coherence, phase, amplitude asymmetry and relative power also
occurred when comparing the database to previous publications and the 1988 copyright
(Thatcher et al, 1987; Thatcher, 1988; Thatcher, 1997). Although different selections of
digital EEG values and different arrangements of the original digital EEG have occurred
since 1987, nonetheless, the Gaussian validations and sensitivities of the previous
databases and the current 2001-2002 database were all similar and equally valid and
Gaussian distributed within a 90% to 99% range depending on the measure. The
original digital EEG and subjects and neuropsychological test scores that were measured
from 1979 to 1987 are the same.
3.0- Inclusion/Exclusion Criteria, Demographics and Gender
Details of the neuropsychological testing, demographic and sampling of the
normative 1987 EEG database were previously published in Thatcher et al (1983; 1986;
1987) and Thatcher (1997). Some but not all of the 61 adults added in 2000 - 2001 were
given neuropsychological tests and other evaluations to help determine “normalcy”,
however, all of the subjects were interviewed and filled out a history and neurological
questionnaire. All of the 61 added adults were gainfully employed as professors,
graduate students, and other successfully employed adults without a history of
neurological problems. Normalcy for the age range from 2 months to 18 years was
determined by one or more exclusion/inclusion criteria: 1- a neurological history
questionnaire given to the child’s parents and/or filled out by each subject, 2-
psychometric evaluation of I.Q., and/or school achievement, 3- for children the teacher

9
and class room performance as determined by school grades and teacher reports and
presence of environmental toxins such as lead or cadmium. A Neurological questionnaire
was obtained from all of the adult subjects >18 years of age and those in which
information was available about a history of problems as an adult were excluded. .
3.1- Intelligence and School Achievement Criteria:
Psychometric, demographic and socioeconomic status measures were obtained
from each child, adolescent and for some of the adults. Different psychometric tests were
administered depending upon the age of the child. There is little reliability in the I.Q.
tests of infants, however, when possible the infant's Apgar Score was obtained and the
Vineland Social Maturity Scale test was administered (age birth to 2 years, 4 months).
From age 2 years to 3.99 years, the McCarthy Intelligence Scale Test was administered,
from age 4.0 years to 5.99 years the Weschler Pre-school and Primary Scale of
Intelligence (WIPPSI) test was administered, from age 6.0 years to 16.99 years the
Wechsler Intelligence Scale for Children (WISC-R, 1972) was administered and from age
17.0 years to adulthood the Wechsler Adult Intelligence Scale test (WAIS) was
administered. In addition to Intelligence Tests, the Wide Range School Achievement test
(WRAT) was administered to the school age children and grade cards were obtained from
the public school systems. Finally, a variety of neuropsychological tests were
administered including the pegboard test of skilled motor movements, the Stott, Moyes
and Henderson Test of Motor Impairment (MIT) and a eight item laterality test (see
Thatcher et al, 1982; 1983 for further details).
The criteria for entry into the normative database for those subjects given I.Q. tests

10
and school achievement tests were:
1- A Full Scale I.Q. > 70.
2- WRAT School Achievement Scores > 89 on at least two subtests (i.e., reading,
spelling, arithmetic) or demonstrated success in these subjects.
3- A grade point average of 'C' or better in the major academic classes (e.g., English,
mathematics, science, social studies and history).
3.2- Demographic Characteristics:
It is important that the demographic mixture of males and females, different
ethnic groups and socioeconomic status be reasonably representative of expected North
American clientele. The normative EEG database is made up of 58.9% males, 41.1%
females, 71.4% whites, 24.2% blacks and 3.2% oriental. Socioeconomic status (SES)
was measured by the Hollingshead four factor scale (Hollingshead, Four factor Index of
Social Status, 1975). (see Thatcher et al, 1983 for details).
3.3 - Time of Day and Other Miscellaneous Factors
There are many uncontrollable factors that influence the frequency spectrum of
the EEG. In general these factors are all confounded, and it would require an enormously
expensive and large sample size to control each factor individually. Even if one could
control each factor, such experimental control would preclude the practical use of a
database since each patient’s EEG would have to be acquired in a precisely matching
manner. Statistical randomization is one of the best methods to deal with these
uncontrollable and miscellaneous factors. Statistical randomization of a database
involves randomly varying time of day of EEG acquisition, time between food intake and

11
EEG acquisition, food content and EEG acquisition, etc. across ages, sex and
demographics. Because these factors are confounded with each other, randomization
with a sufficient sample size will result in increased variance but, nonetheless,
convergence toward a gaussian distribution. Such convergence, even in the face of
increased variance, still allows quantitative comparisons to be made and false positive
and false negative error rates (i.e., sensitivity) to be calculated. The method of statistical
randomization of miscellaneous factors was used in the Matousek & Petersen, Thatcher,
John and Duffy EEG normative databases (John et al, 1988; Thatcher et al, 1989; Duffy
et al, 1994).
4.0 – Digital Electroencephalographic Recording Procedures
EEG was recorded and digitized at a rate of 100 Hz from the 19 leads of the
International 10/20 system of electrode placement referenced to linked ear lobes and one
bipolar EOG lead (Electrooculogram) (i.e., a total of 20 channels). (Thatcher et al, 1983;
1986; 1987, Thatcher 1997). When head size was amenable, the data were acquired using
a stretchable electrode cap (Electrocap International, Inc.). When head sizes were either
too small or too large for the electrocap, then the electrophysiological data were acquired
by applying standard silver disk Grass electrodes. Amplifiers were calibrated using sine
wave calibration signals and standardized procedures and a permanent record made
before and after each test session. The frequency response of the amplifiers was
approximately 3db down at 0.5 Hz and 30 Hz. Impedance was measured and recorded
for each electrode and efforts were made to obtain impedance measures less than 10K
ohms (most of the impedance’s were < 5k ohms) for all subjects.

12
4.1 – Artifact Removal and Quality Control Procedures
EEG recording lengths varied from 58.6 seconds to 40 minutes. Artifact rejection
involved using the NeuroGuide editing procedures in which a 1 to 2 second template of
“clean” or “artifact free” EEG was selected. This template was then used to compute
matching amplitudes of EEG using a flexible criteria of equal amplitudes to amplitudes
that are 1.25 or 1.5 times larger in amplitude. The decision as to which clean EEG
sample multiplier to use was determined by the length of the sample 58.6 seconds as a
minimum, visual inspection of the digital EEG and when split-half reliability > 0.97.
After multiple visual inspections and selection of “clean” EEG samples the edited
samples varied in length from 58.6 seconds to 142.4 seconds. Average split-half
reliability = 0.982 for the selected EEG in the database. Care was taken to inspect the
EEG from each subject in order to eliminate “drowsiness” or other state changes in the
EEG which may have been present in the longer EEG recording sessions. No evidence of
sharp waves or epileptogenic events were present in any of the EEG records.
4.2- Re-Montage to the Surface Laplacian and Average Reference
The average reference involved summing the voltages across all 19 leads for each
time point and dividing this value into the microvolt digital value from each lead at each
time point. This procedure produced a digital EEG time series that was then submitted to
the same age groupings and Power Spectral analyses and the same Gaussian normative
evaluations as for Linked ears. See Figure 1.
The reference free surface Laplacian or current source density (CSD) was
13
computed using the spherical harmonic Fourier expansion of the EEG scalp potentials to
estimate the current source density (CSD) directed at right angles to the surface of the
scalp in the vicinity of each scalp location (Pascual-Marqui et al., 1988). The CSD is the
second spatial derivative or Laplacian of the scalp electrical potentials which is
independent of the linked ear reference itself. The Laplacian is reference free in that it is
only dependent upon the electrical potential gradients surrounding each electrode. The
Laplacian transform also produces a new digital EEG time series of estimates of current
source density in microamperes, that were also submitted to the same age groupings
Spectral Analyses (see Figure 1).
4.3 - Complex Demodulation Computations
The mathematical details of both the FFT and complex demodulation are
adequately described in Otnes and Enochson, (1977); Bendat and Piersol, (1981). The
EEG norms use both the complex demodulation and the FFT so that users can compare
and contrast both methods in the same subject or application. Complex demodulation is a
time domain digital method of spectral analysis whereas the fast Fourier transform (FFT)
is a frequency domain method. These two methods are related by the fact they both
involve sines and cosines and both operate in the complex domain and in this way
represent the same mathematical descriptions of the power spectrum. The advantage of
complex demodulation is that it is a time domain method and less sensitive to artifact
and it does not require even integers of the power of 2 as does the FFT. The FFT
integrates frequency over the entire epoch length and requires windowing functions which
can dramatically affect the power values whereas complex demodulation does not require

14
windowing (Otnes and Enochson, 1972; 1978). Complex demodulation was computed
for the linked ears and eyes closed condition. Future analyses are being considered for
the computation of complex demodulation for average reference and the Laplacian
estimate of current source density for eyes open and closed conditions. However, due to
the large amount of data and the large number of computations, the FFT may be the
preferred method to conduct these analyses.
.
4.4 – FFT Linked Ears, Average Reference and Laplacian
The 100 samples per second digital EEG were cubic-spline interpolated to 128
samples per second using standard procedures (Press, 1994). The second step was to high
pass filter the EEG at 40 Hz to eliminate any possible splice artifact that may have been
produced by the short segment NeuroGuide editing method described in section 4.1. The
third step was to compute the FFT Power Spectral Density. Four second epochs were
used to compute the FFT Power Spectral Density thus producing 0.5 Hz resolution and a
Hanning window was used for each 4 second epoch computation. The 75% sliding
window method of Kaiser and Sterman (2001) was used to compute the FFT normative
database for linked ears, average reference and Laplacian estimator of current source
density (CSD) in which successive four second epochs were advanced by 500 millisecond
steps in order to minimize the effects of the FFT windowing procedure. The FFT Power
Spectral Density and the 256 point and 2 second epochs produced a total of 61 frequency
values in uv2 /Hz from 0 to 30 Hz in 0.5 Hz increments.
This procedure was repeated for linked ears, average reference and Laplacian
digital values for both the eyes closed and eyes open conditions, thus producing for a

15
given subject a total of six different 61 point FFT power spectral density values. These
values were then used to compute means and standard deviations for different age groups
as described in the next section (5.0)
5.0 – Amplifier and Digital Matching
The frequency characteristics of all amplifiers differ to some extent, especially in
the < 3 Hz and > 20 Hz frequency range and there are no universal standards that all
EEG amplifier manufacturers must abide by. Therefore, amplifier filter and gain
characteristics must be equilibrated to the amplifier gains and frequency characteristics of
the normative EEG amplifiers that acquired the EEG in the first place. A simple method
to accomplish this is to inject into each amplifier system microvolt sine waves from 0 to
40 Hz in 1 Hz steps and at three different amplitudes. The ratio of the frequency response
characteristics between the normative EEG amplifiers and the amplifier characteristics by
which EEG was measured from a patient can be used as equilibration factors to
approximately match the norms. There are some frequencies that are so severely
attenuated by the amplifier filters that equilibration to the normative database amplifiers
will not be able to recover the signal. For example, rations of > 5.0 will significantly
amplify the noise of the amplifiers where little or no EEG signal is present and render the
Z scores invalid.
It should be kept in mind, that even with matching of amplifier characteristics
within 3 to 5% error the enormous variability in skull thickness effects the amplitude and
frequency characteristics of the EEG itself far more than slight differences in amplifier
characteristics. For example, the human skull is on the average 80 times less conductive
than the brain and scalp. Therefore, an individual with a 10% thinner skull may be result
16
in a 800% change in EEG amplitude across all frequencies.
6.0- Statistical Foundations: Gaussian Distributions
The Gaussian or Normal distribution is a non-linear function that looks like a
ideal bell shaped curve and provides a probability distribution which is symmetrical about
its mean. Skewness and kurtosis are measures of the symmetry and peakedness,
respectively of the gaussian distribution. In the ideal case of the Gaussian distribution
skewness and kurtosis = 0. In the real world of data sampling distributions skewness and
kurtosis = 0 is never achieved and, therefore, some reasonable standard of deviation from
the ideal is needed in order to determine the approximation of a distribution to Gaussian.
In the case of the Lifespan EEG Database we used the criteria of approximation as a
reasonable measure of Gaussian distribution. The most serious type of deviation from
normality is "Skewness" or a unsymmetrical distribution about the mean (e.g., a tail to the
left or right of the mean), while the second form of deviation from normality "Kurtosis" is
the amount of peakedness in the distribution, which is not as serious an offense since the
variance is symmetrical about the mean (mean = median). However, it is preferable to
attempt to achieve normality as best as one can to insure unbiased estimates of error. The
primary reason to achieve "Normality" is that the sensitivity of any normative database is
determined directly by the shape of the sampling distribution. In a normal distribution,
for example, one would expect that 5% of the samples will be equal to or greater than 2
standard deviations and approximately .13 % 3 SD.
It is important to note that automatic and blindly applied transformations of EEG
measures does not insure improved normality of the sampling distribution. For example,
17
it is simple to demonstrate that while some transformations may improve the normality of
distributions, these same transforms can also degrade the normality of the distributions.
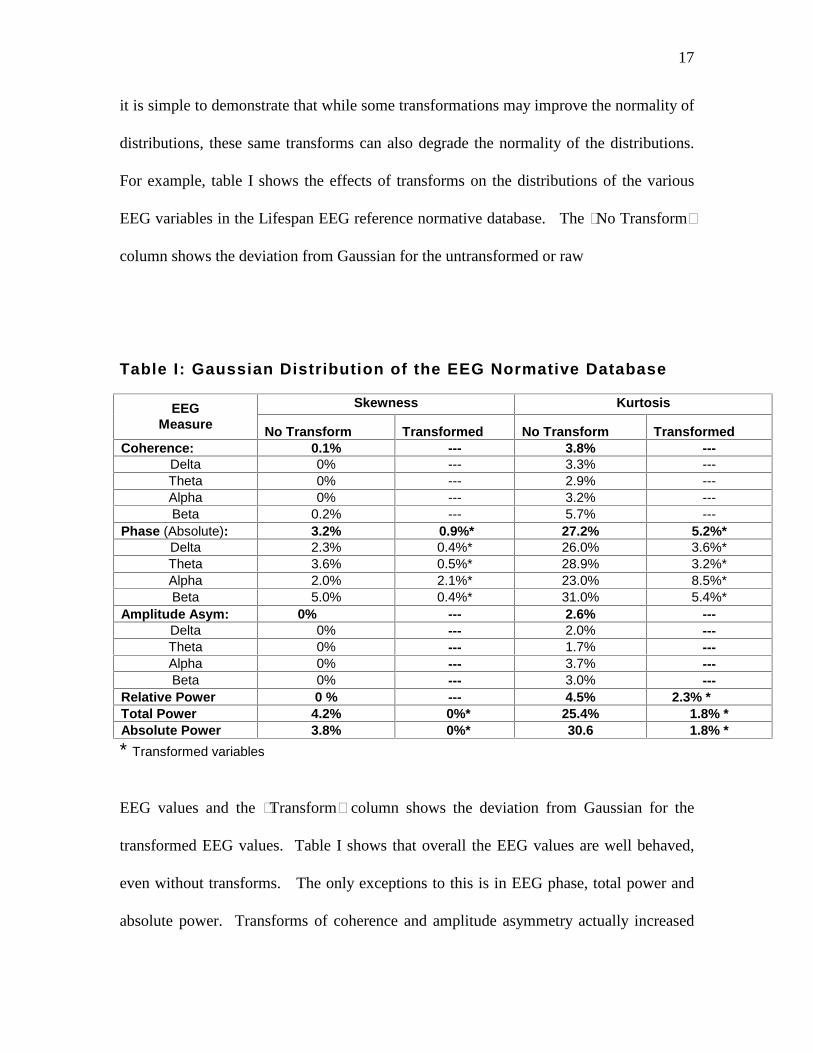
For example, table I shows the effects of transforms on the distributions of the various
EEG variables in the Lifespan EEG reference normative database. The “No Transform”
column shows the deviation from Gaussian for the untransformed or raw
Table I: Gaussian Distribution of the EEG Normative Database
Skewness Kurtosis EEG Measure No Transform Transformed No Transform Transformed
Coherence: 0.1% --- 3.8% --- Delta 0% --- 3.3% --- Theta 0% --- 2.9% --- Alpha 0% --- 3.2% --- Beta 0.2% --- 5.7% ---
Phase (Absolute): 3.2% 0.9%* 27.2% 5.2%* Delta 2.3% 0.4%* 26.0% 3.6%* Theta 3.6% 0.5%* 28.9% 3.2%* Alpha 2.0% 2.1%* 23.0% 8.5%* Beta 5.0% 0.4%* 31.0% 5.4%*
Amplitude Asym: 0% --- 2.6% --- Delta 0% --- 2.0% --- Theta 0% --- 1.7% --- Alpha 0% --- 3.7% --- Beta 0% --- 3.0% ---
Relative Power 0 % --- 4.5% 2.3% * Total Power 4.2% 0%* 25.4% 1.8% * Absolute Power 3.8% 0%* 30.6 1.8% *
* Transformed variables
EEG values and the “Transform” column shows the deviation from Gaussian for the
transformed EEG values. Table I shows that overall the EEG values are well behaved,
even without transforms. The only exceptions to this is in EEG phase, total power and
absolute power. Transforms of coherence and amplitude asymmetry actually increased

18
skewness or kurtosis, thus blind transformations is not recommended. The asterisks in
Table I identify which transformed variables are used in the Lifespan EEG normative
database. It can be seen that only the transformed EEG phase and the power variables are
contained in the database. Table I provides the statistics of Gaussian distribution of the
database. The user of the normative database should take into account the different
degrees of Gaussian fits of the different variables to understand which variables deviate
from normality and to what extent. This information should be used when making
clinical evaluations based on the database.
6.1- Statistical Foundations: Cross-Validation
As mentioned in section 5.0 the statistical accuracy or sensitivity of a normative
database is judged, directly, by the Gaussian distribution of the database. The Supreme
Court’s Dalbert Factor One is met because the Gaussian is the null-hypothesis which
was tested and Factor Two will be met by any database because the error estimate was
tested and adjusted to approximate a Gaussian distribution. Daubert factors one and two
are expressed as the Gaussian sensitivity and accuracy of a database as provided by cross-
validation (see Figure 1). There are many different ways to cross-validate a database.
One is to obtain independent samples and another is to compute Z scores for each
individual subject in the database. The former is generally not possible because it
requires sampling large numbers of additional subjects who have been carefully screened
for clinical normality without a history of problems in school, etc. The second method is
certainly possible for any database. Cross-validation of the Lifespan EEG database was
accomplished by the latter method in which Z scores were computed using a leave-one-
19
out procedure for all variables from each individual subject based on his/her respective
age matched mean and SD in the normative database. A distribution of Z scores for each
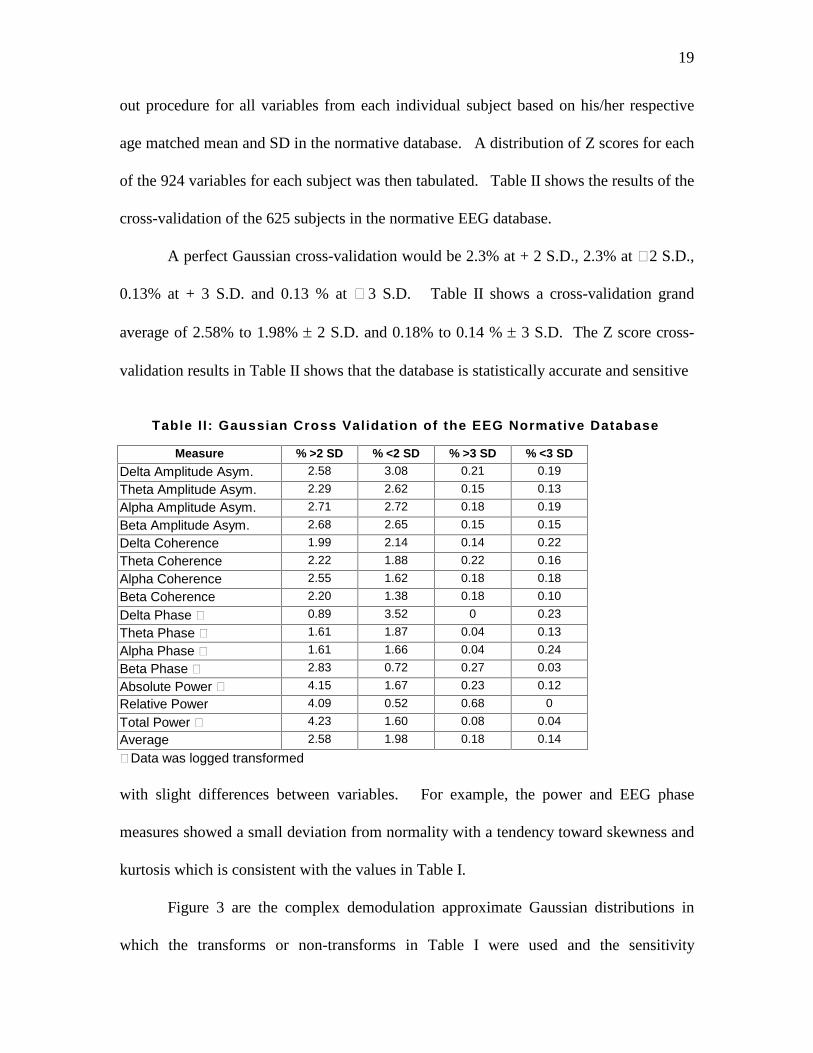
of the 924 variables for each subject was then tabulated. Table II shows the results of the
cross-validation of the 625 subjects in the normative EEG database.
A perfect Gaussian cross-validation would be 2.3% at + 2 S.D., 2.3% at – 2 S.D.,
0.13% at + 3 S.D. and 0.13 % at – 3 S.D. Table II shows a cross-validation grand
average of 2.58% to 1.98% 2 S.D. and 0.18% to 0.14 % 3 S.D. The Z score cross-
validation results in Table II shows that the database is statistically accurate and sensitive
Table I I: Gaussian Cross Validation of the EEG Normative Database
Measure % >2 SD % <2 SD % >3 SD % <3 SD
Delta Amplitude Asym. 2.58 3.08 0.21 0.19
Theta Amplitude Asym. 2.29 2.62 0.15 0.13
Alpha Amplitude Asym. 2.71 2.72 0.18 0.19
Beta Amplitude Asym. 2.68 2.65 0.15 0.15
Delta Coherence 1.99 2.14 0.14 0.22
Theta Coherence 2.22 1.88 0.22 0.16
Alpha Coherence 2.55 1.62 0.18 0.18
Beta Coherence 2.20 1.38 0.18 0.10
Delta Phase † 0.89 3.52 0 0.23
Theta Phase † 1.61 1.87 0.04 0.13
Alpha Phase † 1.61 1.66 0.04 0.24
Beta Phase † 2.83 0.72 0.27 0.03
Absolute Power † 4.15 1.67 0.23 0.12
Relative Power 4.09 0.52 0.68 0
Total Power † 4.23 1.60 0.08 0.04
Average 2.58 1.98 0.18 0.14
† Data was logged transformed with slight differences between variables. For example, the power and EEG phase
measures showed a small deviation from normality with a tendency toward skewness and
kurtosis which is consistent with the values in Table I.
Figure 3 are the complex demodulation approximate Gaussian distributions in
which the transforms or non-transforms in Table I were used and the sensitivity

20
calculated as illustrated in Figure 4. Table III is an example of a standard Table of
Sensitivities for one of the FFT databases.
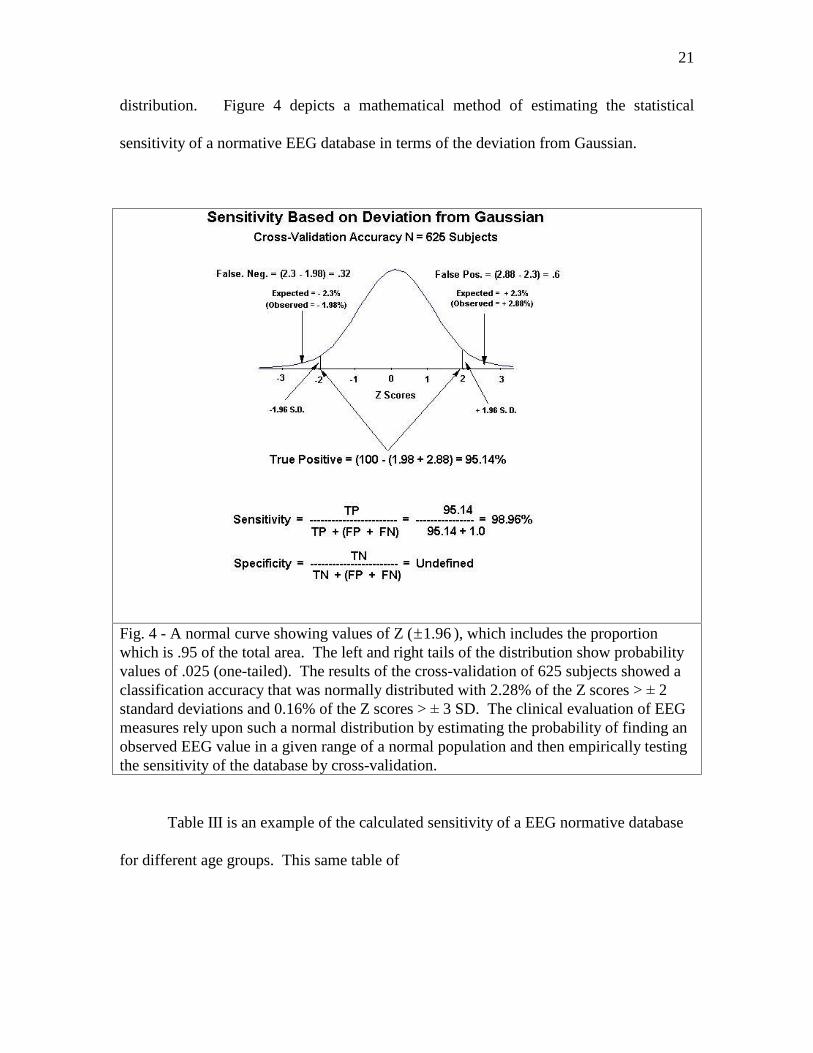
Figure 4 is an illustrative bell shaped curve showing the ideal Gaussian and the
average cross-validation values of the database by which estimates of statistical
sensitivity can be derived. True positives (TP) = the percentage of Z scores that lay
within the tails of the
Fig. 3 - Histograms of the complex demodulation Z Score Cross-Validation for all ages.
Gaussian distribution, False negatives (FN) = the percentage of Z scores that fall outside
of the tails of the Gaussian distribution. The error rates or the statistical sensitivity of a
QEEG normative database are directly related to the deviation from a Gaussian
21
distribution. Figure 4 depicts a mathematical method of estimating the statistical
sensitivity of a normative EEG database in terms of the deviation from Gaussian.
Fig. 4 - A normal curve showing values of Z (1.96 ), which includes the proportion which is .95 of the total area. The left and right tails of the distribution show probability values of .025 (one-tailed). The results of the cross-validation of 625 subjects showed a classification accuracy that was normally distributed with 2.28% of the Z scores > ± 2 standard deviations and 0.16% of the Z scores > ± 3 SD. The clinical evaluation of EEG measures rely upon such a normal distribution by estimating the probability of finding an observed EEG value in a given range of a normal population and then empirically testing the sensitivity of the database by cross-validation.
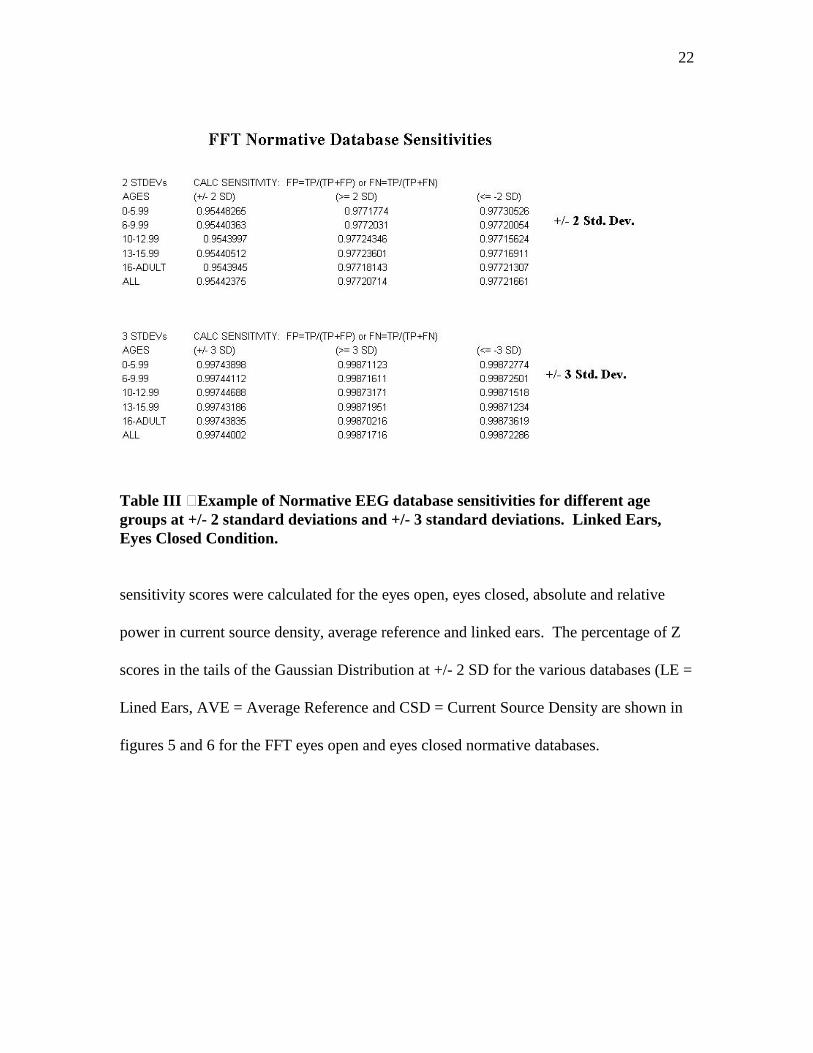
Table III is an example of the calculated sensitivity of a EEG normative database
for different age groups. This same table of
22
Table III – Example of Normative EEG database sensitivities for different age groups at +/- 2 standard deviations and +/- 3 standard deviations. Linked Ears, Eyes Closed Condition.
sensitivity scores were calculated for the eyes open, eyes closed, absolute and relative
power in current source density, average reference and linked ears. The percentage of Z
scores in the tails of the Gaussian Distribution at +/- 2 SD for the various databases (LE =
Lined Ears, AVE = Average Reference and CSD = Current Source Density are shown in
figures 5 and 6 for the FFT eyes open and eyes closed normative databases.

23
0.00%
0.50%
1.00%
1.50%
2.00%
2.50%
3.00%
Percentage in Tails of Gaussian Distribution
+/- 2SD
LE-EC AVE-LC CSD-EC
EYES CLOSED NORMS - IDEAL = 2.3%
<2SD
>2SD
Fig. 5 - Bar graphs of percentage deviation of Z scores from the ideal Gaussian cross-validation in eyes closed Linked Ears, Average Reference and Current Source Density norms.
The reliability of different Gaussian databases can be measured directly by their
deviation from Gaussian because the same normative individual subjects are used to
validate the different EEG normative databases. For example, Average reference norms
and Current

24
0.00%
0.50%
1.00%
1.50%
2.00%
2.50%
3.00%
Percentage in Tails of Gaussian Distribution
+/- 2 SD
LE-EO AVE-EC CSD-EO
EYES OPEN NORMS - IDEAL = 2.3%
<2SD
>2SD
Fig. 6. - Bar graphs of the percentage deviation from the ideal Gaussian cross-validation in the eyes open condition Linked Ears, Average Reference and Current Source Density norms. Source Density norms, when cross-validated using the same subjects as for the Linked
Ears norms gives rise to a reliability coefficient and a statistical reliability
reference. The null hypothesis , reliability = 0 can be directly tested using seven different
norms in NeuroGuide.
Figure 7 is an example of visually verifiable reliability and repeatability of the
spectra of Z scores using three different montages (Linked ears, Average Reference &
Current Source Density) derived from the same edited samples of EEG in a traumatic
brain injured patient (TBI)

25
Fig. 7 - Example of reliability between different normative databases and montages in a TBI patient. The general spectral shape is consistently present while the magnitude of deviation from normal and the spatial localization of the deviation increased from Linked Ears to Average Reference to CSD. CSD (i.e., the second spatial derivative) is also more “noisy” as expected.
7.0 – Statistical Foundations: Validation by Clinical Correlations
Validity concerns the relationship between what is being measured and the
natureand use to which the measurement is being applied. Another way to put it is that
validity is defined as the extent to which any measuring instrument measures what it is
intended to measure. Just as reliability is a matter of degree, so also is validity.
Hypothesis formation and hypothesis testing as emphasized in Daubert (1993) is an
important part of determining the validity of a scientific measure.
26
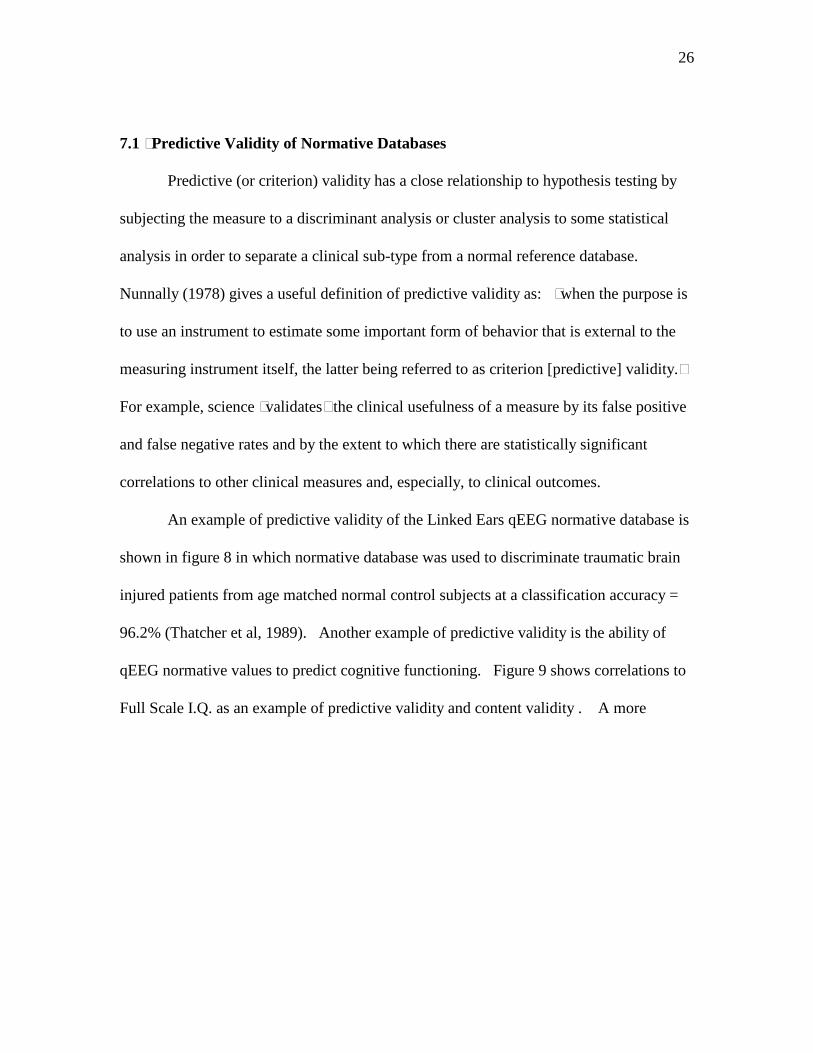
7.1 –Predictive Validity of Normative Databases
Predictive (or criterion) validity has a close relationship to hypothesis testing by
subjecting the measure to a discriminant analysis or cluster analysis to some statistical
analysis in order to separate a clinical sub-type from a normal reference database.
Nunnally (1978) gives a useful definition of predictive validity as: “when the purpose is
to use an instrument to estimate some important form of behavior that is external to the
measuring instrument itself, the latter being referred to as criterion [predictive] validity.”
For example, science “validates” the clinical usefulness of a measure by its false positive
and false negative rates and by the extent to which there are statistically significant
correlations to other clinical measures and, especially, to clinical outcomes.
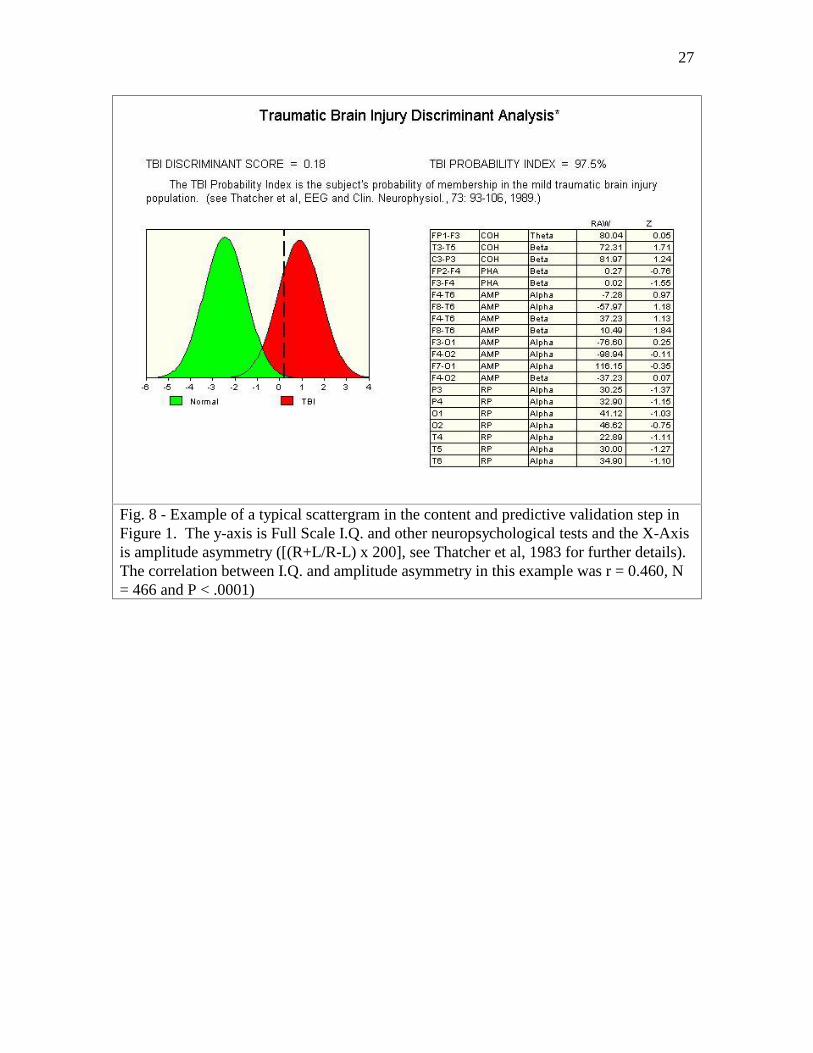
An example of predictive validity of the Linked Ears qEEG normative database is
shown in figure 8 in which normative database was used to discriminate traumatic brain
injured patients from age matched normal control subjects at a classification accuracy =
96.2% (Thatcher et al, 1989). Another example of predictive validity is the ability of
qEEG normative values to predict cognitive functioning. Figure 9 shows correlations to
Full Scale I.Q. as an example of predictive validity and content validity . A more
27
Fig. 8 - Example of a typical scattergram in the content and predictive validation step in Figure 1. The y-axis is Full Scale I.Q. and other neuropsychological tests and the X-Axis is amplitude asymmetry ([(R+L/R-L) x 200], see Thatcher et al, 1983 for further details). The correlation between I.Q. and amplitude asymmetry in this example was r = 0.460, N = 466 and P < .0001)

28
Fig. 9 - Example of a typical scattergram in the content and predictive validation step in Figure 1. The y-axis is Full Scale I.Q. and other neuropsychological tests and the X-Axis is amplitude asymmetry ([(R+L/R-L) x 200], see Thatcher et al, 1983 for further details). The correlation between I.Q. and amplitude asymmetry in this example was r = 0.460, N = 466 and P < .0001)
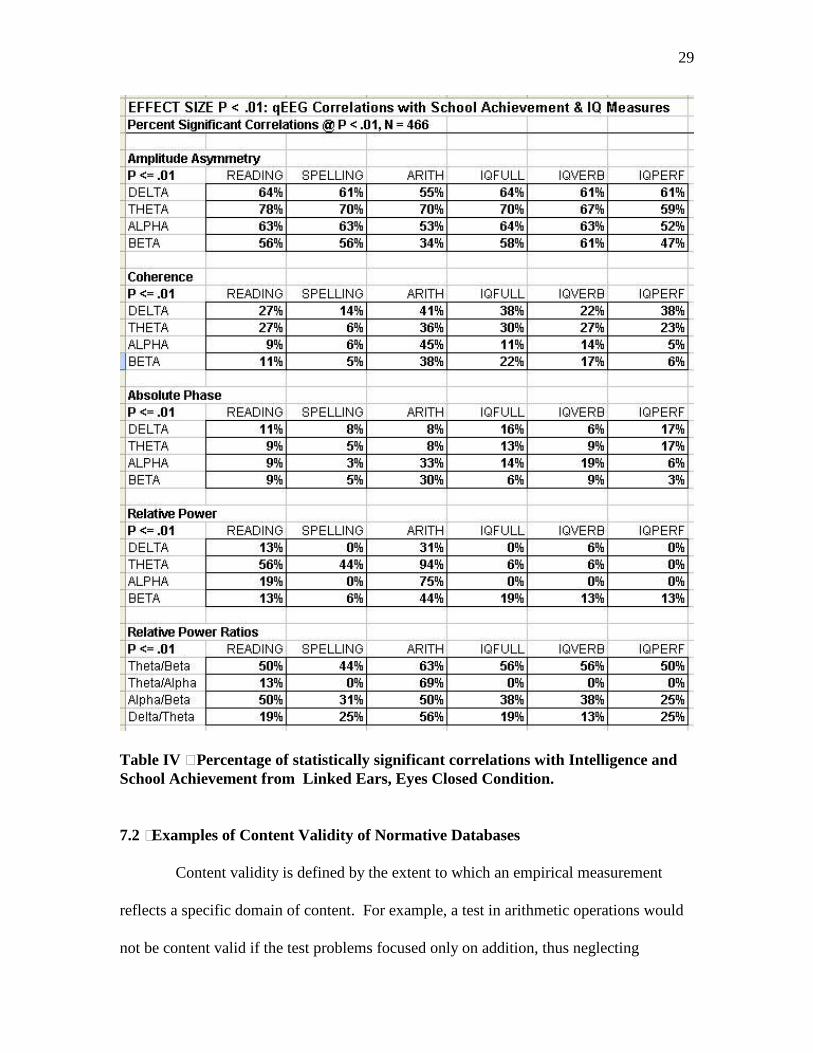
complete analysis of the predictive validity of the normative EEG database is shown in
Table IV. In this table the percentage of statistically significant correlations at P < .01.
between qEEG normative EEG and WRAT School Achievement scores and measures of
intelligence.
29
Table IV – Percentage of statistically significant correlations with Intelligence and School Achievement from Linked Ears, Eyes Closed Condition.
7.2 –Examples of Content Validity of Normative Databases
Content validity is defined by the extent to which an empirical measurement
reflects a specific domain of content. For example, a test in arithmetic operations would
not be content valid if the test problems focused only on addition, thus neglecting

30
subtraction, multiplication and division. By the same token, a content-valid measure of
cognitive decline following a stroke should include measures of memory capacity,
attention and executive function, etc.
There are many examples of the clinical content validity of qEEG and normative
databases in ADD, ADHD, Schizophrenia, Compulsive disorders, Depression, Epilepsy,
TBI and a wide number of clinical groupings of patients as reviewed by Hughes and John,
(1999). There are over 280 citations in the review by Hughes and John (1999) and there
are approximately twenty three citations to peer reviewed journal articles in which a
normal reference database was used. A year 2003 Internet search of the National Library
of Medicine will give citations to many more qEEG and content validity peer reviewed
studies using a reference normal group than were included in the Hughes and John (1999)
review.
8.0 – Non-Parametric Statistics to Measure Content Validity of a qEEG Normative Database Non-parametric statistics such as the Binomial Probability and for small sample
sizes the Poisson Probability are simple non-parametric tests that are distribution free and
automatically adjust for multiple comparisons. The catch is that the non-parametric
statistics must define an hypothesis by a specific statistical probability alpha level,
otherwise they do not work. . The Binomial Distribution which is defined as
xNxNx ppXP )1( of successful outcomes at a specific probability, for example, P
< .01 for a specific hypothesis. N = the number of Z-tests, p is the ‘success rate’ and 1
– p the ‘failure rate’ for the test of the null hypothesis, x = the number of observed Z
scores at a given probability level, e.g., P < .01. For example, the null hypothesis is that
by chance there will be 1 event per 64 observations at P < .01. The experiment is run
and there were 5 observations at P < .01. The exact probability as computed by the
Binomial Equation = P < .000421394.
31
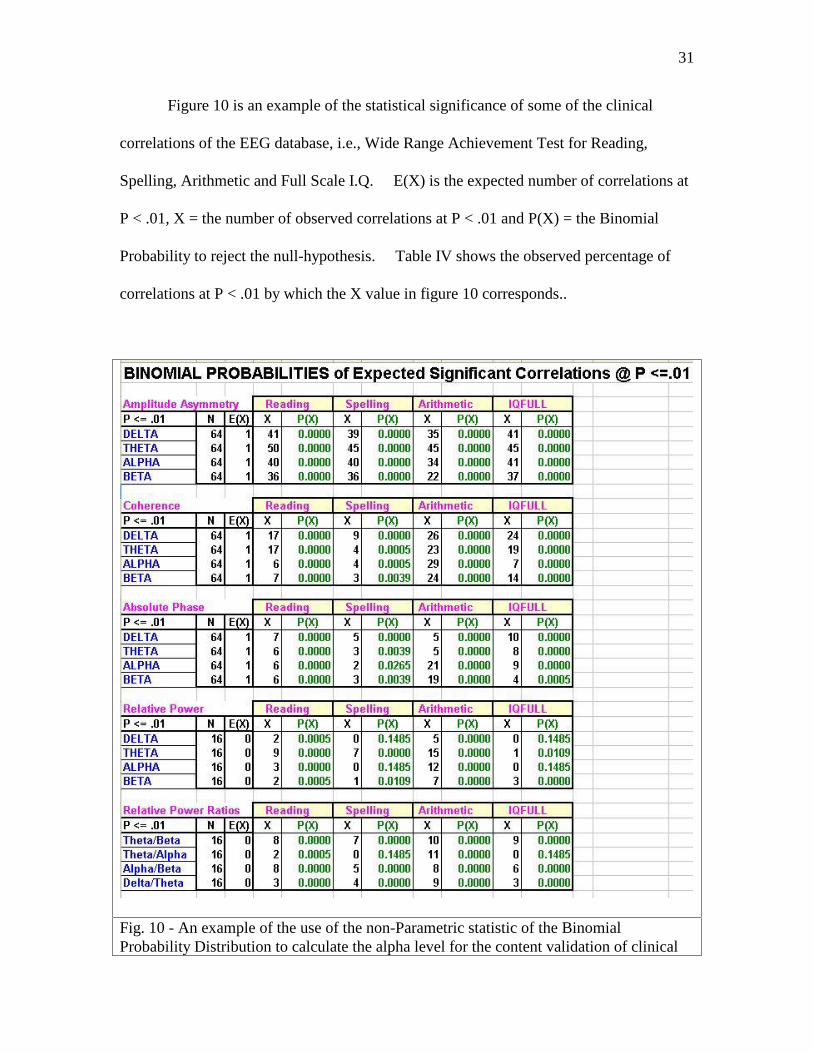
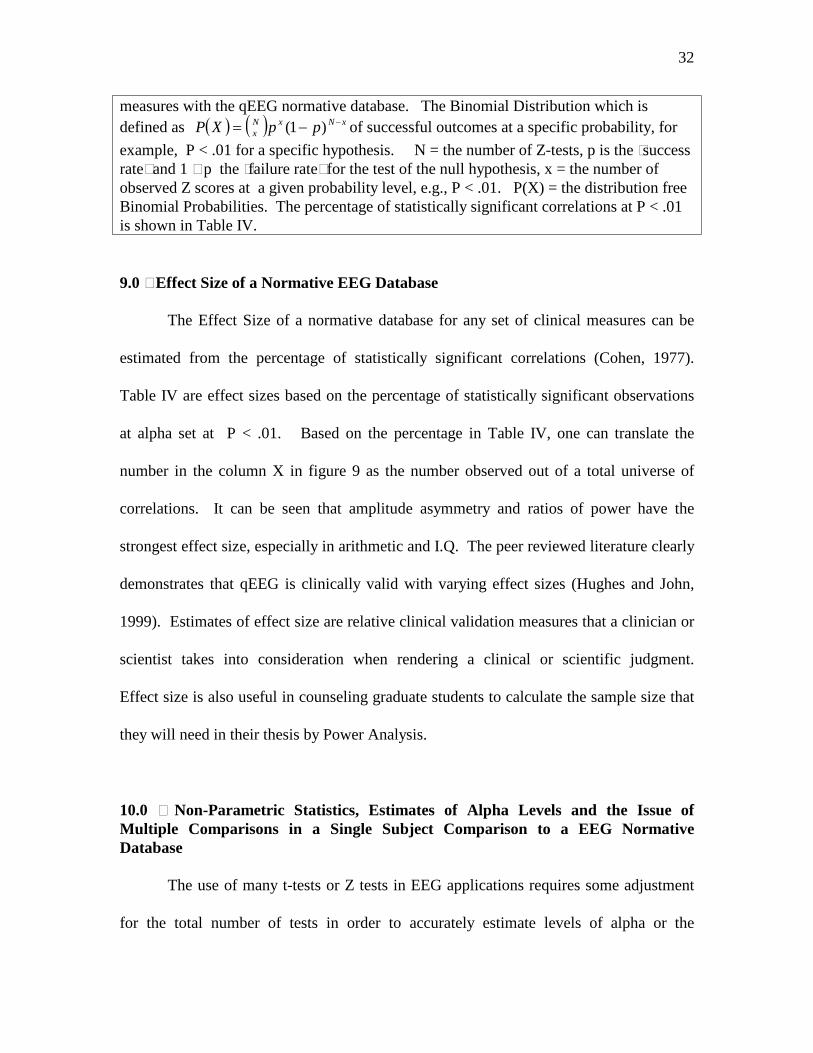
Figure 10 is an example of the statistical significance of some of the clinical
correlations of the EEG database, i.e., Wide Range Achievement Test for Reading,
Spelling, Arithmetic and Full Scale I.Q. E(X) is the expected number of correlations at
P < .01, X = the number of observed correlations at P < .01 and P(X) = the Binomial
Probability to reject the null-hypothesis. Table IV shows the observed percentage of
correlations at P < .01 by which the X value in figure 10 corresponds..
Fig. 10 - An example of the use of the non-Parametric statistic of the Binomial Probability Distribution to calculate the alpha level for the content validation of clinical
32
measures with the qEEG normative database. The Binomial Distribution which is defined as xNxN
x ppXP )1( of successful outcomes at a specific probability, for
example, P < .01 for a specific hypothesis. N = the number of Z-tests, p is the ‘success rate’ and 1 – p the ‘failure rate’ for the test of the null hypothesis, x = the number of observed Z scores at a given probability level, e.g., P < .01. P(X) = the distribution free Binomial Probabilities. The percentage of statistically significant correlations at P < .01 is shown in Table IV.
9.0 – Effect Size of a Normative EEG Database
The Effect Size of a normative database for any set of clinical measures can be
estimated from the percentage of statistically significant correlations (Cohen, 1977).
Table IV are effect sizes based on the percentage of statistically significant observations
at alpha set at P < .01. Based on the percentage in Table IV, one can translate the
number in the column X in figure 9 as the number observed out of a total universe of
correlations. It can be seen that amplitude asymmetry and ratios of power have the
strongest effect size, especially in arithmetic and I.Q. The peer reviewed literature clearly
demonstrates that qEEG is clinically valid with varying effect sizes (Hughes and John,
1999). Estimates of effect size are relative clinical validation measures that a clinician or
scientist takes into consideration when rendering a clinical or scientific judgment.
Effect size is also useful in counseling graduate students to calculate the sample size that
they will need in their thesis by Power Analysis.
10.0 – Non-Parametric Statistics, Estimates of Alpha Levels and the Issue of Multiple Comparisons in a Single Subject Comparison to a EEG Normative Database The use of many t-tests or Z tests in EEG applications requires some adjustment
for the total number of tests in order to accurately estimate levels of alpha or the
33
probability of a Type I error (i.e., saying something is statistically significant when it is
not). As explained by Hayes (1973) Multiple comparisons refers to multiple group
comparisons and not to the adjustment of the total number of t-tests or Z-tests, where as,
non-parametric statistics is one of the best methods to adjust for both Type I and Type II
error rates.
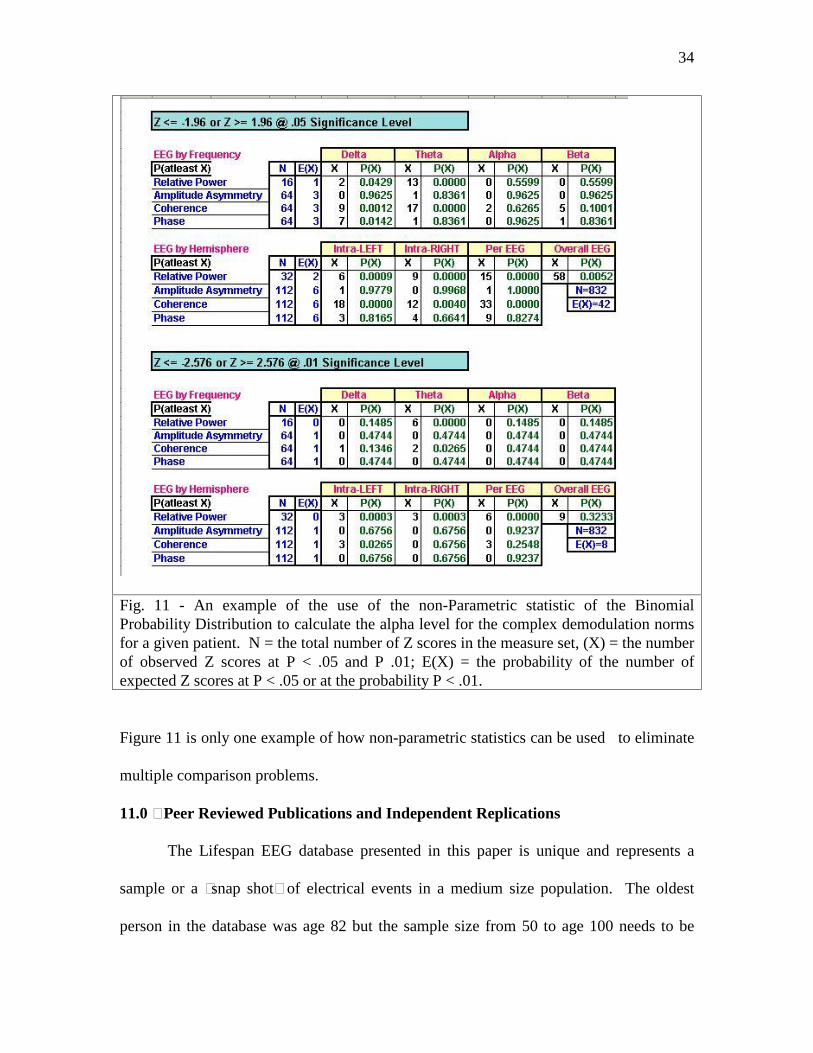
Figure 11 shows an example of the use of the Binomial Probability Distribution to
determine the alpha level for a single subject’s comparison to the complex demodulation
normative database. The number of Z tests is represented as ‘N’, E(X) = the number
expected by chance alone at P < .05 (Top of Figure 10) or at P < .01 (Bottom of Figure
11), X = the number of successful Z tests observed and P(X) = the Binomial Probability.
34
Fig. 11 - An example of the use of the non-Parametric statistic of the Binomial Probability Distribution to calculate the alpha level for the complex demodulation norms for a given patient. N = the total number of Z scores in the measure set, (X) = the number of observed Z scores at P < .05 and P .01; E(X) = the probability of the number of expected Z scores at P < .05 or at the probability P < .01.
Figure 11 is only one example of how non-parametric statistics can be used to eliminate
multiple comparison problems.
11.0 – Peer Reviewed Publications and Independent Replications
The Lifespan EEG database presented in this paper is unique and represents a
sample or a “snap shot” of electrical events in a medium size population. The oldest
person in the database was age 82 but the sample size from 50 to age 100 needs to be

35
lexpanded as the population grows older. Each normative EEG database is necessarily
unique by virtue of subject selection, number of subjects, age span and arrangement of the
subjects and the digital methods. Also, each EEG database uses different methods to
acquire the EEG and to edit and analyze the EEG and, therefore, replication and
comparisons across EEG databases are often difficult. In order to use any EEG
normative database matching of amplifiers and analytic methods must first be
accomplished. It should be kept in mind, that even with matching of amplifier
characteristics within 3 to 5% error the enormous variability in skull thickness effects the
amplitude and frequency characteristics of the EEG itself far more than slight differences
in amplifier characteristics. For example, the human skull is on the average 80 times less
conductive than the brain and scalp. Therefore, an individual with a 10% thinner skull
may be result in a 800% change in EEG amplitude across all frequencies.
Although precise replication is difficult for any of the existing EEG databases,
nevertheless, independent replication of certain aspects of the Lifespan EEG Database
have been published. Also, most of the acquisition methods, analysis methods and
results of experiments using the Lifespan EEG database have been published in refereed
journals which are cited below. Aspects of the development of relative power of the
Lifespan EEG norms have been replicated in studies by Matousek and Petersen (1973) as
analyzed by John et al (1977); Fischer (1987); Thatcher (1980), Epstein (1981), and van
Baal (1995) Aspects of the EEG coherence development in the database presented in
this paper have been replicated by Gasser et al (1988) and by van Baal and others in
genetic analyses (van Baal, 1997; van Beijsterveldt CE, et al, 1998; van Baal GC, et al,
1998).

36
11.0 - Bibliography Bendat, J.S. and Piersol, A.G. (1980). Engineering Applications of Correlation and
Spectral Analysis, John Wiley & Sons: New York. Cohen, J. Statistical Power Analysis for the Behavioral Sciences, Academic Press, NY,
1977. Cronbach, L.J. Test Validation, In: R. Thorndike (ed.) Educational Measurement. Washingotn, DC, American Council on Education, 1971. (pp. 443-507). Epstein, H.T. EEG developmental stages. Devel. Psychobiol., 13: 629 - 631, 1980. Daubert v. Merrell Dow Pharmaceuticals (Daubert), 61 U.S.L.W 4805 (U.S. June 29, 1993). Duffy, F., Hughes, J.R., Miranda, F., Bernad, P. and Cook, P. (1994). Status of quantitative EEG (QEEG) in clinical practice, 1994. Clin. Electroencephalography, 25(4), VI - XXII. Epstein, H.T. EEG Developmental Stages. Developmental Psychobiology, 13: 629-631, 1980. Feymman, R.P, Leighton, R.B. and M. Sands. The Feynman Lectures on Physics, Vol II, Addison-Wesley Publishing Co., Reading, Massachusetts, 1964. Fischer, K.W. Relatioins between brain and cognitive development. Child Development, 57: 623-632, 1987 Gasser T, Verleger R, Bacher P, Sroka L Development of the EEG of school-age children and adolescents. I. Analysis of band power. Electroencephalogr Clin Neurophysiol 1988a Feb;69(2):91-9 Gasser T, Jennen-Steinmetz C, Sroka L, Verleger R, Mocks J. Development of the EEG of school-age children and adolescents. II: Topography. Electroencephalogr Clin Neurophysiol 1988b Feb;69(2):100-9. Hanlon, H.W. Togographically different regional networks impose structural limitations on both sexes in early postnatal development. In: K. Pribram & J. King (Eds.), Learning as self-organizaation (pp. 311-376), Mahwah, NJ: Lawrence Erlbaum Assoc., Inc., 1996. Hayes, W. L., Statistics for the Social Sciences, Holt, Rhinehart and Winston, New York, 1973).

37
Hanlon, H.W., Thatcher, R.W. and Cline, M.J. Gender differences in the development of EEG coherence in normal chilkdren. Develop. Neuropsychol., 16(3): 479-506, 1999. John, E.R. Functional Neuroscience, Vol. II. Lawrence Erlbaum Assoc., NJ., 1977. John, E.R. Karmel, B., Corning, W. Easton, P., Brown, D., Ahn, H., John, M., Harmony, T., Prichep, L., Toro, A., Gerson, I., Bartlett, F., Thatcher, R., Kaye, H., Valdes, P., Schwartz, E. (1977). Neurometrics: Numerical taxonomy identifies different profiles of brain functions within groups of behaviorally similar people. Science, l96, 1393-1410. John, E.R., Ahn, H., Prichep, L., Trepetin, M., Brown, D. and Kaye, H. (1980). Developmental equations for the electroencephalogram. Science, 210, 1255-1258. John, E.R., Prichep, L.S., Fridman, J. and Easton, P. (1988). Neurometrics: Computer assisted differential diagnosis of brain dysfunctions. Science, 293, 162-169. Kaiser, D. A. & Sterman, M. B. (2001). Automatic artifact detection, overlapping
windows and state transitions. Journal of Neurotherapy, 4 (3), 85-92. Lubar, J. F. (1997). Neocortical dynamics: Implications for understanding the role of Neurofeedback and related techniques for the enhancement of attention. Applied Psychophysiology and Biofeedback, 22, 111-126. Mahle, S. Daubert and the Law and Science of Expert Testimony in Business Litigation “Business Litigation in Florida," 4th ed. (2001). Malmivuo, J. and Plonsey, R. Bioelectromagnetism. New York, NY: Oxford University Press, 1995. Matousek, M. and Petersen, I. Frequency analysis of the EEG background activity by means of age dependent EEG quotients. In: Automation of Clinical Electroencephalography, P. Kellaway, and Petersen, I. (Eds.), Raven Press, New York, 1973. Nunnally, J.C. Psychometric Theory, McGraw-Hill, New York, 1978. Nunez, P. (1981). Electrical Fields of the Brain, Oxford univ. Press, Cambridge. Nunez, P. Neocortical dynamics and human EEG rhythms, (1995).Oxford Univ. Press, New York. Otnes, R.K. and Enochson, L. Digital Time Series Analysis, New York: John Wiley and Sons, 1972.

38
Press, W.h., Teukolsky, S.A., Vettering, W.T. and Flannery, B.P. Numerical Recipes in C Cambridge Univ. press., 1994. Savitzky, A. and Golay, M.J.E. Smoothing and differentiation of data by simplified least squares procedures. Analytical Chemistry, 36, 1627-1639, 1964. Thatcher, R.W. Neurolinguistics: Theoretical and evolutionary perspectives. Brain and Language, 11, :235-260, 1980. Thatcher, R.W., Lester, M.L., McAlaster, R., and Horst, R. Effects of Low Levels of Cadmium and Lead on Cognitive Functioning in Children, Archives of Environmental Health, 37: 159-166, 1982. Thatcher, R.W., McAlaster, R., Lester, M.L., Horst, R.L. and Cantor, D.S. Hemispheric EEG Asymmetries Related to Cognitive Functioning in Children. In: Cognitive Processing in the Right Hemisphere, A. Perecuman (Ed.), New York: Academic Press, 1983. Thatcher, R.W., and Krause, P. Corticocortical Association Fibers and EEG Coherence: A Two Compartmental Model. Electroencephalog. Clinical Neurophysiol., 64: 123 - 143, 1986. Thatcher, R.W., Walker, R.A. and Guidice, S. Human cerebral hemispheres develop at different rates and ages. Science, 236: 1110-1113, 1987. Thatcher, R.W. A Life Span EEG Normative Database, Copyright TXu 347-139, U.S. Copyright Office, 1988. Thatcher, R.W., Walker, R.A., Gerson, I. and Geisler, F. EEG discriminant analyses of mild head trauma. EEG and Clin. Neurophysiol., 73: 93-106, 1989. Thatcher, R.W. Maturation of the human frontal lobes: Physiological evidence for staging. Developmental Neuropsychology, 7(3): 370-394, 1991. Thatcher, R.W. Cyclic cortical reorganization during early childhood. Brain and Cognition, 20: 24-50, 1992. Thatcher, R.W. Psychopathology of Early Frontal Lobe Damage: Dependence on Cycles of Postnatal Development. Developmental Pathology, 6: 565-596, 1994. Thatcher, R.W. EEG normative databases and EEG biofeedback. J. of Neurotherapy, 2(4): 8 – 39, 1998. Thatcher, R. W., Biver, C., McAlaster, R and Salazar, A.M. Biophysical linkage between MRI and EEG coherence in traumatic brain injury. NeuroImage, 1998a; 8(4), 307-326.
39
Thatcher, R. W., Biver, C., Camacho, M., McAlaster, R and Salazar, A.M. Biophysical linkage between MRI and EEG amplitude in traumatic brain injury. NeuroImage, 7, 352-367, 1998B. Thatcher R.W., Biver, C.L., Gomez-Molina J.F., North, D., Curtin, R. and Walker, R.W., and Salazar, A. Estimation of the EEG Power Spectrum by MRI T2 Relaxation Time in Traumatic Brain Injury. Clinical Neurophysiology, 112: 1729-1745, 2001. Van Baal, C. "A genetic Perspective on the developing Brain: EEG indices of neural functioning in five to seven year old twins, VRIJE University, The Netherlands Organization for Scientific Research (NWO), ISBN: 90- 9010363-5, 1997
van Baal GC, de Geus EJ, Boomsma DI "Genetic influences on EEG coherence in 5-year-old twins", Behav Genet. 1998 Jan;28(1):9-19. van Beijsterveldt CE, Molenaar PC, de Geus EJ, Boomsma DI "Genetic and environmental influences on EEG coherence" Behav Genet 1998 Nov;28(6):443-53. van Beijsterveldt CE, Molenaar PC, de Geus EJ, Boomsma DI. Heritability of human brain functioning as assessed by electroencephalography., Am J Hum Genet. 1996 Mar;58(3):562-73
ACKNOWLEDGEMENTS W would like to acknowledge the assistance and feedback of Dr. Lukasz Knopka, Dr. Joel Lubar, Dr. Grant Bright, Dr. Cory Hammond, Mr. Robert Gurnee, Mr. J.D. Elder, Dr. John DeLuca, Mr. Joe Thomas, Dr. Daniel Kuhn, and many others for their independent evaluations of the NeuroGuide normative databases.