
SENSITIVITY ANALYSIS OF FAULT LEVEL ASSESSMENTS IN HV NETWORKS
14
CIRED Workshop - Rome, 11-12 June 2014 Paper 0200 Paper No 0200 Page 1 / 5 SENSITIVITY ANALYSIS OF FAULT LEVEL ASSESSMENTS IN HV NETWORKS Ali KAZEROONI Samuel JUPE Jonathan BERRY Parsons Brinckerhoff – UK Parsons Brinckerhoff – UK Western Power Distribution - UK [email protected] [email protected] [email protected] Neil MURDOCH Parsons Brinckerhoff – UK [email protected] ABSTRACT In this paper, the effects of the accuracy of HV network parameters on calculated make and break fault levels are investigated. Fault level calculations, using computer models, are an approximation to the behaviour of the actual distribution network and, due to assumed parameter values, include a level of inaccuracy. The results of the fault level sensitivity analysis studies show that the network parameters which have a greater impact on pre-fault voltage levels need to be modelled more accurately. In addition, the fault level sensitivity to general load fault in-feed assumptions given in engineering recommendations is studied. Based on the sensitivity analysis results, recommendations for modelling the HV networks and architecture of a fault level active management system are proposed. INTRODUCTION Growing connections of low-carbon generation to urban distribution networks can increase the fault level of the network, requiring upgrades to electricity network assets. Network upgrades can be prohibitively expensive or entail a long lead time, which can affect the timely connection of distributed generators into the network. The UK aims to have 30% of its electricity provided by renewable sources by 2020 [1]. Birmingham Central Business District (CBD), in the UK, has been identified as an area where a high level of integration of combined heat and power (CHP) plants is expected in HV networks 1 by 2026. As a result of the anticipated level of CHP integration, the fault levels in HV networks could exceed the short circuit ratings of the switchgear. Smart solutions are being demonstrated, as an alternative to traditional network upgrade solutions, in a £17.1m Low Carbon Networks Fund project in the UK, FlexDGrid [2]. FlexDGrid aims to enhance fault level modelling and calculation processes, demonstrating different fault level mitigation technologies in existing primary substations (132kV/11kV) in Birmingham. 1 The high voltage (HV) network refers to the 11kV network. FlexDGrid will propose the solutions which will defer network reinforcement, unlocking capacity for low carbon technologies (such as CHP plants) to be integrated into HV networks. As part of the enhanced fault level assessment process within FlexDGrid, the assumptions that underpin fault level calculations were explored and a questionnaire was conducted to understand the consistency of application of fault level calculation standards amongst distribution network operators (DNOs) in the UK [3]. The outputs of these questionnaires supported the need to understand the sensitivity of calculated fault levels to different parameters of an electricity network model, as well as the assumptions considered in standards and engineering recommendations. Engineering Recommendation (ER) G74 [4] is used by UK DNOs to implement fault level calculations based on the IEC 60909 standard [5]. When implementing ER G74, the pre-fault voltage conditions of the network are determined through a load flow simulation. Fault levels are more sensitive to those parameters which have a greater impact on the calculated pre-fault voltage levels. The operating condition of the generators, tap changer position, network impedance and estimated load demand are among those parameters that may affect the pre-fault voltage levels. The sensitivity analysis methodology has been implemented on sample HV feeders in Birmingham’s CBD. The model parameters are varied within defined ranges and the sensitivity of the calculated fault levels (Making and Breaking) is calculated for each model parameter input to the ER G74 fault level calculation process. The main applications for fault level sensitivity analysis are: · Identifying the parameters of the network model which need to be measured with precision and estimated with a high level of accuracy; · Determining the effect of assumptions recommended in ER G74 on calculated fault levels, and identifying any areas of review required in ER G74.
Transcript of SENSITIVITY ANALYSIS OF FAULT LEVEL ASSESSMENTS IN HV NETWORKS
CIRED Workshop - Rome, 11-12 June 2014Paper 0200
Paper No 0200 Page 1 / 5
SENSITIVITY ANALYSIS OF FAULT LEVEL ASSESSMENTS IN HVNETWORKS
Ali KAZEROONI Samuel JUPE Jonathan BERRY Parsons Brinckerhoff – UK Parsons Brinckerhoff – UK Western Power Distribution - UK
[email protected] [email protected] [email protected]
Neil MURDOCHParsons Brinckerhoff – UK
ABSTRACTIn this paper, the effects of the accuracy of HV networkparameters on calculated make and break fault levelsare investigated. Fault level calculations, usingcomputer models, are an approximation to thebehaviour of the actual distribution network and, due toassumed parameter values, include a level ofinaccuracy. The results of the fault level sensitivityanalysis studies show that the network parameterswhich have a greater impact on pre-fault voltage levelsneed to be modelled more accurately. In addition, thefault level sensitivity to general load fault in-feedassumptions given in engineering recommendations isstudied. Based on the sensitivity analysis results,recommendations for modelling the HV networks andarchitecture of a fault level active management systemare proposed.
INTRODUCTIONGrowing connections of low-carbon generation to urbandistribution networks can increase the fault level of thenetwork, requiring upgrades to electricity networkassets. Network upgrades can be prohibitivelyexpensive or entail a long lead time, which can affectthe timely connection of distributed generators into thenetwork. The UK aims to have 30% of its electricityprovided by renewable sources by 2020 [1].Birmingham Central Business District (CBD), in theUK, has been identified as an area where a high level ofintegration of combined heat and power (CHP) plants isexpected in HV networks1 by 2026. As a result of theanticipated level of CHP integration, the fault levels inHV networks could exceed the short circuit ratings ofthe switchgear. Smart solutions are being demonstrated,as an alternative to traditional network upgradesolutions, in a £17.1m Low Carbon Networks Fundproject in the UK, FlexDGrid [2]. FlexDGrid aims toenhance fault level modelling and calculation processes,demonstrating different fault level mitigationtechnologies in existing primary substations(132kV/11kV) in Birmingham.
1 The high voltage (HV) network refers to the 11kVnetwork.
FlexDGrid will propose the solutions which will defernetwork reinforcement, unlocking capacity for lowcarbon technologies (such as CHP plants) to beintegrated into HV networks.
As part of the enhanced fault level assessment processwithin FlexDGrid, the assumptions that underpin faultlevel calculations were explored and a questionnairewas conducted to understand the consistency ofapplication of fault level calculation standards amongstdistribution network operators (DNOs) in the UK [3].The outputs of these questionnaires supported the needto understand the sensitivity of calculated fault levels todifferent parameters of an electricity network model, aswell as the assumptions considered in standards andengineering recommendations.
Engineering Recommendation (ER) G74 [4] is used byUK DNOs to implement fault level calculations basedon the IEC 60909 standard [5]. When implementing ERG74, the pre-fault voltage conditions of the network aredetermined through a load flow simulation. Fault levelsare more sensitive to those parameters which have agreater impact on the calculated pre-fault voltage levels.The operating condition of the generators, tap changerposition, network impedance and estimated loaddemand are among those parameters that may affect thepre-fault voltage levels.
The sensitivity analysis methodology has beenimplemented on sample HV feeders in Birmingham’sCBD. The model parameters are varied within definedranges and the sensitivity of the calculated fault levels(Making and Breaking) is calculated for each modelparameter input to the ER G74 fault level calculationprocess. The main applications for fault level sensitivityanalysis are:
· Identifying the parameters of the network modelwhich need to be measured with precision andestimated with a high level of accuracy;
· Determining the effect of assumptionsrecommended in ER G74 on calculated faultlevels, and identifying any areas of reviewrequired in ER G74.

CIRED Workshop - Rome, 11-12 June 2014Paper 0200
Paper No 0200 Page 2 / 5
· Developing recommendations on networkoperation schemes and commercial frameworkswhich result in a reduction in the fault levels on11 kV networks and facilitate the increasedintegration of distributed generators; and
· Improving the accuracy of desktop analysisthrough the adjustment of model parameterswhich have a high impact on fault level. Thisapplication is important for the validation ofmonitored fault level values.
The remainder of this paper is organized as follows.First, a review of the assumptions and process for faultlevel calculation using a computer model is presented,along with the assumptions recommended in ER G74.Next, the methodology used for fault level sensitivityanalysis is presented. Following this, the results ofsensitivity analysis are presented and discussed. Apossible architecture for an active network managementsystem is discussed and finally, concluding remarks andrecommendations are presented.
COMPUTATIONAL ANALYSIS OF FAULTLEVELThe fault level assessment is usually carried out using acomputer model of the electricity network. A keylearning point from the UK DNOs survey was that, forHV network fault assessments, only the HV network ismodelled in detail and equivalent models are used fordownstream (LV) and upstream networks (EHV). Thecomputer models represent a snapshot of the networkconditions for the worst case (highest) fault levels.
IEC 60609 is widely utilised for fault level calculationsby DNO and Transmission network operatorscompanies. Engineering Recommendation (ER) G74 isused by UK DNOs to implement the IEC 60909standard for desktop fault level calculations. One of thedifferences between ER G74 and IEC 60609 is the pre-fault voltage conditions assumed for fault levelcalculation. IEC 60609 recommends a conservativeapproach using ‘C factor’ multipliers, which createartificially high network voltage levels for fault currentcalculation, whereas ER G74 utilises the calculated pre-fault voltage levels from a power flow analysis.
The pre-fault voltage levels are affected by the modelparameters of the network. Every component of thecomputer model has associated bands of accuracy. Thedegree to which the components’ values can vary affectsthe pre-fault voltage levels and consequently thecalculated fault levels. In this paper the followingnetwork parameters and assumptions which can have ahigh impact on voltage levels and fault levels areconsidered:
· Generators’ operating power factor· Circuit impedance· Tap changer position· General load fault in-feed· Demand
Network model parametersGenerator power factorThe power factor at which a generator operates has animpact on the fault current contribution of thatgenerator. The internal voltage and the impedance (sub-transient/transient) of a generator determine the faultcurrent contribution from the generator. The generator’sinternal voltage, however, has a vector relationship withthe pre-fault voltage at the connection point and the pre-fault generator output current. Figure 1 shows aThevenin model of a single generator connected to thenetwork. In Figure 1, Vs is the internal voltage, Xs is thesynchronous impedance, VT is the voltage at thegenerator’s connection point to the network and IG is theoutput current of the generator. The vector relationshipsbetween these variables, when the generator operates indifferent power factors, are shown in Figure 2. Themagnitude of the generator’s internal voltage is greaterthan the voltage at the connection point when agenerator operates in lagging and unity power factor,whereas in leading power factor the internal voltage islower than the network’s voltage.
Figure 1: Thevenin model of a generator connected to thenetwork
Figure 2: The vector calculation for generator internal voltagewhen it operates at (from top to bottom) Unity power factor,Lagging power factor, and Leading power factor

CIRED Workshop - Rome, 11-12 June 2014Paper 0200
Paper No 0200 Page 3 / 5
It should be noted that the generator operation powerfactor can affect the network voltage (VT), however,network voltage depends on the operating conditions ofall network components. Therefore, in a real system,different operating power factors versus differentnetwork voltages can be envisaged.
Figure 3 shows the variation in initial rms fault currentcontribution for a 1 p.u. rated output generator when itoperates at different network voltage levels and powerfactors.
Figure 3: The effect of power factor on generator initial rmsfault in-feed (The sub-transient reactance of the generator isassumed to be 0.20 pu)
Circuit impedanceThe circuit length or impedance of a network model hassources of uncertainty, resulting in levels of inaccuracy.This inaccuracy can stem from:
· Ageing effects of conductor on the actualcircuit length and the conductor electricalparameters (e.g. resistance and reactance);
· Inaccurate estimated lengths of conductor foreach circuit section (line sag and the terrainslopes in the trajectory of cables may beneglected);
· Assumed types of conductors, which may beincorrect (when conductor type records for partof a network are missing or conductordatabases are not accurately maintained).
· Assumed resistance; whether “cold DC” or“hot AC”.
Tap Changer Positions at primary substationTransformer tapping is a regular operational exercise tomaintain the voltage profile on the network within theacceptable limits. The position of the tap at the upstreamsubstations can alter the voltage profile of the networkand consequently the fault current contributions. Theactual position of the tap changer, when a fault occurs inthe network, may differ significantly from the modelledposition. The impedance of the transformer may alsochange for different tap positions.
General load fault in-feedThe load demand on the network consists of rotatingmachines which can contribute to fault level. Modellingall the rotating machines is difficult and timeconsuming. ER G74 states “where measured values arenot available, the following indicative allowances canbe used for calculating the initial three-phasesymmetrical RMS short-circuit current contribution at a33kV busbar from the asynchronous motors in thegeneral load supplied from that busbar: For loadconnected to the supply network at (i) low voltage,allow 1.0 MVA per MVA of aggregate low voltagenetwork substation winter demand; (ii) high voltageallow 2.6 MVA per MVA of aggregate winter demand.These contributions relate to a complete loss of supplyvoltage to the motors.”.. This assumption may need tobe revisited due to variations in load composition since1992 when ER G74 was first published. It is also notclear how the general load fault contribution woulddiffer when alternative voltage levels are considered(for example at 11kV and 6.6kV).
DemandThe calculated voltage profile can be affected by themagnitude of the estimated demand in a network model.For the purpose of network studies in extremeconditions, the maximum or minimum aggregated loadis usually estimated and modeled at the distribution(HV/LV) substation. The accuracy of the estimated loadmay be affected due to lack of information and recordedloadings of distribution substations. In addition, It isimportant that the demand accurately reflects truedemand, not merely “demand - embedded generation”.It is expected that some degree of inaccuracy incalculated voltage profile and fault level stems from theinaccuracy in estimated demand.
METHODOLOGYAn electricity network computer model represents asnapshot of the network operational conditions. If thenetwork model parameters are changed from theiroriginal values, the model representation will deviatefrom the original operational condition. For the purposeof the sensitivity analysis, a PSS/E model of a samplenetwork, representing part of Birmingham’s 11kVnetwork, has been considered, as given in Figure 4.Feeder A and Feeder B represent a long feeder and ashort feeder respectively. These feeders are supplied byan upstream 132/11kV primary transformer. Fourgenerators with a total capacity of 4.6 MVA andstochastic connection points are assumed in the samplemodel. All generators are operating at 0.415kV (at unitypower factor) and are connected to the 11kV networkwith 11/0.415kV transformers. The total demandsupplied through feeder A and feeder B is 4.74 MVAand 1.56 MVA respectively.
4.0
4.5
5.0
5.5
6.0
0.9 0.95 1 1.05 1.1
Faul
tcur
rent
cont
ribut
ion
[p.u
.]
Voltage [p.u.]0.9 Lag 0.95 Lag Unity 0.95 Lead 0.9 Lead
CIRED Workshop - Rome, 11-12 June 2014Paper 0200
Paper No 0200 Page 4 / 5
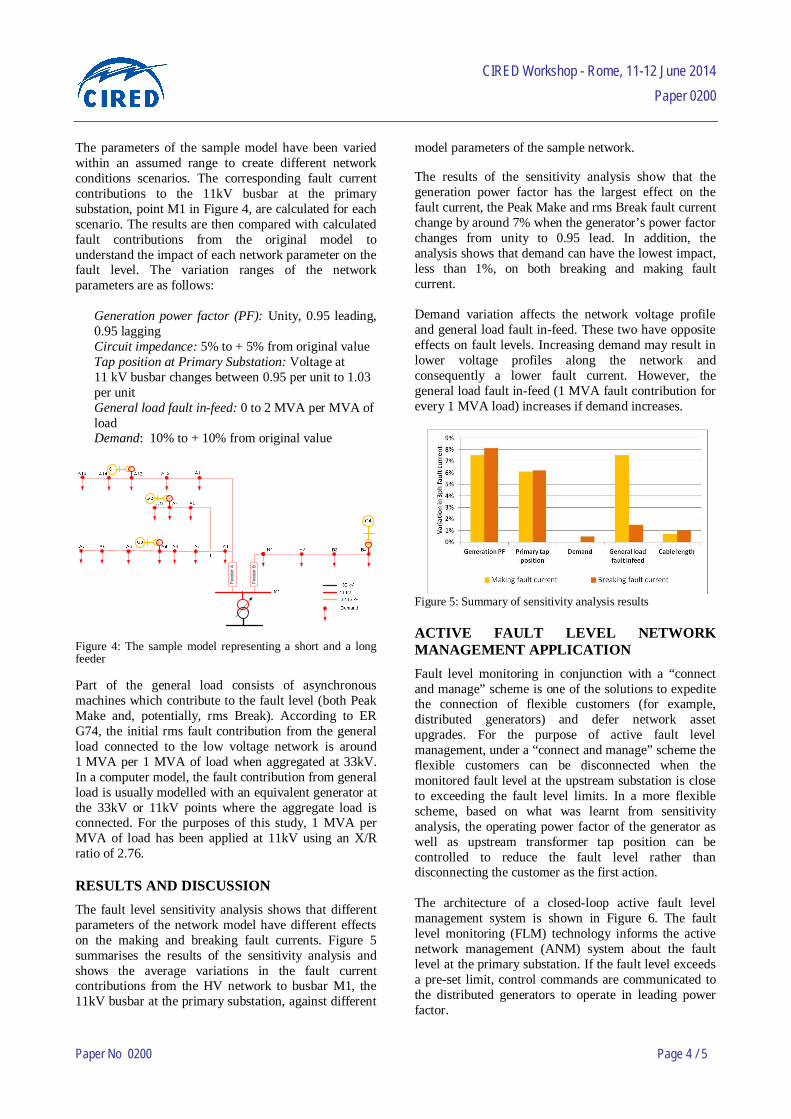
The parameters of the sample model have been variedwithin an assumed range to create different networkconditions scenarios. The corresponding fault currentcontributions to the 11kV busbar at the primarysubstation, point M1 in Figure 4, are calculated for eachscenario. The results are then compared with calculatedfault contributions from the original model tounderstand the impact of each network parameter on thefault level. The variation ranges of the networkparameters are as follows:
Generation power factor (PF): Unity, 0.95 leading,0.95 laggingCircuit impedance: 5% to + 5% from original valueTap position at Primary Substation: Voltage at11 kV busbar changes between 0.95 per unit to 1.03per unitGeneral load fault in-feed: 0 to 2 MVA per MVA ofloadDemand: 10% to + 10% from original value
Figure 4: The sample model representing a short and a longfeeder
Part of the general load consists of asynchronousmachines which contribute to the fault level (both PeakMake and, potentially, rms Break). According to ERG74, the initial rms fault contribution from the generalload connected to the low voltage network is around1 MVA per 1 MVA of load when aggregated at 33kV.In a computer model, the fault contribution from generalload is usually modelled with an equivalent generator atthe 33kV or 11kV points where the aggregate load isconnected. For the purposes of this study, 1 MVA perMVA of load has been applied at 11kV using an X/Rratio of 2.76.
RESULTS AND DISCUSSIONThe fault level sensitivity analysis shows that differentparameters of the network model have different effectson the making and breaking fault currents. Figure 5summarises the results of the sensitivity analysis andshows the average variations in the fault currentcontributions from the HV network to busbar M1, the11kV busbar at the primary substation, against different
model parameters of the sample network.
The results of the sensitivity analysis show that thegeneration power factor has the largest effect on thefault current, the Peak Make and rms Break fault currentchange by around 7% when the generator’s power factorchanges from unity to 0.95 lead. In addition, theanalysis shows that demand can have the lowest impact,less than 1%, on both breaking and making faultcurrent.
Demand variation affects the network voltage profileand general load fault in-feed. These two have oppositeeffects on fault levels. Increasing demand may result inlower voltage profiles along the network andconsequently a lower fault current. However, thegeneral load fault in-feed (1 MVA fault contribution forevery 1 MVA load) increases if demand increases.
Figure 5: Summary of sensitivity analysis results
ACTIVE FAULT LEVEL NETWORKMANAGEMENT APPLICATIONFault level monitoring in conjunction with a “connectand manage” scheme is one of the solutions to expeditethe connection of flexible customers (for example,distributed generators) and defer network assetupgrades. For the purpose of active fault levelmanagement, under a “connect and manage” scheme theflexible customers can be disconnected when themonitored fault level at the upstream substation is closeto exceeding the fault level limits. In a more flexiblescheme, based on what was learnt from sensitivityanalysis, the operating power factor of the generator aswell as upstream transformer tap position can becontrolled to reduce the fault level rather thandisconnecting the customer as the first action.
The architecture of a closed-loop active fault levelmanagement system is shown in Figure 6. The faultlevel monitoring (FLM) technology informs the activenetwork management (ANM) system about the faultlevel at the primary substation. If the fault level exceedsa pre-set limit, control commands are communicated tothe distributed generators to operate in leading powerfactor.
Feed
erB
Feed
erA

CIRED Workshop - Rome, 11-12 June 2014Paper 0200
Paper No 0200 Page 5 / 5
In addition, as a primary action, by controlling the tapposition at the primary substation, the voltage across the11kV network can be reduced. Voltage regulation atprimary substations is also being trialled as a solution todemand control [6], but it has rarely been used in ANMsystems for the purposes of the fault level management.
It should be noted that in some networks there is notenough room for voltage control corrective actionsbecause of the voltage limits in the LV network. Inaddition, voltage stability issues may arise due tooperating generators in leading power factor. Theseissues can be controlled by defining permissible voltagelimits at the primary substation and other parts ofnetwork. The voltage and currents at different points ofthe 11kV network will be also monitored to ensure theydo not exceed the statutory limits. As an ultimatesolution to fault level control the distributed generatorscan be tripped if using corrective actions (transformertapping or generation power factor control) may resultsin any voltage or thermal rating violation.
Further work is in progress within FlexDGrid to developa commercial framework based on the learning from thesensitivity analysis, active fault level monitoring andother UK DNOs’ experience in deploying “connect andmanage” schemes.
Figure 6: Architecture of an active fault level managementsystem
CONCLUSION AND RECOMMENDATIONSFault level calculations, using computer models, are anapproximation to the behaviour of the actual distributionnetwork and, due to assumed parameter values, includea level of inaccuracy. The impacts of inaccuracy innetwork model parameters, on the calculated fault levelin HV networks, were studied in this paper. The resultsshowed that generation power factor and tap position ofthe transformer can have a large effect on voltageprofile and, consequently, the calculated fault level.Based on the sensitivity analysis, the followingrecommendations may be considered.
1. It is recommended that a detailed model of theHV network is used for generation connection studies.This allows pre-fault voltage conditions to becalculated more accurately, resulting in more accuratecalculated fault levels. Using equivalent networkmodels is likely to result in a higher calculated faultlevel;
2. In order to calculate fault currents as accuratelyas possible, it is recommended that a generator’smodel represents the actual power factor at which it isset to operate. Nonetheless, for worst case fault levelcalculation, it is recommended that generators aremodeled in unity power factor;
3. The tap position at Primary Substations has alarge effect on the calculated fault currents. It isrecommended that care should be taken to model thetap at the position which results in a network voltageprofile representing the system condition in real-life;and
4. General load has a effect on the making faultcurrent. It is recommended that large synchronous andasynchronous motors (or large concentrations of suchmotors) are modelled if possible. It is alsorecommended that work is carried out to understandthe load mix and appliances used by low voltageconnected customers. The ER G74 recommendationon general load fault in-feed may need to be reviewed.
REFERENCES[1] UK Government, The carbon plan: delivery our lowcarbon future, December 2011
[2] FlexDGrid, Western Power distribution,URL:http://www.westernpowerinnovation.co.uk/FlexDGrid/FlexDGrid-Project-Aims.aspx
[3] S. Jupe, A. Kazerooni, Simulation and applyingenhanced fault level assessment processes, WesternPower Distribution, 2013.URL:http://www.westernpowerinnovation.co.uk/Documents/FlexDGrid-SDRC4-report-and-appendices.aspx
[4] “IEC International Standard for Short-circuitcurrents in three-phase a.c. systems - Part 0: Calculationof currents”, IEC 60909-0, Jul. 2001.
[5] Energy Networks Association, Procedure to meetrequirements on IEC 909 for the calculation of the shortcircuit currents in three phase AC power systems,Engineering recommendation G74, 1992.
[6] Electricity North West, CLASS voltage regulationscheme, 2014.
23rd International Conference on Electricity Distribution Lyon, 15-18 June 2015
Paper 1129
CIRED 2015 1/5
Standardised Connections and the Economic Benefits of
Fault Current Limiters on Distribution Networks
Jonathan BERRY Neil MURDOCH
Western Power Distribution – UK Parsons Brinckerhoff – UK
[email protected] [email protected]
ABSTRACT
This paper discusses the advantages of standardised
connections of fault current limiters (FCL) on the 11kV
distribution network and the economic benefits of these
installations against traditional network solutions. This
paper is based on learning to date from Western Power
Distribution’s (WPD) Tier-2 Low Carbon Networks
(LCN) Fund [1] project, FlexDGrid, and other FCL
installations.
INTRODUCTION
In order to meet UK and global targets for carbon
emission reductions associated with energy production,
the installation and connection of distributed generation
(DG) onto distribution networks has significantly
increased. As these DG units connect to the distribution
network, they contribute fault level to the network, along
with providing low carbon energy.
In some instances, fault level can be so high that it is
above the rating of switchgear and cables. When this
occurs, action must be taken to ensure the fault level is
kept within these ratings, normally requiring the network
to be run split, adding impedance into the network, or
replacing the existing equipment with a higher rated
equivalent. A new developing alternative to overcome
excessive fault level is to install an FCL in the network.
This paper describes the methods taken to standardise the
network connection of FCLs onto the 11kV distribution
network, irrespective of limiting technology, including
the switchgear and protection philosophy utilised.
Investigation into the advantages of standardised
connections of FCLs and their economic benefits over
traditional solutions, to distribution network fault level
issues, will be presented, along with the additional
engineering benefits.
BACKGROUND
Fault level on distribution networks can often be high,
close to the ratings of network connected equipment –
commonly cables and switchgear. This is due to historic
reasons such as location to large centralised generating
plant, or the interconnection of EHV networks or low
impedance transformers. A high fault level is often a
good indicator of the strength of the distribution network,
where there is low impedance between source and load.
These factors contribute towards desirable system voltage
profiles and low magnitudes of voltage dips when system
disturbances occur. They also have a beneficial influence
on the speed of operation of protective devices under
fault conditions [2]. However, due to network equipment
such as switchgear and cables, which have a maximum
fault level value they can withstand, the fault level value
for each part of a network must be kept within equipment
ratings. If the fault level on a system exceeds the ratings
of any connected equipment, this can cause catastrophic
failures leading to loss of customer power supplies and
potential injury to the public and personnel.
In accordance with UK Government policy [3], a
significant reduction in carbon emissions due to energy
production is required. Therefore, this has led to a
considerable increase in the connection of DG (such as
renewable and combined heat and power [CHP]) to
distribution networks. Often DG connecting to
distribution networks is in the form of rotating plant,
which provides its individual contribution, often
significant, to the system fault level. If the system fault
level is already high, then the introduction of DG can
trigger the fault level of the system to be greater than the
withstand capacity of the network’s equipment.
Traditional solutions to manage the increase of fault level
to within allowable limits can generally be categorised as
splitting of the network, replacing existing transformers
with higher impedance units, or replacing existing
switchgear with a higher withstand rated equivalent.
Splitting the network removes an existing parallel
operation that performs the function of increasing the
system impedance to reduce the fault level; however, it
also significantly reduces the security and reliability of
the network. Replacing transformers with higher
impedance units results in an increased source
impedance, meaning that the downstream fault level is
reduced. The installation of switchgear with a higher
withstand rating allows the fault level of the distribution
network to further increase to the new switchgear’s
withstand rating.
New alternative solutions, in the form of FCLs, have
been developed. The main FCL technologies are a Pre-
Saturated Core FCL and a Resistive Superconducting
FCL, along with other developing technologies such as
Power Electronic devices. When connected to the
distribution network, these devices, upon the inception of

23rd International Conference on Electricity Distribution Lyon, 15-18 June 2015
Paper 1129
CIRED 2015 2/5
a fault, limit the fault level meaning that additional DG
can be connected to a system without the need to change
or upgrade existing equipment. Four FCLs have been
installed on the UK distribution network to date and at
least five more are planned by 2017, as part of WPD’s
LCN Fund Tier-2 Project, FlexDGrid [4]. This is in
addition to a number of units installed throughout
Europe.
Costs for the traditional solutions are well understood, as
they have been routinely deployed for decades on
distribution networks. These costs are driven by the
procurement and installation of the equipment
(transformers or switchgear). However, costs for the
procurement and installation of FCLs are less well
understood, due to the limited number of previous
installations and varying requirements for each site.
TRADITIONAL FAULT LEVEL SOLUTIONS
Three main solutions to manage system fault level are
splitting the network, installing high impedance
transformers and upgrading switchgear. Each solution
successfully manages fault level; however, each solution
has significant disadvantages in the form of network
performance, cost or safety.
Splitting the Network A common arrangement at a primary substation is to have
two transformers and an 11kV switchboard, incorporating
a bus-section circuit breaker, which enables the two
transformers to be connected in parallel or not. For the
instance where there is a fault level issue at a substation
and the bus-section is closed (transformers connected in
parallel), a solution is to open that bus-section circuit
breaker; if the transformers and upstream network have
the same impedance, this significantly increases the
system impedance and reduces the fault level (up to 50%
reduction). This action does significantly reduce the
security of supply to customers as half of the substation’s
customers will now lose supply in the event of a
transformer fault, where previously no customers would
have been affected. In addition, splitting the network may
result in uneven load distribution across the transformers
and limit the ability to offer customers “firm”
connections downstream of the primary substation.
High Impedance Transformers By increasing the impedance of the system, the fault level
can be reduced. This is typically achieved through the
removal of existing transformers with higher impedance
units. Equation 1 explains that increasing impedance
from Z to Z’ has the effect of reducing the current from I
to I’. Typically, the reduction from I to I’ is 15%,
meaning that the change of transformers for higher
impedance units facilitates a reduction in fault level of
15%.
(1)
An issue with this solution is that the existing
transformers being removed are often wholly suitable for
the network conditions in terms of health and power
transfer availability, meaning an expensive asset is being
made redundant and replacement is for fault level issues
alone.
Upgrading Switchgear A switchboard containing a number of panels of
switchgear will have a specific fault current withstand
rating. If this equipment is replaced, with equipment with
a larger fault current withstand rating, then a significant
increase in fault level can be achieved. Typically, legacy
switchgear has a withstand rating of 250MVA (13.1kA);
if this is replaced with equipment with a withstand rating
of 475MVA (25kA), an increase of available fault level
capacity released is 90%.
Key issues with upgrading switchgear are that although
the main substation equipment has been uprated to
475MVA, a large proportion of customers’ equipment
and other assets on the network will remain at 250MVA,
where, for a fault, a catastrophic failure could be incurred
during operation on this equipment. Another
consideration with the upgrading of switchgear is that a
significant proportion of cables connected to this new
switchgear will need to be replaced to have the required
fault current withstand capacity.
FCL OVERVIEWS
Three FCLs will be described that can provide fault level
limitation of up to 50% of a distribution network’s
overall fault level.
Pre-Saturated Core (PSCFCL) The principle of the pre-saturated core fault current
limiter (PSCFCL) is based on the properties of
transformer design. In this scenario, the primary winding
(AC) of the FCL is placed in series with the network that
requires fault level mitigation. The secondary winding is
DC, where its sole purpose is to saturate the core of the
PSCFCL. Under normal operation, the flux from the DC
coil is far greater than that produced by the primary
winding and thus the core becomes saturated and the
insertion impedance is low. As current increases on the
primary winding (such as in a fault situation), the
opposing flux increases resulting in the core being taken
out of saturation and subsequently the PSCFCL creating a
high insertion impedance. The PSCFCL is fail-safe as the
DC coil is required to keep the core in saturation in
normal operation. Should the DC coil fail (or its
controller fail), the core will automatically come out of
saturation and the PSCFCL insertion impedance will be
high, thus providing fault limitation.
23rd International Conference on Electricity Distribution Lyon, 15-18 June 2015
Paper 1129
CIRED 2015 3/5
Resistive Superconducting (RSFCL) The resistive superconducting fault current limiter
(RSFCL) uses the inherent properties of a superconductor
to provide high insertion impedance during fault
situations, to limit the flow of fault current. The RSFCL
is designed to be inserted in series with the network.
During normal operation the RSFCL operates below the
critical temperature in the superconducting region with
very low losses. Thus, the RSFCL should be designed to
ensure that the superconducting region falls within the
continuous current rating of the equipment with which it
is being inserted in series. As current increases in the
RSFCL, there is a subsequent rise in conductor
temperature. When the temperature increases above the
critical temperature, the RSFCL begins to operate in the
normal operating region to provide high insertion
impedance. In the superconducting state, the RSFCL
requires constant cooling to ensure that the conductor
operates below the critical temperature. Whilst
transitioning from superconducting to normal conducting
modes, the RSFCL temperature greatly increases and
requires the current to be diverted / blocked after around
80 milliseconds (although the precise time is dependent
on the design of the superconductor) to ensure the device
does not overheat. In all instances the device can be said
to be fail-safe, as the superconducting properties will
provide high insertion impedance or create an open
circuit during a fault event.
Power Electronic (PEFCL) The power electronic fault current limiter (PEFCL) works
on the same basis as a circuit breaker with the main
difference being that the device is extremely quick to
operate (less than 10ms). Unlike the RSFCL and the
PSCFCL, the PEFCL does not insert impedance into the
network, instead the fault current path is severed, and
therefore the fault reduction is much higher compared
with the other FCL devices. In addition, being a
switching device the PEFCL can be controlled to reduce
fault current at different magnitudes unlike the other
devices which have a fixed level of reduction. The losses
associated with the PEFCL are dependent on the amount
of cooling required for the switching devices. As more
current is driven through the PEFCL, the greater the
amount of heat losses, which in turn requires more
cooling. With the PEFCL comprising a number of
different power electronic components, the footprint is
generally smaller than other FCLs and the general
arrangement can be tailored to suit particular installation
requirements. The power electronic switching devices
used in the PEFCL are controlled in such a way that
failure of one or more components will result in the
devices opening. As such, the PEFCL is fail-safe during
operation.
Device Costs As the FCL market is still in its infancy the exact cost of
devices is not readily available. However, Ofgem has
awarded Western Power Distribution, through the LCN
Fund, £5.83m for five FCLs [4], making the average cost
of a single FCL currently £1.17m.
STANDARDISED CONNECTIONS OF FCLS
In order for a device on a distribution network to be
adopted by asset owners for operation, there must be a
standardised and agreed process of connection. Through
the work carried out as part of WPD’s LCN Fund Tier-2
Project, FlexDGrid, this work has been appreciably
advanced. This is in the form of the design for the
integration of five FCL technologies onto the 11kV
distribution network in Birmingham, England. The five
FCL devices consist of one PSCFCL, two RSFCLs and
two PEFCLs. In order to provide a standardised
connection, the two main considerations are the
switchgear requirements and the protection philosophy to
be employed.
Protection Requirements Similar to other critical plant installed on the distribution
network, it is necessary to protect the FCL using
independent ‘Main’ and ‘Back-up’ schemes.
For all devices described above, the voltage and current
on each side of the specific FCL device should be equal
under normal, non-fault, operation. However under an
internal fault condition, the voltage and current on each
side could be hugely different. Therefore the most
suitable type of main protection for each FCL is
differential (unit) protection, whether it is voltage or
current, dependant on the specific system requirements.
A requirement of the differential protection is to ensure
that an offset of the protection is provided to enable the
FCL to instigate the limitation of fault current under
operation. However, as this is less than 10ms for all
devices concerned, it is unlikely to be an issue in practice.
As mentioned above, a standard overcurrent and earth
fault protection scheme is required to act as back-up for
the instance of a non-operation of the differential
protection.
Both these protection requirements are standard
throughout 11kV network design and as such
significantly reduce the potential complexity and cost of
protecting an FCL.

23rd International Conference on Electricity Distribution Lyon, 15-18 June 2015
Paper 1129
CIRED 2015 4/5
Switchgear Requirements The requirement of the switchgear, for the installation of
an FCL, is to ensure that as a minimum it matches the
current carrying and fault current withstand capacity of
the existing switchgear at the site concerned and has the
required measurement equipment to facilitate the
necessary protection philosophy.
DNOs and asset owners generally have standard
switchgear (circuit breakers) that is utilised on their
networks, typically produced by two or more
manufacturers, and have standard equipment
arrangements for scenarios such as transformer incomers
and network feeders. As part of FlexDGrid, an aim was to
take the design of an FCL from a unique, bespoke,
installation to a standardised approach, as far as
practicable. As such, following the identification of the
protection requirements, a standard switchgear
arrangement was required. In order to facilitate the
provision of either voltage or current differential
protection, voltage transformers (VT) and appropriate
current transformers (CT) are required. Utilising Western
Power Distribution’s suite of standard 11kV switchgear
configurations, it was identified that a standard 11kV
transformer incomer circuit breaker had these protection
facilities as standard. The advantage of an 11kV
transformer incomer is that its rating can be prescribed to
match that of the busbar ratings, as required for all FCL
installation in order to ensure that the FCL is not the
limiting factor on the current carrying capacity of the
existing switchgear arrangement.
The use of a standard piece of equipment (the transformer
incomer with VTs and CTs is common to most if not all
distribution network operators) means that a cost for the
installation and connection of the FCL can be well
understood and projected forward for the use of an FCL
as a standard network asset.
COMPARISON OF SOLUTIONS
Using an average cost of £1.17m for an FCL and taking
further data from the allowances associated with the
FlexDGrid, an average installation cost of each FCL is
£237.4k; this figure includes required switchgear,
protection and civil requirements, along with the labour
to facilitate the construction. This means that for the
installation of a single FCL the complete cost is £1.41m.
In order to allow a comparison of benefit in terms of
released fault level headroom by a chosen solution, a
calculation of fault level reduction for an FCL is required.
A typical requirement is to allow an additional amount of
generation to connect to the distribution network that is
10% of a substation’s firm load capacity, i.e. a substation
with a load firm capacity of 80MVA would need to be
able to accept an additional 8MW of generation. It is to
be noted that this is, for every case, with the system
operating in parallel, irrespective of whether it was prior
to the installation of an FCL.
Figure 1: Typical FCL Installation
Using the network identified in Figure 1 the calculation
methodology for fault level reduction is [5]:
(2)
(3)
(4)
( [
]) (5)
( [
]) (6)
in Equation 6 is the total reduction in fault
level at the substation. For the five selected sites as part
of FlexDGrid this value, as an average, is 30%.
FCL versus Splitting the Network Splitting the network has no capital cost impact to the
network as the action is to open a previously closed bus-
section circuit breaker. Therefore the cost of an FCL
installation is £1.41m greater than this solution.
Operating costs in the form of charges for interrupting
customers’ supplies (CI) and the number of minutes a
customer is without supply (CML), should be considered
as they can be considerable: in the region of £44k for
three minutes. This is based on the FlexDGrid project
area, which on average has 18,000 customers per

23rd International Conference on Electricity Distribution Lyon, 15-18 June 2015
Paper 1129
CIRED 2015 5/5
substation, therefore affecting 9,000 customers in this
instance. In addition, splitting the network is likely to
result in uneven loading on the 11kV busbars which
could limit firm capacity and accelerate transformer
ageing. Also, the DNO would not be able to offer a firm
connection (automatic N-1) to downstream customers.
FCL versus Higher Impedance Transformers Replacing existing transformers at a 132/11kV substation
with higher impedance units typically facilitates 15%
fault level headroom and costs £1.87m [6]. The
installation of an FCL whilst providing an initial financial
saving of £460k also facilitates an additional 15% of fault
level headroom (30% in total). This value for a substation
with a firm capacity of 78MVA could mean an additional
4.2MW of generation [7]. This equates to a saving of
574T of CO2e if the generation is a CHP unit [4].
Other factors to consider are that the replacement of
transformers necessitates the removal of otherwise
healthy and suitable assets to remedy the existing fault
level issues, and the substantial risks associated with
outages for removing and replacing transformers.
FCL versus Upgrading Switchgear In order to replace legacy switchgear with new, higher
withstand rated switchgear (additional 225MVA), at an
average primary substation (city centre location) the cost
is in the region of £870k [4], based on a 19-feeder
substation. This value is associated only with the
replacement of the equipment located within the
substation. In order to minimise any safety-related issues
with overstressing, in terms of fault level, there is a need
to not only replace the switchgear connected to the
primary substation, but also remote to it, along with a
length of cable per feeder to ensure that its rating is
satisfactorily matched to the new switchgear. On average,
the downstream reinforcement work would cost in excess
of £8.5m per substation [4].
The cost saving through installing an FCL rather than
upgrading the switchgear is around £8m, which is
significant. Notwithstanding cost comparison to that of an
FCL installation, carrying out the switchgear replacement
is not financially viable.
CONCLUSION Traditional solutions are well understood and the cost of
these solutions is unlikely to reduce, due to the
technologies and methodologies being well established.
However, FCL technologies are still significantly
developing and the cost of FCLs is likely to reduce by
12% over the next five years [8], meaning that they will
become even more cost competitive. The cost of previous
FCL installations have been far in excess of the costs
discussed in this paper, where previous FCL installation
projects have been in the region of £4m, including
product development [9]. Some savings are in relation to
the maturity of the FCL market; however, a significant
proportion of the savings has transpired from the
standardisation of the connection and protection of FCL
connections.
The work presented is a considerable step towards the
installation of FCLs being considered a feasible and cost-
effective solution to the problem of fault level issues on a
distribution network. Further work is required to fully
demonstrate the connection and protection methodologies
proposed and for FCL manufacturers to continue work on
reducing the cost of FCL devices whilst increasing the
performance of the technology.
REFERENCES
[1] Ofgem, 2013, Low Carbon Networks Fund
Governance Document (Version 6), Ofgem, London,
UK.
[2] X. Wu, J. Mutale, N. Jenkins, G. Strbac, “An
Investigation of Network Splitting for Fault Level
Reduction”, Tyndall Centre for Climate Change
Research, 2003, Working Paper 25.
[3] Department of Energy and Climate Change, 2011,
“Carbon Plan: Delivering our low carbon future”,
Crown, London, UK.
[4] Western Power Distribution, 2012, “FlexDGrid Full
Submission Proforma”, Ofgem, London, UK.
[5] Western Power Distribution, 2013, “Successful
Reward Criteria Report: Evidencing Method Gamma
Will Provide Outlined Learning”, Ofgem, London,
UK.
[6] Parsons Brinckerhoff, 2013, “Review of WPD Unit
Costs”, Western Power Distribution, Bristol, UK.
[7] KEMA Ltd, 2005, “The Contribution of Distribution
Network Fault Levels from the Connection of
Distributed Generation”, Crown, London, UK.
[8] EA Technology, 2012, “Assessing the Impact of Low
Carbon Technologies on Great Britain’s Power
Distribution Networks”, ENA, London, UK.
[9] Energy Technology Institute, 2014, “Energy Storage
and Distribution”, ETI, Loughborough, UK.

CIRED Workshop - Helsinki 14-15 June 2016
Paper 0328
Paper No 0328 Page 1 / 4
UUSSEE OOFF RREEAALL--TTIIMMEE FFAAUULLTT LLEEVVEELL VVAALLUUEESS TTOO GGEENNEERRAATTEE AANN MMVVAA PPEERR MMVVAA
IINNFFEEEEDD TTEEMMPPLLAATTEE FFOORR 1111KKVV DDIISSTTRRIIBBUUTTIIOONN NNEETTWWOORRKKSS
Jonathan BERRY Paul EDWARDS
Western Power Distribution – UK WSP|Parsons Brinckerhoff – UK
[email protected] [email protected]
ABSTRACT
This paper discusses the process of generating and the
advantages of utilising real-time fault level values to
produce MVA per MVA general load fault infeed
templates for 11kV distribution network modelling. This
paper is based on learning to date from Western Power
Distribution’s (WPD) Tier-2 Low Carbon Networks (LCN)
Fund [1] project, FlexDGrid.
INTRODUCTION
In order to meet UK and global targets for carbon
emission reductions associated with energy production, the
installation and connection of Distributed Generation
(DG) onto distribution networks has significantly
increased. As these DG units connect to the distribution
network, they contribute fault level to the network, along
with providing low carbon energy.
A key element of determining the connection point and
accessibility of the network for new DG to be connected is
power system analysis modelling. Fault level for the
connection of all new DG is a key consideration and
therefore must be modelled accurately. The accuracy of
the distribution networks’ model is paramount in
determining the change in fault level borne by the
connection of additional DG in the system. DG is
modelled accurately, through the provision of generator
specific details in relation to sub-transient, transient and
steady-state condition; however, the general load
contribution to fault level is commonly modelled through
one of two pre-evaluated contributions as determined in
G74 [2].
This paper describes the process taken to generate site
specific 11kV MVA per MVA general load fault level
infeed values. This work is designed to provide greater
granularity and accuracy of 11kV fault level data to more
accurately assess the network for operational and safety
requirements. The aim of the learning is to investigate the
use of real-time fault level values to generate an MVA per
MVA infeed template for 11kV distribution networks.
BACKGROUND
Fault level is generally considered to be an indicator as to
the system strength of a network. Traditionally this has led
to the desire for a large system fault level, which can
safely operate protection and supress the effect of system
harmonics. However, as the level of DG connecting to a
distribution network increases, at all voltage levels but
particularly at 11kV, fault level issues, where the
connection of the DG increases the system fault level,
become a significant barrier to connection.
Network fault levels are most commonly modelled using a
power system analysis tool, examples of which are PSS/E,
IPSA and DigSilent. Whilst generators are accurately
modelled using their specific electrical properties, due to
the vast and varying types of load connection on network
substations a generic approach to modelling has been
considered. Guidance is given in such documentation as
G74 as to the values to be used to model the load
connected to a substation, however, this is generally split
by the voltage level at which it is connected.
As the availability to gather more sophisticated network
data, such as real-time fault level values [3] and more
specific load type characteristics the opportunity to further
understand the contribution to fault level of general
network load increases.
TRADITIONAL MODELLING
METHODOLOGY
Network models are used by Distribution Network
Operators (DNO) for system planning purposes and to
analyse the impact of changes in network configuration
and new connections. The information gathered can then
be used to determine suitable network reinforcement
requirements and operational restrictions. Over time, the
accuracy and detail contained within the models has
improved and increased, enabling additional confidence in
the results produced and reducing required safety margins.
In the UK, DNO models for the 11kV High Voltage (HV)
network are traditionally maintained and run separately
from the Extra High Voltage (EHV) network models. This
is due to the complexity and size of the complete 11kV
network having a potentially negative impact when
running EHV system studies, due to increased
computational time and potential for errors. In the majority
of cases, this has led to the 11kV and Low Voltage (LV)
models being created in a different software package to the
EHV models.

CIRED Workshop - Helsinki 14-15 June 2016
Paper 0328
Paper No 0328 Page 2 / 4
In order to represent the HV and LV networks in the EHV
models, an equivalent load and generator are created using
information from the HV network model. These are placed
on the Primary substation busbar that acts as the infinite
source in the HV models. Typically, any large generation
connected to the Primary substation via a dedicated feeder
is also independently modelled.
Using the EHV network models, system fault levels are
calculated based on the recommendations of G74. Section
9.5.1 of G74 states; for low voltage networks allow 1.0
MVA per MVA of aggregate low voltage network
substation winter demand and for high voltage connected
load 2.6 MVA. To complete network fault studies these
values are applied to the whole substation load irrespective
of load type.
FlexDGrid Method Alpha
As part of the Enhanced Fault Level Assessment (EFLA)
process developed within FlexDGrid’s Method Alpha,
11kV network models for each primary substation, within
the project area, were created for inclusion within the
existing EHV model. This allows for greater accuracy
when assessing the impact on the 11kV network and the
loads connected to it when modelling fault levels.
Each substation model accumulated network data from all
available sources including installation and maintenance
records, to ensure that the models were as close as
reasonably practicable to the actual network conditions.
The size of each LV load connected to the network was
then estimated by either the installed transformer rating or
the agreed supply capacity. A distribution factor was then
applied to each one so that the total substation load was
equal to the winter maximum demand, as per current WPD
planning philosophy.
FAULT LEVEL MONITORING
FlexDGrid Method Beta
The aim of FlexDGrid’s Method Beta was to install ten
Active Fault Level Monitor (AFLM) devices throughout
the project area. The AFLM is designed to place a non-
customer affecting disturbance on the 11kV network with
monitoring hardware within the device recording
waveform disturbances of both the current and voltage [3].
During the open loop testing of the AFLM throughout
2015, a decision was made to operate all the devices every
six hours to enable the device to provide a representative
spread of fault level data for differing system load
conditions.
Monitored Data
Using the recorded disturbances, the AFLM calculates the
10ms peak fault level and the 90ms RMS fault level at its
point of connection. All the AFLM devices installed as
part of Method Beta were connected to a section of the
Primary 11kV busbar within the substation, producing
results for the 11kV Primary substation fault level.
The fault level results along with the steady state current
and voltage at the time of the AFLM operation are
collected and processed. As part of this processing, the
network topology is determined and results categorised
accordingly. All the data is then amalgamated and
averaged over various time periods in order to understand,
at this stage, the general trend in MVA per MVA at each
11kV Primary substation over time.
MVA PER MVA CALCULATION
To calculate the 11kV MVA per MVA general load infeed
value at each substation the EFLA network model was
utilised. Steady state data collected by the AFLM was
inserted into the network model and used to manipulate
the model to replicate the general site condition over the
specific time period being considered. This was completed
by then fixing transformer set point voltages and scaling
all 11kV loads using the distribution factors utilised during
the development of the EFLA model.
Using the enhanced model, a G74 Fault Level calculation
for the AFLM point of connection was carried out. With
each calculation, the MVA per MVA general load infeed
value for the 11kV load was refined until the calculated
fault level closely matched the AFLM recorded value.
DATA ANALYSIS
Substation Load Distribution
The load at each substation was analysed and split into
three categories based on available metering data. These
were Domestic, Small Commercial and Industrial and
Large Commercial and Industrial. The table below shows
the percentage breakdown of customer types for each of
the ten Primary substations.

CIRED Workshop - Helsinki 14-15 June 2016
Paper 0328
Paper No 0328 Page 3 / 4
Substation
% of Substation Load
Domestic
Small
Commercial
/Industrial
Large
Commercial
/Industrial
ELMD 7% 7% 86%
CHES 20% 19% 61%
CASB 24% 10% 66%
BOVI 32% 14% 54%
NECW 35% 24% 41%
KITG 52% 14% 33%
HALG 57% 19% 23%
CHAV 60% 24% 16%
SHIR 61% 25% 13%
BARG 66% 12% 22%
Table 1 - 11kV Substation Load Type
MVA per MVA Results
The average MVA per MVA general load infeed result for
each 11kV Primary substation based on its percentage of
domestic load is shown in Figure 1 below. The results are
for fault levels calculated between June 2015 and January
2016.
Figure 1 shows that three primary substations, BARG,
HALG and CHAV, generally follow the G74
recommendation of 1.0 MVA/MVA infeed for 11kV
connected loads. These substations have a large domestic
load with few large commercial or industrial customers
connected.
Figure 1: MVA per MVA Load Infeed based on % of Domestic Demand at each Substation
CHES and CASB substations by contrast have a relatively
low domestic demand and a high percentage of large
commercial and industrial customers connected. The
combined average infeed calculated for these substations
is 8.08 MVA/MVA. This is considerably above G74
recommended values. KITG substation has a high
percentage of both domestic and large commercial and
industrial loads. As such the calculated infeed is between
the value when a substation is dominated solely by
commercial and industrial loads and a domestic dominated
load, as described previously, at 6.09 MVA/MVA.
The four remaining substations are considered anomalous
results at this stage. ELMD and BOVI, from the data
provided in Table 1, indicate that the fault level infeed for
these substations should be similar to that of CHES and
CASB, around 8.08MVA/MVA, however, both are
significantly lower than this. Further investigation of the
loads connected at the primary substations showed that
whilst both ELMD and BOVI have large amounts of
commercial and industrial load connected, they are likely
to be mixed use load connections. NECW should, based
on load type data, have a value between that of 6.09 and
8.08 MVA/MVA and SHIR should follow the G74
recommendation of around 1.0 MVA/MVA, however,
based on investigation of load types and connection points
the amount of commercial and industrial connections at
each substation is situated close to the Primary substation,
meaning that it is likely to have an increased impact on the
system fault level due to minimal impedance between the
load and substation.

CIRED Workshop - Helsinki 14-15 June 2016
Paper 0328
Paper No 0328 Page 4 / 4
PRODUCTION OF TEMPLATES
In order to utilise the analysis presented the generation of
a template for 11kV MVA per MVA general load infeed is
required, therefore enabling the wider utilisation of the
general load fault level infeed types based on load make
up of a Primary Substation.
From the evidence presented it is clear that for a domestic
load percentage greater than 55% the existing fault level
infeed value presented in G74, whereby it can be
considered that most load is LV connected, for LV
connected load of 1.0 MVA/MVA is appropriate.
Similarly it can be shown that where a Primary substation
has less than 25% of its load made up of domestic load
that neither of the existing values presented in G74 are
appropriate. A value closer to that presented of the average
between CHES and CASB of around 8.0 MVA/MVA is
required.
A key value to be considered is that where a split between
domestic and commercial and industrial load is around
50%. This scenario is presented through Primary
substation KITG, where the value is around 6.0
MVA/MVA.
UTILISATION AND BENEFITS
The ability to have a significantly increased level of
granularity as to the 11kV fault level general load infeed
and therefore the overall system 11kV fault level has many
applications.
The employment of this enhanced network data can be
utilised to more accurately assess the network for future
load and generation connections to the network. This
benefit centres on the increased level of network security
and safety based on the utilisation of this data. Increased
safety of the 11kV system can be realised through more
accurately understanding the network conditions for
current and future network connections to ensure that no
fault level limits of equipment such as switchgear and
cables are exceeded.
Utilising a robust fault level infeed an 11kV general load
template would mean that this information could be
utilised for any network of which the load type by
percentage on an 11kV Primary substation is known.
LEARNING
Key learning centres on the fact that the largest fault level
general load infeed value presented in G74 is 2.6
MVA/MVA, however, the evidence presented shows that
for certain load types the fault level infeed is in excess of
8.0 MVA/MVA. More widely it can be considered that
greater importance on the load type of a substation,
irrespective of voltage, should be given when considering
the fault level of that substation.
Finally, the anomalous data presented in the form of four
substations is driven by the fact that although a substation
has a particular split of load type the AFLM connected to
the system only considers a certain element of the network.
As the AFLM is connected to a single busbar within the
substation and there is no available data to accurately
determine the load type of an individual section anomalous
data at the monitored sites will continue. Therefore, a
methodology to determine the load type per section of a
particular substation is required to remove these anomalies
and more accurately represent an 11kV general load fault
level infeed template.
NEXT STEPS
The data presented considers a six month period, therefore
a significant next step is to further understand the patterns
of data presented over a longer period of time, specifically
to more accurately ascertain the viability of the large
commercial and load infeed value of around 8.0
MVA/MVA and the domestic dominated value of around
1.0 MVA/MVA.
The voids presented in the template, due to the load type
being split over several sections of Primary substation, are
to be more accurately determined. This work will focus on
the development of a methodology to determine the load
type for the area of network where each AFLM device is
connected. This analysis will allow a full template of fault
level infeed values to be generated, which from current
available data, appears to trend towards a generic
hysteresis curve.
Once a full template is produced the final step will be to
trial and demonstrate its value on an unmonitored network
(where an AFLM is not present) and to retrospectively
monitor the real-time general load infeed values.
REFERENCES
[1] Ofgem, 2013, Low Carbon Networks Fund
Governance Document (Version 6), Ofgem, London,
UK.
[2] Energy Networks Association, 1992, Engineering
Recommendation G74, Procedure to Meet the
Requirements on IEC 909 for Calculation of Short-
Circuit Currents in Three-Phase AC Power Systems,
Energy Networks Association, London, UK.
[3] J. Berry, S. Jupe, M. Meisinger, J. Outram, 2013,
Implementation of an Active Fault Level Monitoring
System for Distributed Generation Integration,
CIRED, Stockholm, Sweden.