Sensing a Historic Low-CO Future - IntechOpen
36
8 Sensing a Historic Low-CO 2 Future Colin D A Porteous Mackintosh Environmental Architecture Research Unit, The Glasgow School of Art Scotland, UK 1. Introduction The title of this chapter is intended not only to flag up the longstanding role of carbon dioxide (CO 2 ) as an indicator of air quality inside buildings, but also to imply an altogether different need to curb its presence, this time in our upper atmosphere and with a shorter history of awareness of the global warming phenomenon. The first word also suggests a role for human perception. In relation to air quality, we sense humidity and odour, and often have a fairly accurate idea as to causes. For example, our washing hanging out in a room can make it feel too humid, and fabric softener can emit an identifiable chemical smell. But CO 2 itself is odourless and its concentration above a certain level is normally an indicator of the ‘bad company’ that it keeps when air is changed too infrequently. This means that we can wrongly interpret a perception of stuffiness as being due to an inadequate supply of fresh air, when the actual cause might be that the room has become warmer than necessary in the quest for comfort. In this case, the incorrect diagnosis could lead to throwing open a window, rather than adjusting a thermostatic heating control. When direct or indirect burning of a fossil fuel provides the heating, repeated ‘corrective’ responses of this kind will add to global CO 2 emissions. In short, our sensing, valuable though it is, may lead us to take an expeditious action, but one that adds to both the energy and carbon emissions burden. On the other hand, if the temperature of a space is appropriate to a particular activity, we can sense freshness or stuffiness quite correctly. It is also true to say that the early, and valuable, research into control of air quality in buildings predates the means to measure CO 2 . In other words it was largely reliant on perception and observation, and even after the ability to measure CO 2 was achieved, the values had to be systematically cross-checked with perceptual responses from volunteer cohorts. This is where history is relevant to the future, all the more so at this temporal watershed when increasing demands to make buildings more airtight raise the stakes relative to the risk of poor air quality. Although we have approximately 175 years of developmental experience of mechanical control of ventilation, and the same length of scientific awareness regarding natural thermo-circulation, we have yet to fully resolve the ideal interface between electronic automation and manual intervention. The focus on air quality has a new urgency, embraced by the broader area of inquiry into ‘sick building syndrome’, in parallel with, and meshing with, wider research in the field of public health, particularly in the area of microbiology. Recent specialisations into health psychology and environmental psychology again spring from the public health concerns, but aligned with the specific strand of work on the human senses with its origins in the late Georgian period in the first part of the 19 th C. By the mid-20 th www.intechopen.com
Transcript of Sensing a Historic Low-CO Future - IntechOpen
8
Sensing a Historic Low-CO2 Future
Colin D A Porteous Mackintosh Environmental Architecture Research Unit, The Glasgow School of Art
Scotland, UK
1. Introduction
The title of this chapter is intended not only to flag up the longstanding role of carbon
dioxide (CO2) as an indicator of air quality inside buildings, but also to imply an altogether
different need to curb its presence, this time in our upper atmosphere and with a shorter
history of awareness of the global warming phenomenon. The first word also suggests a role
for human perception. In relation to air quality, we sense humidity and odour, and often
have a fairly accurate idea as to causes. For example, our washing hanging out in a room can
make it feel too humid, and fabric softener can emit an identifiable chemical smell. But CO2
itself is odourless and its concentration above a certain level is normally an indicator of the
‘bad company’ that it keeps when air is changed too infrequently. This means that we can
wrongly interpret a perception of stuffiness as being due to an inadequate supply of fresh
air, when the actual cause might be that the room has become warmer than necessary in the
quest for comfort. In this case, the incorrect diagnosis could lead to throwing open a
window, rather than adjusting a thermostatic heating control. When direct or indirect
burning of a fossil fuel provides the heating, repeated ‘corrective’ responses of this kind will
add to global CO2 emissions. In short, our sensing, valuable though it is, may lead us to take
an expeditious action, but one that adds to both the energy and carbon emissions burden.
On the other hand, if the temperature of a space is appropriate to a particular activity, we
can sense freshness or stuffiness quite correctly. It is also true to say that the early, and
valuable, research into control of air quality in buildings predates the means to measure
CO2. In other words it was largely reliant on perception and observation, and even after the
ability to measure CO2 was achieved, the values had to be systematically cross-checked with
perceptual responses from volunteer cohorts.
This is where history is relevant to the future, all the more so at this temporal watershed when increasing demands to make buildings more airtight raise the stakes relative to the risk of poor air quality. Although we have approximately 175 years of developmental experience of mechanical control of ventilation, and the same length of scientific awareness regarding natural thermo-circulation, we have yet to fully resolve the ideal interface between electronic automation and manual intervention. The focus on air quality has a new urgency, embraced by the broader area of inquiry into ‘sick building syndrome’, in parallel with, and meshing with, wider research in the field of public health, particularly in the area of microbiology. Recent specialisations into health psychology and environmental psychology again spring from the public health concerns, but aligned with the specific strand of work on the human senses with its origins in the late Georgian period in the first part of the 19th C. By the mid-20th
www.intechopen.com

Chemistry, Emission Control, Radioactive Pollution and Indoor Air Quality
214
C, architectural interest in perception psychology by Sven Hesselgren was realised in his 1954 doctoral thesis in Sweden, subsequently published in English in a more concise form (Hesselgren, 1975). The same period saw a substantial body of architecturally oriented work on the environmental forces that shape buildings (Fitch, 1972). In parallel, that in the field of human comfort (Fanger, 1970) presaged his introduction of units to measure air quality (Fanger, 1988). A strand into ‘adaptive opportunity’ then follows, which layers a psychological understanding of comfort on to the established physiological one (Baker & Standeven, 1994). Thereafter, the present author adopts the term ‘adaptive control’ (Porteous & MacGregor, 2005), to be applied to environmental comfort in a less serendipitous manner, and with more pre-emptive, design-led consequences, than ‘adaptive opportunity’. This then sets the scene for a historical recapping as part of the process of establishing where we are, and where we should go, with air quality.
2. Holistic review of modern ‘air quality’ history – early 19th C to present
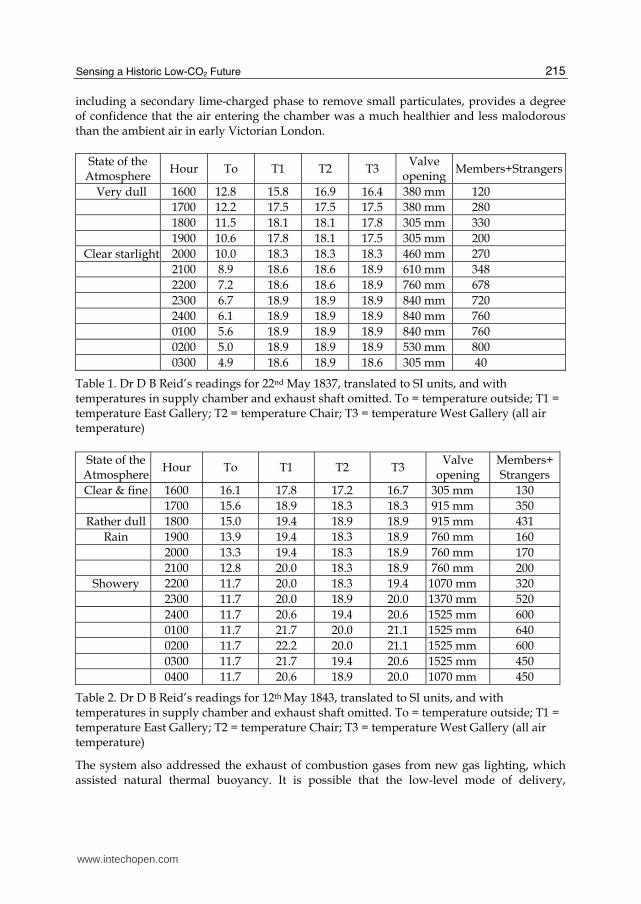
Architects of today, with their team of specialist consultants, owe a particular debt to the discipline of medicine with regard to the pioneering work on air quality. As indicated above, this started in the 19th century based on a combination of consequences, ranging from perceived discomfort to transmission of disease, and scientific advance. In the UK, the fire of 1834 that consumed a large part of the Houses of Parliament at Westminster in London, presented a rare opportunity for a Scot, Dr David Boswell Reid. He was appointed by a select committee as a consultant to use temporary accommodation as a test bed with respect to heating, ventilation, lighting and acoustics. This led to the 1836 refurbishment of the former House of Peers, described by Reid in 1837 (Sturrock & Lawson-Smith, 2006). This had been less badly damaged by the fire than other parts of the complex, and, as the temporary and experimental Commons, it was then monitored over a considerable number of years (Reid, 1844). Reid’s book includes as examples tables incorporating key environmental data for two days – one on May 22nd 1837, when the population in the House varied from 40-800; and the other on May 12th 1843, when the population varied between 130-640 (Tables 1 and 2). Each original table gives hourly values for air temperature outside, in the supply chamber and the exhaust shaft, and in three different inside locations, as well as the extent to which a valve is open, the number present, and brief comments as to weather. The 1837 readings confirm an external range of some 8 K from a high of 12.8oC at 4.0 p.m. to a low of 4.9oC at 3.0 a.m. Equivalent readings internally at the Chair (T2 below) range slowly up from 16.9oC at 4.0 p.m. to 18.9oC at 3 a.m. This modest rise of 2K reflects the increase of the population in the chamber from a rather low start, and indicates that the increasing aperture of the open valve kept the air from becoming over-warm. We may also note that clothing at this time would have provided greater personal insulation than is the case today. In the 1843 set of data the internal temperature at the Chair does get as high as 20oC in the early hours of the morning, but here the outdoor range from 16.1-11.7oC is significantly greater than the 1837 set. Despite the maximum opening being adjusted 2’ 3” (69 cm) wider in 1843, and despite the average hourly population of the chamber being lower (370 cf. 443), the warmer ambient conditions proved dominant. Even so, 20-22oC when the chamber has been subjected to some 480 kWh of incidental heat gain from the people inside, without taking account of that from the new gas lighting, signifies rather effective environmental control for such an early experiment. Moreover, Reid’s description of the filtering and washing before heating,
www.intechopen.com
Sensing a Historic Low-CO2 Future
215
including a secondary lime-charged phase to remove small particulates, provides a degree of confidence that the air entering the chamber was a much healthier and less malodorous than the ambient air in early Victorian London.
State of the Atmosphere
Hour To T1 T2 T3 Valve
openingMembers+Strangers
Very dull 1600 12.8 15.8 16.9 16.4 380 mm 120
1700 12.2 17.5 17.5 17.5 380 mm 280
1800 11.5 18.1 18.1 17.8 305 mm 330
1900 10.6 17.8 18.1 17.5 305 mm 200
Clear starlight 2000 10.0 18.3 18.3 18.3 460 mm 270
2100 8.9 18.6 18.6 18.9 610 mm 348
2200 7.2 18.6 18.6 18.9 760 mm 678
2300 6.7 18.9 18.9 18.9 840 mm 720
2400 6.1 18.9 18.9 18.9 840 mm 760
0100 5.6 18.9 18.9 18.9 840 mm 760
0200 5.0 18.9 18.9 18.9 530 mm 800
0300 4.9 18.6 18.9 18.6 305 mm 40
Table 1. Dr D B Reid’s readings for 22nd May 1837, translated to SI units, and with temperatures in supply chamber and exhaust shaft omitted. To = temperature outside; T1 = temperature East Gallery; T2 = temperature Chair; T3 = temperature West Gallery (all air temperature)
State of the Atmosphere
Hour To T1 T2 T3 Valve
opening Members+ Strangers
Clear & fine 1600 16.1 17.8 17.2 16.7 305 mm 130
1700 15.6 18.9 18.3 18.3 915 mm 350
Rather dull 1800 15.0 19.4 18.9 18.9 915 mm 431
Rain 1900 13.9 19.4 18.3 18.9 760 mm 160
2000 13.3 19.4 18.3 18.9 760 mm 170
2100 12.8 20.0 18.3 18.9 760 mm 200
Showery 2200 11.7 20.0 18.3 19.4 1070 mm 320
2300 11.7 20.0 18.9 20.0 1370 mm 520
2400 11.7 20.6 19.4 20.6 1525 mm 600
0100 11.7 21.7 20.0 21.1 1525 mm 640
0200 11.7 22.2 20.0 21.1 1525 mm 600
0300 11.7 21.7 19.4 20.6 1525 mm 450
0400 11.7 20.6 18.9 20.0 1070 mm 450
Table 2. Dr D B Reid’s readings for 12th May 1843, translated to SI units, and with temperatures in supply chamber and exhaust shaft omitted. To = temperature outside; T1 = temperature East Gallery; T2 = temperature Chair; T3 = temperature West Gallery (all air temperature)
The system also addressed the exhaust of combustion gases from new gas lighting, which assisted natural thermal buoyancy. It is possible that the low-level mode of delivery,
www.intechopen.com

Chemistry, Emission Control, Radioactive Pollution and Indoor Air Quality
216
effectively displacement ventilation via apertures in the floor, might have been compromised by less savoury particles from members’ footwear (bear in mind horse-drawn traffic and so on). This may have been part of the reason underlying Charles Barry’s opposition to Reid’s displacement method when it came to the permanent replacement building still in existence. Barry favoured a plenum system, with air entering the chamber at a higher velocity from above, and this led to an insurmountable conflict for Reid that resulted in him being superseded in 1853 (Port, 1976). Nevertheless, by 1843 we had a well-monitored model for mechanical ventilation with the science and the results disseminated via Reid’s book the following year. 1844 also coincides with the year that Berlin-based Heinrich Gustav Magnus published a formula relating temperature and moisture in the air and establishing the dewpoint curve (Magnus, 1844, as cited in Lawrence, 2005). However, Mark Lawrence, in summarising the history of this scientific landmark, tells us that the formula credited to Magnus is based on earlier work by John Dalton of Manchester who started experiments to measure dewpoint at the beginning of the 19th C. Lawrence informs us that, in turn, Dalton’s reasoning was used in a precursor of the Magnus formula by E F August (August, 1828, as cited in Lawrence, 2005), and argues that it should properly be called the August-Roche or August-Roche-Magnus formula. Professor James (John) Apjohn, 1796-1886, closely associated with the Royal Irish Academy, is another scientist credited with devising a formula calculating dew point around the same period. A record notes “August independently derived a similar formula at about the same time, but Apjohn’s treatment was generally preferred.” (Dixon, 1969) Also in the 1840s, Walter Bernan, a civil engineer, published the methodology for
determining the required supply of heated air per minute inside buildings (Bernan, 1845).
This was based on a notional room with an air temperature of 17.8oC and dew point
temperature of 10oC, indicating a relative humidity (RH) close to 35%. This took account of
the occupants in terms of supply of air to the lungs and insensible perspiration, presence of
candles or other means of lighting, area of glass, cracks around windows and doors and area
of solid bounding surfaces, excluding the windows. Besides the heat exchange by
convection through cracks his method indicates some knowledge of heat exchange by
conduction with surfaces such as glass; no doubt based on Fourier’s Law of Heat
Conduction (Fourier, 1822). However, since accurate prediction in this regard was out of
reach at that time (further history of measurement of thermal conductivity and vapour
permeability through materials given later in this chapter), and since there was no reliable
method as yet to measure CO2 as an indicator of air quality, it is reasonable to assume that
this formula was derived empirically. A starting point was the knowledge of the relative
volume of the constituents of air breathed in and out – i.e. with oxygen roughly halved and
CO2 increased 5-6 times. Bernan also made reference to Reid’s findings, noting that as
moisture was added to the supply air, considerably more was required for fresh air supply
per person – at least 30 ft3/minute (14 l/s) per person and sometimes as much as 60
ft3/minute – important in Reid’s case at the temporary House of Commons due to the
rigorous filtration and washing process, which was fundamental to improving the quality of
the air supply.
The scene is thus set for a reliable instrument to measure CO2. Jan Sundell implies the 1,000 parts per million (ppm) CO2 air quality standard of today was established by Max von Pettenkofer in 1858 (Sundell, 2004). In fact, Pettenkofer’s publication of 1872 confirmed 1,000 ppm CO2 as a recommended maximum (Pettenkofer, 1872, as cited in Locher, 2007); and it
www.intechopen.com

Sensing a Historic Low-CO2 Future
217
would seem that it was his ‘respiration apparatus’ using the ‘Pettenkofer titrimetric method’ that was erected and described in 1858 (Evans, 1973; Pettenkofer, 1858, as cited in Beck, 2007). A Pettenkofer obituary claims that Dalton (see above regarding dewpoint) and Watson developed a similar method of CO2 measurement in England (Haldane, 1901). In any event, the Pettenkofer maximum of 1,000 ppm is still effectively in use today, having been enshrined in a significant health guide for architects (Appleby, 1990). Work aligning with Pettenkofer’s 1872 paper, by Dr Francis S B Francois de Chaumont, an expert in military hygiene, was published four years later (Francois de Chaumont, 1876). He gave two sets of figures, the second corrected relative to the first as “a previously unobserved error was found in one of the constants employed”; but he points out that the error was of little consequence as the corrected value for ‘fresh’ is still below the value of 0.2 parts CO2 above that outside. His methodology relied on relating measurement of CO2 to the sensory responses of a reliably large number of participants, here 458 ‘fully recorded’. A CO2 concentration of 1,000 ppm was found to be very close to the perception “Close, organic matter disagreeable”; while 700 ppm was some 100 ppm below “Rather close, organic matter becoming perceptible”, allowing for an ambient level of 400 ppm. His colleague, Dr Edmund A Parkes (Parkes, 1878), also notes that Pettenkofer suggested an optimum of circa 700 ppm, slightly above that of another researcher in this field, Degen: “Pettenkofer has now adopted the limit of .7 measures of CO2, and Degen .66 measures per 1000, as the amount when the organic matter simultaneously present becomes perceptible.” This recommendation also survives to this day. It may be noted that the original figures are given as parts of CO2 (carbonic acid) per 1,000 above the outside level, and the translated figures in ppm include 0.4 parts per 1,000 as the “average ratio of CO2 in external air” (as cited by Parkes, where in each case it is the level above that measured outside that is recorded as due to ‘respiratory impurity’). The respective findings are given in Table 3.
Respiratory Impurity as CO2 (i.e. parts/1,000 above that outside)
Classes Original figures Corrected figures
1. Fresh 0.1830 0.1943
2. Rather close 0.3894 0.4132
3. Close 0.6322 0.6708
4. Extremely close 0.8533 0.9504
Table 3. Results of Dr Francis S B Francois de Chaumont survey published 1876
Thus we can see from Table 3, classification 3 ‘Close’ that 0.6708 + 0.4 = 1.0708 parts CO2/1,000 or 1,071 ppm; and for classification 2 ‘Rather close’ 0.4132 + 0.4 = 0.8132 parts CO2/1,000 or 813 ppm. The Francois De Chaumont values of 1876 also accord with the recommendations of Dr John S Billings (Billings, 1889), who refers to parts of CO2/10,000 and refers to the values in a room assuming a normal amount of 4.0 outside. For example: “between 6 and 7 parts in excess of 10,000, a faint, musty, unpleasant odor is usually perceptible to one entering from the fresh air. If the proportion reaches 8 parts, the room is said to be close.” Thus 8 parts, ‘close’, equates with Francois de Chaumont’s No. 2 ‘rather close’; or 800 ppm. Billings also points out that it is not CO2 itself that is the problem: “It is because carbonic acid is usually found in very bad company, and that variations in its amount to the extent of three or four parts in ten thousand indicate corresponding variations in the amount of those gases, vapors, and suspended particles which are really offensive and dangerous, …”. Of course
www.intechopen.com

Chemistry, Emission Control, Radioactive Pollution and Indoor Air Quality
218
the nature of the bad company has changed over time, but the principle still holds. Very similar perceptive values to those of Francois De Chaumont are also used in an early 20th C manual (International Textbook Co., 1909). In this case 4-5 parts above that outside is considered ‘rather close’, 7-8 parts ‘very close’ and 12 parts ‘very bad’. Although sources are not referenced, it seems likely that the values originate from Francois de Chaumont. This text includes a formula for calculating the appropriate rate of air change, taking account of CO2 exhaled by occupants, gas lighting and appliances. Another such book refers to Sir Douglas Galton in stipulating a minimum ventilation rate per person of 1,000 ft3/hour, or circa 8 l/s (B. F. Fletcher & H. P. Fletcher, 1907). Returning to the 1880s, an extensive publication in the British Medical Journal (BMJ) that predates that of Billings by two years is that carried out in the east of Scotland from 1885-86 by a team comprising Prof. Thomas Carnelley and John Scott Haldane from University College, Dundee, with Dr A M Anderson, Medical Officer of Health for Dundee (Carnelley et al., 1887). Its importance lies in relating health to air quality by making use not only of Pettenkofer’s invention of a reliable instrument to measure CO2, but also of microbiological techniques to sample and analyse air. Their 1887 paper describes in some detail the method of Walter Hesse that was used in conjunction with a jelly attributed to Heinrich Koch (Carnelley et al., 1887:62). Although the date of the Hesse technique is absent, it is known that Koch’s postulates concerning the use of this jelly were formalised in 1882 (Gardner, undated). It is further reported that Hesse’s method followed that of Koch (Robertson, 1888). Importantly, the same address by Robertson on the study of micro-organisms in air made the point that the Carnelley-led survey had found no relationship between the amount of CO2 and the number of micro-organisms. This was a key association for air quality, by then well-defined, and the potential impact of bacteria in particular on health, but Robertson’s comment belies the complexity relative to the published findings. In broad terms what the Scottish survey demonstrates is that although respired air, including CO2, does not give off micro-organisms to any appreciable extent (Carnelley et al., 1887:93), the ‘bad company’ principle of Billings holds good, even if interpreted in a broader manner than he intended. The published paper goes on to say that micro-organisms arise from clothes and skin: “Hence, if we take the carbonic acid as a rough measure of the total impurities arising from the persons of those present in a room, it should be a rough measure of the micro-organism from the clothes and skin.” (Carnelley et al., 1887:95) The authors make the further point that as the cubic space per person increases other sanitary conditions improve. This is particularly marked for single-roomed dwellings, allowing for the small sample totalling 27, where the average space per person in a single ‘clean’ home was 38% greater than in the average of ‘dirty’, ‘dirtier’ and ‘very dirty’ homes. The ‘clean’ home had 24% lower CO2 (800 ppm cf. 1,055 ppm) and 70% fewer micro-organisms than the dirty set. In two-roomed dwellings, those that were considered to be ‘very clean’ and ‘clean’ had 77% fewer micro-organisms than the dirty category, although in this case the CO2 level in the cleaner dwellings averaged 9% greater (1027 ppm cf 940 ppm). Thus this particular part of the analysis indicates that there is no strong influence of CO2, when the values are within or not far above the Pettenkofer standard; but that the issue of cleanliness is critical for micro-organisms, and hence potentially to health. In other words, lack of hygiene constitutes injurious ‘bad company’. A significantly larger cohort of cases makes it evident that space per person is critical to health outcomes – see Table 4 below. However, in this case with its reasonably large cohort of 59, the concentration of CO2 also corresponds with the space available and the key health outcomes, noting in particular the increasing death rate according to paucity of space for children less
www.intechopen.com

Sensing a Historic Low-CO2 Future
219
than 5 years of age. We may also note that when the cubic space per person drops to 6.0 m3, all four categories of disease listed exceed the average for the whole population. In terms of CO2 from combustion, and as an indicator of further ‘bad company’ in this regard, it is also relevant to note that the poorest households in the most overcrowded conditions are also most likely to have the cheapest candles and other means of artificial lighting, as well as the cheapest solid fuel. The harmful by-products of smoking, in its various forms, would also be more intensive in smaller spaces. Not listed in Table 4 below are the comparative values for mould, which constitute most of the balance of micro-organisms taken together with bacteria. Subtracting respective values in row 4 from those in row 3 shows that the mould does not conform to the trend of increasing with reduced space or increased CO2.
Description No. of cases
4-room 3-room 2-room 1-room Whole
population
1. Space/person (m3) 69 37.8 7.05 6.0
2. CO2 (ppm) 59 770 990 1,120
3. All micro-organisms 59 9.0/l 46.0/l 60.0/l
4. Bacteria 46 8.5/l 43.0/l 58.0/l
5. General death rate 3,110 12.3 17.2 18.8 21.4 20.7
6. Children <5 deaths 1,347 3.3 5.8 9.8 12.3 9.0
7. Deaths – diarrhoea 253 6.1 11.3 17.4 26.4 16.9
8. Deaths – bronchitis & broncho-pneumonia
224 7.8 9.5 13.4 26.7 14.9
Table 4. Extract from Carnelley, Haldane and Anderson survey published 1887, p 74
A final component of the samples analysed is that of ‘oxidisable organic matter’. This must
have included combustion particles from heating, cooking and lighting, skin scales, the
main food of dust mites, and dust mite faeces and corpses, as well as other matter such as
pollen grains. All but the first are of great interest today in terms of the association with
asthma, in particular childhood asthma. The survey also notes respiration, physical exercise
and cleanliness as being influences, and provides some detailed data from tests for
combustion of coal, respiration, dust and the stagnation of air, and physical exercise.
However, it notes: “Cleanliness has little or no apparent influence on the quantity of organic
matter in air.” (Carnelley et al., 1887:86-89). In the outside air within urban contexts, it is
probable that ‘organic matter’ was dominated by particles from combustion. Records of
deposition of tar, carbonaceousless tar and ash in Glasgow over a period of several years in
the 20th C prior to the Clean Air Acts of the 1950s and 1960s was very much greater than at
Loch Katrine (Gilfillan, 1958). In Dundee, in the winter of 1885-86, the mean CO2 for the
town was found to be 390 ppm (i.e. below the norm of 400 ppm), and organic matter 8.9
(representing the volume of oxygen required to oxidise it in 1 million volumes of air). In its
suburbs the comparative figures were 280 ppm and 2.8. To allow for such differences,
analysis of air samples from inside dwellings in a variety of locations was expressed both in
absolute terms and as the amount above that outside. The same pattern of decreasing values
with increasing space occurs in each case; and, like CO2, the total for micro-organisms and
bacteria, the organic matter also conforms to this trend. In order to show the relativity of the
various indicators clearly (in excess of outside air), the published paper includes a table
www.intechopen.com

Chemistry, Emission Control, Radioactive Pollution and Indoor Air Quality
220
where the larger dwellings of four and more rooms are reduced to unity for all indicators,
with two- and one-roomed dwellings expressed proportionally – see Table 5 below.
Description 4-rooms+ 2-rooms 1-room
1. Space/person 1.0 0.13 0.11
2. CO2 1.0 1.50 2.00
3. Organic matter 1.0 1.60 4.40
4. All micro-organisms 1.0 5.10 6.70
5. Bacteria 1.0 5.10 6.90
6. Moulds 1.0 5.50 3.00
Table 5. Extract from Carnelley, Haldane and Anderson survey published 1887, p 71
Although incidence of organic matter increases with decreasing space, it did not, as indicated above, particularly relate to the judgments made as to cleanliness. For example the ‘very clean’ 2-roomed dwellings had more organic matter than the ‘clean’ ones (Carnelley et al., 1887:96). Of at least equal importance to the housing studies were the surveys of two sets of schools,
again from 1885-86. The sample in this case included 42 that were ventilated naturally,
primarily via windows and fireplaces, and 26 that were mechanically ventilated. The latter
achieved this by means of a plenum system with fans delivering filtered and heated air
through registers located some 1.5 m from floor level, and with the vitiated air removed by
natural thermal buoyancy (stack effect) via low-level outlet grilles (Carnelley et al., 1887:78).
Given the current 21st C eco-publicity favouring natural ventilation of non-domestic
buildings, it may seem surprising that there was clear evidence in 1886 that mechanical
ventilation provided the better air quality, with marked improvements for every indicator.
For example, even though the average space per person in the mechanically ventilated
schools was 2% less than that in the naturally ventilated ones, the mean CO2 in the former
was 1,230 ppm compared to 1,830 ppm in the latter. Similarly organic matter was 10.1 to
16.2 and bacteria 16 per litre to 151 comparing mechanical to natural ventilation (Carnelley
et al., 1887:79). Indeed it was reported: “… that of the mechanically ventilated schools only
two contained more than 26 micro-organisms per litre, whereas of the naturally ventilated
schools only three contained less than 26 per litre.” Again the differences were clearly
demonstrated by taking the indicators for the mechanically ventilated schools to unity, and
expressing those of the naturally ventilated ones proportionally – see Table 6 below.
Description re Schools Mechanical ventilation Natural ventilation
1. Space/person 1.0 1.00
2. Temperature > outside air 1.0 0.66
3. CO2 1.0 1.70
4. Organic matter 1.0 7.00
5. All micro-organisms 1.0 9.20
6. Bacteria 1.0 9.40
7. Moulds 1.0 2.00
Table 6. Extract from Carnelley, Haldane and Anderson survey published 1887, p 79
www.intechopen.com
Sensing a Historic Low-CO2 Future
221
Here we may also note the negative impact on indoor temperature in the case of the naturally ventilated schools, the mean only 13.1oC compared with 16.7oC; and even the latter representing thermal austerity compared with today’s shirtsleeve expectations. Experiments were also reported showing that respiration was not associated with micro-
organisms, and that it was clothes and skin that were primarily responsible for the
correspondence between CO2, as an indicator of occupant intensity, and the number of
micro-organisms (Carnelley et al., 1887:95). In terms of CO2’s ‘bad company’, the report also
acknowledges “other sanitary conditions improve as the cubic space increases.” In the
concluding comments, the report takes us back to the evidence associating poor air quality
with higher death rates (see Table 4 above): “Hence we may take it as quite certain that the
above differences in the death rates in Dundee are largely due to the difference in the
quality of the air habitually breathed.” (Carnelley et al., 1887:105) 124 years on, we are
concerned on the one hand with achieving highly airtight buildings in order to conserve
energy, while on the other our systems of controlling ventilation have to contend with
different chemical ‘cocktails’. It is to be hoped that with the economy of energy as the key
driver, that we do not become overly complacent in terms of the rigour we apply to high
standards of air quality.
Another research finding of the 19th C, with influence on the 20th C and potential for further
relevance in the 21st C, concerned sunlight inside buildings. Arthur Downes and Thomas P
Blunt found that sunlight continued to function as a natural disinfectant when transmitted
through glass, particularly in the violet and blue part of the spectrum (Downes & Blunt,
1877). This research finding, published in the same year as the Scottish survey, was arguably
fundamental to the ‘healthy light and air’ of the early 20th C modern movement, which has
since been well documented (Overy, 2007). However, it was not until the 1940s that much
more thorough studies, initially led by Leon Buchbinder, augmented the 19th C knowledge
with respect to the bacteria-killing power of sunlight through glazing (Buchbinder et al.,
1941). In hindsight, it is possible that a greater area of fenestration may have been partly
responsible for the superior performance of the mechanically ventilated schools compared
with their more traditional naturally ventilated counterparts.
Notwithstanding such conjecture, it seems likely that the increasing use of antibiotics from the 1950s onwards gradually displaced architectural interest in the health-giving powers of sunlight, including their contribution to enhanced air quality inside buildings. It also seems ironic that many practitioners of ‘environmental architecture’ in the 21st C have a bias for natural over mechanical ventilation, when evidence suggests that the latter may well be the healthier option – used in auxiliary mode at least. In this case, provided the power for fans is minimised and active cooling is not required, it should also be the more energy-efficient option. The 19th C also saw some advances in knowledge with regard to the human senses. It was
not only sense of smell that had relevance to judgements as to when air was fresh, fusty,
overly dry or humid, but also the human skin receptors in terms of sensing temperature and
air movement. Recapping, Pettenkofer introduced his CO2 standard in 1872. Shortly after
this Francois de Chaumont backed up his findings in 1875-76, as did the Scottish survey,
published a decade later in 1887; and the latter’s analysis of key organic matter and micro-
organisms in air moved knowledge forward. Finally the parallel new knowledge about the
disinfectant properties of sunlight inside buildings introduced a new health dimension to air
quality.
www.intechopen.com
Chemistry, Emission Control, Radioactive Pollution and Indoor Air Quality
222
The question then arises as to whether further scientific and technical advances affecting the
chemical and physical nature of indoor environments, as well as greater insights with
regard to our sensory stimuli, would affect future judgement regarding the original 1872
Pettenkofer standard. For example, would such changes be influential in terms of the
judgements of Povl Ole Fanger’s 168 subjects used to determine the decipol units to
“quantify the concentration of air pollution as perceived by humans”, this work being
accepted for publication (Fanger, 1988) exactly a century after the Scottish survey? The
corollary to this question is would such changes justify a change to air quality standards?
The answer to both would seem to be ‘no’ or at least ‘not by much’. As mentioned above, the
maximum of 1,000 ppm CO2 is still present in the 1990 RIBA publication, the Rosehaugh
Guide (Appleby, 1990), and this value is usefully matched with the introduction of fresh air
at the rate of 8 l/s for each person present. Eight years earlier, Neville Billington had
reminded a London audience that Roscoe in 1857 showed that 4.7 l/s was not enough to
clear odours in Wellington Barracks, and that 6.9 to 9.7 l/s ought to be provided (Billington,
1982). The 8.3 l/s mean average of this range is remarkably close to the Rosehaugh Guide’s 8
l/s, corresponding with the Pettenkofer 1,000 ppm CO2.
Fanger uses the standard of 10 l/s relative to his decipol, in turn based on the unit olf. To
clarify this point: “One olf is the emission rate of pollutants (bioeffluents), by a standard
person.“ In this regard, we may note that Fanger’s ‘bioeffluents’ are part of what the 1887
Scottish survey termed ‘organic matter’. One decipol is the pollution caused by one person
(one olf) ventilated by 10 l/s of unpolluted air. Thus the key difference seems to be the use
of 10 l/s, 25% greater than 8 l/s, and non-linearly corresponding with 874 ppm CO2 with an
ambient level of 360 ppm. In other words it is closer to the lower Pettenkofer desired value
of 700 ppm. However, this is simply a matter of decimal convenience in terms of the Fanger
study. What is of significance is what a rate of 10 l/s signifies in terms of ‘predicted
dissatisfied’ (PD), and this was found to be approximately 15% for 10 l/s or 1 decipol;
whereas 8 l/s or 1.25 decipols would have increased PD to approximately 17.5%. However,
the above is predicated on Fanger’s assertion that “the human senses are usually superior to
chemical analysis of the air.” This begs the question as to relevance of chemical analysis and
how techniques would have advanced since the time of the 1887 Scottish survey. In that
instance, perception, based on previous studies and through the medium of CO2 as an
indicator, is useful as a comparator alongside the microbiological analysis. Another issue is
whether psychological and physiological understanding and knowledge regarding sensory
perception has advanced so as to represent a challenge to 19th century findings, now applied
in an entirely different physical and social context. The hygienic standard for Fanger’s
occupants assumed 0.7 baths/day, changed underwear every day, and 80% use of
deodorants. Also, compared to the 19th C, clothing was of an entirely different nature, as
well as furniture, furnishings and bounding materials. In fact it seems remarkable, given all
these differences, that the Pettenkofer recommendations for optimum and maximum CO2
levels are still credible as indicators of air quality.
In terms of the posited superiority, or at least validity, of the human senses to judge air quality, a historical overview of experimental psychology relative to sensation and perception is useful. In a significant mid-20th C publication, Edwin Boring complains about the paucity of knowledge at that time, 1942, with respect to the stimuli for our sense of smell, as opposed to stimulus-objects (Boring, 1942a). However he cites one early 19th C work prior to Pettenkofer’s 1872 standard and De Chaumont’s 1876 paper: H Cloquet in his
www.intechopen.com
Sensing a Historic Low-CO2 Future
223
book of 1821 (Boring, 1942a:439) with: “… the classification of odours, the psychological seat of olfaction, its mechanism, its pathology, its practical uses and individual differences in sensitivity.” On the same page Boring mentions that Johannes Muller in 1838 could “find only seven pages of really solid fact on smell for his handbook” and similarly Bidder with eleven pages in Wagner’s 1844 ‘Handworterbuch der Physiologie’. We are told that in 1847 Ernst Heinrich Weber (Boring, 1942a:440) “had found not only that cold and warm odorous liquids cannot be smelled when poured into the nostrils of the inverted head, but that eau de Cologne and acetic acid are not sensed at body temperature.” We also learn that in 1862 Max Schultze “localized the olfactory membrane high up in the nasal cavity” and found the olfactory sensors there in a small area – “long cells with hair-like processes”. Boring also discusses cutaneous sensibility, and again remarks on the relative paucity of our knowledge of receptors even though we know something about the characteristics of stimuli (Boring, 1942b). The sensitivity of our skin in terms of warmth and air movement certainly relate to thermal comfort, and is known to psychologically influence our perception of air quality – e.g. too warm when stuffy; too cold when draughty. Boring discusses the issue of liminal points or limen early in his overview, citing Weber’s Law of 1834 (Boring, 1942c); apparently named as such by Gustav Theodor Fechner after E H Weber. This states “two sensations are just noticeably different as long as a given constant ratio obtains between the intensities of their stimuli.” For example, Weber asserts that the skin can appreciate a difference of 1:30. From this Fechner developed the Method of Limits (minimal changes) (Boring, 1942c:37-38): “the procedure in which the stimulus is changed by successive discrete serial steps until a critical point is reached, a point at which judgement is changed.” This body of theory from the first half of the 19th C appears highly relevant to the work of Francois de Chaumont for example in the second half. However, although his paper explains that the methodology was based on a system of differences, it is not clear if there was an awareness of the Weber-Fechner theory. In relation to smells, Boring tells us that later researchers towards the end of the 19th C concluded that Weber’s Law applies approximately, mean average ratios varying in the range 1: 3.125 to 1:2.63, with two thirds of determinations lying between 1:4 and 1:3 (Boring, 1942a:443). These findings came after H. Zwaardemaker’s 1888 Olfactometer to measure the intensity of the odorous stimulus, and even a year or so after the publication of his book in 1895. Inevitably science related to the sense of smell advanced in the next eleven decades. However, just how much of that is relevant to air quality is a moot point. Although the 19th air quality surveys such as that by De Chaumont were predicated largely on olfaction, as was that of Fanger in the 1980s in his introduction of the units olf and decipol, the reality is that human perceptions were bound to be instinctively more holistic. Indeed the descriptive terms in the former case suggest this with ‘close’ and ‘very close’, the more extreme version further defined by the adjectives like ‘oppressive’. In the latter case, the term ‘percentage dissatisfied’ in the context of modern auditoria also invites a wider perception of atmosphere apropos air quality. In a modern auditorium, apart from the paramount issues of acoustics and sightlines, the environmental concerns that one might anticipate would relate to air quality are tangible convection and adequate, but not excessive, warmth. The fundamental attribute expected of the atmosphere would be to stimulate rather than enervate, and subjects may subliminally tend to rank between two such opposing characteristics. The field of environmental psychology gained traction in the 1960s (Gifford, 2002), some two decades before Fanger’s study. The ‘semantic differential’ introduced by Charles E Osgood (Osgood et al., 1957) is one of the techniques used.
www.intechopen.com
Chemistry, Emission Control, Radioactive Pollution and Indoor Air Quality
224
James J Gibson not long afterwards introduced a new way of considering the senses (Gibson, 1966): “The observer who is awake and alert does not wait passively for stimuli to impinge on his receptors, he seeks them. He explores the available fields of light, sound, odor and contact, selecting what is relevant and extracting the information.“ This was a potent hypothesis embodied in his book’s title ‘The Senses Considered as Perceptual Systems’, and one of considerable interest to architects who became aware of it. ‘Body, Memory and Architecture’ by Kent Bloomer and Charles Moore (Bloomer & Moore, 1977), following two and five years after two USA publications already mentioned (Hesselgren, 1975; Fitch, 1972), cites J J Gibson strongly and succinctly: “His strategy was to regard the senses as aggressive, seeking mechanisms and not merely as passive sensation receivers.” They also cite his fourfold categorization of ‘actively detecting’ senses or ‘perceptual systems’: the auditory system, the taste-smell system, the basic-orienting system and the haptic system. Gibson follows up his initial polemic with a passage entitled ‘The Fallacy of Ascribing Proprioception to Proprioceptors’ (Gibson, 1966:33-34). This is a reference back 60 years to ‘The Integrative Action of the Nervous System’ by Charles S Sherrington (Sherrington, 1906), whose opus seems to be the original source of three fields of sensory reception: extero-sensors, intero-sensors and proprio-sensors (introduced in Lecture IV). The first are on the outside of the body – ears, eyes, nose, mouth and skin (cutaneous); the second relate to the visceral organs; and the third to the joints and muscle tissue etc. Boring also confirms that the word ‘proprioception’ is Sherrington’s from 1906 (Boring, 1942d). With Gibson’s thesis in mind and broadening indoor air quality to embrace the overall perceived quality of the atmosphere, it is also of historic interest therefore that Boring cites the 1909 work of Ernst Meumann (Boring, 1942d:562), who posited “… oppression as a cardiac sensation and suffocation as a pulmonary sensation, …”. While cardiac oppression, linked to anxiety and hypotension, as well as pulmonary suffocation might seem somewhat hyperbolic in relation to air quality, one can reasonably argue that a stuffy atmosphere is oppressive, on a scale that has ‘fresh’ at the other end. Stuffiness linked to warmth might also tempt one to take action to make breathing seem more pleasant. Such action might include wafting a programme in an auditorium or opening a window in a domestic room. More than half a century after Meumann’s publication, Victor Olgyay disseminated his ‘bioclimatic chart’ (Olgyay, 1963), whereby above 15 mmHg or 2 kPa of vapour pressure was considered uncomfortable in terms subjects noticing a close or depressed feeling. However, Olgyay cites climatologist Dr Paul Siple’s proposition that one mph (0.45 m/s) of air movement will counteract every additional 1 mmHg (0.133 kPa) of vapour pressure (0.34 m/s for 0.1 kPa). Thus we have an architect interpreting ‘air quality’ in terms of thermal comfort, and crucially bringing humidity and air movement into the sensory mix. T A E Platts-Mills and A L De Weck have more recently posited vapour pressure, or the mixing ratio of moist to dry air, as a measure to limit excess dust mite population growth (Platts-Mills & De Weck, 1989). They recommend an upper threshold of 7 g/kg (1.13 kPa). More recently in the US, ‘Clearing the Air’ (Institute of Medicine, 2000) had a focus on asthma. It summarized: “There is sufficient evidence of a causal relationship between dust mite allergen exposure and exacerbations of asthma individuals specifically sensitized to dust mites. Continual exposure to dust mite allergens is also a contributing cause of chronic bronchial activity.” The summary went further: “There is sufficient evidence of a causal relationship between dust mite allergen exposure and the development of asthma in susceptible children.” The report also concludes in relation to the presence of mould or fungal spores: “There is sufficient evidence of an association between fungal exposure and
www.intechopen.com
Sensing a Historic Low-CO2 Future
225
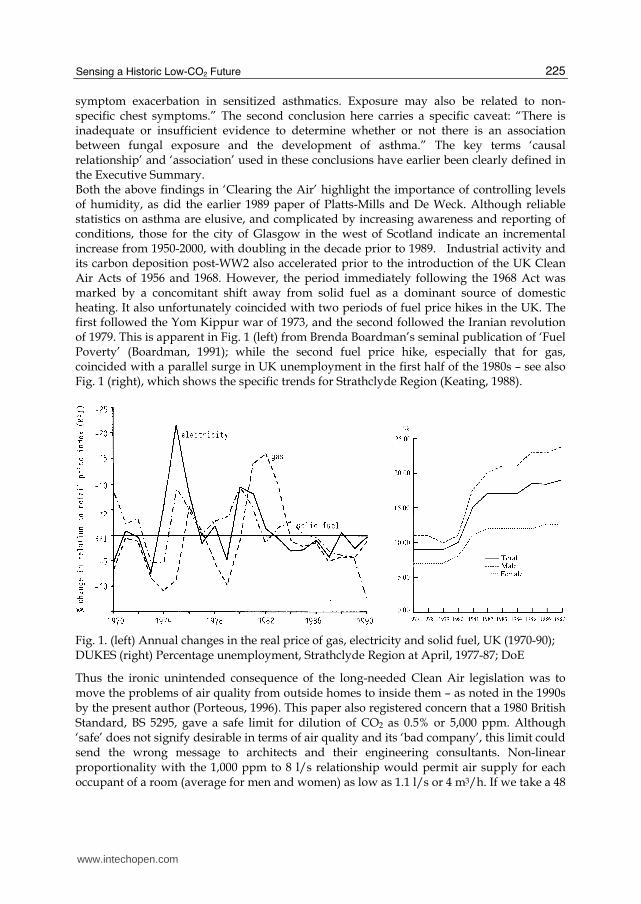
symptom exacerbation in sensitized asthmatics. Exposure may also be related to non-specific chest symptoms.” The second conclusion here carries a specific caveat: “There is inadequate or insufficient evidence to determine whether or not there is an association between fungal exposure and the development of asthma.” The key terms ‘causal relationship’ and ‘association’ used in these conclusions have earlier been clearly defined in the Executive Summary. Both the above findings in ‘Clearing the Air’ highlight the importance of controlling levels of humidity, as did the earlier 1989 paper of Platts-Mills and De Weck. Although reliable statistics on asthma are elusive, and complicated by increasing awareness and reporting of conditions, those for the city of Glasgow in the west of Scotland indicate an incremental increase from 1950-2000, with doubling in the decade prior to 1989. Industrial activity and its carbon deposition post-WW2 also accelerated prior to the introduction of the UK Clean Air Acts of 1956 and 1968. However, the period immediately following the 1968 Act was marked by a concomitant shift away from solid fuel as a dominant source of domestic heating. It also unfortunately coincided with two periods of fuel price hikes in the UK. The first followed the Yom Kippur war of 1973, and the second followed the Iranian revolution of 1979. This is apparent in Fig. 1 (left) from Brenda Boardman’s seminal publication of ‘Fuel Poverty’ (Boardman, 1991); while the second fuel price hike, especially that for gas, coincided with a parallel surge in UK unemployment in the first half of the 1980s – see also Fig. 1 (right), which shows the specific trends for Strathclyde Region (Keating, 1988).
Fig. 1. (left) Annual changes in the real price of gas, electricity and solid fuel, UK (1970-90); DUKES (right) Percentage unemployment, Strathclyde Region at April, 1977-87; DoE
Thus the ironic unintended consequence of the long-needed Clean Air legislation was to move the problems of air quality from outside homes to inside them – as noted in the 1990s by the present author (Porteous, 1996). This paper also registered concern that a 1980 British Standard, BS 5295, gave a safe limit for dilution of CO2 as 0.5% or 5,000 ppm. Although ‘safe’ does not signify desirable in terms of air quality and its ‘bad company’, this limit could send the wrong message to architects and their engineering consultants. Non-linear proportionality with the 1,000 ppm to 8 l/s relationship would permit air supply for each occupant of a room (average for men and women) as low as 1.1 l/s or 4 m3/h. If we take a 48
www.intechopen.com

Chemistry, Emission Control, Radioactive Pollution and Indoor Air Quality
226
m3 living room occupied by four people, this gives a rate of air change of 0.33 ac/h. If we compare this with the 8 l/s standard of the 1990 Rosehaugh Guide, the same scenario would imply a rate of 2.4 ac/h for that period of occupation. Herein lies the dilemma for aligning energy efficiency with air quality, potentially risking conditions with high moisture levels. It also helps to explain why research exploring the potential for passive solar techniques to preheat supply air occurred in 1980s and 1990s (Ho, 1995; Porteous & Ho, 1997; Saluja et al., 1987), and why mechanical heat recovery is now in the ascendancy (Porteous, 2010). Such work was additionally motivated by dampness from condensation in housing emerging as a major social concern in the 1980s. Black mould and mildew with its insidious smell and poverty stigma were the physical manifestations, made all the worse by the poorly insulated post-war building boom. This was the reality of ‘air quality’ for the low-income sector. The dense concrete construction of 1960s and 1970s systems used for towers and low-rise blocks of housing were particularly notorious, with instances of mould becoming so severe that it formed a black slime on the coldest walls. It was apparent that diagnostic processes at design stage to avoid condensation on surfaces or interstitially had not been applied. The combination of high thermal transmittance, poor and expensive means of heating, and poor control of ventilation, all contributed to this. The thermal efficiency of the building envelope needed to improve significantly along with suitable means of heating and ventilating. When sequential thermal conductivity relative to vapour permeability was analysed in multi-layer construction, it also became evident that future construction required much more careful consideration than had been the case hitherto. We have already established above that the essential science of temperature relative to moisture had been mathematically described by 1844 by Magnus and his predecessors working in this field. Also, Joseph Fourier’s Law of Heat Conduction (Fourier, 1822) stated: “the rate of heat transfer through a material is proportional to the negative gradient in the temperature, and to the area at right angles to that gradient through which the heat is flowing.” Thomas Graham’s Law of Diffusion (Akrill, et al., 1979), first stated in 1831, posited that the rate of effusion of a gas is inversely proportional to its molecular mass; and Adolf Fick’s Laws of Diffusion of 1855 (Philibert, 2006) may be paraphrased as: a) diffusive flux travels from regions of high to low concentrations; b) the prediction of how diffusion causes the concentration field to change with time. However, in order to predict likelihood of condensation two other key advances were required. Firstly, reliable methods of measuring the thermal conductivity of materials had to be established; and secondly, similar methods were required to measure vapour permeability. Taking conductivity first, Robert Zarr (Zarr, 2001) tells us that refrigeration industries pump-primed research from the early 1910s at The National Institute of Standards (NBS), later changing its name to the National Institute of Building and Technology (NIST). Zarr also tells us that the early experiments were conducted at an NBS laboratory in Washington DC, initially under the direction of Hobart C Dickinson and later Milton S Van Dusen. He cites several significant papers concerning experiments into thermal conductivity: one by Dickinson and Van Dusen M S in 1916, ‘The testing of thermal insulators’; one by Van Dusen in 1920, ‘The thermal conductivity of heat insulators’; one by Van Dusen and J L Finck in 1928, ‘Heat transfer through insulating materials’; and another by the same pair in 1931, ‘Heat transfer through building walls’. A post-WW2 book on insulation by Paul D Close (Close, 1947) refers to three methods of testing building materials: a hot plate apparatus by Lees in 1898 (Brown, 2006); a hot box apparatus; and the Nicholls heat meter (Nicholls, 1924). In the UK, George F C Searle published details of an apparatus to measure
www.intechopen.com
Sensing a Historic Low-CO2 Future
227
the conductivity of high conductors such as copper, and another apparatus for low conductors such as rubber (Searle, 1934). Thus it seems that full tables of thermal conductivity of common building materials, such as those in the book by Close, were not available until the 1940s. This signifies a remarkable period of about a century after the key knowledge defining moisture relative to temperature. Modern methods for measuring vapour permeability started somewhat later than those for thermal conductivity. Paul Close published a paper (Close, 1930) on prevention of condensation on interior building surfaces, which only required knowledge of the thermal conductivity of bounding elements. Mark Bomberg cites J D Babbitt for his 1939 paper (Bomberg, 1989), which seems to be in the vanguard of measuring permeability through various building materials. At any rate by 1947 Close’s book contains three tables, one of which is attributed to L V Teesdale, another to J D Babbitt and a third to the University of Minnesota (Close, 1947:250-252). However, the materials for which values are given reflect the typical American timber-frame construction, and so are limited in terms of a full palette of materials for architects. An article in Architects’ Year Book 4 (Varming, 1952) indicates a comprehensive knowledge of vapour transmission through masonry construction of various types in Europe. However, the gap is considerable between the early work by 19th C scientists and a 20th C capability to track dew-point and structural temperature through multi-layer construction. Given that a mix of dense materials and aerated insulating products were common from the 1920s, one can only conclude that architects during this period operated on a basis of broad principles or ignorance. In other words, the risk of interstitial condensation would be high. Nevertheless, particular buildings appeared to show a good grasp of the theory involved – for example the roof of the 1930 seaside house by Alfred Roth and Ingrid Walberg, or the wall of the 1932 house by Adolf Bens in Prague (Porteous, 2002a). Architects did not necessarily need to know exact values for vapour and thermal conductivity. If they understood four principles, they could design reasonably condensation-proof constructions: firstly, vapour travels from high to low concentrations; secondly, this will be relatively rapid through a porous material and less so through a dense material; thirdly, air movement helps to disperse water vapour; and fourthly, knowing that low conductivity relies on trapping still air, an insulating material placed on the cold side of a dense structural material will help to keep it warm. Alvar Aalto was another architect who concerned himself with such issues of performance. In 1938 (Aalto, 1979a), in a lecture given at the Nordic Building Congress, Oslo, Aalto related flat roof construction to liberation of plan forms, and insulation on flat roofs to geographical transferability. In the same lecture Aalto prefaces his comment on roofs by stating: “Water pressure insulation has given us the opportunity to penetrate deeper into the earth.” This could well have been an oblique reference to his stepped terrace of dwellings at Kauttua, constructed 1938-40, which involves significant cuts into the ground. More contentiously on the issue of air quality, in 1955 (Aalto, 1979b) in a lecture to the Central Union of Architects in Vienna, he claims that metal ducting has a deleterious effect, claiming evidence from laboratory tests. Although this assertion is not referenced and although contemporaneous papers to this effect have not been traced, it is likely that Aalto was referring to galvanized metal ducting boosting the positive ions of the air that passed through it, the existence of ions having been known since the end of the 19th C. The longevity of this effect by such metals is also hard to track down, but it is also known that dust and other airborne particles such as bacteria and fungal spores are positively charged, and hence increase the incidence of positive ions (the
www.intechopen.com

Chemistry, Emission Control, Radioactive Pollution and Indoor Air Quality
228
‘bad’ ones). Relatively recent research (Sippola & Nazaroff, 2002) shows that particle deposition is significant, especially on the floor of horizontal duct runs and considering particles larger than 40 microns; noting that experimental data of particle deposition was fitted to computer models. Production of positive ions in ducts also relates to previous microbiological work on fungal spores (Pasanen et al., 1993), which indicates the possibility of mould propagation in sections of unheated or poorly insulated ducts in certain weather conditions. On the other hand since plants emit water vapour through transpiration they produce negative ions, which also reduce dust levels (Lohr & Pearson-Mims, 1996); and, as mentioned above, sunlight in rooms will reduce bacterial activity, and hence boost negative ions, as will natural materials such as clay plaster (White et al., 1992). In another branch of science, there are concerns about chemical reactions in ventilation ducts (Andersson et al., 1996); whereby research indicates possible production of aldehydes (e.g. formaldehyde and benzaldehyde) from a reaction inside ducts between volatile organic compounds (VOCs), styrene for example, and inorganic gases such as ozone found in the ambient air. Clearly, length of ducts may be a factor, the experiments reporting use of 6.0 m tubes. Hence, at a time when mechanical heat recovery ventilation (MHRV) is gaining traction for housing and other buildings, in part to comply with standards like PassivHaus and Minergie-P, there are notes of caution from the research community. There are some examples of buildings that have used MHRV, but deliberately avoided metal ducting – e.g. the Hockerton Housing Project near Newark in Nottinghamshire, UK, by architects Brenda and Robert Vale, using fireclay pipes (Anon., 2006); the Marché headquarters building between Zurich and Winterthur by architect Beat Kampfen, using hollow timber columns and wall-integrated ducts for vertical supply and exhaust (Anon., 2009). Since MVHR has been shown to save energy, and noting that the Marché building is designed as ‘net annual zero energy’ and also has excellent air quality, it would seem that further research should be carried out with regard to ducting materiality and cleanliness relative to a healthy ion balance in the served spaces. Similar additional research could be carried out to identify any perceived effects in terms of air quality in served spaces, which are attributable to the presence of verdure, moving water and natural linings such as clay plaster and untreated timber. The capability is certainly there for such investigations in terms of advanced modelling techniques validated by field measurement. One such study, led by John F Straube, sets a context of tackling indoor pollutants, described as “a chemical soup of VOCs”, by means of avoidance, removal and exclusion (Straube & deGraauw, 2001). For removal he cites a role for plants and running water, as well as for hygroscopic materials, which constitutes the core of his findings. A renowned example of vegetation and running water as the ambient context for a home is Frank Lloyd Wright’s famous Fallingwater. One could argue that Jay Appleton’s ‘prospect-refuge’ theory (Appleton, 1996) and the ‘hazard symbolism’ expounded by Grant Hildebrand when analysing this building (Hildebrand, 1991) has relevance from a holistic view of indoor air quality. The psychology of perception here favours generous fenestration both to enhance the drama of prospect and to admit winter sunshine to a secluded refuge deep within the room – fire of the sun to fire of the hearth. There are other significant buildings of that ilk, such as the 1988 ING Bank building by Ton Alberts, or Joachim Eble’s 1992 Oko-haus in Frankfurt visited by the present author
(Porteous, 2002b). In each case atria with planting and running water contribute to indoor air quality as well as to prospect and refuge for the occupants, if not hazard symbolism. There have also been several papers published on the air-cleansing qualities of certain
www.intechopen.com

Sensing a Historic Low-CO2 Future
229
indoor plants. For example, that led by Martina Giese examines detoxification of formaldehyde by the spider plant (Giese et al., 1994). Another led by Bill Wolverton explores the ability of plants to remove a range of VOCs from the indoor environment (B. C. Wolverton & J. D. Wolverton, 1993); and one three years later examines the influence of indoor plants on the reduction of airborne microbes and influence inside energy-efficient buildings (B. C. Wolverton & J. D. Wolverton, 1996). In the same year, Virginia Lohr and colleagues demonstrated that interior plants could improve worker productivity and reduce stress in a windowless environment (Lohr et al., 1996) – i.e. creating an internal prospect of verdure. J R Girman and a team at Lawrence Berkeley Laboratory in California also investigated emission rates from various indoor combustion sources, including cigarettes, this still being relevant in private buildings at least (Girman, 1982). More recently, a useful online design guide ‘Design and Detailing for Toxic Chemical Reduction in Building’ by the Scottish Ecological Design Association (SEDA) has been available (Liddell et al., 2008). However, this has proved controversial for some manufacturers and SEDA’s response to complaints thus far has been online redaction of some passages. Returning to Straube’s own analytical findings, which include results from modelling hygric response as well as field measurements, a strong case is made for moisture buffering by using hygroscopic lining materials. A mathematical model for non-isothermal vapour transport in hygroscopic building materials, validated by an experimental study and led by Menghau Qin was recently published (Qin et al., 2008). Further work on determining moisture buffering potential in situ by Evy Vereecken and colleagues (Vereecken et al., 2011), adds to that of Straube and introduces the units HIR (Hygric Inertia for a Room, g/m3.%RH) and MBV (Moisture Buffer Value, g/m2.%RH). These units express the mass of moisture taken up by materials in field experiments over different time intervals, and validated by a test room in the VLIET test-building in KU Leuven in Belgium. They also include the potential contents of rooms, such as piles of newspapers and books, as well as the lining materials like wood-wool cement board. There has been parallel work targeted at reducing airborne pathogens in buildings. For example that by a team led by Peng Xu investigated the efficacy of ultraviolet irradiation of upper room air in this regard (Xu et al., 2003); and there has been more recent work reviewing various means of protecting occupants from airborne pathogens (Balashikov & Melikov, 2009). The latter notes that knowledge of the influence of RH on pathogenic bacteria is scant, while 40-60% RH is accepted as more lethal to non-pathogenic bacteria. Both papers are concerned with ‘active’ methods of intervention in air handling systems, rather than the passive solar methods explored in the 1940s by Leon Buchbinder and colleagues, which were mentioned earlier. Arguably, a case can be made for hybrid techniques. Enhancing the ability of mechanical ventilation to improve air quality in partnership with effective passive solar environmental design seems a workable strategy. However, in terms of health, it would mean avoiding re-circulation in favour of MHRV. An earlier investigation led by John F Brundage, proved that mechanically ventilated barracks with 95% recirculated air, increased incidence of respiratory infection compared with older naturally ventilated barracks (Brundage et al., 1988); an irony given all the 19th C research work on ventilation by army surgeons. Recirculation is a 20th C phenomenon, aimed at saving energy. In the 19th C the norm was a once-through system with the filtered, washed and heated air introduced mechanically and exhausted by wind-assisted thermal buoyancy through terminals at the top of buildings. One of the earliest 20th C buildings that was until recently of this type did introduce a
www.intechopen.com

Chemistry, Emission Control, Radioactive Pollution and Indoor Air Quality
230
modicum of recirculation – the 1901 Kelvingrove Art Gallery and Museum by architects John W Simpson and E J Milner Allen. Technical information about this building was presented at the Twenty-Second Congress of the Sanitary Institute, and published in a book ‘Municipal Enterprises – Glasgow’ (Anon., 1904). Two electrical enclosed fans, designed to deliver a total of 5 million ft3/h or 140,000 m3/h, powered the plenum system in this building. This design rate corresponds to approximately 1.1 ac/h. The system was also designed to cool the ambient air by at least 4oF (2.2 K) in summer, while the embedded masonry ducting provided a similar preheating effect in winter. Some recirculation was enabled via doors to the main supply shafts off the two main glazed atria either side of the main entrance concourse, but this would have been insignificant compared to the Brundage barracks case studies. With only one minor upgrade to replace worn out parts in the 1950s, Kelvingrove provided excellent air quality and comfort up to its conversion to full air conditioning in 2003-06. Now in the refurbished basement at least, there is a tendency to over-chill the air supply. In the restaurant the distribution is particularly poor, and diners below the ceiling registers are liable to be subjected to uncomfortably cool draughts. Even in the main gallery spaces on the ground and first floor, the flow rate from supply registers in walls is such that movement of air is more evident than formerly. Also, daylight has been banished from all the peripheral galleries, and, given the psychological twinning of ‘light and airy’, the overall ambience is now perceptually less pleasant than formerly. In a later 20th C example from the 1970s, the Bourdon Building at The Glasgow School of Art
housing the Mackintosh School of Architecture, the mechanical ventilation supply with a
high proportion of recirculation proved problematic. This was evidenced by the rapidity
with which smoke emanating from a single inside source circulated around the entire
building. A ‘black-box’ lecture theatre was particularly poor in terms of its air quality and
was eventually fitted with additional freestanding air conditioning units. However, a
monitoring study (Fung, 2008a) found a significant proportion of dissatisfaction among the
students during a one-hour lecture. The highest level of satisfaction occurred some 15
minutes into the lecture after an initial surge in CO2 up to 1,380 ppm started to drop down
to 1,080 ppm. As the level steadily increased up to 1,170 during the remainder of the time,
the sum of ‘very dissatisfied and ‘somewhat dissatisfied’ also gradually increased up to 31%
of those present. Again, this study tends to support the Pettenkofer limit of 1,000 ppm. This
finding also corresponded with a similar survey of dissatisfaction within offices on the
campus.
A visit by the present author to the Whatcom Museum in Bellingham, Washington, USA,
completed in 2009 by architect Jim Olson, confirmed a similar tendency to that at
Kelvingrove in terms of rather cool temperatures, especially when passing in the ‘line of fire’
of plenum supply registers delivering at relatively high velocity. Temperatures varied
between 18.3oC and 19.4oC in lower and upper galleries respectively, while RH was in the
unexpectedly high range 62-68%. Since the weather outside was sunny and warm, this
proved chilly for lightly clad visitors. While such a building may be supplying perfectly
healthy, clean air, the perception of air quality is compromised by lack of thermal comfort.
A domestic example that has issues of both low temperature of air delivery and
recirculation is that of a 2003 rural housing project in the Scottish village of Ballantrae by
architects ARP Lorimer Associates for Ayrshire Housing Association. This employs a
proprietary positive-pressure system supplying air continuously through a single register
on the landing at the top of the staircase. The double-height circulation space thus acts as a
www.intechopen.com
Sensing a Historic Low-CO2 Future
231
plenum delivering fresh air to all rooms, with exhaust via windows. A manifold in the attic
seeks air from a number of sources depending on the setting by the occupant. When set to
‘warm’ this could be from the apex of the attic or from a double-height passive solar buffer,
located between the main rooms. Unfortunately this meant that cooking odours, smoke and
so forth from the kitchen or the living room could form part of the ‘fresh’ supply. When set
to ‘cool’, the supply air is taken from a vent in the eaves at the north side of the roof, which
is useful when there is a need for summer cooling. However, when set to ‘warm’ on a cold
evening the inflow will come from either the attic or the sunspace, and may then be
perceived as an uncomfortably cool draught by residents.
3. Experience from recent Scottish housing research projects
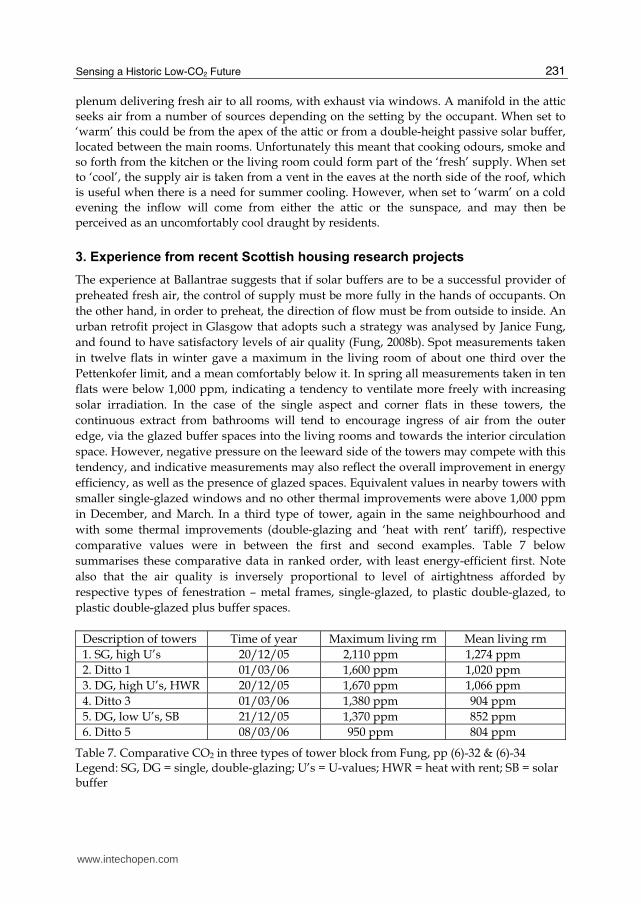
The experience at Ballantrae suggests that if solar buffers are to be a successful provider of
preheated fresh air, the control of supply must be more fully in the hands of occupants. On
the other hand, in order to preheat, the direction of flow must be from outside to inside. An
urban retrofit project in Glasgow that adopts such a strategy was analysed by Janice Fung,
and found to have satisfactory levels of air quality (Fung, 2008b). Spot measurements taken
in twelve flats in winter gave a maximum in the living room of about one third over the
Pettenkofer limit, and a mean comfortably below it. In spring all measurements taken in ten
flats were below 1,000 ppm, indicating a tendency to ventilate more freely with increasing
solar irradiation. In the case of the single aspect and corner flats in these towers, the
continuous extract from bathrooms will tend to encourage ingress of air from the outer
edge, via the glazed buffer spaces into the living rooms and towards the interior circulation
space. However, negative pressure on the leeward side of the towers may compete with this
tendency, and indicative measurements may also reflect the overall improvement in energy
efficiency, as well as the presence of glazed spaces. Equivalent values in nearby towers with
smaller single-glazed windows and no other thermal improvements were above 1,000 ppm
in December, and March. In a third type of tower, again in the same neighbourhood and
with some thermal improvements (double-glazing and ‘heat with rent’ tariff), respective
comparative values were in between the first and second examples. Table 7 below
summarises these comparative data in ranked order, with least energy-efficient first. Note
also that the air quality is inversely proportional to level of airtightness afforded by
respective types of fenestration – metal frames, single-glazed, to plastic double-glazed, to
plastic double-glazed plus buffer spaces.
Description of towers Time of year Maximum living rm Mean living rm
1. SG, high U’s 20/12/05 2,110 ppm 1,274 ppm
2. Ditto 1 01/03/06 1,600 ppm 1,020 ppm
3. DG, high U’s, HWR 20/12/05 1,670 ppm 1,066 ppm
4. Ditto 3 01/03/06 1,380 ppm 904 ppm
5. DG, low U’s, SB 21/12/05 1,370 ppm 852 ppm
6. Ditto 5 08/03/06 950 ppm 804 ppm
Table 7. Comparative CO2 in three types of tower block from Fung, pp (6)-32 & (6)-34 Legend: SG, DG = single, double-glazing; U’s = U-values; HWR = heat with rent; SB = solar buffer
www.intechopen.com

Chemistry, Emission Control, Radioactive Pollution and Indoor Air Quality
232
Durational data from individual flats in the second and third of these tower-block sets, also confirmed a significantly lower incidence of the mixing ratio exceeding 7 g/kg – the threshold of Platts-Mills and De Weck cited above to limit dust mite propagation – for the most energy-efficient case with the glazed buffer spaces. Table 8 summarises this.
Description of towers Time of year Living rm Bedroom Kitchen
1. DG, high U’s, HWR
23/10/06 - 18/12/06 34.9 10.4 8.1
2. Ditto 1 30/11/06 - 04/12/06 97.6 98.0 87.9
3. DG, low U’s, SB 24/10/06 - 23/11/06 13.5 5.7 2.6
Table 8. Comparative % mixing ratio >7g/kg in two types of tower block, Fung, p (6)-48
Even though one should be cautious about individual comparisons, born out by the range between two flats in the HWR tower, the findings align with CO2 levels from a larger number of cases in Table 7. Moreover, a 42% incidence of mould on walls was recorded in the entire set of HWR flats, compared with none for the SB towers and 67% for the least thermally efficient (rows 2 and 3 in table 7 above). Fung was only able to include two flats with MHRV in her study (Fung, 2008b), this a block designed by architect Ian Ritchie for Scotland’s Home of the Future in 1999. In one case, it was a non-smoking household that made use of the MHRV, but also frequently overrode it by opening windows. Thus although the CO2 was generally below the 1,000 ppm level, it was not used optimally in terms of energy efficiency. A smoking household occupied the other flat and decided not to use the MVHR due to a fear of “creepy crawlers coming through the vents”; and, in this case, the levels exceeded 1,000 ppm. The non-smoking household in this case also achieved similar percentages above the mixing ratio of 7 g/kg to the SB flat in Table 8 for the living room, although somewhat higher for the kitchen and bedroom. More recent work by the Mackintosh Environmental Architecture Research Unit (MEARU) has found CO2 levels in the living room of new houses in Glasgow with MVHR going up to circa 2,000 ppm during periods of occupation by four persons, with a maximum of over 2,500 ppm, while a gathering of six persons took the level above 3,500 ppm. Olaf Adan showed in his 1990s doctoral thesis that short-term peaks of high humidity can support fungal growth (Adan, 1994, as cited in: Ginkel & Hasselaar, 2005; Straube & deGraauw, 2001; Viitanen & Ojanen, T, 2007). This characteristic has been shown to be common in a series of 2-week surveys carried out as part of a Glasgow project ‘Environmental Assessment of Domestic Laundering’ led by the present author. In most cases CO2 peaks coincide with vapour pressure peaks, indicating that both are due to relatively intensive occupation with closed windows, but not with particularly airtight construction. Typically in this situation vapour pressure rises steeply to over 2.0 kPa (nearly 100% above the 7 g/kg threshold) from less than 1.0 kPa (well below the 7 g/kg threshold). This contrasts with a situation whereby drying a washing load overnight gives a gradual increase of vapour pressure, while CO2 levels fall in the absence of occupants. In the second case, however, the mixing ratio still rises above 7 g/kg to approximately 11 g/kg (1.78 kPa) by morning; while CO2 falls from a peak of 2,000 ppm in late evening. Therefore, although CO2 and vapour pressure maxima are more severe in the first case, they are a cause for concern in both. Neither are these particular two situations unusual. Table 9 below summarises key data seasonally for 23 households, all monitored for approximately two weeks at different times of the year.
www.intechopen.com
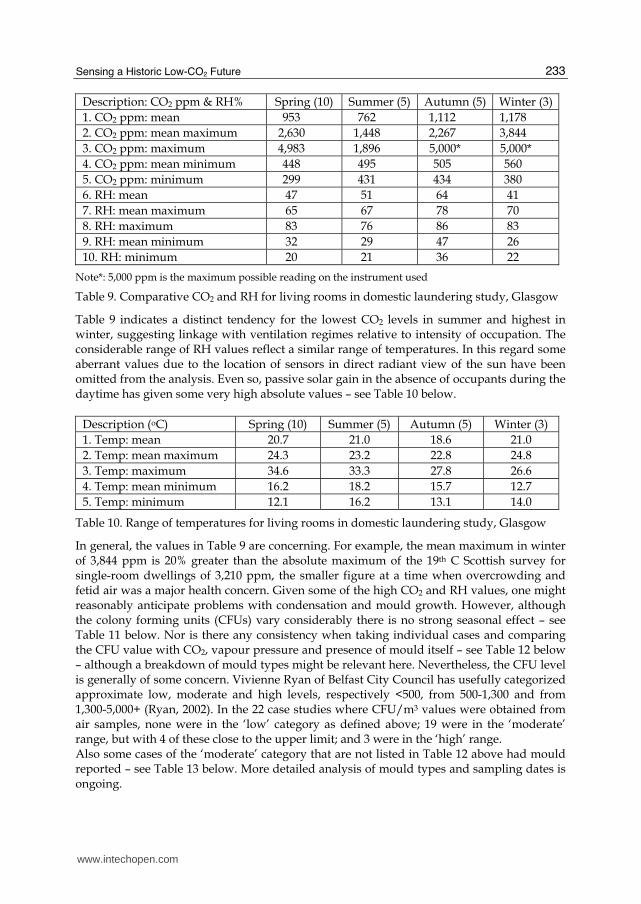
Sensing a Historic Low-CO2 Future
233
Description: CO2 ppm & RH% Spring (10) Summer (5) Autumn (5) Winter (3)
1. CO2 ppm: mean 953 762 1,112 1,178
2. CO2 ppm: mean maximum 2,630 1,448 2,267 3,844
3. CO2 ppm: maximum 4,983 1,896 5,000* 5,000*
4. CO2 ppm: mean minimum 448 495 505 560
5. CO2 ppm: minimum 299 431 434 380
6. RH: mean 47 51 64 41
7. RH: mean maximum 65 67 78 70
8. RH: maximum 83 76 86 83
9. RH: mean minimum 32 29 47 26
10. RH: minimum 20 21 36 22
Note*: 5,000 ppm is the maximum possible reading on the instrument used
Table 9. Comparative CO2 and RH for living rooms in domestic laundering study, Glasgow
Table 9 indicates a distinct tendency for the lowest CO2 levels in summer and highest in winter, suggesting linkage with ventilation regimes relative to intensity of occupation. The considerable range of RH values reflect a similar range of temperatures. In this regard some aberrant values due to the location of sensors in direct radiant view of the sun have been omitted from the analysis. Even so, passive solar gain in the absence of occupants during the daytime has given some very high absolute values – see Table 10 below.
Description (oC) Spring (10) Summer (5) Autumn (5) Winter (3)
1. Temp: mean 20.7 21.0 18.6 21.0
2. Temp: mean maximum 24.3 23.2 22.8 24.8
3. Temp: maximum 34.6 33.3 27.8 26.6
4. Temp: mean minimum 16.2 18.2 15.7 12.7
5. Temp: minimum 12.1 16.2 13.1 14.0
Table 10. Range of temperatures for living rooms in domestic laundering study, Glasgow
In general, the values in Table 9 are concerning. For example, the mean maximum in winter of 3,844 ppm is 20% greater than the absolute maximum of the 19th C Scottish survey for single-room dwellings of 3,210 ppm, the smaller figure at a time when overcrowding and fetid air was a major health concern. Given some of the high CO2 and RH values, one might reasonably anticipate problems with condensation and mould growth. However, although the colony forming units (CFUs) vary considerably there is no strong seasonal effect – see Table 11 below. Nor is there any consistency when taking individual cases and comparing the CFU value with CO2, vapour pressure and presence of mould itself – see Table 12 below – although a breakdown of mould types might be relevant here. Nevertheless, the CFU level is generally of some concern. Vivienne Ryan of Belfast City Council has usefully categorized approximate low, moderate and high levels, respectively <500, from 500-1,300 and from 1,300-5,000+ (Ryan, 2002). In the 22 case studies where CFU/m3 values were obtained from air samples, none were in the ‘low’ category as defined above; 19 were in the ‘moderate’ range, but with 4 of these close to the upper limit; and 3 were in the ‘high’ range. Also some cases of the ‘moderate’ category that are not listed in Table 12 above had mould reported – see Table 13 below. More detailed analysis of mould types and sampling dates is ongoing.
www.intechopen.com
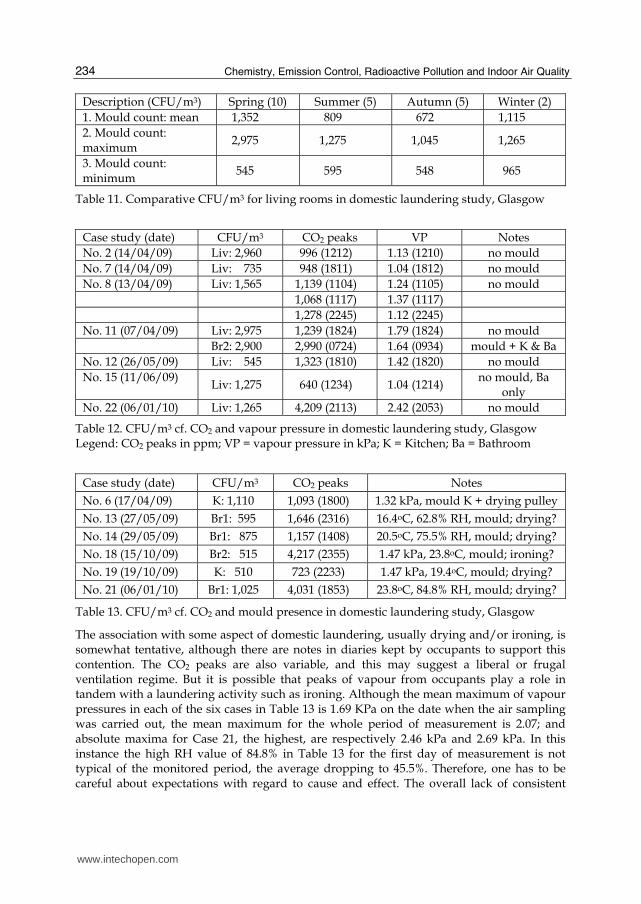
Chemistry, Emission Control, Radioactive Pollution and Indoor Air Quality
234
Description (CFU/m3) Spring (10) Summer (5) Autumn (5) Winter (2)
1. Mould count: mean 1,352 809 672 1,115
2. Mould count: maximum
2,975 1,275 1,045 1,265
3. Mould count: minimum
545 595 548 965
Table 11. Comparative CFU/m3 for living rooms in domestic laundering study, Glasgow
Case study (date) CFU/m3 CO2 peaks VP Notes
No. 2 (14/04/09) Liv: 2,960 996 (1212) 1.13 (1210) no mould
No. 7 (14/04/09) Liv: 735 948 (1811) 1.04 (1812) no mould
No. 8 (13/04/09) Liv: 1,565 1,139 (1104) 1.24 (1105) no mould
1,068 (1117) 1.37 (1117)
1,278 (2245) 1.12 (2245)
No. 11 (07/04/09) Liv: 2,975 1,239 (1824) 1.79 (1824) no mould
Br2: 2,900 2,990 (0724) 1.64 (0934) mould + K & Ba
No. 12 (26/05/09) Liv: 545 1,323 (1810) 1.42 (1820) no mould
No. 15 (11/06/09) Liv: 1,275 640 (1234) 1.04 (1214)
no mould, Ba only
No. 22 (06/01/10) Liv: 1,265 4,209 (2113) 2.42 (2053) no mould
Table 12. CFU/m3 cf. CO2 and vapour pressure in domestic laundering study, Glasgow Legend: CO2 peaks in ppm; VP = vapour pressure in kPa; K = Kitchen; Ba = Bathroom
Case study (date) CFU/m3 CO2 peaks Notes
No. 6 (17/04/09) K: 1,110 1,093 (1800) 1.32 kPa, mould K + drying pulley
No. 13 (27/05/09) Br1: 595 1,646 (2316) 16.4oC, 62.8% RH, mould; drying?
No. 14 (29/05/09) Br1: 875 1,157 (1408) 20.5oC, 75.5% RH, mould; drying?
No. 18 (15/10/09) Br2: 515 4,217 (2355) 1.47 kPa, 23.8oC, mould; ironing?
No. 19 (19/10/09) K: 510 723 (2233) 1.47 kPa, 19.4oC, mould; drying?
No. 21 (06/01/10) Br1: 1,025 4,031 (1853) 23.8oC, 84.8% RH, mould; drying?
Table 13. CFU/m3 cf. CO2 and mould presence in domestic laundering study, Glasgow
The association with some aspect of domestic laundering, usually drying and/or ironing, is somewhat tentative, although there are notes in diaries kept by occupants to support this contention. The CO2 peaks are also variable, and this may suggest a liberal or frugal ventilation regime. But it is possible that peaks of vapour from occupants play a role in tandem with a laundering activity such as ironing. Although the mean maximum of vapour pressures in each of the six cases in Table 13 is 1.69 KPa on the date when the air sampling was carried out, the mean maximum for the whole period of measurement is 2.07; and absolute maxima for Case 21, the highest, are respectively 2.46 kPa and 2.69 kPa. In this instance the high RH value of 84.8% in Table 13 for the first day of measurement is not typical of the monitored period, the average dropping to 45.5%. Therefore, one has to be careful about expectations with regard to cause and effect. The overall lack of consistent
www.intechopen.com

Sensing a Historic Low-CO2 Future
235
association between mould indicators (CFUs), presence of mould, and CO2 or humidity is in accord with the findings of the Scottish survey of the 1880s. In any case, given that mould was a relatively frequent occurrence, the guideline of keeping RH below 70%, which corresponds approximately with 1.4 kPa at 20oC air temperature and dew point of 12oC, is generally accepted as ‘good practice’. In summary, the above findings suggest a case both for better control of ventilation, and for improved drying facilities for domestic laundering. In the first regard, MHRV will undoubtedly have a role to play. However, there is presently an attitude of undue complacence in the ability of MHRV to resolve all conditions of ventilation control satisfactorily. For example, automated changes in volume flow rate switched by moisture level and CO2 should become the norm in domestic systems. Also filters should always be readily accessible, materiality of ducts should receive greater consideration, and thermal insulation of ducts, as well as sound reduction through ducts, should be more effective. Since even a low background noise at the lowest flow rate can be disturbing in a bedroom, consideration could be given for a facility to isolate parts of a system manually. Bedrooms should not require to be heated overnight in a well-insulated envelope, so that open windows rather than MHRV overnight should be feasible without compromising energy efficiency. With regard to dedicated drying facilities, both passive and active solar systems have been shown to be capable of playing a part (Porteous & Menon, 2010). However, it seems a dubious tactic to employ photovoltaic (PV) arrays to displace thermal energy for tumble dryers. For example, small-scale renewable combined heat and power (RCHP), with waste heat from electrical generation used directly for communal dryers could be more effective; and solar upgrading of passive drying facilities should be economically viable.
4. The holstic value of indoor sunlight and light today for air quality
Another issue relating solar energy to air quality is the perceived conflation of ‘light and airy’, already mentioned. The theorists Colin Rowe and Robert Slutzky claim that dictionaries define ‘transparent’ as “a material condition – pervious to light and air” (Rowe & Slutzky, 1963). Notwithstanding whether this assertion is wishful relative to the pedantry of dictionaries, a fenestrated façade that is ‘pervious to light and air’ seems a perfectly reasonable literal proposition, since, even in the case of a sealed curtain wall, there will be some air leakage. Another theorist, David Leatherbarrow talks about ‘translucency’ and ‘transparency’ as ‘indicative terms’ in relation to Rudolph Schindler’s work: “His usage invoked the customary sense of the words, meaning optical or visual conditions, the state of some material being impervious to or penetrable by light or air, …” (Leatherbarrow, 2009). Again, one might relate such a claim to fenestration but not simply to transparency or a transparent material. It has also been stated above that the psychology of ‘prospect-refuge’ theory sits well the physics of sunlight’s bacteria-killing power through glazing and that indoor planting further enhances air quality. All this goes together with surveys carried out several decades ago to establish the popularity and social need for sunlight opportunity indoors. A 1965 survey in the Netherlands (Bitter & van Ierland, 1965) found sunshine indoors valued over view, especially in living rooms where afternoon sunlight was preferred to that of morning for bedrooms; and the combined effect of “the warmth, the light and the atmosphere” synergistically valued significantly more than the sum of these individual factors. A UK housing study (Markus & Gray, 1973), concerning “the psychological
www.intechopen.com
Chemistry, Emission Control, Radioactive Pollution and Indoor Air Quality
236
significance of sunshine, daylight, view and visual privacy”, employed semantic scales as psychological measures. These explored reactions to outlook from windows relative to sunshine, rather than reactions to sunlight within rooms. Another in Zurich (Gilgen & Barrier, 1976), found that enough sunlight ranked as important as plenty of space indoors, and sunlight is desired in children’s rooms as much as living rooms. Also perception of sunniness and measured sunniness closely matched. In the same year a UK social survey (Ne’eman et al., 1976) found the visual experience of sunshine to be beneficial in terms of psychological well-being, enhanced colours of interior surfaces and contact with the exterior; while thermal benefit is most noticeable in absence of adequate heating, whether perceived or actual. In the 35 years since that work, psychological metrics have become more sophisticated, while housing providers have arguably become less concerned with the social impact of access to sunshine. However, a social survey by Robert Day and Chris Creed in the 1990s, which analyzed responses to seven questions, made a case for further research to establish: “a sunlight index, using an appropriate reference quantity to calibrate a scale of subjective benefit/loss” (Day & Creed, 1996). Thereafter, Fung’s study in Glasgow, cited above, indicated an association between the size of windows to living rooms and positive affectivity or mood (Fung, 2008c). This tentative finding makes a case for further work by environmental architects in collaboration with health or environmental psychologists and microbiologists; this to test the hypothesis that ‘sunny and airy’ dwellings can be energy-efficient and also enhance mental and physical health. Moreover the strand focused on psychological well-being could be supported by clinical analysis of bio-markers; while microbiological analysis concerning mould, bacteria and other organisms or particles, could be augmented by further chemical research relating materials to pollutants. Such composite investigations would also help to resolve differences of attitude within the community advocating adoption of the PassivHaus standard (applicable to domestic and non-domestic sectors); on the one hand Minergie-P in Switzerland aligning with PassivHaus (Mennel et al. 2007), while explicitly using passive solar techniques, and on the other hand a view that orientation is irrelevant and window sizes should be curtailed. This then provides a strategic aim for a future whereby housing, workplaces and other
buildings enjoy improved air quality, considered within a holistic spectrum of indicators,
and securely based on precedent from the near and more distant past. For non-domestic
buildings the 19th C provided a template for what we now call ‘mixed mode’ ventilation. An
early modern building that took this forward for commerce was Frank Lloyd Wright’s
Larkin Building (Porteous, 2002c). Although built shortly after Glasgow’s Kelvingrove
Museum and Art Gallery, Wright used the technology to promote a paradigm for the
workplace where an atrium, a conservatory and the space between its horizontal laylight
and pitched glass roof, play an essential role in terms of ventilation cycle along with a
system of ducts integrated in structural walls, columns and beams. Interpretations or
applications of the Larkin prototype began to appear in the late part of the 20th C, for
example, architect Mick Pearce’s Eastgate Centre in Harare, 1993-96 (Baird, 2001). Moving
into the 21st C, Mick Pearce uses very much the same method, but without the atrium, in a
tighter urban context in Melbourne – a corner block, with nine floors of offices above a
double-height floor of retail units, with servicing below (Slessor, 2007). There are other good
illustrations of mixed-mode ventilation in educational and cultural buildings, where plan
and section revolve round a sunlit atrium, such as Gunter Behnisch and Partner’s Deutsches
Postmuseum in Frankfurt, 1984-1990, and BDP’s Saltire Centre at Glasgow Caledonian
www.intechopen.com
Sensing a Historic Low-CO2 Future
237
University, 2004-06 (Porteous, 2008). There are also projects where major spaces are
naturally lit and ventilated with minimal active back up, for example ‘The Bridge’, a new
arts centre and library in Glasgow completed in 2006 by Gareth Hoskins Architects
(Porteous, 2008).
Chris Twinn of Arup helps to bring this technology up to date with recent exemplars, where the emphasis is on natural ventilation, but there is active assistance available for extreme conditions (Twinn, 2011). He cites Paignton Library by Kensington Taylor, 2007-09, where the air supply is via acoustically attenuated damper boxes located close to floor level, and Lauriston Primary School in Hackney by Meadowcroft Griffin, completed 2009, which uses similar devices below windows. In each of these buildings high-level exhaust can be augmented actively using motorised dampers and fans. Twinn also illustrates the Robert Burns Birthplace Museum by Simpson & Brown Architects, completed 2010. In this case a ground source heat pump tempers the air supply, mixing fresh air entering via and underground labyrinth with recirculated air from the gallery, before it is exhausted at high level via controllable louvres. Twinn highlight areas or continuing research interest as “heat recovery with natural ventilation” (HRNV) and a “better understanding of how single-sided ventilation (SSV) works under fluctuating wind pressures through a single window.” In the case of HRNV, another interesting technology that merges air with light is that of ‘air supply’ windows. For example, these have been used passively in the Orchard Building, completed 2006 at the Mater Hospital in Dublin, Ireland, as described by Jay Stuart, the sustainable building consultant (Stuart, 2006). In order to recover heat lost through the inner layer of glazing and to control the air supply passively, ‘Dwell-Vent’ pressure-sensitive trickle vents were used. An example of SSV, Christ’s College Secondary School in Guildford, UK, 2007-09 by architects DSDHA, uses MHRV units below wide internal sill-boards. The fresh air supply enters through a narrow perforated plate directly below external preformed metal sills, while the exhaust is via widened butt joints in the brickwork below sill level (Anon., 2010; McGuirk, 2010). Twinn’s article does reveal cause for some concern relating to ventilation standards for schools. Building Bulletin 101 (Department for Education and Skills, 2006) only requires “the capability of achieving a minimum of 8l/s per person at any one time.” It accepts “a minimum daily average of 5 l/s per person” and “a minimum of 3 l/s per person”. These last two lower standards of supply compared with the 8 l/s or 1,000 ppm Pettenkofer upper limit perhaps recognize the lower CO2 expiration rate from younger children. If we assume a mean male/female adult rate of respiration of CO2 of 0.0185 l/s, and the outdoor air averages 360 ppm, the above values correspond respectively with 1,000, 1,399 and 2,073 ppm (i.e. 640, 1,028 and 1,713 ppm added inside). However, if we assume an average expiration rate of 0.012 l/s per young child, the respective values drop significantly to 777, 1,077, and 1,110 ppm. Even so, the standard allows the maximum concentration during the teaching day to reach 5,000 ppm. If this were calculated on the basis of an entire population of young children, it would imply a meagre supply of fresh air considerably under the 3 l/s minimum – some 0.72 l/s per child. In other words, Building Bulletin 101 expresses a minimum supply in l/s that appears to be at odds with the maximum CO2 concentration. The other concern at low rates of ventilation is that the ‘bad company’ of CO2, such as pollutants from internal finishes or from the ambient air, will become increasingly significant, as will the concentration of bacteria. A 2008 report on primary schools led by Karl Wall cites the earlier Building Bulletin 87, 2003b:16 (Wall et al., 2008), which describes “acceptable” CO2 rates as 1,000 ppm or 8 l/s per
www.intechopen.com

Chemistry, Emission Control, Radioactive Pollution and Indoor Air Quality
238
person. In other words it is using the adult equivalence in terms of CO2 respiration, and here the value signifies acceptability, not attainability. This 2008 report also cites a paper by Coley and Greaves: “Elevated carbon dioxide levels, above 2,000 ppm, were found to be associated with impaired cognitive function expressed in measures of task attention” (Coley & Greaves, 2004, as cited in Wall et al., 2008:12). The Wall-led report itself also alludes to the synergy of light and air, specifically in terms of sunlight by citing the 1931 Hadow Report, which advocated “plenty of sunlight with fresh air” (Wall et al., 2008:2). However its own findings, while only stressing the pejorative aspect of “thermal discomfort linked to sunlight entering un-shaded windows” (Wall et al., 2008:15), does recognize the psychological importance of the internal environment of schools: “Whether physiological or psychological, a person’s health or productivity may be affected.” (Wall et al., 2008:19). Building Bulletin 90 (Department for Education and Employment, 1999) tackles ‘lighting’ in terms of daylight displacing artificial light. It defines Uniform Ratio (UR) as the ratio of minimum to average Daylight Factors (DF). It recommends a UR of 0.3-0.4 in side-lit spaces and 0.7 in top-lit spaces. Notwithstanding the large body of published research into passive solar gain, which can displace CO2 emissions from heating (an assumed given for this chapter), sunlight in Building Bulletin 90 is only mentioned in terms of adequate shading control. There is indeed a paucity of research into the composite value of sunlight in schools, although E. Ne’eman carried out work on sunlight and thermal comfort in non-specific buildings in the 1970s (Ne’eman, 1977). For the workplace, where solar overheating is often a concern, research led by Mohamed Boubekri found in 1991 that a 25-40% ratio of sunlight patch to floor area was optimal for a feeling of excitement and cheerfulness (Boubekri et al., 1991, cited in Boubekri, 2008). However, although there is some evidence that non-daylit classrooms affect concentration negatively due to disturbance of pattern of stress hormone (Kuller & Lindsten, 1992), evidence of the positive effects of sunlight is harder to find.
5. Conclusion
Such varying standards therefore epitomise the environmental dilemma of today. On the one hand, they are aimed at maintaining minimum, rather than optimum, levels for health. On the other hand, they are aimed at maximising energy efficiency. CO2 is the common denominator critical to both, coming into play via the different, but related, media of respiration and combustion. The psychological twinning of light and air clearly affects both aspects of CO2 as well as having physical and mental impacts on the occupants of buildings. However, research projects undertaken by environmental architects in partnership with psychologists and other specialists in medicine (e.g. apropos well-being biomarkers) and science (e.g. microbiological analysis) remain scarce. The above review serves to strengthen the case for an upgrade of regulations pertaining to air quality, which would require both consistent design standards and a new model for post occupancy evaluation (POE) or building performance evaluation (BPE). The issue of ownership of environmental control relative to building type would be central to this model. In some public buildings the user does not wish to be concerned with such matters. There is simply an expectation to enjoy the interior of the building for what it offers, be it gallery, museum, concert hall, theatre, velodrome and so on. But in other buildings, the issue of personal control becomes critical, and has significant economic impact – for example, a range from lack of vitality within, to absenteeism from, the workplace. It was superior control that gave the mechanically ventilated schools in Scotland
www.intechopen.com
Sensing a Historic Low-CO2 Future
239
of the 1880s better air quality than the naturally ventilated ones; in this case almost certainly with considerable manual caretaking involved by a member of servicing staff. Similarly, it is control that makes natural ventilation feasible in the recent buildings cited by Twinn above, this time with ‘smart’ electronic operation of vents as well as automated mechanical backup when conditions require it. Thus the apparent paradox between 21st C paradigms for good air quality predicated on natural ventilation, as opposed to 19th C models based on mechanical ventilation is not really so. The presentational ‘spin’ may suggest a paradox, but the reality is that both are reliant on a combination of automated and manual control. The challenge is to get this balance right, as at the Marché headquarters building near Zurich, where CO2 sensors play a part on a hot summer’s day alongside workers opening windows for a short period in the morning. Similarly there are opportunities for entirely passive, pressure-sensitive trickle vents as one means of control for ingress of fresh air, while electronically-switched valves are another. Getting this balance right is key to resolving the apparent tension between energy efficiency and air quality. It is also the nub of the case for holistic, adaptive and perception-oriented evaluation of air quality, and one that embraces the synergetic sensory roles of light, prospect and spatial atmosphere.
6. Acknowledgment
I would like to acknowledge the valuable support I have received from David Buri, the Architectural Librarian at The Glasgow School of Art. I would also like to thank my long-time and long-suffering partner, Mary Patrick, for coming to my aid with regard to typesetting and scanning.
7. References
Aalto, A. (trans S. Wrede) (1979a). The Influence of Construction and Materials on Modern
Architecture (1938), In: Sketches, Alvar Aalto, ed. G Schildt, pp. 60-63, MIT Press,
ISBN 0-262-01053-4, Cambridge, USA.
Aalto, A. (1979b). Between Humanism and Materialism (1955), op. cit., pp. 130-133.
Akrill, T. B., Bennet, G. A. G. & Millar, C. J. (1979). Ch 10 Thermometers and the Ideal Gas,
In: Physics, p. 130, Edward Arnold, ISBN 0-7131-0297-7, London, UK.
Andersson, B., Andersson, K., Nillson, C-A, Sandstrom, M., Stjerrnberg, M. & Sundell, J.
(1996). Chemical Reactions in Ventilation Ducts, Proceedings of Indoor Air ’96,
Copenhagen, Vol.3, pp. 947-952.
Anon. (1904). 2 Art Galleries and Museums, In: Municipal Enterprises – Glasgow, pp. 15-18,
Souvenir Handbook of Glasgow issued by The Corporation on the occasion of The
Twenty-Second Congress of The Sanitary Institute, Glasgow, 25-30 July 1904.
Anon. (2006). Technical Fact Sheet 6, Ventilation & Airtightness, Hockerton Housing Project
Trading Ltd., Hockerton, Southwell, Notts, UK, NG25 0QU.
Anon. (2009) Marché International Support Office, Zero-Energy Architecture in Switzerland,
Detail Green, May 2009, p 36, ISSN 1868-3843
Anon. (2010). College in Guildford, Detail, Review of Architecture, Vol.5, Facades, pp. 480-485.
Appleby, P. (1990). Ch C1 Indoor Air Quality and Ventilation Requirements, In: Buildings
and Health, The Rosehaugh Guide To the Design, Construction, Use and Management of
www.intechopen.com

Chemistry, Emission Control, Radioactive Pollution and Indoor Air Quality
240
Buildings, S Curwell, C March and R Venables, pp. 176-177, RIBA Publications,
ISBN 0 947877 78 9, London, UK.
Appleton, J. (1996). Ch 3 Behaviour and Environment. In: The Experience of Landscape, revised
edition, pp 66, 250-254, John Wiley & Sons Ltd, ISBN 0-471-96233-3 (hbk), 0-471-
96236-X (pbk) Chichester, UK.
Baird, G. (2001). Ch 13 Eastgate Centre, Harare, Zimbabwe, In: The Architectural Expression of
Environmental Control Systems, pp. 164-180, Spon Press, ISBN 0-419-24430-1, London
and New York.
Baker, N. & Standeven, M. (1994). Comfort criteria for passively cooled buildings: A
PASCOOL task, Renewable Energy, Vol.5, No.5, pp 977-984.
Balashikov, Z. D. & Melikov, A. K. (2009). Methods for air cleaning and protection of
building occupants from airborne pathogens, Building and Environment, Vol.44, pp.
1378-1385.
Beck, E-G. (2007). 180 Years of Atmospheric CO2 Gas Analysis by Chemical Methods, In:
Energy & Environment, Vol.18, No.2, pp. 259, 263 in 259-282.
Bernan, W. (1845). Essay XVII, In: On the History & Art of Warming & Ventilation, Vol II, pp
313-335 (p 319), George Bell, Fleet St., London, UK.
Billings, J. S. (1889). Ch 1, Introductory – Expense of Ventilation–Difference between
“Perfect” and Ordinary Ventilation – Relations of Carbonic Acid to the Subject –
Methods of Testing Ventilation, In The Principles of Ventilation and Heating and their
Practical Application, 2nd Ed., pp 13-26 (pp 20-21), The Engineering & Building
Record, New York, USA.
Billington, N. S (1982). Energy Efficient Domestic Ventilation Systems for Achieving
Acceptable Indoor Air Quality, Proceedings of 3rd AIC Conference, London, UK,
September 20-23, 1982.
Bitter, C. & van Ierland, F. F. A. A. (1965). Appreciation of sunlight in the home, Proceedings
of CIE Conference Sunlight in Buildings, Newcastle, 1965; Bouwcentrum International,
Rotterdam, 1967, pp 27-38.
Bloomer, K. C. & Moore, C. W. (1977). Ch 4 Some Twentieth-Century Models of Sense
Perception, In: Body, Memory, and Architecture, p. 33, Yale University Press, ISBN 0-
300-0231-9, New Haven and London.
Boardman, B. (1991). Ch 2 Emergence of Fuel Poverty, In: Fuel Poverty, from cold homes to
affordable warmth, p. 19, Belhaven Press, ISBN 1-85293-139-6, London and New
York.
Bomberg, M. (1989). Testing Water Vapor Transmission: Unresolved issues. National
Research Council Canada, Institute for Research in Construction, NRCC 3091; reprinted
from: Water Vapor Transmission Through Building Materials and Systems:
Mechanisms and Measurement, American Society for Testing and Materials, Standard
Technical Publication, 1039, pp 157-167 (IRC Paper No. 1615).
Boring, E. G. (1942a). Ch 12 Smell and Taste, In: Sensation and Perception in the History of
Experimental Psychology, pp. 437-462, Appleton-Century-Crofts Inc., 660-6, New
York, USA.
Boring, E. G. (1942b). Ch 13 Tactual Sensibility, op. cit., p. 487.
Boring, E. G. (1942c). Ch 1 Sensation and Perception, op. cit., p. 35.
www.intechopen.com

Sensing a Historic Low-CO2 Future
241
Boring, E. G. (1942d). Ch 14 Organic Sensibility, op. cit., p 525, 534.
Boubekri, M. (2008). Ch 5 Psychology of Lighting, In: Daylighting, Architecture and Health:
Building Design Strategies, p. 94, Architectural Press, ISBN 978-0-7506-6724-1,
Oxford, UK.
Brown, R. (2006). Ch 14 Thermal Properties, In: Physical Testing of Rubber, 4th Ed., p. 279,
Springer, ISBN 10 0-387-28286-6, New York, USA.
Brundage, J. F., Scott, R. McN., Lednar, W. M., Smith, D. W. & Miller, R. N. (1988). Building-
Associated Risk of Febrile Acute Respiratory Diseases in Army Trainees, Journal of
the American Medical Association, April 8, Vol.259, No.14, pp 2108-2112.
Buchbinder, L., Soloway, M. & Phelps, E. B., (1941). Studies on microorganisms in simulated
room environments III: The survival rates of streptococci in the presence of natural
daylight, sunlight and artificial illumination, Journal of Bacteriology, Vol.42, No.3, pp
353-366.
Carnelley, T., Haldane, J. S. & Anderson, A. M. (1887). IV The Carbonic Acid, Organic
Matter, and Micro-organisms in Air, more especially of Dwellings and Schools,
Philosophical Transactions of the Royal Society, Series B, 178, pp. 71-72 in 61-111.
Close, P. D. (1930). Preventing Condensation on Internal Building Surfaces, ASH & VE
Transactions Vol.36, No.854, New York, USA.
Close, P. D. (1947). Transmission Coefficients and Tables, In: Building Insulation, 3rd Ed., p.
117, American Technical Society, Chicago, USA.
Day, R & Creed, C. (1996). Sunlight in Dwellings: Validation of Insolation criteria, Lighting
Research Technology, Vol.28, No.1, pp.43-51.
Department for Education and Skills (2006). Building Bulletin 101: Ventilation of School
Buildings, Version 1.4, 5th July 2006, p. 6.
Dixon, F. E. (1969). Some Irish Meteorologists, Irish Astronomical Journal, Vol.9, No.4, Irish
Astronomical Society, Armagh, Northern Ireland, pp 116-117.
Downes, A. & Blunt, T. P. (1877). Researches on the effect of light upon bacteria and other
organisms, Proceedings of the Royal Society, Vol.26, pp. 488-500.
Evans A. S. (1973). Pettenkofer Revisited, The Life and Contributions of Max von
Pettenkofer (1818-1901), Yale Journal of Biology and Medicine Vol.46, pp 167 in 161-
176.
Fanger, P. O. (1970). Thermal Comfort, Danish Technical Press, Copenhagen (Doctoral
dissertation reprinted several times, inter alia McGraw Hill Book Company, New
York).
Fanger, P. O. (1988). Introduction of the olf and the decipol Units to Quantify Air Pollution
Perceived by Humans Indoors and Outdoors, Energy and Buildings, Vol. 12, pp 1-6.
Fitch J. M. (1972). American Building, The Environmental Forces that Shape It, Houghton Mifflin
Co., Boston, Mass., ISBN 0-39512667-3, USA.
Fletcher, B. F. & Fletcher H. P. (1907). Ch XIII Ventilation, In: Architectural Hygiene, 3 Ed.
Rev., pp. 144 in 137-158, Whittaker & Co., London.
Fourier, J. (1822). Théorie Analytique de la Chaleur, Firmin Didot Pere et Fils, Paris.
François de Chaumont, F. S. B. (1876). Supplementary Note on the Theory of Ventilation,
Proceedings of The Royal Society, May 4, 1876, Vol XXV, pp 1-4.
www.intechopen.com

Chemistry, Emission Control, Radioactive Pollution and Indoor Air Quality
242
Fung, J. W. (2008a). Ch 3 Methodology, In: The Unintended Consequences of Decision-making in
Glasgow’s Social Housing Sector, PhD Thesis, pp. (3)-6-(3)-8, Mackintosh School of
Architecture, The Glasgow School of Art, University of Glasgow, UK.
Fung, J. W. (2008b). Ch 6 Decisions, Consequences and/or Conditions and Correlations, op.
cit., pp. (6)-34 and (6)-82.
Fung, J. W. (2008c). Ch 7 Discussion of UNCs with Further Comparisons between Case
Studies, op. cit., p (7)-20.
Gardner, B. (undated) Robert Koch, In: Science and Technology, Famous People of Science,
http://web.ukonline.co.uk/b.gardner/Koch/htm.
Gibson, J. J. (1966). Ch II The Obtaining of Stimulation, In: The Senses Considered as Perceptual
Systems, pp. 32 in 31-46, Houghton Mifflin, ISBN 0-313-23961-4, Boston, USA
(Reprinted 1983, Greenwood Press, Westport, Connecticut, USA).
Giese, M., Bauer-Doranth, U., Langebartels, C. & Sandermann, H. (1994). Detoxification of
Formaldehyde by the Spider Plant, Plant Physiology, Vol.104, pp 1301-1309.
Gifford, R. (2002). Ch 1 The Nature and Scope of Environmental Psychology, In:
Environmental Psychology, Principles and Practice, 3rd ed., pp. 1-19, Optimal Books,
ISBN 0-9688543-0-3, Colville, Washington, USA.
Gilfillan, J. B. S. (1958). Ch 1 The Site and its Development, In: The Third Statistical Account of
Glasgow, pp. 30 in 17-47, William Collins and Sons C. Ltd., Glasgow, UK.
Gilgen, A. & Barrier A (1976). Part 4 Sunlight and natural lighting indoors, In: Environmental
factors in urban planning, Grandjean, E. & Gilgen, A., pp 155-198, Taylor & Francis,
ISBN 0 85066 084 X, London.
Ginkel, J. T. V. & Hasselaar, E. (2005). Housing characteristics predicting mould growth in
bathrooms, Proceedings of Indoor Air 2005, 10th International Conference on Indoor
Air, Sep. 4-9, Beijing, China, pp. 2425-2429.
Girman, J. R, Apte, M. G, Traynor, G.W. Allen, J. R. & Hollowell, C. D. (1982), Pollutant
Emission rates from Indoor Combustion Appliances and Sidestream Cigarette
Smoke, Environment International, Vol.8, pp. 213-221.
Haldane, J. S. (1901). The Work of Max von Pettenkofer, Journal of Hygiene, Vol.1, No.3, pp
293 in 289-294.
Hesselgren, S. (1975) Man’s Perception of Man-made Environment, Dowden, Hutchison & Ross
Inc, Stroudsburg, Pennsylvania, USA. (Note previous English translation of 1954
PhD thesis: 1967, ‘The Language of Architecture’, Studentlitteratur, Lund, Sweden.)
Hildebrand, G. (1991). Ch 6 Fallingwater, In: The Wright Space: Pattern and Meaning in Frank
Lloyd Wright’s Houses, pp. 104 in 93-105, University of Washington Press, ISBN 0-
295-97108-8, Seattle, USA.
Ho, H. M. (1995). User-Performance Sensitivity of Small Sunspaces in a Scottish Housing Context,
PhD Thesis, October 1995, Mackintosh School of Architecture, Glasgow, UK.
Institute of Medicine (2000). Executive Summary and Ch 5 Indoor Biologic Exposures, In:
Clearing the Air, Asthma and Indoor Exposures, pp. 5 in 1-18 & 144, 173 in 105-222,
National Academic Press, ISBN 0-309-06496-1, Washington, DC, USA.
International Textbook Co. (1909). Heating and Ventilation, In: ICS International Reference
Library, pp 28-29, International Correspondence Schools Ltd., London, UK.
www.intechopen.com

Sensing a Historic Low-CO2 Future
243
Keating, M. (1988). Ch 7 Jobs and Industry, In: The City that Refused to Die, Glasgow: the
politics of urban regeneration, pp. 171 in 168-192, Aberdeen University Press, ISBN 0
08 034612-8, Aberdeen, UK.
Kuller R. & Lindsten C. (1992). Health and behaviour of children in classrooms with and
without windows, Journal of Environmental Psychology, Vol.12, pp. 305-317.
Lawrence, M. G. (2005). The Relationship between Relative Humidity and the Dewpoint
Temperature in Moist Air, American Meteorological Society, Feb. 2005, pp 225-232.
Leatherbarrow, D. (2009). Ch 6 Sitting in the City, In: Architecture Oriented Otherwise, pp. 164
in 143-173, Princeton Architectural Press, ISBN 978-1-56898-811-5, New York, USA.
Liddell, H., Gilbert, J. & Halliday, S. (2008). Design and Detailing for Toxic Chemical Reduction
in Buildings, SEDA Design Guides for Scotland: No. 3.
Locher, W. G. (2007). Max von Pettenkofer (1818-1901) as a Pioneer of Modern Hygiene and
Preventive Medicine, Environmental Health and Preventive Medicine, Vol.12, pp 238-
245.
Lohr, V. I. & Pearson-Mims, C. H. (1996). Particulate Matter Accumulation on Horizontal
Surfaces in Interiors: Influence of Foliage Plants, Atmospheric Environment, Vol.30,
pp 2565-2568.
Lohr, V. I., Pearson-Mims, C. & Goodwin, G. (1996). Interior Plants May Improve Worker
Productivity and Reduce Stress in a Windowless Environment, Journal of
Environmental Horticulture, Vol.14, pp 97-100.
Markus T. A. & Gray A. (1973). Windows in low rise, high density housing – the
psychological significance of sunshine, daylight, view and visual privacy,
Proceedings of Windows and their Functions in Architectural Design, Technical
University, Istanbul 22-27/10/73, pp. 1.1-1.32.
McGuirk, T. (2010). Christ’s College, Guildford, The Architects’ Journal, Vol.232, No.12, pp.
46-52.
Mennel, S., Menti, U-P. & Notter, G. (2007). Minergie-P® – a building standard for the future,
Proceedings of Clima 2007 WellBeing Indoors, 10-14th June, Helsinki, Finland.
Ne’eman, E., Craddock, J. & Hopkinson R. G. (1976). Sunlight requirements in buildings: 1
Social survey, Building and Environment, Vol.11, pp. 217-238.
Ne’eman, E. (1977). Sunlight Requirements in Buildings – II. Visits of an Assessment Team
and Experiments in a Controlled Room, Buildings & Environment, Vol.12, pp. 147-
152.
Nicholls, P. (1924). A Heat Transmission Meter, Industrial & Engineering Chemistry, Vol.16,
No.5, pp. 490-493.
Olgyay, V. (1963). Ch II The Bioclimatic Approach, In: Design with Climate, a bioclimatic
approach to architectural regionalism, pp. 20 in 14-23, ISBN 0-442-01110-5, Princeton
University Press, New Jersey, USA.
Osgood C. E., Suci, G. J. & Tannenbaum, P. H. (1957). Ch 3 The Semantic Differential as a
Measuring Instrument, In: The Measurement of Meaning, pp. 76-124, University of
Illinois Press, ISBN 0-252-74539-6, Urbana and Chicago, USA.
Overy, P. (2007). Light, Air and Openness, Modern Architecture Between the Wars, Thames &
Hudson, ISBN 978-0-500-34242-8, London, UK.
www.intechopen.com

Chemistry, Emission Control, Radioactive Pollution and Indoor Air Quality
244
Parkes, E. A. (1878). Ch 3 Ventilation, In: A Manual of Practical Hygiene, 5th Edition (edited F.
S. B. Francois de Chaumont), pp. 140-147, J & H Churchill, London, UK.
Pasanen, P., Pasanen, A-L. & Jantunen, M. (1993). Water Condensation promotes Fungal
Growth in Ventilation Ducts, Indoor Air, 1993, Vol.3, pp 106-113.
Philibert, J. (2006). Adolf Fick and Diffusion Equations, Defect and Diffusion Forum, Vol.249
(Diffusion in Solids – Past, Present and Future), pp. 1-6.
Platts-Mills, T. A. E. & De Weck, A. L. (1989). Dust mite allergens and asthma – A
worldwide problem, Journal of Allergy & Clinical Immunology, Vol.83, pp. 422 in 416-
427.
Port, M. H. (1976). Ch XI The Building Services, In: The Houses of Parliament, pp. 218-231,
Yale University Press, ISBN 0-300-02022-8, New Haven and London.
Porteous, C. (1996). Airing energy efficiency: home truths, alt’ing, The Scottish Journal of
Architectural Research, The Rutland Press, ISSN 1363-075x, Vol.1, No.1, pp. 17 in 17-28.
Porteous, C. D. A. & Ho, H. M. (1997). Do sunspaces work in Scotland? Lessons learnt from
a CEC solar energy demonstration project in Glasgow, The International Journal of
Ambient Energy, Vol.18, No.1, January 1997, pp. 23-35, ISSN 0143-0750.
Porteous, C. (2002a). Ch 2 Protagonists – aesthetic and tectonic attitude, Ch 3 Condensation
factor, In: The New eco-Architecture, alternatives from the modern movement, pp. 9-10,
29-30, Spon Press, ISBN 0-415-25624-0, London and New York.
Porteous, C. (2002b). op. cit. Ch 7 Eco-footprint, Ch 11 Spirit of the Age, pp. 102, 177-178.
Porteous, C. (2002c). op. cit. Ch 7 Eco-footprint, pp 100-101.
Porteous C. & MacGregor K. (2005). Ch 4 Adaptive Control, In: Solar Architecture in Cool
Climates, pp. 81-126, Earthscan, ISBN-10: 1-84407-281-9, London, UK.
Porteous, C. (2008). Shaping light and air, Engineering & Technology, Vol.3, Issue 9, pp. 52-55.
Porteous, C. (2010). Passive solar PassivHaus paradigm for Scotland in zero-carbon quest?
Lessons from a study tour in Switzerland and Germany, August 2009, Innovation
Review (CIC Start Online), Issue 2, March 2010, pp 32-46.
Porteous, C. D. A. & Menon R. A. (2010). Displacing electrical energy for drying domestic
laundry by practical solar upgrades – proposed Glasgow housing case studies,
Proceedings Eurosun 2010 International Conference on Solar Heating, Cooling and
Buildings, Topic 1, 28 Sep – 1 Oct, Graz, Austria, 6 pages.
Qin, M., Belarbi, R., Ait-Mokhtar, A. & Nilsson, L-O. (2008). Nonisothermal moisture
transport in hygroscopic building materials: modelling for the determination of
moisture transport coefficients, Transport in Porous Media, March 72, No.2, pp 255-
271.
Reid, D. B. (1844). CH IX On Vitiated Air, Pt IV: Ventilation of the Present Houses of
Parliament, In: Illustrations on the Theory and Practice of Ventilation with Remarks on
Warming, Exclusive Lighting and the Communication of Sound, pp 270-299, Longman,
Brown, Green & Longmans, London, UK.
Robertson, J. D. (1888). A Study of Micro Organisms in Air, Especially those in Sewer Air,
and a New Method of Demonstrating Them, Abstract of Presidential Address, The
British Medical Journal, Dec 15, Vol.2, No.1459, pp. 1330-1334.
Rowe, C. & Slutzky, R. (1963). Transparency: Literal and Phenomenal, Perspecta, Vol.8, pp.
45-54.
www.intechopen.com
Sensing a Historic Low-CO2 Future
245
Ryan, V. (2002). Condensation in Dwellings, Journal of Environmental Health Research, Vol.1,
Issue 1, 7 pages.
Saluja, G. S., Porteous, C. D. A. & Holling, A. (1987). Experience of Passive Solar Heating in
a Scottish Housing Scheme at 58oN Latitude, Proceedings of Advances in Solar Energy
Technology, Eds. W H Bloss and F Pfisterer, 13-18 September, Hamburg, Germany,
Pergamon Press, ISBN 0-08-034315-5, Vol.4, pp. 3686-3691.
Searle, G. F. C. (1934). Ch IX Experiments in Heat, In: Experimental Physics, A Selection of
Experiments, pp. 273-284, Cambridge University Press, London, UK.
Sherrington, C. S. (1906). Lecture IV Interaction Between Reflexes, In: The Integrative Action
of the Nervous System, pp. 114-149, Archibald Constable & Co. Ltd., London, UK.
Sippola, M. R. & Nazaroff, W. W. (2002). Modelling particle deposition in ventilation ducts,
Proceedings of Indoor Air, 2002, pp. 515-520.
Slessor, C. (2007). Green Gauge, The Architectural Review, Vol.CCXXI, No.1322, pp. 72-75.
Straube, J. F. & deGraauw, J. P. (2001). Indoor Air Quality and Hygroscopically Active
Materials, ASHRAE Transactions, Vol.107, Pt.1, 19 pages.
Stuart, J. (2006). Mind Over Mater, Construct Ireland, Issue 14, April, 2006.
Sturrock, N. & Lawson-Smith, P. (2006). The Grandfather of Air-Conditioning – The Work
and Influence of David Boswell Reid, Physician, Chemist, Engineer (1805-63),
Proceedings of the Second International Conference on Construction History, 29th March –
2nd April, Queens College, Cambridge, UK.
Sundell, J. (2004). On the History of Indoor Air Quality and Health, Indoor Air 2004; 14
(Suppl. 7), pp. 52 in 51-58.
Twinn, C. (2011). Natural Ventilation, Ecotech, 25, February 2011, pp. 10-25.
Varming, J. (1952). Vapour Transmission and Condensation, In: Architects’ Year Book 4, J B
Drew and T Dannatt: Eds, pp. 113-118, Paul Elek, London.
Vereecken, E., Roels, S. & Janssen, H. (2011). In situ determination of the moisture buffering
potential of room enclosures, Journal of Building Physics, Vol.34, Issue 3, pp. 223-246.
Viitanen, H. & Ojanen, T. (2007). Improved Model to Predict Mold Growth in Building
Materials, Proceedings of Thermal Performance of the Exterior Envelopes of Buildings,
ASHRAE THERM X, Clearwater, Florida, USA, Dec. 2007, 5th of 8 pages.
Wall, K., Dockrell, J. & Peacey, N. (2008). Primary Schools: The Built Environment, Research
Survey 6/1, Primary Review, Faculty of Education, University of Cambridge, p.11.
White, I. D., Mottershead, D. N. & Harrison, S. J, (1992). Ch 11 The Weathering System, In:
Environmental Systems, An Introductory Text, 2nd Ed., p. 274. Chapman & Hall,
London.
Wolverton, B. C. & Wolverton, J. D, (1993). Plants and Soil Microorganisms – Removal of
Formaldehyde, Xylene and Ammonia from the Indoor Environment, Journal of the
Mississippi Academy of Sciences, Vol.38, No.2, pp. 11-15.
Wolverton, B. C. & Wolverton, J, D. (1996). Interior Plants: Their Influence on Airborne
Microbes Inside Energy-Efficient Buildings, Journal of the Mississippi Academy of
Sciences, Vol.41, No.2, pp. 99-105.
Xu, P., Peccia, J., Fabian P., Martyny, J. W., Fennelly, K. P., Hernandez, M. & Miller, S. L.
(2003). Efficacy of ultraviolet germicidal irradiation of upper-room air in
www.intechopen.com

Chemistry, Emission Control, Radioactive Pollution and Indoor Air Quality
246
inactivating airborne bacterial spores and mycobacteria in full-scale studies,
Atmospheric Environment, Vol.37, pp 405-419.
Zarr, R. R. (2001). A History of Testing Heat Insulators at the National Institute of Standards
and Technology, ASHRAE Transactions 2001, Vol.107, Pt 2.
www.intechopen.com
Chemistry, Emission Control, Radioactive Pollution and Indoor AirQualityEdited by Dr. Nicolas Mazzeo
ISBN 978-953-307-316-3Hard cover, 680 pagesPublisher InTechPublished online 27, July, 2011Published in print edition July, 2011
InTech EuropeUniversity Campus STeP Ri Slavka Krautzeka 83/A 51000 Rijeka, Croatia Phone: +385 (51) 770 447 Fax: +385 (51) 686 166www.intechopen.com
InTech ChinaUnit 405, Office Block, Hotel Equatorial Shanghai No.65, Yan An Road (West), Shanghai, 200040, China
Phone: +86-21-62489820 Fax: +86-21-62489821
The atmosphere may be our most precious resource. Accordingly, the balance between its use and protectionis a high priority for our civilization. While many of us would consider air pollution to be an issue that themodern world has resolved to a greater extent, it still appears to have considerable influence on the globalenvironment. In many countries with ambitious economic growth targets the acceptable levels of air pollutionhave been transgressed. Serious respiratory disease related problems have been identified with both indoorand outdoor pollution throughout the world. The 25 chapters of this book deal with several air pollution issuesgrouped into the following sections: a) air pollution chemistry; b) air pollutant emission control; c) radioactivepollution and d) indoor air quality.
How to referenceIn order to correctly reference this scholarly work, feel free to copy and paste the following:
Colin Porteous (2011). Sensing a Historic Low-CO2 Future, Chemistry, Emission Control, Radioactive Pollutionand Indoor Air Quality, Dr. Nicolas Mazzeo (Ed.), ISBN: 978-953-307-316-3, InTech, Available from:http://www.intechopen.com/books/chemistry-emission-control-radioactive-pollution-and-indoor-air-quality/sensing-a-historic-low-co2-future

© 2011 The Author(s). Licensee IntechOpen. This chapter is distributedunder the terms of the Creative Commons Attribution-NonCommercial-ShareAlike-3.0 License, which permits use, distribution and reproduction fornon-commercial purposes, provided the original is properly cited andderivative works building on this content are distributed under the samelicense.