Senior Enlisted Personnel: Do We Need Another Grade? · Recent changes in military retirement ........
43
CRM D0005072.A2 / Final December 2001 Senior Enlisted Personnel: Do We Need Another Grade? Aline O. Quester • Gary Lee, SgtMaj, USMC (Ret.) CNA D 4825 Mark Center Drive • Alexandria, Virginia 22311-1850
Transcript of Senior Enlisted Personnel: Do We Need Another Grade? · Recent changes in military retirement ........

CRM D0005072.A2 / FinalDecember 2001
Senior Enlisted Personnel:Do We Need Another Grade?
Aline O. Quester • Gary Lee, SgtMaj, USMC (Ret.)
CNAD4825 Mark Center Drive • Alexandria, Virginia 22311-1850

Copyright CNA Corporation/Scanned October 2002
Approved for distribution: December 2001
Donald J.(CymrQt,/DirectorWorkforce^EtracatW-and Training TeamResource Analysis Division
This document represents the best opinion of CNA at the time of issue.It does not necessarily represent the opinion of the Department of the Navy.
APPROVED FOR PUBLIC RELEASE; DISTRIBUTION UNLIMITEDFor copies of this document, call CNA Production Services (703) 824-2122 or (703) 824-2123
Copyright © 2001 The CNA Corporation
ContentsIntroduction . . . . . . . . . . . . . . . . . . . . . . . . . . . . 1
History . . . . . . . . . . . . . . . . . . . . . . . . . . . . 2Current status . . . . . . . . . . . . . . . . . . . . . . . . 3Challenges facing the E-9 community. . . . . . . . . . . . 5
Today's E-9s . . . . . . . . . . . . . . . . . . . . . . . . . . . . 9Experience d i s t r i b u t i o n s . . . . . . . . . . . . . . . . . . . 9Promotions . . . . . . . . . . . . . . . . . . . . . . . . . . 1 0
Patterns . . . . . . . . . . . . . . . . . . . . . . . . . 1 1Comparisons with commissioned officers . . . . . . . 11
When do E-9s retire? . . . . . . . . . . . . . . . . . . . . . 12Some thoughts on retirements. . . . . . . . . . . . . 12Comparisons with commissioned officers: averageyears of service at retirement . . . . . . . . . . . . . 14
E-9s are increasingly college graduates . . . . . . . . . . . 14
Is our current compensation and rank structure sufficientto retain our best E - 9 s ? . . . . . . . . . . . . . . . . . . . . . . 17
The promotion process and the 1-percent limit:the quality c u t . . . . . . . . . . . . . . . . . . . . . . . . 17
Reasons to continue in service after making E-9 . . . . . . 17Some empirical evidence from the Navy:
"quality" and E-9 retention . . . . . . . . . . . . . . . . . 19Recent changes in military retirement . . . . . . . . . . . 22
Why we need another rank: recommendationf o r a n E-10 p a y grade . . . . . . . . . . . . . . . . . . . . . . 2 5
The E-10 grade . . . . . . . . . . . . . . . . . . . . . . . . 27Cost . . . . . . . . . . . . . . . . . . . . . . . . . . . . . . 2 7
S u m m a r y . . . . . . . . . . . . . . . . . . . . . . . . . . . . . . 2 9
Appendix: Tournament literature in economics . . . . . . . . . 31
R e f e r e n c e s . . . . . . . . . . . . . . . . . . . . . . . . . . . . . 3 5
List of figures . . . . . . . . . . . . . . . . . . . . . . . . . . . 37
Distribution list . . . . . . . . . . . . . . . . . . . . . . . . . . 39

IntroductionAre the most senior enlisted service members adequately compen-sated? Given the varying levels of responsibility assigned to them, isthe compensation sufficient to ensure that we retain the talent werequire? Because these senior enlisted personnel are more apt to beretirement-eligible, are the best retiring too early? Are there suffi-cient incentives to induce the most competitive to remain in service?
Service members in grade E-9 usually fall into two categories:
• The technical or duty expert of a certain occupational field, or
• The senior enlisted advisor to the commanding officer of agiven unit, usually a unit with its own organizational colors.
We'll start with a short history of non-commissioned officers, concen-trating on the most senior grade. Then we'll present a current over-view of the E-9s in each of the services and describe what we see asthe challenges facing the E-9 community today. We'll turn then to thecurrent experience distribution of E-9s, promotion timing, and thepattern of retirements. Finally, we'll return to the question of incen-tives for E-9 retention and a proposal for an E-10 grade.
1. The authors gratefully acknowledge the contributions of Michael L.Hansen for reviewing this paper and Robert A. Book for providing theappendix.
2. We lack personnel data from the Coast Guard, so we don't include themin our empirical analyses; however, our discussion of senior enlisted payincludes the Coast Guard because its compensation and grade structuremirror those of the military services.

HistoryBefore 1920, only six enlisted ranks existed—the top rank being E-l.War Department Circular 303 created a new rank of staff sergeant in1920, but the system we know today did not come about until theCareer Compensation Act of 1949 reversed the order of progression,making E-7 the top enlisted rank.
In 1953, the Womble Commission studied the problem of enhancingthe status and prestige of the non-commissioned officer (NCO), butthe recommendations were not definitive and the Korean War pre-cluded any action. As the Korean War ended, new problems arose,particularly in the Army where several thousand commissioned offic-ers were allowed to stay in the Army as E-7s. A thesis from the Indus-trial College of the Armed Forces notes that "cheerless commissionedrejects filled every room at the inn" [2].
In 1956, the Secretary of Defense appointed a Defense Advisory Com-mittee on Professional and Technical Compensations with Ralph J.Cordiner as the chair. This committee is often called the CordinerCommission. In its final report to the Secretary of Defense in May1957, the commission made several important recommendations thatwere finalized by Congress in the Military Pay Bill of 1958 [3], Thecommission report argued strongly that the current pay scales werebased too much on longevity, a problem that was particularly seriousat the highest NCO grades. It looked at pay compression among theenlisted ranks, comparing the 1908 pay table with that in effect in1956. The report noted that the pay of E-ls increased almost 800 per-cent in that time period, while the E-7 pay increased only 300 percent.
The Military Pay Bill of 1958 addressed the problems identified by theCordiner Commission report by establishing two new enlisted paygrades, E-8 and E-9. The text of the bill states:
The purpose of establishing the two new enlisted pay gradesE-8 and E-9 [was] to provide for a better delineation ofresponsibilities in the enlisted structure....The result is thata situation exists wherein E-7s supervise E-7s who supervise
3. This information and that which follows were largely taken from [1].
other E-7s. The establishment of the pay grades of E-8 andE-9 will make it possible to distinguish properly between thedifferent levels of responsibility and at the same time pro-vide the necessary monetary recognition for the jobs beingperformed by those who hold the grades.4
The law restricted the percentage of E-9s in each service to 1 percentand the total percentage of E-8s and E-9s to 3 percent. Few enlistedtoday are even aware that the grades of E-8 and E-9 were not intro-duced until 1958, and no one today can imagine managing theenlisted force without these grades. At the time of their introduction,however, the new grades were controversial, primarily because somefelt that they somehow downgraded the importance of the previoustop rank of E-7. Each service was able to implement the new ranks asthey saw fit. The Army upgraded the rank structure in three phasesand allowed the wearing of the older chevrons until 1968.
As we think about the situation today, with E-9s supervising E-9s whosupervise other E-9s, we are reminded of what occurred in the 1950s.
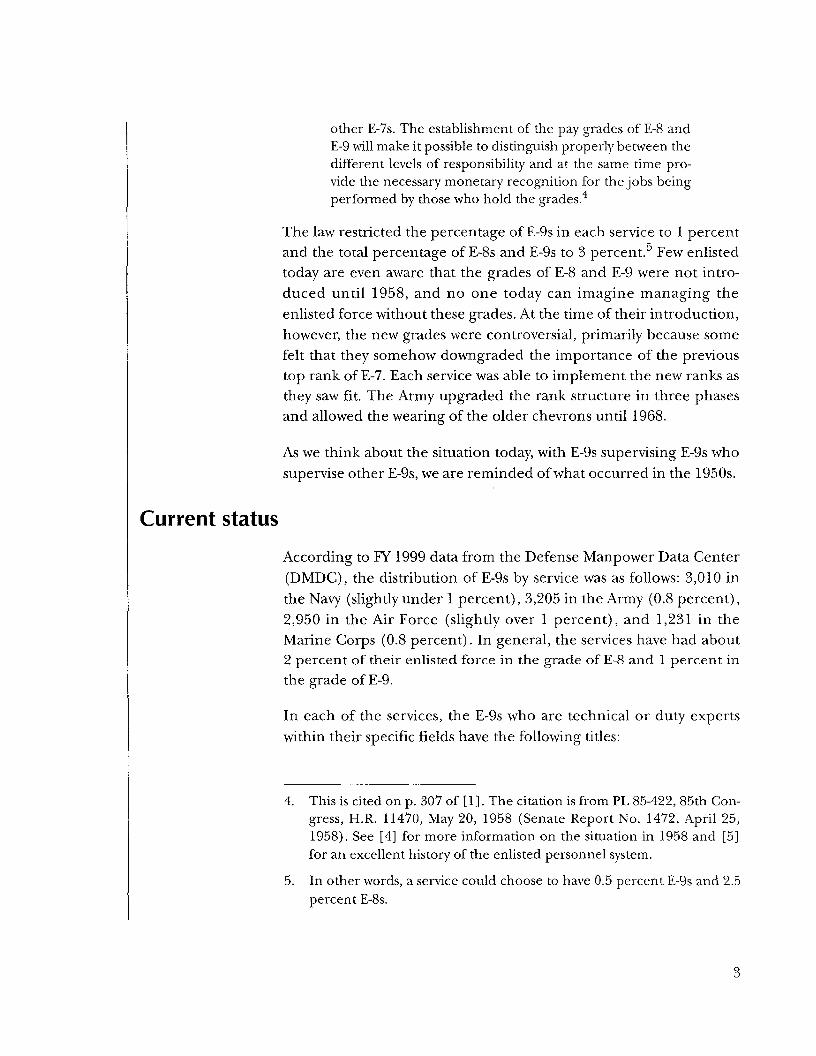
Current statusAccording to FY 1999 data from the Defense Manpower Data Center(DMDC), the distribution of E-9s by service was as follows: 3,010 inthe Navy (slightly under 1 percent), 3,205 in the Army (0.8 percent),2,950 in the Air Force (slightly over 1 percent), and 1,231 in theMarine Corps (0.8 percent). In general, the services have had about2 percent of their enlisted force in the grade of E-8 and 1 percent inthe grade of E-9.
In each of the services, the E-9s who are technical or duty expertswithin their specific fields have the following titles:
4. This is cited on p. 307 of [1]. The citation is from PL 85-422, 85th Con-gress, H.R. 11470, May 20, 1958 (Senate Report No. 1472, April 25,1958). See [4] for more information on the situation in 1958 and [5]for an excellent history of the enlisted personnel system.
5. In other words, a service could choose to have 0.5 percent E-9s and 2.5percent E-8s.
• Army: Sergeant Major
• Marine Corps: Master Gunnery Sergeant
• Navy: Master Chief Petty Officer
• Air Force: Chief Master Sergeant
• Coast Guard: Master Chief Petty Officer.
E-9s who serve as the principal enlisted to the commanders at alllevels from battalions through headquarters are known as seniorenlisted advisors (SEAs). Each service chief also has an SEA; this per-son, as the senior enlisted member in that service, receives a perma-nent increase in compensation. The titles of the senior enlistedmember in each service and the titles of SEAs to other appropriatelevel commanding officers are as follows:
• Army: Sergeant Major of the Army
— Command Sergeant Major
• Marine Corps: Sergeant Major of the Marine Corps
— Sergeant Major
• Navy: Master Chief Petty Officer of the Navy
— Command Master Chief Petty Officer
• Air Force: Chief Master Sergeant of the Air Force
— Command Chief Master Sergeant
• Coast Guard: Master Chief Petty Officer of the Coast Guard
— Command Master Chief Petty Officer.
The four military services and the Coast Guard manage their E-9 pop-ulations very differently. The management processes of the Army andMarine Corps have a few similarities, and the Navy and Coast Guardhave many close similarities, but there are few similarities between theAir Force and the other services. In short, each service has deter-mined a management process that addresses its needs.

Challenges facing the E-9 communityIn this paper we examine four challenges that the services mustaddress if we are to continue to retain the most competitive of ourenlisted leaders. These challenges are:
• The E-9 grade cannot adequately distinguish among the varyinglevels of responsibility represented by E-9 billets. This phenom-enon is similar to the one addressed in 1958 by the CordinerCommission. Today we have E-9s supervising E-9s supervisingother E-9s.
• E-9 compensation is based on overall years of service. E-9s whoare promoted faster than average have fewer years of servicewhen they reach the E-9 grade than do those with slower promo-tion rates. This creates a pay inversion, with the slower promo-tees earning more than the faster promotees.
• Years of service at retirement is smallest for those in each occu-pation who reach E-9 the fastest. While this empirical analysis isfor the Navy only, we suspect that the same pattern may befound in the other services. Once the E-9 grade is reached, payincreases consist of only modest awards for longevity.
• Increasing competition from the civilian sector combined withlonger overall work lives and higher educational attainment ofE-9s suggest that the problems we have identified in retention ofour most competitive E-9s can be expected to continue.
We'll address these points in more detail later. In this introduction,let's briefly address the first point: varying levels of supervision.
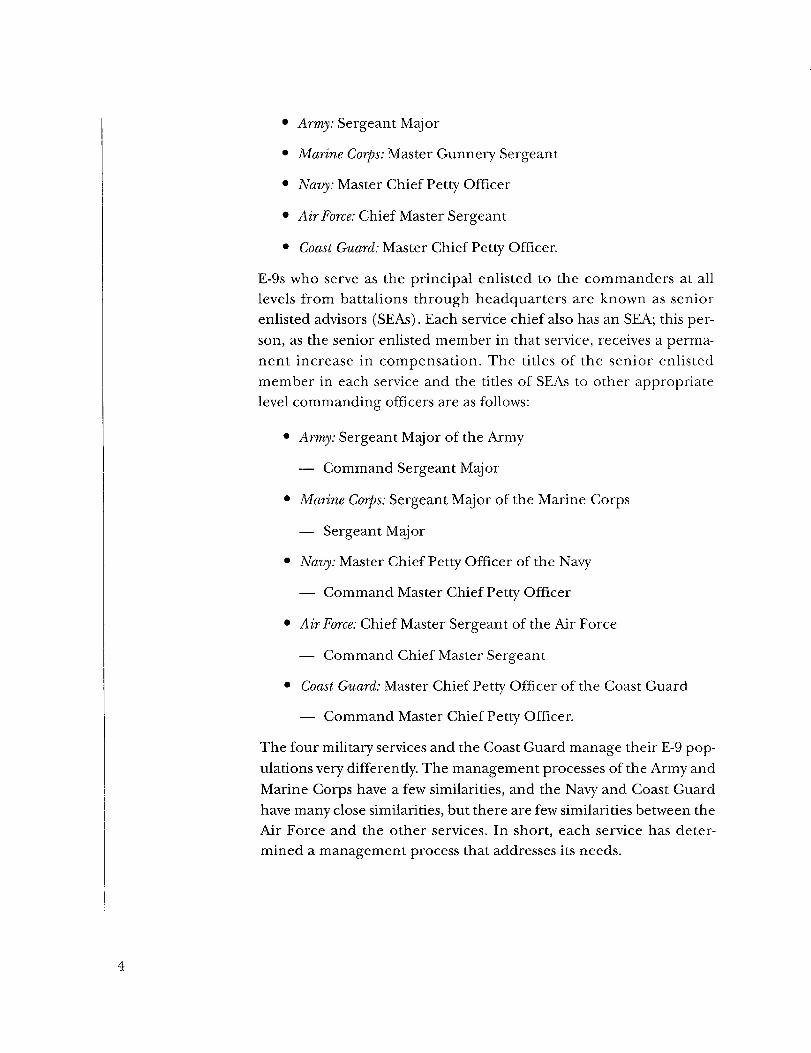
We'll use the Marine Corps to illustrate this point. Figure 1 showsMarine Forces Atlantic (MARFORLANT). The Lieutenant Generalwho commands MARFORLANT (COMMARFORLANT) has a ForceSergeant Major, shown at the top of figure 1. The Sergeants Majorbelow him report to him as the senior enlisted in MARFORLANT. The2 MEF Sergeant Major, the SEA for the MEF Commander (a MajorGeneral) supervises 91 other Sergeants Major. Figure 1 shows onlysome of these SEAs—those in the infantry portion of the command.
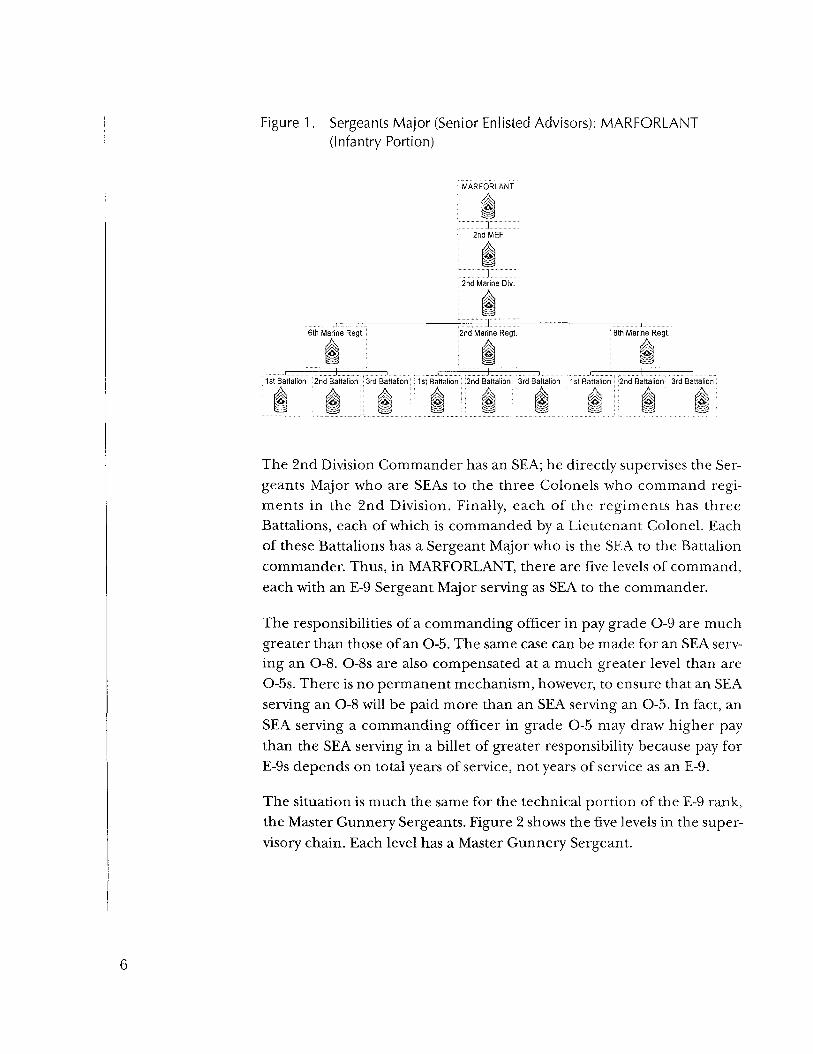
Figure 1. Sergeants Major (Senior Enlisted Advisors): MARFORLANT(Infantry Portion)
MARFORLANT
....................j..................
I 2nd MEF
i 2nd Marine Dlv. •
———————————........................i....................6th Marine Regt. I |2nd Marine Regt.; : 8th Marine Regt.
! H| ! I ft i lit
: 1st Battalion ;2nd Battalion || 3rd Battalion i 1st Battalion: !2nd Battalion: 3rd Battalion 1 st Battalion I ;2nd Battalion 3rd Battalion :
The 2nd Division Commander has an SEA; he directly supervises the Ser-geants Major who are SEAs to the three Colonels who command regi-ments in the 2nd Division. Finally, each of the regiments has threeBattalions, each of which is commanded by a Lieutenant Colonel. Eachof these Battalions has a Sergeant Major who is the SEA to the Battalioncommander. Thus, in MARFORLANT, there are five levels of command,each with an E-9 Sergeant Major serving as SEA to the commander.
The responsibilities of a commanding officer in pay grade O-9 are muchgreater than those of an O-5. The same case can be made for an SEA serv-ing an O-8. O-8s are also compensated at a much greater level than areO-5s. There is no permanent mechanism, however, to ensure that an SEAserving an O-8 will be paid more than an SEA serving an O-5. In fact, anSEA serving a commanding officer in grade O-5 may draw higher paythan the SEA serving in a billet of greater responsibility because pay forE-9s depends on total years of service, not years of service as an E-9.
The situation is much the same for the technical portion of the E-9 rank,the Master Gunnery Sergeants. Figure 2 shows the five levels in the super-visory chain. Each level has a Master Gunnery Sergeant.
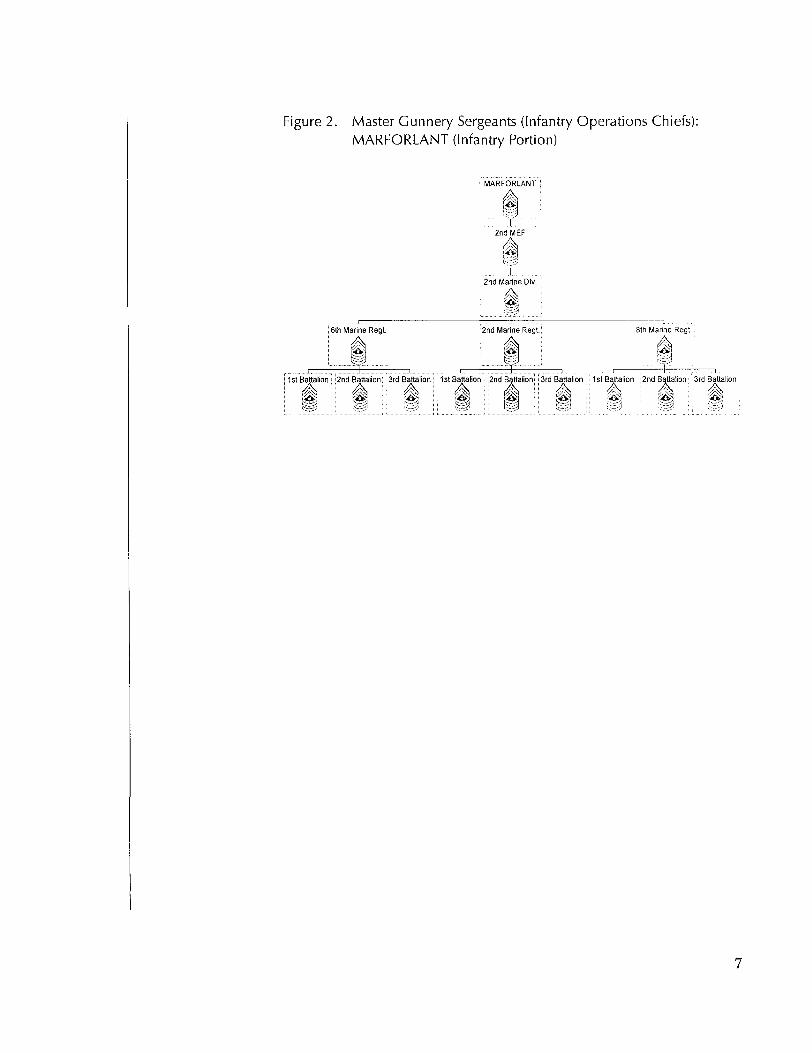
Figure 2. Master Gunnery Sergeants (Infantry Operations Chiefs):MARFORLANT (Infantry Portion)
i MARFORLANT j
2ndMEF
I.. i ;
2nd Marine Dlv. ,
6ih Marine Regt i2nd Marine Regt.! 8th Marine Regt
list Battalion H2nd Battalion: 3rd Battalion i Mst Battalion ; :2nd Battalion!! 3rd Battalion i ; 1st Battalion : !2nd Battalion i3rd Battalion1 " ' i : 4 ii 4 ; : 4 H 4 N 4 : : 4 4e < s 5 n ! i e f e : S 6 a ; : i « M ! ! ^ : r<&< >*&•m m

THIS PAGE INTENTIONALLY LEFT BLANK
Today's E-9s
Experience distributionsIn all our analyses, we show years of service as those serving in thatparticular year of service. Thus, the 30th year of service means thatthe person has completed 29 years and is in the 30th year. Figure 3shows the E-9 experience distribution for each of the services.
Figure 3. Experience distributions for E-9s in 1999a
Navy Army
n 1
', P
i/̂ s.
m
p
29.4% have completed26 or more YOS ^
M^ t.n.7T 1Jhi ii m o .2'J 30 31
r-, n 11 l!
18 19 20 21 2
"
— -
; !
2 2
I !
I^~
7 2
34. 6% have"s\36 or nx>rc ^
•^
: si f m« jy jo jl
Note: The Navy had 3,010 E-9s and an enlisted endstrength of 314,286.Average YDS for E-9s was 24.5 years
Air Force
tS ?% have
[1 1m n Mil Is
^^1§
iS
1 11
i «<-* iiI
-
i\
l|
conpldcd 26""V<>n more YOS
i
11 1 UKIB I'J 20 21 22 23 2-1 25 26 27 28 29 30 31
Note: The Air Force had 2,950 E-9s and an enlisted endstrenglh of 286,170.Average YOS for E-9s WE 25.4 years.
Note: The Army had 3,205 E-9s and an enlisted endslrenglh of 396,155Average YOS for E-9s vras 25.4 years.
Marine Corps
_ m 1
;
:
|
FT ~~\_^ 43.8%lldV^6orrro
18 19 20 21 22 23 24 25 26 27 28 29 30 jl
Yl:.irb 1)1 SL-rvia;
Note: The Marine Caps had 1,231 E-9s and an enlisted endstrenglh of 154.830Average YOS for E-9s \vas 25.9 years.
a. All data are from the FY 1999 MPP inventory report from the Defense Manpower Data Center (DMDC)Information Delivery System (IDS).
Promotions
The Navy has the youngest experience distribution, with modal yearsof service at 22 to 24 years. Less than 30 percent of Navy Master Chiefshave 26 or more years of service, and just under 35 percent of theArmy's Sergeants Major have 26 or more years of completed service.Though the Air Force's Chief Master Sergeants have a slightly higherproportion of the force with 26 or more years of service, the two dis-tributions are quite different: we find modal years of service in the24th and 27th years for the Army and the Air Force. The MarineCorps has the most experienced force of Sergeants Major; almost 44percent have completed 26 or more years of service.
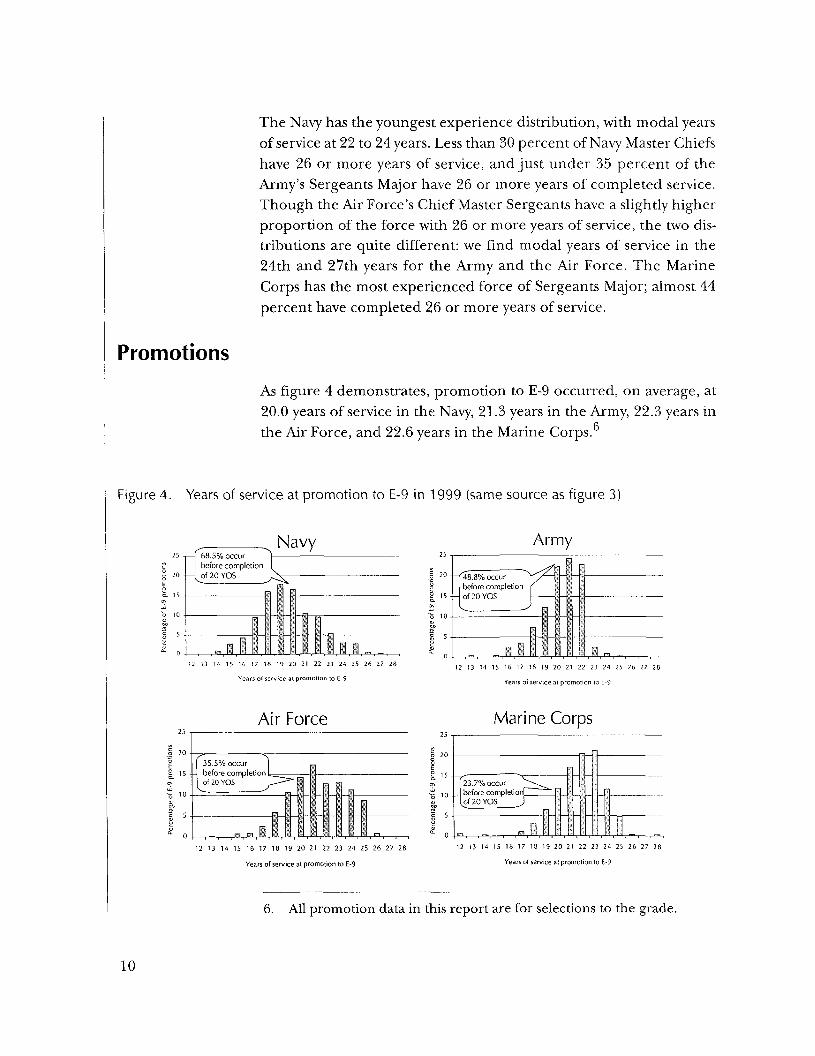
As figure 4 demonstrates, promotion to E-9 occurred, on average, at20.0 years of service in the Navy, 21.3 years in the Army, 22.3 years inthe Air Force, and 22.6 years in the Marine Corps.
Figure 4. Years of service at promotion to E-9 in 1999 (same source as figure 3)
25 ,
n -
s- -*— 68.5% occur
before completion-l̂ of 20 YDS
———————————
- I I
t-x .̂i
_
i-
i I 1 1 _12 13 14 15 16 17 18 19 20 21 22 23 24 25 26 27 26
Years of service at promotion to E-9
Air Force
.1 20| [ 35.5% occur|_ 15 - \ before completiona, of 20 YDS
V
12 13 14 IS 16 17 18 19 20 21 22 23 24 25 26 27 28
Years of service at promotion to E-9
25
| 20
8 15Q.
'S 10
Army
-Y48.8% occur ^before completion
-\ of 20 YDS
_ _ 1 1
/
\
_
- —•
1 „ _
12 13 14 15 16 17 18 19 20 21 22 23 24 25 26 27 28
Years of service at promotion to E-9
Marine Corps
n
f23.7% occur 1̂̂ ^before completionl
ipf20YOS J)
n, j
12 13 14 15 16 17 18 19 20 21 22 23 24 2S 26 27 28
Years of service at promotion lo E-9
6. All promotion data in this report are for selections to the grade.
10
PatternsMore revealing than the averages, however, is the entire pattern of thepromotions. Promotions to E-9 occur earliest in the Navy and latest inthe Air Force and the Marine Corps.
Comparisons with commissioned officersAs we've seen, the average years of service at promotion to E-9 arebetween 20 and 22.6 years. Officers with similar lengths of sendee atpromotion are O-6s. However, those advanced to O-6 still have fur-ther advancement opportunities. By service, the average years of ser-
f-t
vice at promotion are as follows:
• Navy: 20.0 for promotion to E-9; 19.6 to O-6
• Army: 21.3 for promotion to E-9; 20.7 to O-6
• Air Force: 22.5 for promotion to E-9; 20.6 to O-6
• Marine Corps: 22.6 for promotion to E-9; 22.5 to O-6.
In short, with the possible exception of the Air Force, the average mil-itary experience levels for promotions to E-9 in each service are virtu-ally identical to those for promotion to O-6. We make the followingpoints about this finding:
• First, the average enlisted person promoted to E-9 receives thislast promotion at the same experience point at which officerspotentially have four more promotion possibilities.
• Second, the average E-9 promotion occurs almost a decadebefore the time-in-service limit of 30 years. For the fast-track,early-promoted E-9s, there is more than a decade before servicelimits are reached—more than a decade without any promo-tion possibilities.
• Third, the average E-9 is about 4 years younger than the O-6,slightly under 40 at this point in their career. Outside observersmight conclude that E-9s, particularly those who reached thegrade early, have now found themselves in a dead-end job.
7. These are DMDC data for 1999 selections to E-9 and O-6.
11
We later try to estimate how the lack of further advancement oppor-tunities affects the retention of our most competitive E-9s, those whofast-tracked to E-7. This is a difficult subject to quantify because (a)quality is difficult to measure and (b) the analyses require extensivelongitudinal personnel records. We would suggest, however, that thelack of advancement opportunities is not a retention-enhancer forour best and brightest E-9s.
When do E-9s retire?Figure 5 shows E-9 separations in FY 1999. Just as the Navy had theearliest promotions to E-9, it also has the earliest retirements. Thepanels in the figure show the percentages retiring at the service limit,with 30 or more years of service. It's under 30 percent in the Navy andArmy, and approaching 40 percent in the Air Force and the MarineCorps. In brief, the large majority ofE-9s retire before the service limit.
The "bump" in retirement at the 27th year of service is clearly evident.These E-9s, who completed 26 years of service, have just received theirlast pay raise.
Some thoughts on retirementsE-9s are constrained by law to be no more than 1 percent of enlistedstrength. What percentage are they of those who retire from the mil-itary? Even among those who complete a full military career of 20 ormore years, they represent a very small percentage. In 1999, E-9retirements made up less than 7 percent of all enlisted retirements.
8. The DMDC data from the IDS system that we used for these analyses didnot show any E-9 separations before 20 years of service.
9. The retirement system for military personnel who entered before 8 Sep-tember 1980 based retired pay on the highest basic pay ever received.Service members would often wait to retire until they hit a longevityincrease; these increases were after completing 22,24, or 26 years of ser-vice. For those who entered between 8 September 1980 and 31 July1986, however, retirement pay will be based on the highest 3-year aver-age of basic pay. This is certain to change retirement behavior, and weshould not expect to see a spike in retirement numbers at 23, 25, and27 years of service as these members retire.
12
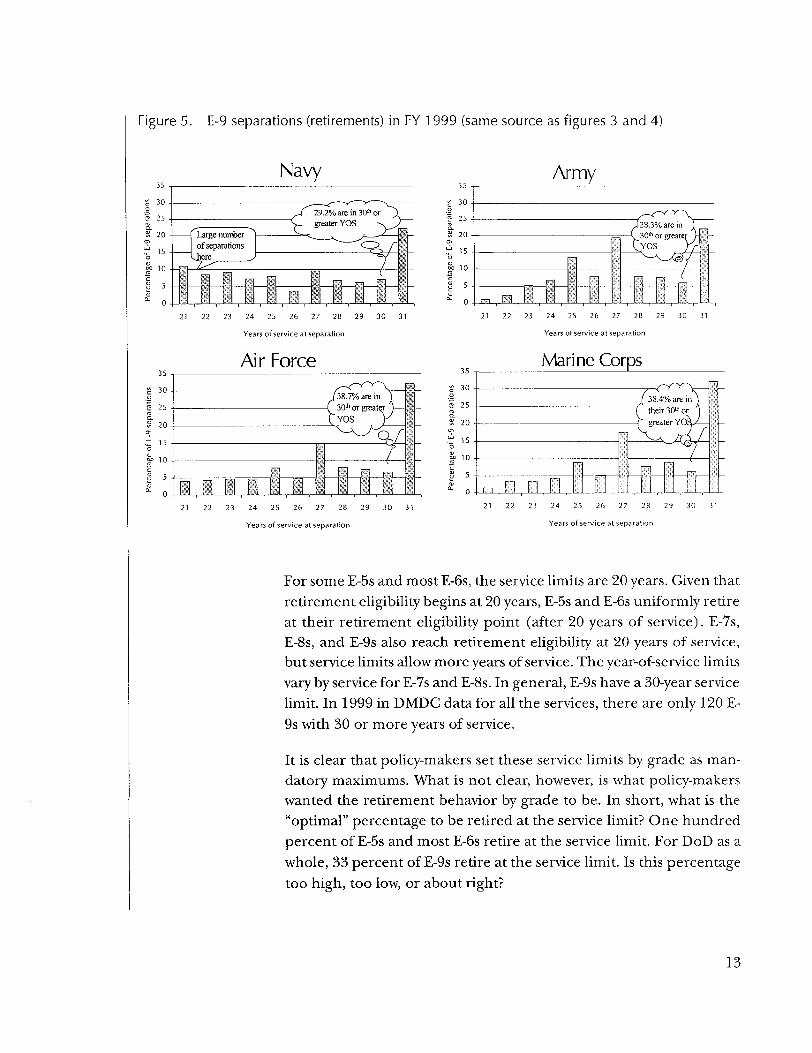
Figure 5. E-9 separations (retirements) in FY 1999 (same source as figures 3 and 4)
Navy
21 22 23 24 25 26 27 28 29 30 31
Years of service at separation
Air Force35
£ 30
E 25Q.
S 20
" 15o
I 10
§ •21 22 23 24 25 26 27 28 29 30 31
Years of service at separation
35
S 20<TIi 15o&> 10
Army
21 22 23 24 25 26 27 28 29 30 31
Years of service at separation
£ 30 -ISS 25
Marine Corps
SI Pi21 22 23 24 25 26 27 28 29 30 31
Years of service at separation
For some E-5s and most E-6s, the service limits are 20 years. Given thatretirement eligibility begins at 20 years, E-5s and E-6s uniformly retireat their retirement eligibility point (after 20 years of service). E-7s,E-8s, and E-9s also reach retirement eligibility at 20 years of service,but service limits allow more years of service. The year-of-service limitsvary by service for E-7s and E-8s. In general, E-9s have a 30-year servicelimit. In 1999 in DMDC data for all the services, there are only 120 E-9s with 30 or more years of service.
It is clear that policy-makers set these service limits by grade as man-datory maximums. What is not clear, however, is what policy-makerswanted the retirement behavior by grade to be. In short, what is the"optimal" percentage to be retired at the service limit? One hundredpercent of E-5s and most E-6s retire at the service limit. For DoD as awhole, 33 percent of E-9s retire at the service limit. Is this percentagetoo high, too low, or about right?
13

Moreover, there are fairly substantial percentages of E-9s who retirevery early, in their 21st to 24th years of service. In FY99 these were:
• 36.0 percent in the Navy
• 15,7 percent in the Army
• 17.7 percent in the Air Force
• 12.9 percent in the Marine Corps.
Comparisons with commissioned officers: average years of serviceat retirement
Let's compare average years of service at retirement for E-9s and O-6s:
• Navy: 26.2 years for E-9s and for 27.2 for O-6s
• Army: 27.3 years for E-9s and for 28.2 for O-6s
• Air Force: 27.7 years for E-9s and for 27.8 for O-6s
• Marine Corps: 28.0 years for E-9s and for 28.2 for O-6s.
For the O-6s, opportunities for further advancement in rank help theservices to retain the most able. There is no such mechanism, how-ever, that works to keep our very best E-9s in service. Enlisted E-9shave no further promotion opportunities. They retire at about thesame years of service as the O-6s who have not been selected for flagrank. The last longevity pay raise is after completion of the 26th year,but pay for years of service doesn't equate to pay for performance.There's no way to quantify that the E-9s who serve until they receivethe 26th year "fogy" are the highest quality performers.
E-9s are increasingly college graduatesIn addition to having ever-increasing layers of responsibility in the E-9grade, E-9s who continue their service are increasingly college gradu-ates. This makes them increasingly competitive in the civilian labor
10. The appendix summarizes the literature in economics that addressesthis problem.
14
market. These changes in E-9 educational attainment cannot beexpected to abate.
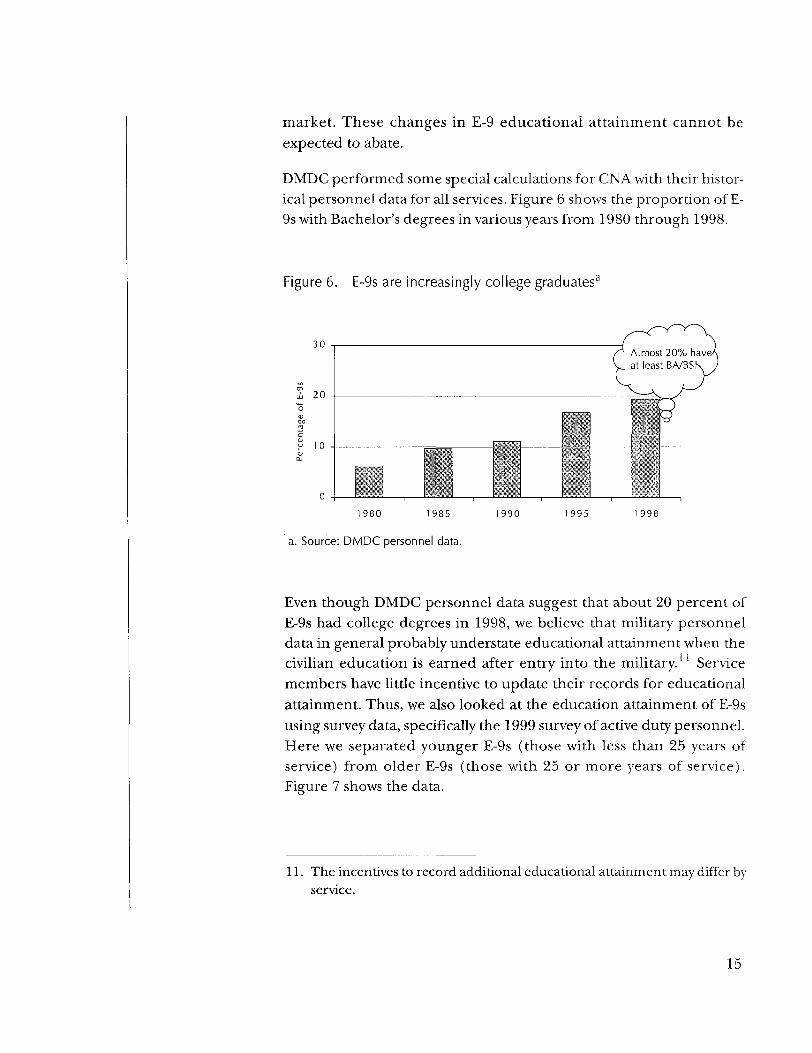
DMDC performed some special calculations for CNA with their histor-ical personnel data for all services. Figure 6 shows the proportion of E-9s with Bachelor's degrees in various years from 1980 through 1998.
Figure 6. E-9s are increasingly college graduates3
Almost 20% havat least BA/BS!
ui 20
y 10
1980 1985
a. Source: DMDC personnel data.
1990 199S 1 998
Even though DMDC personnel data suggest that about 20 percent ofE-9s had college degrees in 1998, we believe that military personneldata in general probably understate educational attainment when thecivilian education is earned after entry into the military. Servicemembers have little incentive to update their records for educationalattainment. Thus, we also looked at the education attainment of E-9susing survey data, specifically the 1999 survey of active duty personnel.Here we separated younger E-9s (those with less than 25 years ofservice) from older E-9s (those with 25 or more years of service).Figure 7 shows the data.
11. The incentives to record additional educational attainment may differ byservice.
15

Other research done for the QRMC has established the importanceof educational attainment for civilian earnings. Earnings differencesbetween those with a high school degree and those with a collegedegree, or even some college, are strikingly large. Moreover, increas-ing education levels qualify one for a wider variety of jobs. Given thatin 1999 slightly over 30 percent of E-9s with fewer than 25 years ofexperience reported that they had at least a Bachelor's degree, we arein a very different market for our senior enlisted than we were 20years ago.
Figure 7. E-9s with BA/BS or higher degrees3
40
M/ 1 f\oo 20
10
Fewer than 25 years of service 25 or more years of service
a. Source: 1999 DMDC survey of active-duty personnel. Overall, 25.6 percent of E-9sreported in the survey that they have at least a BA/BS degree.
In summary, E-9s have increasing educational attainment and bettercivilian opportunities than they had in the past. These trends can beexpected to decrease E-9 retention, particularly for the most compet-itive. Before we address directly whether we have sufficient incentivesfor our best E-9s to serve full careers, let's again review the very selec-tive process that makes an E-9.
16
Is our current compensation and rank structuresufficient to retain our best E-9s?
The promotion process and the 1 -percent limit: the quality cutThe enlisted ranks form a pyramid, represented at the top by the paygrade E-9. To make this pyramid work, the services over the yearshave devised a process of promotion whereby enlisted members com-pete for advancement to the next higher grade. When coupled withmaximum sendee limits per grade, those who fail competitive selec-tion must separate or retire. With the exception of promotion to E-2,all other promotions are merit based; also, the higher the grade forwhich one competes, the more difficult the challenge. To be pro-moted to E-9 means that all the challenges laid down by the serviceover many years have been met and overcome. We have considerablefaith in these promotion processes developed over decades, believingthat the promotion processes of each service ensure that only those ofthe highest quality advance. By the grade of E-9, each member hasbeen through a series of boards and examinations and has been thor-oughly vetted by the sendee.
Reasons to continue in service after making E-9Very few service members ever make it to E-9. Although the serviceshave different experience mixes—the Marine Corps the most juniorand the Air Force the most senior overall—they do not differ in theprobability that an E-l will make it to the E-9 grade. For the 1 percentof the force that will be promoted to that rank, the E-9 promotion isbased on superior, meritorious performance over a long period of
12. Keep in mind that the uniformed military do not represent the age dis-tribution of America's full-time working population. Although both theenlisted ranks and the officer ranks form a pyramid (both by rank andby age), comparable ages in the civilian population are in the shape of acylinder, with about the same numbers in each age group (see [6]).
17

time. In short, each grade cohort competes against itself with themost competitive winning promotion.
All the services offer their members some opportunity to advancethrough the ranks at accelerated speeds. Often called meritoriouspromotion, such early advancements signal superior achievements.The rate of advance also depends on demonstrated performance andleadership abilities and, in some cases, on the uniqueness of the skillthe member holds throughout his/her career. There's considerableanecdotal evidence to support the fact that many superior E-9s do notserve as long as the services would like or need. Because retiring fromthe service before mandatory service limits are reached is a voluntaryact, one can assume that many of those who do so are not sufficientlysatisfied with the current rewards to continue on as an E-9. One canfurther assume that many of those who are dissatisfied are among thevery best and are those whom the services would want most to retain.
Each service promotes, retains, and loses its E-9s at different points interms of years of service. What the optimums are is not clear; whatstands out is that in each service the average difference between selec-tion to E-9 and voluntary retirement is only 6 years, whereas the aver-age difference between selection and mandatory retirement isconsiderably longer.
The services benefit from having their most qualified and meritoriousE-9s continuing to serve until service limits of at least 30 years. Thosewho fill the most responsible and demanding billets will usually beselected/appointed from the most senior E-9s. Our hypothesis is thatthe services are losing many of their most capable performers prema-turely. Why? We offer the following reasons why we believe E-9s do nothave sufficient incentives to continue in service:
• There are no further advancement possibilities
• The only pay increases are small longevity increases at 20, 22,24, and 26 years of service
• After 26 years of service, there are no further pay increases.13
13. The Army, Navy, and Coast Guard do pay a type of Special Duty Assign-ment Pay to SEAs in certain flag level and other special billets. This ser-vice-specific special pay doesn't carry over into increased retirementincome and does not translate into any additional status or prestige.
18

Some empirical evidence from the Navy:"quality" and E-9 retention
At various discussions with our QRMC sponsors, we were asked if wecould quantify some of our arguments about E-9 retention. Specifically,could we say anything about "quality" and E-9 retention? Could wedevelop some kind of proxy for E-9 "quality"?
As our earlier discussion has shown, we place considerable faith in thepromotion process for selecting the most highly qualified. Could weproxy quality by the speed of promotion? We decided to try and chosethe Navy, as we had detailed Navy personnel, longitudinal data sincethe late 1970s. Navy promotions are driven by vacancies in the nextrank within the particular Navy occupation (rating). Each year thereare different numbers of vacancies; thus, our analysis of promotionspeed would have to be by rating and year of promotion.
We decided to use the E-7 promotion, and we built a file that sorted—for each fiscal year of promotion and rating—the personnel records bymonths of service at the promotion. We then defined the quickest thirdof promotions as "fast," the middle third of promotions as "average,"and the bottom third of promotions as "slow." Thus, our proxy for qual-ity is promotion speed, defined for each sailor by the rating and theyear of promotion.
After identifying each sailor as a fast, average, or slow promote by theirpromotion speed to E-7, we followed them, analyzing their behaviorafter the E-7 promotion. First, we asked, "What percentage of eachgroup separated before reaching the rank of E-9? We show this infigure 8.
14. If we had not done the analysis by rating, the fast-track group would havebeen dominated by the ratings with faster promotion rates. These are usu-ally the high-tech ratings where the pull of civilian jobs creates manyvacancies and the possibility of faster promotions. Because vacanciesdetermine promotion rates, ratings with faster or slower than average pro-motion rates can also be caused by changes in personnel requirements.
15. Some will separate because they no longer like the Navy or find the civil-ian sector more attractive. Some will be forced to separate as they reachhigh-year tenure. Others will separate at the grade of E-8, never reachingthe grade of E-9, and so on.
19
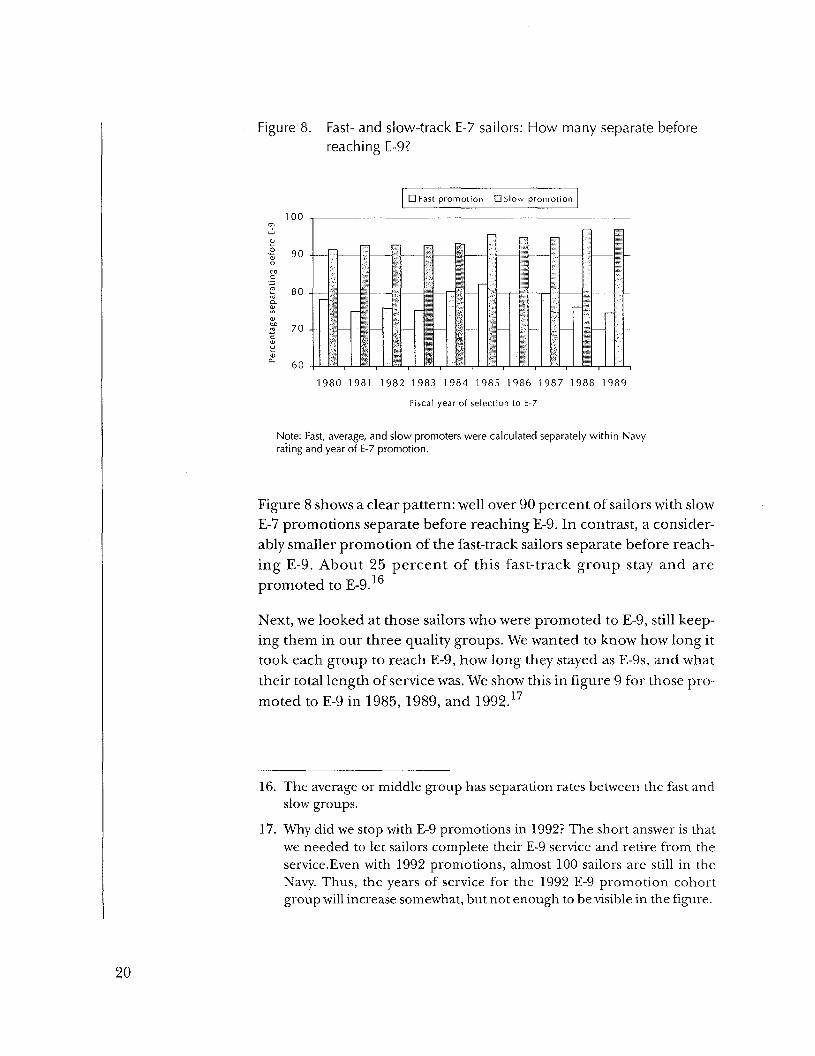
Figure 8. Fast- and slow-track E-7 sailors: How many separate beforereaching E-9?
D Fast promotion 0 Slow promotion
100
90
80
70 --
60
1980 1981 1982 1983 1984 1985 1986 1987 1988 1989
Fiscal year of selection to E-7
Note: Fast, average, and slow promoters were calculated separately within Navyrating and year of E-7 promotion.
Figure 8 shows a clear pattern: well over 90 percent of sailors with slowE-7 promotions separate before reaching E-9. In contrast, a consider-ably smaller promotion of the fast-track sailors separate before reach-ing E-9. About 25 percent of this fast-track group stay and arepromoted to E-9.16
Next, we looked at those sailors who were promoted to E-9, still keep-ing them in our three quality groups. We wanted to know how long ittook each group to reach E-9, how long they stayed as E-9s, and whattheir total length of service was. We show this in figure 9 for those pro-moted to E-9 in 1985, 1989, and 1992.17
16. The average or middle group has separation rates between the fast andslow groups.
17. Why did we stop with E-9 promotions in 1992? The short answer is thatwe needed to let sailors complete their E-9 service and retire from theservice.Even with 1992 promotions, almost 100 sailors are still in theNavy. Thus, the years of service for the 1992 E-9 promotion cohortgroup will increase somewhat, but not enough to be visible in the figure.
20
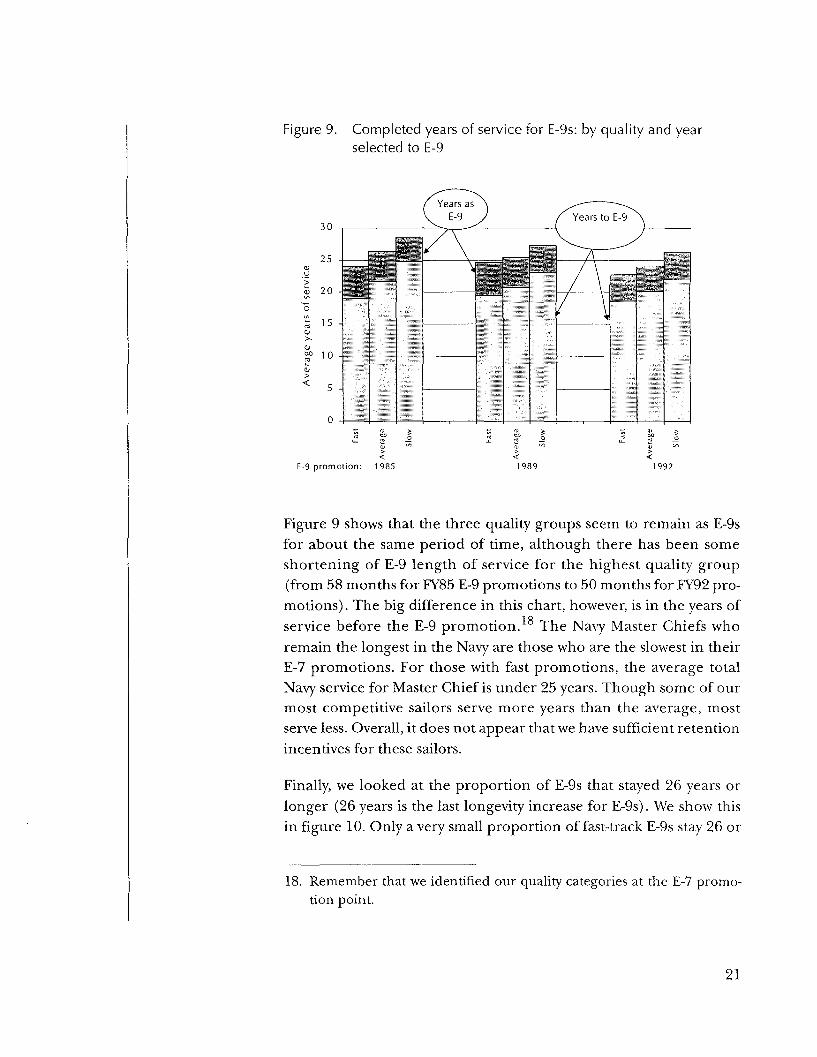
Figure 9. Completed years of service for E-9s: by quality and yearselected to E-9
30
E-9 promotion: 1989 1992
Figure 9 shows that the three quality groups seem to remain as E-9sfor about the same period of time, although there has been someshortening of E-9 length of service for the highest quality group(from 58 months for FY85 E-9 promotions to 50 months for FY92 pro-motions). The big difference in this chart, however, is in the years of
-i oservice before the E-9 promotion. The Navy Master Chiefs whoremain the longest in the Navy are those who are the slowest in theirE-7 promotions. For those with fast promotions, the average totalNavy service for Master Chief is under 25 years. Though some of ourmost competitive sailors serve more years than the average, mostserve less. Overall, it does not appear that we have sufficient retentionincentives for these sailors.
Finally, we looked at the proportion of E-9s that stayed 26 years orlonger (26 years is the last longevity increase for E-9s). We show thisin figure 10. Only a very small proportion of fast-track E-9s stay 26 or
18. Remember that we identified our quality categories at the E-7 promo-tion point.
21

more years; well over 50 percent of the slow promoters stay 26 or moreyears. (The percentages for those sailors with average promotion ratesstaying 26 or more years fall between the fast and slow promoters.)
Figure 10. Percentage of E-9s staying 26 or more years
80
60
40
20
1 00 - Q Fast promotion to E-7 QSlow promotion to E-7
1
I
1985 1986 1987 1988 1989 1990 1991 1992
Fiscal year of selection to E-9
Note: Fast, average, and slow promoters were calculated separately within Navyand year of E-7 promotion.
We think this empirical evidence indicates quite strongly that we donot have sufficient incentives to retain our highest quality E-9s. Com-bining these findings with the fact that E9s are supervising E9s whoare supervising E-9s leads us to propose consideration of an additionalgrade, E-10. Before going into this discussion in detail, however, let usmake a few comments about recent changes in military retirementand the retention of E-9s.
Recent changes in military retirementOther than seeking out more responsibility by moving to a moresenior billet, there are no monetary incentives for an E-9 to serve past26 years. Although retirement pay will increase by 2.5 percent for eachadditional year of service up to 30 years, the service member is usuallybetter off financially by retiring at 26 years of service and combininga civilian job with retirement pay. This will be increasingly true for ourmore educated senior enlisted.
22

What's more, we believe that recent changes to the retirement systemmay induce E-9s to leave the service even earlier than they do today.Most enlisted personnel who retire do so as soon as they are eligible—at 20 years of service—but that is not true for E9s, as we have seenfrom our earlier discussion of E-9 retirement patterns by service.Until very recently, retirement pay was based on some percentage ofthe member's highest base pay. This induced E-9s to stay for the lon-gevity "bumps" at 22, 24, and 26 months of service.
All service members who entered after 7 September 1980 will beunder some form of "high 3" retirement. High-3 retirements will belittle affected by these longevity increments. Under the prior system,a member only had to receive the higher pay for 1 month; underHigh-3, the member will need to receive the pay for 36 months to getthe full benefit of the increase. One month's service at a higher lon-gevity pay level will only represent l/36th of the pay on which themember's retirement is based. In short, longevity increases cannot beexpected to "hold" members under High-3 the way they could underthe older system.
19. If a member retired at 20 years of service, the retirement pay was 50 per-cent of the highest base pay. It increased by 2.5 percent of base pay foreach additional year of service, peaking at 75 percent of base pay for 30years of service.
23

THIS PAGE INTENTIONALLY LEFT BLANK
Why we need another rank: recommendationfor an E-10 pay grade
Promotion opportunities provide incentives both to work hard and toexcel. They also provide a sorting function for large organizations, asthe more able, talented, and energetic are pushed to the top.20 BethAsch and John Warner's excellent monograph, A Theory of MilitaryCompensation and Personnel Policy, stresses the importance of pay risingwith rank to provide incentives for retaining talent and ensuring max-imum effort. In their conclusions [7, p. 117], they state:
Those in higher ranks have fewer promotion opportunitiesleft to them—they are already near the top. The grade dif-ferentials need to be higher to induce individuals to supplythe efficient amount of effort. Higher pay in upper gradesincreases the likelihood of retaining the most ableindividuals.
No promotion opportunities exist after the E-9 promotion. Longev-ity increases are not large: 3.9 percent at 22 years of service, 3.7 per-cent at 24 years, and 4.6 percent at 26 years. For our most talented,early selections to the E-9 rank, these paltry increases in compensa-tion cannot be what is motivating them to stay in service. We are prob-ably relying on patriotism and a love of service to retain these people.Can we count on that in the future? The Master Chief Petty Officer ofthe Navy (MCPON) recently expressed concern about the outflow ofsome of his most capable enlisted into the Warrant Officer or Com-missioned Officer programs. Do we have enough of a "prize" in terms
20. The appendix discusses this theory in more detail.
21. The idea behind REDUX was to induce both officers and enlisted intolonger careers, and those arguments made for longer careers still hold.Here we are making a more specific argument: namely, that there is nosorting mechanism to induce the most able E-9s to stay to the currentservice limits.
25
of compensation "rank-prestige" to ensure that we retain top peoplein the enlisted ranks for these critical senior positions?
We would argue that we do not. We will never have an exact measureof personnel quality that would allow us to unambiguously state thatwe are losing our best personnel too soon. We did, however, get somesome information from our detailed analysis of Navy data. We prox-ied quality by promotion speed, dividing all E-7 promotions intothose that were promoted the fastest, the average, and the slowest fortheir promotion-year group and occupation. We then followed over100,000 of these E-7s, looking at who left, who got promoted, and attheir final lengths of service. Those we identified as fast track earlierin their careers will make up the largest proportion of the E-9 popu-lation later in their careers, but they also leave the Navy with thefewest years of service. In short, at least in the Navy, incentives are notsufficient to encourage the fast-track sailors to stay as long as otherswith slower promotion rates.
The 1999 Survey of Active Duty Personnel also reports that 34 percentof E-9s consider basic pay as the first or the second reason for "stayingin" and that another 36 percent of E-9s consider basic pay as the firstor second reason for "getting out." We suspect that fast-track individ-uals compose the largest group of those who think that pay is too low.
Large longevity increases for E-9s, or even another longevity increaseat 28 years of service, will work more to make all E-9s stay longer. Andthere is a real concern that the tenure of all E-9s is too short, as welose the experience gained over many years. Increasing overall E-9longevity, however, slows promotions, so that situation will requirecareful monitoring.
A drawback of longevity increases is that, because they are not tar-geted, they do little to encourage the best E-9s to stay longer. Our pri-mary concern in this paper is to propose a mechanism that will retainour most competitive E-9s.
26

The E-10 grade
Cost
Current law restricts the E-8/E-9 grades to 3 percent of the enlistedforce and the E-9 grade to no more than 1 percent of the enlistedforce. We would propose changing the law to the following:
• Restrict the grades of E-8/E-9/E-10 to 3.2 percent of theenlisted force
• Restrict the grade of E-10 to no more than 0.2 percent of theenlisted force
— This would imply that the maximum number of E-1 Os wouldbe about 300 in the Marine Corps and about 600 in theNavy, Army, and Air Force.
Just as in current practice, each service would need to determine (upto the 0.2-percent limit) the number of E-10 positions and the alloca-tion of these positions among SEAs and technical personnel. Techni-cal experts are now being appointed to management positions in the:private sector. For example, the New York Times reports that Microsoft,Cisco Systems, IBM, Sun Microsystems, and Xerox are rewardingtheir top engineers and scientists with titles and financial rewards sim-ilar to those received by vice-presidents in managerial positions [8].
An appropriate increase in base pay, perhaps 10 percent, wouldaccompany the promotion to E-10. Because the number of E-lOswould be small, perhaps slightly over 2,000 individuals, the cost wouldbe small. The payoff would be large.
27

THIS PAGE INTENTIONALLY LEFT BLANK
SummaryIn 1958 we added two grades, E-8 and E-9, to the enlisted grade struc-ture. The primary reason was that the levels of responsibility were toovaried in the E-7 grade. More than 40 years later, we face the same sit-uation. We identified the following challenges for the E-9 grade:
• The E-9 grade cannot adequately distinguish among the vary-ing levels of responsibility represented by E-9 billets. Today wehave E-9s supervising E-9s supervising other E-9s.
• E-9 compensation is based on overall years of service. E-9s whoare promoted faster than average have fewer years of servicewhen they reach the E-9 grade than do those with slower pro-motion rates. This creates a pay inversion, with the slower pro-motees earning more than the faster promotees.
• Years of service at retirement is smallest for those E-9s who werefast-trackers at the E-7 grade. We identified fast-trackers withineach Navy occupation. Thus, this analysis says that in all occu-pations our most competitive E-9s are retiring the earliest.While this empirical work is for the Navy only, we suspect thatthe same pattern may be found in the other services. Once thegrade of E-9 is reached, pay increases consist of only modestawards for longevity. These small longevity increases providelittle retention incentive for our most competitive E-9s.
• Increasing competition from the civilian sector combined withlonger overall work lives and higher educational attainment ofE-9s suggest that the problems we have identified in retentionof our most competitive E-9s can be expected to continue.
We have proposed an E-10 paygrade, with a limit of 0.2 percent of theenlisted force. We believe that this new grade would induce addi-tional years of service out of those senior enlisted who believe they aremost competitive for the new grade of E-10. These are, quite simply,
29
the most motivated and the best performers. We suspect that the verybest of the enlisted E-9s would continue to serve, motivated by thetangible prospect of being selected for the new grade. The new gradewould offer monetary compensation, recognition, and the opportu-nity for our strongest senior enlisted personnel to compete for onemore level of increasing responsibility. The latter is probably the mostimportant motivator for those who have served their country with acareer in the armed forces. In short, on the assumption that the ser-vices would promote only their very best to E-10, the strength of thearmed forces would be improved and the nation as a whole wouldbenefit from this change. While the benefits of this additional gradewould be large, the monetary cost would be very small.
30

Appendix
Appendix: Tournament literature in,1economics
In many civilian occupations, pay is determined primarily by somedirect measure of input or productivity, such as hours worked (input)or units of production or dollars of sales (output). In other occupa-tions, however, it is difficult to measure production directly because itmay be a function of a combination of the worker's effort/capabilityand factors beyond the worker's control. In such occupations, partic-ularly those in which only subjective measures of performance andproductivity are available, firms reward employees with promotions—increases in both pay and status, awarded to a limited number of "top"employees. With respect to productivity measures and incentives,these occupations more closely resemble the military than those inwhich direct measures of output are appropriate. Therefore, thereward mechanisms in these occupations can be profitably comparedto military.
This practice of using promotions that involve both pay and status hasbeen modeled as a "tournament" in which the top N employees are"winners" (Lazear & Rosen, 1981; Lazear, 1999). Examples of tour-nament pay in the private sector include promotion of associates topartner in law and accounting firms, "up or out" systems in consultingfirms, and the academic tenure system in some universities (i.e., thosethat promote their own assistant professors rather than hire fromother universities).
1. This appendix was written by Robert A. Book.
2. Edward P. Lazear and Sherwin Rosen, "Rank-Order Tournaments asOptimum Labor Contracts," The Journal of Political Economy, Vol. 89,Issue 5 (Oct. 1981): 841-864; Edward P. Lazear, Personnel Economics: PastLessons and Future Directions, Feb. 1999 (National Bureau of EconomicResearch Working Paper 6957).
31
Appendix
The military promotion system for any given rank can be modeled asa tournament. In fact, the whole system can be considered a multi-stage tournament like the model described in Rosen (1986).3
One advantage of tournaments over direct-measure compensationsystems as a motivator of employees is that tournaments can be imple-mented when direct performance measures are imprecise but rela-tive comparisons are not too difficult. With no obvious directmeasures of performance (such as "number of units manufactured"or "dollars of sales"), it maybe extremely difficult to say, for example,"Employee A is performing at level X and therefore should receive asalary of $Y." Yet, it might be easy to rank employees and say,"Employee A is performing better than Employee B; therefore, wewill promote Employee A." Tournaments also save the time of manag-ers: with many promotion "slots" (but less than the number of eligibleemployees), it is often easy to determine the outcome for large num-bers of cases because many employees are clearly either superior orinferior. Management then will need to expend significant effort inonly a few "borderline" cases.
Employees may also prefer tournaments to direct compensation, par-ticularly if output is partly determined by effects common to allemployees in the organization (as opposed to effects related to indi-vidual effort). This will certainly be the case if employees are risk-averse and factors beyond the control of employees are significant.All of this applies to our military personnel system and the dominantimportance of promotions in the compensation system.
One disadvantage of the tournament system is that the best employ-ees likely have the best outside options, and they might leave the orga-nization if they perceive that their rewards are capped at a lower levelthan their ability warrants. These problems become even more severewhen all promotion opportunities have been exhausted. Once anindividual reaches the highest level of an organization, only pride inajob well done motivates the employee, and this may not be sufficientin all cases. (In the civilian sector, this effect may help explain the
3. Sherwin Rosen, "Prizes and Incentives in Elimination Tournaments,"The American Economic Review, Vol. 76, Issue 4 (Sep. 1986): 701-715.
32

Appendix
very high financial rewards—and low tenure-in^job—of corporateCEOs.) At the top stage of a multistage tournament, such as the mili-tary promotion system, this problem is particularly severe because itis the very best employees, in the most important positions, who arethe most likely to leave.
How many levels, then, should be in the tournament? How does onetell if another competition (another promotion) is needed? The lit-erature does not contain exact answers, but it suggests that the mili-tary may not have sufficient levels in the tournament to retain themost talented.
At the time of an E-9 promotion, the fast-trackers in each service willhave about 10 years before the 30-year service limit is reached. Adecade with no prospect of promotion and only small, automatic lon-gevity increases (which is to say, raises independent of performance),does not seem especially motivating for top performers. Further-more, the most capable E-9s are not only those most likely to be dis-appointed by the lack of promotion opportunities, but also those withthe best options for employment outside the military. This combina-tion of factors suggests that another tournament—competition forpromotion to another grade (E-10)—might significantly improve theretention of the very best E-9s.
33

THIS PAGE INTENTIONALLY LEFT BLANK

References[1] E. F. Fisher, Jr. Guardians of the Republic: History of the Noncom-
missioned Officer Corps of the U.S. Army. 2nd ed. Mechanicsburg,PA: Stackpole Books, 2001
[2] John M. Collins. "The Care and Cleaning of NCOs: A CriticalSurvey of Destructive Policies and Practices Which HaveShaped the Army Noncommissioned Officer Corps Since1939." Thesis, Industrial College of the Armed Forces, Mar1967
[3] Defense Advisory Committee on Professional and TechnicalCompensation, "Military Personnel: A Report and Recom-mendations for the Secretary of Defense." In A Modern Conceptof Manpower Management and Compensation for Personnel of theUniformed Services, Vol. I, May 1957
[4] Annual Report of the Secretary Defense and Annual Reports of theSecretary of the Army, Secretary of the Navy, and Secretary of the AirForce: July 1, 1958 to June 30, 1959. Washington, DC: U.S. Gov-ernment Printing Office, 1960
[5] S. N. Kirby and H. J. Thie. Enlisted Personnel Management: A His-torical Perspective, 1996 (RAND, National Defense ResearchInstitute, RAND Report No. MR-755OSD)
[6] Martha E. Koopman et al. Compensation Strategy for the FutureForce, Sep 2000 (CNA Research Memorandum D0002082.A1)
[7] Beth J. Asch and John T. Warner. A Theory of Military Compen-sation and Personnel Policy, 1994 (prepared for the Office of theSecretary of Defense by National Defense Research Institute,RAND)
[8] "Microsoft To Reward Its Technical Elite." New York Times, 3 Jul2000, p. C5
35

THIS PAGE INTENTIONALLY LEFT BLANK
List of figuresFigure 1. Sergeants Major (Senior Enlisted Advisors):
MARFORLANT (Infantry Portion). . . . . .
Figure 2. Master Gunnery Sergeants (Infantry OperationsChiefs): MARFORLANT (Infantry Portion) . . . . . 7
Figure 3. Experience distributions for E-9s in 1999 . . . . . . 9
Figure 4. Years of service at promotion to E-9 in 1999 . . . . 10
Figure 5. E-9 separations (retirements) in FY 1999 . . . . . . 13
Figure 6. E-9s are increasingly college graduates. . . . . . . . 15
Figure 7. E-9s with BA/BS or higher degrees. . . . . . . . . . 16
Figure 8. Fast- and slow-track E-7 sailors: How manyseparate before reaching E-9? . . . . . . . . . . . . 20
Figure 9. Completed years of service for E-9s: by qualityand year selected to E-9 . . . . . . . . . . . . . . . . 21
Figure 10. Percentage of E-9s staying 26 or more years . . . . . 22
37

THIS PAGE INTENTIONALLY LEFT BLANK

Distribution listResearch Memorandum D0005072.A2
SNDL
OUSD (P&R)Attn: Dr. Curds Gilroy
Dr. John EnnsOUSD (Compensation)
Attn: Captain Chris KopangDr. Saul FleeterMr. Chuck Witschonke
BUPERS Mfflington, TNAttn: PERS-1
PERS-6USNA Annapolis, MDNAVPGSCOL Monterey, CANAVWARCOL Newport, RIHQMC (M&RA)
Attn: DC (M&RA)MPMP (Military Policy Section)
Master Chief Petty Officer of the Navy (MCPON)Master Chief Petty Officer of the Coast Guard (MCPOCG)Sergeant Major of the Marine CorpsChief Master Sergeant of the Air ForceSergeant Major of the Army
OPNAV
NlN13N13TN130N130B
39