Senate Committee on the Economic Status of the … Competitiveness ... Internal Equity ... The...
12
ALMANAC Supplement May 6, 2014 www.upenn.edu/almanac 1 SENATE Senate Committee on the Economic Status of the Faculty 2012-2013 Annual Report Contents I. Introduction………………. . ........................................................................................................................................... 2 II. Resources for Faculty Salaries and Annual Increases ...................................................................................................... 2 III. Penn Faculty Salaries: External Comparisons.................................................................................................................. 2 A. Comparisons with Growth in the Consumer Price Index (CPI) ................................................................................ 3 B. Comparisons with Peer Universities ......................................................................................................................... 3 IV. Penn Faculty Benefits ...................................................................................................................................................... 4 V. Penn Faculty Salaries: Internal Comparisons ................................................................................................................... 4 VI. Salary Variability by Gender ............................................................................................................................................ 4 VII. Conclusions ………. ........................................................................................................................................................ 5 A. Economic Status of the Faculty ................................................................................................................................. 5 1. External Competitiveness .................................................................................................................................. 5 2. Internal Variability ............................................................................................................................................. 5 B. Conditions of Concern .............................................................................................................................................. 5 1. External Competitiveness .................................................................................................................................. 5 2. Internal Equity ................................................................................................................................................... 5 VIII. SCESF Communication with Provost Office .................................................................................................................. 5 A. SCESF Requests in Preparation of the SCESF Report and Responses ....................................................................... 5 B. SCESF Recommendations and Questions for the Administration............................................................................... 5 1. Salary competiveness 2. Faculty benefits 3. Review of Compensation for Alternate Faculty Tracks IX. Members of the 2013-2014 Senate Committee on the Economic Status of the Faculty .................................................. 6 X. Tables………. ................................................................................................................................................................... 6
Transcript of Senate Committee on the Economic Status of the … Competitiveness ... Internal Equity ... The...
ALMANAC Supplement May 6, 2014 www.upenn.edu/almanac 1
SENATE
Senate Committee on the Economic Status of the Faculty
2012-2013 Annual Report
Contents
I. Introduction………………. . ........................................................................................................................................... 2
II. Resources for Faculty Salaries and Annual Increases ...................................................................................................... 2
III. Penn Faculty Salaries: External Comparisons .................................................................................................................. 2
A. Comparisons with Growth in the Consumer Price Index (CPI) ................................................................................ 3
B. Comparisons with Peer Universities ......................................................................................................................... 3
IV. PennFacultyBenefits ...................................................................................................................................................... 4
V. Penn Faculty Salaries: Internal Comparisons ................................................................................................................... 4
VI. Salary Variability by Gender ............................................................................................................................................ 4
VII. Conclusions ………. ........................................................................................................................................................ 5
A. Economic Status of the Faculty ................................................................................................................................. 5
1. External Competitiveness .................................................................................................................................. 5
2. Internal Variability ............................................................................................................................................. 5
B. Conditions of Concern .............................................................................................................................................. 5
1. External Competitiveness .................................................................................................................................. 5
2. Internal Equity ................................................................................................................................................... 5
VIII. SCESFCommunicationwithProvostOffice .................................................................................................................. 5
A. SCESF Requests in Preparation of the SCESF Report and Responses ....................................................................... 5
B. SCESF Recommendations and Questions for the Administration ............................................................................... 5
1. Salary competiveness
2.Facultybenefits
3. Review of Compensation for Alternate Faculty Tracks
IX. Members of the 2013-2014 Senate Committee on the Economic Status of the Faculty .................................................. 6
X. Tables………. ................................................................................................................................................................... 6

ALMANAC Supplement May 6, 20142 www.upenn.edu/almanac
SENATE
I. IntroductionThe Senate Committee on the Economic Status of the Faculty (SCESF)
is charged by the “Rules of the Faculty Senate” to:•Gatherandorganizedataonfacultysalariesandbenefits;•Issueanannualreportontheeconomicstatusofthefaculty;and•Represent thefacultyin thedeterminationofUniversitypolicyonsal-
ary issues.The focus of this report is the current economic status of the faculty as
based on salary data provided to the committee by the Vice Provost’s of-fice.Unlessotherwisespecificallystated,facultysalaryinformationdis-cussed in this report refers to the aggregated “academic year base sala-ry” of faculty members whether salaries are paid from General Operat-ing Funds and/or from Designated Funds.1 Salary data from the Perelman SchoolofMedicineincludeonlybasicscientists.Further,dataonsalariesofclinicianeducatorsfromMedicine,DentalMedicine,VeterinaryMed-icine,Nursing,andSocialPolicyandPracticewerenotprovidedtothecommittee,andthereforewerenotreviewed.Limiteddataonbenefitswasprovided,andthusdiscussionofthesedataisalsolimited.
The report focuses on three major topics:•FacultysalarysettingprocessatPenn:sourcesoffundsforfacultysala-
ries and how annual salary increase decisions are made.•Externalcomparisons:thecompetitivenessoffacultysalariesatPennin
comparison with faculty salaries at other universities.•Internalcomparisons:variabilityoffacultysalarieswithinPenn.Each of these three topics is addressed in a separate section of the re-
port(sectionsII,III,andV).FacultybenefitsareaddressedinrelationtoavailabledataonmeansalaryandbenefitsforFullProfessors(sectionIV).Section VII describes the SCESF’s overall conclusions about the econom-ic status of the faculty. Section VIII details the SCESF’s provisional ob-servations and recommendations.
Incarryingoutitscharge,SCESFiscognizantofPenn’ssalarypolicyfortheperiodasstatedbythePresident,Provost,andExecutiveVicePres-ident and published in AlmanacApril10,2012,www.upenn.edu/almanac/volumes/v58/n29/salary.html The University of Pennsylvania’s merit in-creaseprogramisdesignedtorecognizeandrewardfacultyandstaffbypayingmarketcompetitivesalariesinafiscallyresponsiblemanner,withmerit increases based on market trends and economic conditions. The sal-ary guidelines are intended to reward valuable contributions of faculty and staff to the University’s mission and excellence.
StatisticaldatainthisreportwereprovidedbytheOfficeofInstitution-alResearchandAnalysisandtheOfficeoftheViceProvostforFaculty.The data provided preserve anonymity and explicitly exclude any infor-mation that would make it possible to identify individual faculty salaries.
Asinpreviousyears,SCESFhasexaminedthecurrentdataandalsoconsidered trends in faculty compensation over the past five to sevenyears.Wenotethatthemeansalaryincreaseforfacultyof2.9%reflects,tosomeextent,thecontinuedimprovementoftheeconomicclimateandthatPenn faculty continue to receive salaries generally commensurate with peerinstitutions.However,wealsonotethatthemeansalaryincreaseforfacultyatPennforthecurrentfiscalyearsignificantlytrailsthemeanper-cent increase in compensation for those senior administrators whose sal-ariesarepublicallyavailable,whichaveraged10.4%forFY2011-2012,according to the most recent available data from Form 990 reporting (in-formationpublicallyavailableonlinebysearchingForm990andPenn;orsee www.citizenaudit.org/231352685/).
Thisyear,theanalysissuggeststhatingeneral,theeconomicstatusofthe faculty has continued to slowly improve following the fallout from the economic downturn of 2008-2009. While Penn’s position in regard to the most relevantpeer institutions (Ivies, IviesPlus,andAAUDE)remainsrelatively stable, some peer institutions are pulling significantly ahead.There remain some focal and persistent issues that can clearly limit Penn’s abilitytocompetewithpeersforthebesttalent.Internally,thereremainsconsiderable heterogeneity in salary increases across schools and within rank.Insomefields,thesalarygapappearstobegrowingovertime,dif-1 Academic base year salary is salary that is paid for the normal academic duties of a standing faculty member (teaching, committee service, research). At Penn, the “academic base year salary” is a faculty member’s compensation for the nine-month academic year, although it is typically paid out in twelve equal amounts in a month-ly paycheck. The only exception occurs in the health care schools, which have some or all standing faculty on a 12-month, or “annualized” base. All salaries reported on a 12-month basis have been adjusted to be comparable with the salaries reported on a 9-month basis. We note that “summer money” is paid routinely, albeit at varying lev-els, in some parts of the University. Such “summer money” is not included in these base year salaries.
ferentiallyaffectingfacultyinspecificschools,particularlyattherankofAssistant Professor. We also raise concern about the persistent gender in-equity in faculty salaries at Penn. While some of this inequity may stem from the relative concentration of women in more poorly compensated fieldsand thedearthofwomeninmoregenerouslycompensatedareas,the persistence of this wage gap between male and female faculty over time and at all faculty levels should be an issue of concern to the univer-sity community.
WeencouragethePresident,Provost,Deans,andthefacultyatlargeto continue to closely monitor faculty compensation across the university in order to maintain Penn’s competitive position. Penn’s continued rank-ing as an outstanding university requires academic excellence across all schoolsanddisciplines,andthisexcellenceisbaseddirectlyonthequalityof the faculty both recruited to and retained by our university.
II. Resources for Faculty Salaries and Annual IncreasesFaculty salaries at Penn are the product of a two-step process:1. Setting Salary Levels: Faculty salary levels are set at the time of initial
appointment by the dean of the faculty making the appointment.2. Annual Salary Increases: Faculty salary levels are normally increased
annually through a process described below. Such salary increases are ordi-narily based on academic merit. Some annual increases are also the result of promotion in rank and of equity adjustments. Others may be direct responses countering outside offers or addressing other retention issues.
Funding for faculty salaries comes primarily from each school’s op-eratingbudget.Nocentralfundexistsforfacultysalariesingeneral.Re-sources in each school are raised in accordance with the principles of Penn’s Responsibility Center Management (RCM)2.Additionally, sub-ventions are distributed to schools by central administration. Such sub-ventionsaremadeforavarietyofreasons.Forexample,subventionmaybe made in recognition of external effects of costly actions undertaken byindividualschoolstothebenefitofbroaderuniversity-wideinterests.
Using available resources, the dean of each schoolmakes a certainamount available for faculty salaries. Particular aspects of faculty sala-ries for which these funds are used include sustaining existing faculty appointments, providing annual salary increases for continuing facultymembers,andcreatingsalaryfundingfornewfacultypositions.Inaddi-tion,allschoolsmustprovidefundstocoveremployeebenefits.Theem-ployeebenefitsrateiscurrentlyatabout30%ofsalary.
Annual salary increase recommendations for continuing faculty mem-bers are made by Department Chairs (in schools with departments) and by Deans. These recommendations are based on merit and are subject to gen-eral review and oversight by the Provost (see the statement of the “Salary Guidelines For 2012-2013” as published in Almanac,April10,2012).InconsultationwiththeCouncilofDeans,thePresident,Provost,andExec-utive Vice President establish parameters for the “pool percentage” used in determining salary increases.
In thispast academicyear,deanswithin the twelve schoolswereau-thorizedtoawardassalaryincreasesapoolofupto2.9%oftheacademicyear 2011-2012 salaries of continuing faculty members. The salary increase rangeforindividualsalarieswas0%to5.0%.Asisnowusualpractice,thedeans were asked to consult with the Provost about any individual increase below1%for specificallynon-meritoriousperformance.Thedeanswereasked to address equity through a request that they “give careful consider-ation to salary adjustments for faculty members who have a strong perfor-mance record but whose salary may have lagged behind the market.” Salary increases in excess of 5.0% likewise required discussion with the Provost.
III. Penn Faculty Salaries: External Comparisons
MeanPennfacultysalaries(i.e.,academicyearbasesalaries)arecom-pared annually with three external indicators: (a) growth in the Consumer PriceIndex(CPI),(b)averagefacultysalariesbyrankatotheruniversitiesasreportedbyannualsurveysconductedattheschool/arealevel,and(c)average salaries of Full Professors in a more limited set of research uni-versitiesidentifiedasmostcomparabletoPennwithinthelargergroupofuniversities submitting data to the “Annual Report on the Economic Sta-tus of the Profession” compendium issued by the American Association of University Professors (AAUP). These indicators and the resulting com-parisons are discussed within this section.
Tables1and2referbroadlytoPennfaculty,whethertheycontinuedin2 For a more detailed explanation of Penn’s Responsibility Center Management mod-el, see http://www.budget.upenn.edu/rcm/index.shtml
ALMANAC Supplement May 6, 2014 www.upenn.edu/almanac 3
thesamerankorwerepromotedtoahigherrank.Individualswhowere,for example, promoted fromAssistant toAssociate Professor, effectiveJuly1,2012,areincludedamongtheAssociateProfessorsforthe2012-13yearinTable1.Thus,salaryincreasesreceivedduetopromotionareincluded in the percentage changes in salaries reported for Associate Pro-fessors in 2012-13. The same is true for those promoted at that time from AssociatetoFullProfessor.Incontrast,inTables3and6through12theinformation refers only to faculty members who continued in the same rank during 2012-13. Including salaries of faculty who changed ranks as inTables1and2distortstheoverallpicturetosomeextentbyinflatingthemeanincreasesreportedinthesetables.However,medianvalueswillbe less affected by the presence of outliers created by salary increases awardedonpromotion.Importantly,onlypercentagesalarychangeisre-portedinTables1to3and6to8;Tables9,10,11,and12reportactualsalary levels.
Tables 4 and 5 provide information about relative external rank in comparisons of Penn faculty salaries with those at the other universities surveyed in the designated rank on the date of the snapshot used to com-pile the data reported to the American Association of Universities Data Exchange (AAUDE) or the AAUP.A. Comparisons with Growth in the Consumer Price Index (CPI)3
Mean and median salary increases for continuing faculty for Fiscal Year2012-13averagedoverallschools,areshowninpercentagechange,overallandbyrank,inTable1.Table1alsogivesdatafortwomeasuresofinflation(theUSCityAverageCPIandthePhiladelphiaCPI)forthesametime period as well as the Penn “pool” salary increase of 2.9%.4
Table 1 shows that the all-ranks median salary increase was 2.9% and the all-ranks mean increase was 4.3%. Median increases were consistent-ly2.9%atallacademiclevels,whilemeansweremorevariable,reflectingin part the effects of including promotion-associated raises in this data set. The median increase of 2.9% exceeded the increase in the CPI calculated eitherforPhiladelphiaspecifically,orasanaverageforUScities.
Table 2 compares the percentage of continuing faculty whose annual salary increases on a percentage basis exceed the growth in the Philadel-phia-specificCPI,brokenoutbyschoolanddiscipline.TheSASnumbersaredisaggregated into threedisciplinarygroupings—Humanities,SocialandNaturalSciences.Threeschools–Annenberg,DesignandSocialPolicyand Practice—achieved increases in excess of the growth in Philadelphia CPIfor100%offaculty.Ofinterest,thiscontinuesatrendfromlastyear.Incontrast,asubstantialfractionoffacultyinbothDentalMedicineandVeterinaryMedicinereceivedraisesthatdidnotkeeppacewithinflationintheregion–30.8%offacultyinDentalMedicineand37.1%offacultyinVeterinaryMedicine.Again,thiscontinuesatrendseeninlastyear’sdata.
Table 3 provides parallel information limited to Full Professors con-tinuinginrank,inordertoavoiddistortionscausedbyhigherraisesasso-ciatedwithpromotions.Again,thetwoschoolsfallingbehindinfacultycompensationareDentalMedicineandVeterinaryMedicine;inthelaterschoollessthan40%ofFullProfessorsreceivedraisesexceedinginfla-tionary growth in the Philadelphia area.
TheSCESFrecognizes that thereare legitimate reasons for individ-ual faculty members to be awarded increments less than the growth in theCPI.Inasmalldepartmentorschool,afewpromotionsorcompeti-tive market adjustments needed to retain valued faculty members may re-quireadisproportionateshareoftheannualpool,leavinglessavailabletoaddresssalaryincreasesofotherfacultymembers.Finally,somefacultymembersmaynotdisplaysufficientmerittojustifyanincrementexceed-ing theCPIgrowth.Nonetheless, to theextentpossible, individual fac-ultymembersshouldreceivecumulativesalaryincreasesequalto,orex-ceeding,growthintheCPIwhenconsideredoveranyextendedperiodun-less their performance has been unsatisfactory over a substantial portion 3 The consumer price index (CPI) refers to prices for a basket of goods and servic-es purchased by “average workers”. There are questions about how well this index captures quality changes in goods and services (i.e., if it understates quality improve-ments as suggested by some observers then it overstates price increases for goods and services of a given quality) and how well this index captures goods and services consumed by faculty (i.e., if faculty consume goods and services that have had great-er quality improvements for which corrections have not been made in the CPI than do average workers then faculty salaries in purchasing power terms have increased more than would be indicated by a comparison in the reported CPI). Nevertheless, use of the CPI is widespread and helps give some perspective. 4 The fiscal year refers to the year starting on 1 July and continuing through June 30 of the next calendar year. This report refers to the second of the two calendar years cov-ered in a fiscal year. For example, the FY 2013 refers to the fiscal year (or academic year) starting on July 1, 2012 and continuing through June 30, 2013.
ofthatperiod.Iftheydonot,asisoftenthecase,thesalaryincreaseisthen apparently inequitably low. A persistent pattern of increases that do not exceed relatively moderate growth in the CPI or of markedly inequi-table increases as shown in larger differences between mean and median increases merits attention given likely impacts on faculty morale and the risktotheuniformstandardofexcellenceexpectedacrossallfieldsandschools at Penn. B. Comparisons with Peer Universities
The Association of American Universities Data Exchange (AAUDE) is a source of information about faculty salaries at peer universities. The Association of American Universities (AAU) is comprised of 60 public and private research universities in the United States and two in Cana-da.TheAAUincludesseveralIvyLeagueinstitutions(e.g.,Penn,Brown,Harvard, Princeton, Cornell andYale), other private universities (e.g.,Brandeis, Rice, Emory, Vanderbilt), public flagship universities (e.g.,PennStateand theUniversityofMichigan), andotherpublicuniversi-ties (e.g.,MichiganState,UniversityofCalifornia-DavisandUniversi-ty of California-Irvine).5 Penn uses AAUDE data for annual salary com-parisons.
Mean faculty salariesatPenn,disaggregatedby rankandbyschooland disciplinary area are compared annually with AAUDE data. Table 4 provides these comparisons by rank for each of the following schools and areaswithinspecificschools:Annenberg,DentalMedicine,Design,Engi-neering&AppliedScience,GraduateEducation,Humanities(SAS),Law,Medicine-Basic Science, Natural Science (SAS), Nursing, Social Poli-cy and Practice, Social Science (SAS),VeterinaryMedicine,Wharton-Business & Management (i.e. all of Wharton except for Public Policy and Statistics),Wharton-PublicPolicyandWharton-Statistics.Table4showscomparisonsfromFall2007throughFall2012andsituateseachschoolorarea relative to a comparison set. Penn faculty compensation ranks at or nearthetopofthisbroadsetofuniversitiesinonlyaveryfewareas,mostnotablyinAnnenberg,NursingandWhartonattheFullProfessorlevels.Pennrankswithinthetop25%inmostareasatalllevels,althoughitmustbe noted that this peer group includes both public and private universities.
ThereareonlyafewfieldswherePennlagssignificantlybehindourcompetitors in regard to competitive compensation for faculty. Some of thesefieldsareonlyslightlyoutsidethetop25%cutoffusedhere,includ-ing Engineering & Applied Science and Social Policy & Practice at the FullProfessorlevel.Here,arelativelyminorupwardadjustmentinfacul-tysalarieswouldbesufficienttomovePenntothetoptier.
However,strongareasofconcernarealsoidentifiedbythiscompari-son.Acrosstheboard,attheFull,AssociateandAssistantProfessorlevels,faculty in Veterinary Medicine are under-compensated compared to their peers.Thetrendovertimeisnotfavorable,asfacultyinthisfieldcontinueto fall behind relative to their peers. Also remarkable is the relatively low levels of compensation provided to Assistant Professors in Graduate Edu-cation,HumanitiesandNaturalScience,thelaterrankingatthe40thper-centile. It is unclear how Penn can compete effectively for the best young faculty in these disciplines without a more aggressive compensation struc-ture.Overall,thelackofmovementinrankingandcontinueddeclinesinsome relative rankings over the past two years deserve attention.
Table 5 compares the mean salaries of all Full Professors at Penn with those at a small and select group of research universities based on data ob-tainedbythePennOfficeofInstitutionalResearchandAnalysisfroman-nual salary surveys conducted by the American Association of Universi-ty Professors (AAUP) published in The Chronicle of Higher Education. To make meaningful and fair comparisons of Penn salaries with those at otheruniversities,thefollowingfivecriteriawereusedtoselectcompari-son universities: (a) be included in the Research I category of the Carne-gieClassificationSystem,(b)offerabroadarrayofPhDprogramsinartsandsciencesdisciplines,(c)includeatleasttwoofthreemajorprofession-alschools(law,business,engineering),(d)notincludeaschoolofagricul-ture and (e) have a composite academic reputation rating greater than 4.0 (onafivepointscale)inaratingsystemreportedbyUS News and World Report.6 The17 researchuniversitiesmeeting all five of these criteriaareidentifiedinthefirstcolumnofTable5.Inaddition,asPrincetonandNYUareconsideredbytheSCESFasmaincompetitorsofPennforfac-5 For a complete list of the member institutions, see the AAU website http://www.aau.edu/about/article.aspx?id=54766 A composite rating was constructed by computing the mean of three separate aca-demic reputation ratings: a general rating, a mean rating of key PhD programs, and a mean rating of key professional schools.

ALMANAC Supplement May 6, 20144 www.upenn.edu/almanac
SENATE
ulty,thesetwoinstitutionsarealsoincludedinthecomparisonshowninTable 5 in the full report.
Importantly,however,thecommitteereasonedthatthemorerelevantpeer group for Penn is the subset of highly competitive private research universities,includingIvyLeagueschoolsaswellaspremierprivateuni-versitiesofsimilarcaliber(Stanford,Duke,NYU,Chicago,etc.).Whilepublic universities such as Berkeley and the University of Michigan are clearlyofoutstandingacademiccaliber, theseschoolscurrentlyfaceis-sues and constraints related to public funding not fully shared by private universities. Thus we provide comparisons of mean academic base sala-ries for full professors to a more limited peer group in the revised Table 5 foundintheExecutiveSummary,whilethecompletedatasetisincludedin Table 5 of this report.
The relative standings of mean salaries of Penn Full Professors over thepastsevenyearsarepresentedinTable5.Inthistable,universitiesarelisted in rank order (high to low) by mean salary for full Professors for the mostrecentacademicyear(2012-13).ThemeansalaryatPennislisted,along with the percentage difference between each comparator universi-tyandPenn.Columbiacontinuestoleadinthismetric,followedbyStan-ford.Ofnote,thegapbetweenmeanfacultysalariesforthesetwouniver-sitiesandPenncontinuestowiden,atrendthathascontinuedsince2008.
Pennranks7/19inthistable.However,itshouldbenotedthat7/8ofthelowestrankedschoolsinthistablearethe“publicIvies”,theflagshipstateuniversitiesthatincludeBerkeley,Michigan,andVirginia.Thesepublical-ly funded schools have been particularly hard hit by pressures on govern-ment funding in the economic downturn of 2008 and the subsequent recov-ery.Forthisreason,thecommitteeconsidersthesubsetofprivateresearchuniversitiestobeamoreaptcomparison,asshowninthemodifiedTable5includedintheExecutiveSummary.Amongthispeergroup,Pennranks7/12,consistentlyatthemiddleofthepackratherthanleading.
IV. Penn Faculty BenefitsTheroleoffacultybenefitsasapartofcompensationisanissueraised
inlastyear’sreport,andremainsanissueofinteresttomostfacultyattheuniversity.However,insufficientdatawereprovidedtothecommitteetoallowproductiveanalysis.Further,itisdifficulttocollectparalleldatasetsfromotheruniversities,asthereseemstobevariabilityinwhatisexplic-itlyincludedinthesecalculations.Thus,itwasnotpossibleforthecom-mitteetoobjectivelycomparethebenefitsreceivedbyfacultyatPenntothose granted by other peer institutions.
However, SCESF would like to emphasize that benefits, includingmedicalanddentalinsurance,retirement,tuitionassistanceandsabbaticalsupport,remainanessentialandhighlyvaluedcomponentofthecompen-sationpackageforfacultyatalllevels.Acompetitivebenefitspackageisakeyaspectinmaintaininganoutstandingfaculty,andthusmaintainingPennasatop-rankeduniversity.LastyeartheProvost’sOfficeagreedthataperiodic,systematicreviewoffacultybenefitswaswarranted,andpro-posed a review by the Division of Human Resources every 5 years. The committee feels this review should be initiated promptly.
V. Penn Faculty Salaries: Internal ComparisonsSalary equity within the university was examined by considering a se-
ries of data tables showing salary increases on a percentage basis for the ranksofFull,AssociateandAssistantProfessor (Tables6,7and8),aswell as comparisons of mean and median salaries at these ranks (Table 9) brokenoutbyfieldandschool.
In regard to annual raises,while themedian for the university as awhole was 2.8%, the range across schools for the Full Professor rankspanned from a low of 1.5% (Veterinary Medicine) and 2.0% (Basic Sci-ences in the Medical School) to a high of 4.0% for Graduate Education (Table6).AttherankofAssociateProfessor,againVeterinaryMedicineandMedicine-BasicScienceswereonthelowend,with1.5%and2.0%,respectively,whilemost schoolswere clustered between 2.8 and 3.0%(Table7).Table8shows that forAssistantProfessors,annual increasesranged from 2.0% (Veterinary Medicine) to 3.5% (Design).
While some of this variability may be attributed to budgeting restric-tions in schools under strong financial pressure, it is unclearwhy oth-er schools, especiallyMedicine, provided such limited annual raises totheirfacultythisyear.Specifically,the2.0%medianincreaseinsalariesfor faculty at all levels within the basic science departments in the Medi-
cal School can be compared to the 13.5% increase in annual compensation for 2011-12 (the most recently available information) awarded to senior administrators within the school whose salaries are publically available onlinethroughForm990reporting(forexample,seehttp://www.citizen-audit.org/231352685/). Data on salaries within the clinical departments werenotprovidedtothecommittee,andthuscouldnotbeanalyzedforthis report.
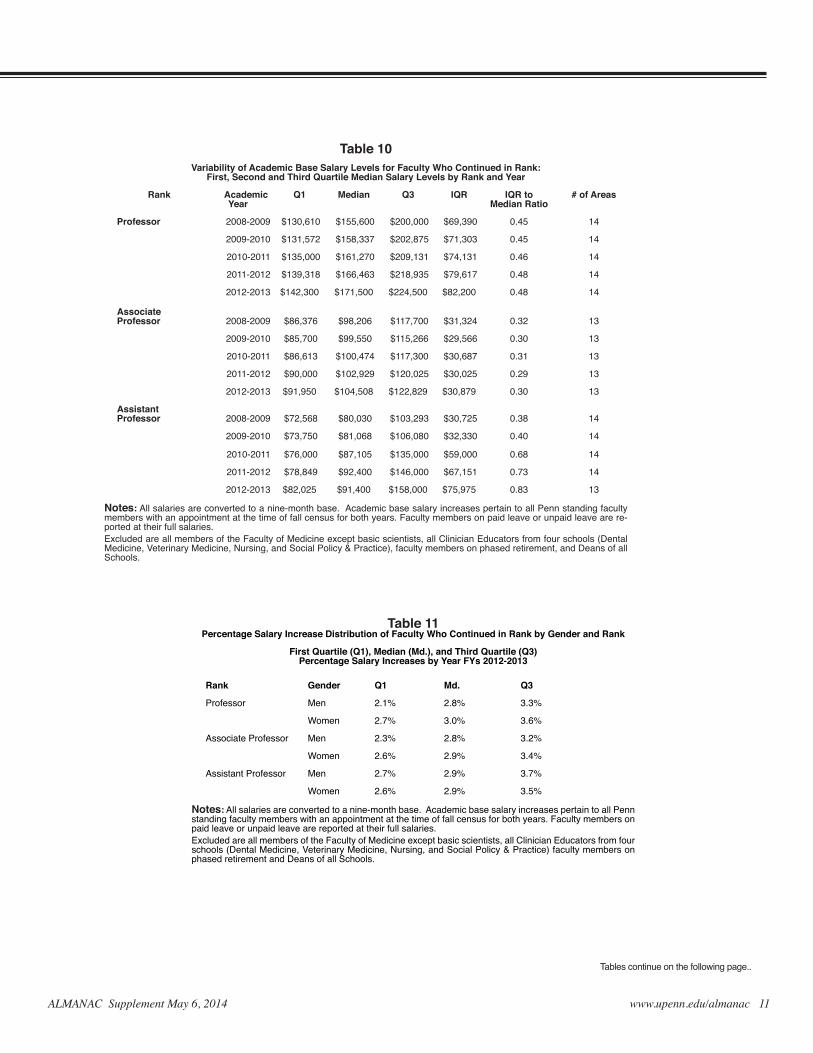
Data on trends in academic base salaries as well as variability in these salaries,areprovidedinTables9and10.Ameasureofvariabilityofmedi-an salaries across schools and areas of continuing faculty members is the interquartilerange(IQR)(i.e.,the75thpercentilesalaryinthedistribu-tionlessthe25thpercentilesalary).However,theIQRcanbeexpectedtobe larger when the general salary level is relatively high (such as for Full Professors) than when the general salary level is lower (such as for Assis-tant Professors). To compensate for such differences in the general level ofsalaries,theIQRisdividedbythemedianofthedistribution(i.e.,the50thpercentilesalary:Q2),therebycomputingaratiooftheIQRtothemedian (as reported in the next to last column of Table 10 labeled “IQR to Median”).7 This ratio provides an index of the amount of variability inrelationtothegenerallevelofthesalarydistributions,andhasutilitywhen comparing variability across ranks and trends over time. This anal-ysis suggests that the variability in salaries at the Full and Associate Pro-fessor ranks has been relatively stable with time.
Instarkcontrast,therehasbeenaquitestrikingincreaseinthevari-abilityinacademicbasesalaryatthelevelofAssistantProfessor,withtheIQR-to-Median Ratio increasing from 0.38 in 2008-09 to 0.83 in 2012-13. Evenmorestrikingly,themediansalaryfortheupperquartileofassistantprofessors is almost double (1.9-fold) the median salary of the lower quar-tile of assistant professors at the university.
TherearemanyreasonswhyfacultysalariesvarywithinPenn,includ-ingdifferencesinindividualmerit,rank,timeinrank,externallabormar-ketforces,therelativewealthofschoolsandperhapsdifferencesamongschools in principles and practices for allocating salary increments. While thecomplexinfluenceofthesemultiplefactorsprecludeadefinitiveanal-ysis,SCESF remains concerned that existing salaryvariabilitymay in-cludesomeinequitiesthatmandateredress.Inparticular,theincreasinglybroad range of variability in salaries paid to those in the starting ranks of thefacultyisquitesurprising,giventhatthisrankmightbeexpectedtobethemosthomogenousintermsofqualifications,timeinrank,etc.Whilethis growing difference may be a product of outside forces such as dif-ferencesincompensationbetweenfields,thisinequityhasconsequences,both intended and unintended (see the discussion of gender inequity be-low).Thus,SCESFiscommittedtoacontinuingprocessofreviewofis-sues leading to variability in salaries across the university that are not di-rectly related to differences in individual merit and experience. Continued reviewandanalysisisrequiredtoencourageDepartmentChairs,DeansandtheProvosttocorrectanyinequitiesidentified.
VI. Salary Variability by GenderTwo tables in this report address the question of possible gender in-
equityinfacultycompensationatPenn.InTable11,theannualsalaryin-crease for faculty at all levels is broken out by gender. The median values showarelativelytightrange(2.8%-3%).Comparisonsofthefirstandthird quartiles also do not show marked variation by gender.
ThedatainTable12raisemoreconcern.Atallacademiclevels:Full,Associate, andAssistantProfessor,both themeanand themedianbasesalariesarelowerforwomenthanformen.Forexample,attheAssistantProfessor level, themeanbasesalaryformen is16.2%higher than themean salary for women. The median salary for men at this level is 13.1% higher,indicatingthatthisinequityisnotthestatisticalresultofafewdis-proportionately high salaries awarded only tomen, but instead is rela-tively consistent. Striking differences are also seen between the academ-ic base salaries of women and men at the higher ranks. While historic ex-planations of gender inequity argue differences in time in rank as a con-tributingfactor,thefactthatthesestrikinginequitiesareseenattheentrylevel Assistant Professor rank as well as the more senior ranks is a matter of some concern.
The second major explanation often offered for the gender inequity in compensationcurrentlyoperatingatPenn is that thisdifferencereflects7 The statistically inclined reader will recognize this ratio as similar to the coefficient of variation (i.e., the ratio of the standard deviation to the mean of a distribution).

ALMANAC Supplement May 6, 2014 www.upenn.edu/almanac 5
agenderimbalanceamongthefacultyofdifferentschools,withwomenpredominantlypopulatinglowerpayingfieldsandmendisproportionatelyrepresentedinhigherpayingfieldsand/orschools.Onemeasureofthisisthecalculationof“weighted”numbers,wheremaleweightsarecalculatedas a ratio of male faculty in each school or area to the total number of male facultyatPenn,andfemalefacultyareweightedsimilarly.Usingthismet-ric,theapparentgenderimbalanceisreduced–seethe“weighted”valuesin Table 12. A recent analysis from the Provost’s Gender Equity Report alsoexaminedthisquestion,usingamultivariateregressiontoaccountfortheinfluencesofdifferencesinrank,timeinrank,discipline,andpositionasdepartmentchairorendowedchair.Afteraccountingforthesefactors,20%ofthegenderimbalanceinsalaryremained,indicatingapersistent,concerning gender-associated inequity in faculty salaries.
Basedontheseanalyses,SCESFconcludesthatthepronouncedgen-der inequity in faculty salary at Penn is the result of: (1) some continu-inginequityinsalarieswithinschools;(2)pronouncedgenderimbalanceinthecompositionofthefacultiesofindividualschoolsand/orfieldsatPenn;and(3)pronouncedsalarydifferencesacrossschoolsand/orfieldsatPenn,asnotedaboveintheanalysisofTable10.SCESFisconfidentthatthePresident,DeansandDepartmentChairsatPennsharetheircon-cern about this ongoing issue, andwill take aggressive action to leveltheplayingfield,eliminatingbothgenderimbalanceandsalaryinequitybasedongender,race,orotherfactors.
VII. Conclusions A. Economic Status of the Faculty1. External Competitiveness
Comparisons of Penn faculty salary percentage increases with per-centage increases in the CPI: All ranks showed a median increase above the increases determined for both the Philadelphia and the US City Aver-age CPI this year.
Comparisons with other universities: Salary comparisons for Full Pro-fessors at Penn with data from peer institutions indicates that while Penn isholdingasteadypositiontowardthemiddleofthepack(7/12),theUni-versity is falling behind some top-ranked peer institutions over time. For example,thegapbetweenacademicbasesalariesatColumbiaandStan-ford and those at Penn has been widening over the past few years.
Further,SCESF is concerned that facultyatPennarenotbenefitingfrom the economic recovery to a similar extent as either faculty at peer institutions or senior administrators at our own institution. We encourage thePresident,theProvost,DeansandDepartmentChairstocontinuethepush to keep faculty salaries at Penn competitive with peer institutions as a major factor in maintaining the overall excellence of the institution. 2. Internal Variability
Both annual salary increases and median salaries at all ranks vary con-siderably among schools. Much of this variability may be attributed to ei-therdifferencesintherelativewealthoftheschools,ordifferencesrequiredtomaintainPenn’scompetitivestandingswithindifferentacademicfields.Nonetheless,theSCESFbelievesthatthisvariabilityshouldcontinuetobemonitoredtobesurethatthesedifferences,andespeciallythegrowingdif-ferencesattherankofAssistantProfessor,donotleadtounintendedconse-quences,includinggrowingdiscordamongthefacultyordecliningstandardsofacademicexcellence.Specifically,SCESFnotesstrikinggenderinequityinfacultycompensationfortheuniversityasawhole,muchofwhichmightbe explained by the increasing variability in faculty salaries across schools. B. Conditions of Concern1. External Competitiveness
Penn faculty salaries and compensation remain generally competitive withthoseinacomparisonsetofuniversities.However,inordertorecruitandretainasuperiorfaculty,Penn’ssalariesmustcontinuetobecompeti-tivewiththoseofourclosestcompetitorpeerinstitutions,andherewearefallingrelativetothoseinthetoptierofprivateresearchuniversities,in-cludingColumbia,Stanford,andPrinceton.2. Internal Equity
TheSCESF isconcernedby issuesof internal inequity,andspecifi-cally warns of the unintended consequences of the increasing variability incompensationacrossschools,asthisverylikelycontributestothesub-stantial and growing gender inequity in compensation at Penn. We encour-age aggressive action by the Vice Provost for Faculty to investigate vari-ability and eliminate inequity.
VIII. SCESF Communication with Provost’s OfficeA. SCESF Requests in Preparation of the SCESF Report and Responses
SCESFthankstheOfficeofInstitutionalResearchandAnalysisandtheOfficeoftheViceProvostforFacultyforprovidingthedatauponwhichmost of this report is based. All data provided to the committee were in-cludedinTables1through12ofthisreport,withtheexceptionofthosedatathatwouldundermineconfidentialityduetosmallsamplesize.B. SCESF Recommendations 1. Salary Competitiveness
a. Mean salaries at Penn have generally showed stability over time in comparison with AAUDE data in a number of schools and areas (see Ta-ble4).However,gainsarenotconsistentacrossallschoolsanddisciplines.While all faculty shared in the belt-tightening required by the recent re-cession,itisnotclearthatallfacultyarebenefitingfromtheeconomicre-covery. The continued muted nature of faculty salary increases despite im-proved economic conditions contrasts rather sharply to the salary increas-esprovidedtoPennadministratorsoverthesametimeframe.Thus,SCESFrecommendsthatoverthenextthreeyears,theuniversityshouldfocusona recovery in faculty salaries that parallels the recovery already appreciated bysenioradministrators.Further,werecommendthatprioritybeplacedonincreasing mean salaries to levels competitive with our top-ranked pier in-stitutions,especiallyforfacultygroupsthatarefallingbehindorremainingstagnant in AAUDE comparisons. As noted in last year’s report and again here,specificgroupsincludingthefacultiesofDentalMedicineandVeteri-nary Medicine continue to fall behind.
The University is strongly committed to competitive faculty salaries that facilitate the recruitment and retention of an eminent and diverse faculty who are excellent in teaching, research and service. Penn’s facul-ty salaries remain competitive. With respect to economic recovery, in re-cent years, mean and median academic base salary percentage increases for Penn’s standing faculty have consistently exceeded growth in both the US city average and the Philadelphia consumer price index (CPI). More-over, when adjusted for cost of living, Penn’s compensation for full pro-fessors has remained highly competitive, compared to top public, top pri-vate and most elite Ivy-Plus universities. Penn’s Deans continue to allo-cate salary pool increases to reward faculty merit. Faculty and staff sal-aries have increased in the Dental School and the School of Veterinary Medicine, where financial challenges unique to those schools still com-mend constraint.
The Committee’s comparisons of faculty salaries to senior administra-tive salaries reported on Tax Form 990 are potentially misleading. First, as legally required, total compensation rather than base salary alone is reported on Penn’s Form 990, a fact that is obscured in the Committee’s report. Benefits above salary such as tuition benefits and supplemental life insurance are included in the Form 990 data and can be variable from year to year. Second, the Committee’s analysis does not it take into ac-count that some individuals whose income is listed on the 990 served in a given position for less than a full reporting year and subsequently worked a full reporting year, creating the impression that the subsequent year’s salary included a large raise. Third, as the Committee observed, the indi-viduals reported in Penn’s tax filings include a number who are not mem-bers of the standing faculty; indeed, they represent a narrow band of in-dividuals whose compensation is not representative of the vast majority of administrators at the University. The salaries of senior administrators, like those of faculty members, demonstrate considerable variability re-flecting very substantial differences in the employment markets for these positions. The salaries reported on the 990 undergo special review and are approved by Penn’s Trustees, in a process that utilizes external consul-tants knowledgeable in the market for the salaries for each particular po-sition. The University continues to be committed to awarding competitive compensation packages to all faculty members in all tracks and ranks, as appropriate and commensurate with the market for each position.
b. Variability in faculty salaries and especially in the IQR by rank (see Tables6to10)isincreasingovertime.Further,genderinequityremainsasignificantconcernatPenn.Whilesalarydifferentialsacrosstheuniversi-tymayreflectbothexternalmarketforcesanddisparateresourcesamongschoolsaswellastheneedtorewarddistinguishedperformance,SCESFisconcerned that more equitable faculty compensation is essential to maintain diversity,morale,andinvestmentintheUniversity’ssustainedexcellence.
Variability in faculty salaries reflects very substantial differences in the employment markets for new PhDs and new professional school gradu-

ALMANAC Supplement May 6, 20146 www.upenn.edu/almanac
SENATE
IX. Members of the 2013-2014 Senate Committee on the Economic Status of the Faculty
JulieBlendy,PerelmanSchoolofMedicinePeterFader,WhartonSchoolErikaHolzbaur, Chair, Perelman School of MedicineSarahKagan,SchoolofNursingJaniceMadden,SchoolofArts&Sciences/SociologyLorraineTulman,SchoolofNursing
Ex officio SenateChair-Elect,ClaireFinkelstein,LawSchoolSenateChair,DwightJaggard,SEASSenatePastChair,SusanMargulies,SEAS
The Committee would like to gratefully acknowledge the essential and valuableassistanceofVickiHewittof theOfficeof theFacultySenate.TheCommitteealsonotesthatthisyear’sreportdirectlybenefitedfromthepresentationandanalysisinlastyear’sreport,muchofwhichisstillrelevant and some of the text of which is included here.
ates in the 12 Penn schools and academic disciplines. The University re-affirms its strong commitment to gender equity in salaries. As the Com-mittee notes, apparent differences in the salaries of men and women fac-ulty members are largely a function of the gender composition of various fields represented on the Penn faculty. A comprehensive review of salaries by gender was conducted in conjunction with the January 15, 2013 Prog-ress Report on Gender Equity published in Almanac. The review found no clear indication of gender-associated salary inequity. Rather it found that “once additional variables for discipline, rank, time in rank, and status as endowed professor and/or department chair were added, the differenc-es between men’s and women’s salaries declined to 2.6%.” As the review stated, the fact that this remaining 2.6% difference could not be account-ed for statistically may indicate the limitations of the model. The Office of the Provost remains committed to addressing any unwarranted differ-ences in faculty salaries, and every year closely reviews salaries to moni-tor fairness and equity. 2. Faculty Benefits
Insufficientinformationwasprovidedtothecommitteetoallowreviewoffacultybenefits,butSCESFwouldliketoemphasizetheoverallimpor-tanceoffacultybenefitsinmaintainingadiverse,committed,andoutstand-ing workforce at the university.
The University welcomes attention to faculty benefits. In the past, data from the American Association of University Professors (AAUP) were provided to address the Committee’s emphasis. As was noted last year, the University remains interested in market competitive faculty benefits and periodic review of faculty benefits in collaboration with the Division of Human Resources. We regularly engage the University Council’s Com-mittee on Personnel Benefits. 3. Review of Compensation for Clinician-Educators
NodatawereprovidedtothecommitteeonsalaryincreasesorsalarylevelsforfacultyintheClinician-EducatortrackatPenn.However,giventhegrowingnumberandrelativeimportanceoffacultyintheclinicaltracks,we urge the senate and the university to establish a mechanism to provide a parallelannualreviewofcompensationfortheclinician-educatortrack,oralternatively,toprovidethesedatatoSCESFtoreviewinparallelwithon-going analysis of salary concerns for the non-clinical faculty.
The CE track is very heterogeneous, with a compensation structure that reflects that heterogeneity. The vast majority of CE track faculty—more than eight hundred—are faculty members in the Perelman School of Medicine (PSOM). According to current PSOM compensation guidelines, salaries can change quarterly. Given the very competitive external mar-ket for clinical faculty, PSOM continuously monitors compensation lev-els through the American Association of Medical Colleges, the Univer-sity Health Consortium, and the Hay Group, which surveys 30 peer in-stitutions. Volatility in productivity-based salaries does not lend itself to the same type of analysis the Committee traditionally conducts for tenure track faculty.
Average Academic Base Salary Percentage Increases of Continuing Penn Standing Faculty Members by Rank in Comparison
With the Consumer Price Index (CPI) and Penn Budget Guidelines
Group/Condition Metric FYs 2012-2013Professor Mean 4.0%
Median 2.9%Associate Professor Mean 5.6%
Median 2.9%Assistant Professor Mean 3.4%
Median 2.9%All Three Ranks Mean 4.3%
Median 2.9%US City Average CPI Growth Mean 1.8%Philadelpohia CPI Growth Mean 1.5%Budget Guidelines Mean 3.0%
Notes: All salaries are converted to a nine-month base. Academic base salary in-creases pertain to all Penn standing faculty members with an appointment at the time of fall census for both years. Faculty members on paid leave or unpaid leave are re-ported at their full salaries.Excluded are all members of the Faculty of Medicine except basic scientists, all Cli-nician Educators from four schools (Dental Medicine, Veterinary Medicine, Nursing, and Social Policy & Practice), faculty members on phased retirement, and Deans of all Schools.FYs 2012-2013 CPI growth for the US and for Philadelphia are based on a change in CPI from June 2012 to June 2013.
Table 1
Table 2Percentage of Continuing Penn Standing Faculty Members
Awarded Percentage Salary Increases Exceeding the Percentage Growth in Consumer Price Index (CPI) for Philadelphia
Schools and Disciplinary Areas Percentage of all Standing Faculty with Salary Increases Exceeding Growth in
the CPI (Phil.) FY 2012 to 2013
Annenberg 100.0%Dental Medicine 69.2%Design 100.0%Engineering & Applied Science 97.0%Graduate Education 96.4%Humanities (A&S) 99.0%Law 95.4%Medicine-Basic Science 83.5%Natural Science (A&S) 94.8%Nursing 94.6%Social Policy & Practice 100.0%Social Science (A&S) 96.2%Veterinary Medicine 62.9%Wharton 96.2%All Schools/Areas 92.7%
U.S. City Average CPI Growth 1.8%Philadelphia CPI Growth 1.5%Budget Guidelines 3.0%Notes: All salaries are converted to a nine-month base. Academic base sala-ry increases pertain to all Penn standing faculty members with an appointment at the time of fall census for both years. Faculty members on paid leave or un-paid leave are reported at their full salaries.Excluded are all members of the Faculty of Medicine except basic scientists, all Clinician Educators from four schools (Dental Medicine, Veterinary Medicine, Nursing, and Social Policy & Practice), faculty members on phased retirement, and Deans of all Schools.FYs 2012-2013 CPI growth for the US and for Philadelphia are based on a change in CPI from June 2012 to June 2013.

ALMANAC Supplement May 6, 2014 www.upenn.edu/almanac 7
Table 3Percentage of Continuing Penn Full Professors Awarded Percentage Salary Increases Exceeding the Percentage Growth the in Consumer
Price Index (CPI) for Philadelphia
Schools and Disciplinary Areas Percentage of all Full Professors with Salary Increases Exceeding Growth in
the CPI (Phil.) FY 2012 to 2013Annenberg 100.0%Dental Medicine 68.4%Design 100.0%Engineering & Applied Science 95.2%Graduate Education 100.0%Humanities (A&S) 99.0%Law 94.9%Medicine-Basic Science 80.2%Natural Science (A&S) 93.9%Nursing 100.0%Social Policy & Practice 100.0%Social Science (A&S) 94.8%Veterinary Medicine 39.4%Wharton 93.8%All Schools/Areas 90.2%
US City Average CPI Growth 1.8%Philadelphia CPI Growth 1.5%Budget Guidelines 3.0%Notes: All salaries are converted to a nine-month base. Academic base salary increases pertain to all Penn standing faculty members with an appointment at the time of fall census for both years. Faculty members on paid leave or unpaid leave are reported at their full salaries.Excluded are all members of the Faculty of Medicine except basic scientists, all Clinician Educators from four schools (Dental Medicine, Veterinary Medicine, Nursing, and Social Policy & Practice), faculty members on phased retirement, and Deans of all Schools.FYs 2012-2013 CPI growth for the US and for Philadelphia are based on a change in CPI from June 2012 to June 2013.
Rank of Mean Salaries of Penn Faculty by Academic Fields as Compared to 60 Selected Universities Participating in the
American Association of Universities Data Exchange (AAUDE) Survey
Academic Field Fall 2007
Fall 2008
Fall 2009
Fall 2010
Fall 2011
Fall 2012
Full ProfessorAnnenberg 1/38 1/38 1/40 1/41 1/41 1/39Dental Medicine 10/38 11/43 2/44 9/45 10/45 9/43Design 9/53 8/51 5/51 5/55 10/53 11/52Engineering & Applied Science 14/56 14/53 11/53 13/57 13/55 14/54Graduate Education 4/48 4/45 4/44 6/47 6/47 7/45Humanities (A&S) 10/56 8/53 9/54 9/58 7/56 11/55Law 10/41 7/39 7/37 8/40 7/39 8/38Natural Science (A&S) 15/57 13/54 15/54 14/58 12/56 11/55Nursing 2/26 2/25 2/24 1/17 1/19 1/19Perelman-Basic Science 3/37 5/53 6/54 6/58 6/56 8/55Social Policy & Practice 6/25 5/23 7/23 8/25 6/25 6/23Social Science (A&S) 9/57 9/54 8/54 9/57 8/56 9/55Veterinary Medicine 4/17 3/14 3/13 3/14 3/14 4/13Wharton-Business & Management 7/53 5/50 4/51 5/55 5/53 2/52Wharton-Public Policy - 15/50 15/52 - 13/54 12/53Wharton-Statistics 1/34 1/34 1/32 1/36 1/34 2/34
Associate ProfessorAnnenberg - - - - - -Dental Medicine 8/35 14/41 9/42 9/43 13/43 9/41Design 7/53 6/51 3/51 3/55 1/51 3/51Engineering & Applied Science 10/56 9/53 7/53 8/57 11/54 11/53Graduate Education 4/48 5/44 4/44 8/48 8/45 9/44Humanities (A&S) 10/56 6/53 12/54 12/57 11/55 13/54Law N/A N/A - - - -Natural Science (A&S) 11/57 11/54 14/54 14/58 15/56 17/55Nursing 5/26 7/24 6/23 3/17 5/19 3/19Perelman-Basic Science 3/37 5/53 7/54 8/58 4/55 4/54Social Policy & Practice - 3/24 - - - -Social Science (A&S) 11/57 11/54 8/54 7/57 8/56 14/55Veterinary Medicine 3/17 8/14 9/13 11/14 6/14 6/13Wharton-Business & Management 2/53 1/50 2/50 2/54 2/51 2/51Wharton-Public Policy - - - - - -Wharton-Statistics - 2/27 - 3/31 2/27 2/30
Assistant ProfessorAnnenberg - - - - - -Dental Medicine 11/36 8/42 8/43 - - -Design 5/52 7/49 4/50 6/55 6/51 4/50Engineering & Applied Science 13/56 10/53 5/53 6/57 7/54 8/54Graduate Education 6/47 6/45 6/43 7/47 - 15/43Humanities (A&S) 19/56 17/53 14/54 14/58 14/56 17/55Law - - 6/25 5/25 6/27 -Natural Science (A&S) 18/57 15/54 15/54 15/58 15/56 22/55Nursing 5/26 3/24 3/23 2/17 3/19 2/19Perelman-Basic Science 6/37 7/53 10/54 8/58 6/56 9/55Social Policy & Practice - 6/24 6/25 6/25 - 5/24Social Science (A&S) 10/57 13/54 11/54 8/57 7/56 8/55Veterinary Medicine 1/17 6/14 5/13 6/14 5/14 5/12Wharton-Business & Management 6/53 10/50 5/50 4/54 4/52 4/51Wharton-Public Policy - - 1/51 - 1/54 1/53Wharton-Statistics 1/33 1/33 - - - -
Table 4
Median salary data from this particular data source is not complete, and therefore, the more complete average salary data set is used. The AAUDE survey instruc-tions request academic base salaries and this was the metric used for submitting Penn faculty salaries.Using the federal CIP (Classification of Instructional Programs) codes for 2000, de-partments at comparable universities were mapped to Penn Schools.** Between Fall 2007 and Fall 2008, several modifications were made to CIP Code classifications for medical sciences. In Fall 2009, at the school’s request, Wharton-Public Policy began being compared to Economics rather than Policy programs.Calculations of rank only include those universities that have relevant departments. Therefore, the number of universities among which Penn is ranked varies by field.Rank is suppressed for all cells which contain fewer than five Penn faculty members.

ALMANAC Supplement May 6, 20148 www.upenn.edu/almanac
Percentage Differences in Mean Academic Base Salary Levels of Full Professors at a Sample of Comparable Research Universities for
Academic Years 2006-2007 Through 2012-2013Full Professor Mean Academic Base Salaries: Percentage Differences*
2006-2007
2007-2008
2008-2009
2009-2010
2010-2011
2011-2012
2012-2013
Columbia N/A -0.5% 3.4% 10.9% 9.3% 8.9% 13.5%Stanford 5.0% 6.4% 7.4% 6.6% 7.6% 7.6% 10.9%Chicago 3.8% 4.6% 6.0% 8.2% 8.7% 8.9% 8.9%Harvard 13.4% 13.2% 13.7% 12.4% 10.7% 9.3% 8.6%Princeton 4.6% 5.5% 6.4% 6.4% 6.2% 6.7% 7.0%NYU -4.5% -0.6% 0.8% 0.9% 0.5% 0.4% 0.3%Penn $156.5K $163.3K $169.4K $170.1K $175.1K $181.6K $187.0KYale 0.7% 1.1% 3.1% 2.4% 1.1% -0.7% -0.4%Duke -9.3% -6.6% -4.8% -5.5% -6.7% -3.5% -3.6%MIT -6.8% -7.2% -5.4% -5.3% -5.3% -5.4% -4.4%Northwestern -5.9% -5.9% -4.5% -2.2% -3.2% -5.2% -5.5%UCLA -14.9% N/A -14.7% -13.0% -12.2% -10.5% -10.7%UC Berkeley -16.1% N/A -15.3% -14.3% -14.8% -15.2% -15.0%Michigan -16.7% -16.1% -16.1% -15.3% -16.1% -18.1% -20.5%NC (Chapel Hill) -19.0% -15.1% -15.8% -15.9% -18.2% -20.7% N/ACarnegie-Mellon -18.8% -19.0% -19.4% -19.1% -20.7% -21.8% -21.7%Texas (Austin) -22.6% -22.8% -21.9% -21.6% -22.0% -22.5% -23.0%Virginia -18.2% -18.7% -21.3% -20.8% -22.0% -22.0% -23.4%MN (Twin Cities) -25.5% -25.7% -24.8% -26.6% -29.6% -30.8% -28.2%
Table 5
SENATE
Notes: Penn academic base mean salaries are based on standing faculty members at the rank of professor. Excluded are all members of the Faculty of Medicine except basic scientists, and all standing faculty members who are appointed as Clinician Edu-cators. Data Source: AAUP Salary Surveys.*Universities are ordered from highest to lowest mean salaries for full professors as of 2012-2013. For each year reported, the difference between the Penn mean salary and the mean salary for a comparison university was computed as a percentage of the Penn salary. .
Table 6Full Professors: Median Academic Base Salary Percentage
Increases of Faculty Continuing in Rank Who Were Penn Full Professors for FY 2013, Along with the First and Third Quartile
Salary IncreasesSchool/Area First Quartile (Q1), Median (Md.), and
Third Quartile (Q3) Percentage Salary Increases by
Year FYs 2012-2013
Q1 Md. Q3All Schools 2.3% 2.8% 3.4%
Annenberg 3.0% 3.7% 4.0%
Dental Medicine 0.5% 2.9% 3.0%
Design 2.3% 2.9% 3.0%
Engineering & Applied Science 2.8% 3.1% 4.0%
Graduate Education 3.0% 4.0% 4.5%
Humanities (A&S) 2.6% 2.7% 2.9%
Law 3.2% 3.6% 4.1%
Medicine-Basic Science 2.0% 2.0% 2.5%
Natural Science (A&S) 2.5% 2.8% 3.0%
Nursing 3.4% 3.4% 3.8%
Social Policy & Practice - 3.1% -
Social Science (A&S) 2.6% 2.7% 3.1%
Veterinary Medicine 3.1% 1.5% 1.5%
Wharton 2.8% 3.0% 3.5%
Budget Guidelines - 3.0% -
Notes: The Budget Guideline is provided for comparison purposes. As per Penn policy, it is a guideline for the salary increment pool for all standing faculty members in each school, but not specifically for each rank.All salaries are converted to a nine-month base. Academic base salary increases per-tain to all Penn standing faculty members with an appointment at the time of fall census for both years. Faculty members on paid leave or unpaid leave are reported at their full salaries.Excluded are all members of the Faculty of Medicine except basic scientists, all Cli-nician Educators from four schools (Dental Medicine, Veterinary Medicine, Nursing, and Social Policy & Practice), faculty members on phased retirement, and Deans of all Schools.Salary increases include increases from all sources (e.g. merit, market, retention).The median (Md.) percentage salary increase is the mid-point of all increases with-in each school and rank (i.e. half of all increases are below the median and half are above). At the lower end of the salary increase percentages, 25% of all increases are below Q1, while 75% are above.The difference between the third (Q3) and first quartile (Q1) percentages provides a mea-sure of the variability in the percentage increases for each school and rank. Median increases are reported only if the number of faculty members in a given school and rank is five or more; quartile increases are reported only if the number of faculty mem-bers is nine or more.

ALMANAC Supplement May 6, 2014 www.upenn.edu/almanac 9
Tables continue on the following page..
Table 7Associate Professors: Median Academic Base Salary Percentage
Increases of Faculty Continuing in Rank Who Were Penn Associate Professors for FY 2013, Along with the First and Third Quartile
Salary Increases
School/Area First Quartile (Q1), Median (Md.), and Third Quartile (Q3) Percentage Salary In-
creases by Year FYs 2012-2013
Q1 Md. Q3
All Schools 2.5% 2.8% 3.3%
Annenberg - - -
Dental Medicine - 3.0% -
Design - 3.0% -
Engineering & Applied Science 2.8% 3.0% 4.0%
Graduate Education 2.0% 3.0% 3.2%
Humanities (A&S) 2.7% 2.8% 3.2%
Law N/A N/A N/A
Medicine-Basic Science 2.0% 2.0% 2.0%
Natural Science (A&S) 2.5% 2.7% 3.0%
Nursing 2.3% 2.9% 3.2%
Social Policy & Practice - - -
Social Science (A&S) 2.7% 2.9% 4.4%
Veterinary Medicine 1.5% 1.5% 3.0%
Wharton 2.9% 2.9% 4.1%
Budget Guidelines - - -
Notes: The Budget Guideline is provided for comparison purposes. As per Penn policy, it is a guideline for the salary increment pool for all standing faculty members in each school, but not specifically for each rank.All salaries are converted to a nine-month base. Academic base salary increases pertain to all Penn standing faculty members with an appointment at the time of fall census for both years. Faculty members on paid leave or unpaid leave are report-ed at their full salaries.Excluded are all members of the Faculty of Medicine except basic scientists, all Cli-nician Educators from four schools (Dental Medicine, Veterinary Medicine, Nursing, and Social Policy & Practice), faculty members on phased retirement, and Deans of all Schools.Salary increases include increases from all sources (e.g. merit, market, retention).The median (Md.) percentage salary increase is the mid-point of all increases with-in each school and rank (i.e. half of all increases are below the median and half are above).At the lower end of the salary increase percentages, 25% of all increases are be-low Q1, while 75% are above.The difference between the third (Q3) and first quartile (Q1) percentages provides a measure of the variability in the percentage increases for each school and rank. Median increases are reported only if the number of faculty members in a given school and rank is five or more; quartile increases are reported only if the number of faculty members is nine or more.
Table 8Assistant Professors: Median Academic Base Salary Percentage Increases
of Faculty Continuing in Rank Who Were Penn Assistant Professors for FY 2013, Along with the First and Third Quartile
Salary Increases
School/Area First Quartile (Q1), Median (Md.), and Third Quartile (Q3) Percentage Salary
Increases by Year FYs 2012-2013
Q1 Md. Q3
All Schools 2.7% 2.9% 3.6%
Annenberg - - -
Dental Medicine - - -
Design 2.9% 3.5% 4.0%
Engineering & Applied Science 3.0% 3.0% 5.0%
Humanities (A&S) 2.7% 2.8% 2.8%
Law - - -
Medicine - Basic Science 2.0% 2.0% 2.6%
Natural Science (A&S) 2.7% 2.7% 3.0%
Nursing 3.0% 3.0% 3.2%
Social Policy & Practice - - -
Social Science (A&S) 2.7% 2.7% 3.7%
Veterinary Medicine 1.7% 2.0% 2.5%
Wharton 2.9% 3.2% 4.1%
Budget Guidelines - - -
Notes: The Budget Guideline is provided for comparison purposes. As per Penn policy, it is a guideline for the salary increment pool for all standing faculty members in each school, but not specifically for each rank.All salaries are converted to a nine-month base. Academic base salary increases pertain to all Penn standing faculty members with an appointment at the time of fall census for both years. Faculty members on paid leave or unpaid leave are report-ed at their full salaries.Excluded are all members of the Faculty of Medicine except basic scientists, all Cli-nician Educators from four schools (Dental Medicine, Veterinary Medicine, Nursing, and Social Policy & Practice), faculty members on phased retirement, and Deans of all Schools. Salary increases include increases from all sources (e.g. merit, mar-ket, retention).Salary increases include increases from all sources (e.g. merit, market, retention).The median (Md.) percentage salary increase is the mid-point of all increases with-in each school and rank (i.e. half of all increases are below the median and half are above).At the lower end of the salary increase percentages, 25% of all increases are be-low Q1, while 75% are above.The difference between the third (Q3) and first quartile (Q1) percentages provides a measure of the variability in the percentage increases for each school and rank.

ALMANAC Supplement May 6, 201410 www.upenn.edu/almanac
SENATE
Table 9Mean Academic Base Salary Levels of Penn Standing Faculty Members who
Continued in Rank by RankRank Academic
YearAverage Amount Not
WeightedWeighted
Professor 2008-2009 Mean $169,739 1.78 1.85 Median $155,600 1.94 1.85
2009-2010 Mean $172,615 1.78 1.85 Median $158,337 1.95 1.84
2010-2011 Mean $177,139 1.69 1.82 Median $161,270 1.85 1.81
2011-2012 Mean $183,176 1.66 1.81 Median $166,463 1.80 1.79
2012-2013 Mean $188,537 1.64 1.82Median $171,500 1.88 1.82
Associate Professor 2008-2009 Mean $110,913 1.16 1.25
Median $98,206 1.23 1.23 2009-2010 Mean $110,058 1.13 1.24
Median $99,550 1.23 1.22 2010-2011 Mean $112,139 1.07 1.23
Median $100,474 1.15 1.21 2011-2012 Mean $115,457 1.05 1.22
Median $102,929 1.11 1.20 2012-2013 Mean $117,826 1.02 1.22
Median $104,508 1.14 1.22Assistant Professor 2008-2009 Mean $95,382 1.00 1.00
Median $80,030 1.00 1.00 2009-2010 Mean $97,223 1.00 1.00
Median $81,068 1.00 1.00 2010-2011 Mean $104,693 1.00 1.00
Median $87,105 1.00 1.00 2011-2012 Mean $110,157 1.00 1.00
Median $92,400 1.00 1.00 2012-2013 Mean $115,168 1.00 1.00
Median $91,400 1.00 1.00Notes: All salaries are converted to a nine-month base. Academic base salary in-creases pertain to all Penn standing faculty members with an appointment at the time of fall census for both years. Faculty members on paid leave or unpaid leave are re-ported at their full salaries.Excluded are all members of the Faculty of Medicine except basic scientists, all Cli-nician Educators from four schools (Dental Medicine, Veterinary Medicine, Nursing, and Social Policy & Practice), faculty members on phased retirement and Deans of all schools.The data are weighted by the number of continuing faculty members at each rank in each school.
ALMANAC Supplement May 6, 2014 www.upenn.edu/almanac 11
Tables continue on the following page..
Table 11Percentage Salary Increase Distribution of Faculty Who Continued in Rank by Gender and Rank
First Quartile (Q1), Median (Md.), and Third Quartile (Q3) Percentage Salary Increases by Year FYs 2012-2013
Rank Gender Q1 Md. Q3
Professor Men 2.1% 2.8% 3.3%
Women 2.7% 3.0% 3.6%
Associate Professor Men 2.3% 2.8% 3.2%
Women 2.6% 2.9% 3.4%
Assistant Professor Men 2.7% 2.9% 3.7%
Women 2.6% 2.9% 3.5%
Notes: All salaries are converted to a nine-month base. Academic base salary increases pertain to all Penn standing faculty members with an appointment at the time of fall census for both years. Faculty members on paid leave or unpaid leave are reported at their full salaries.Excluded are all members of the Faculty of Medicine except basic scientists, all Clinician Educators from four schools (Dental Medicine, Veterinary Medicine, Nursing, and Social Policy & Practice) faculty members on phased retirement and Deans of all Schools.
Table 10Variability of Academic Base Salary Levels for Faculty Who Continued in Rank:
First, Second and Third Quartile Median Salary Levels by Rank and Year
Rank Academic Year
Q1 Median Q3 IQR IQR to Median Ratio
# of Areas
Professor 2008-2009 $130,610 $155,600 $200,000 $69,390 0.45 14
2009-2010 $131,572 $158,337 $202,875 $71,303 0.45 14
2010-2011 $135,000 $161,270 $209,131 $74,131 0.46 14
2011-2012 $139,318 $166,463 $218,935 $79,617 0.48 14
2012-2013 $142,300 $171,500 $224,500 $82,200 0.48 14
Associate Professor 2008-2009 $86,376 $98,206 $117,700 $31,324 0.32 13
2009-2010 $85,700 $99,550 $115,266 $29,566 0.30 13
2010-2011 $86,613 $100,474 $117,300 $30,687 0.31 13
2011-2012 $90,000 $102,929 $120,025 $30,025 0.29 13
2012-2013 $91,950 $104,508 $122,829 $30,879 0.30 13
Assistant Professor 2008-2009 $72,568 $80,030 $103,293 $30,725 0.38 14
2009-2010 $73,750 $81,068 $106,080 $32,330 0.40 14
2010-2011 $76,000 $87,105 $135,000 $59,000 0.68 14
2011-2012 $78,849 $92,400 $146,000 $67,151 0.73 14
2012-2013 $82,025 $91,400 $158,000 $75,975 0.83 13
Notes: All salaries are converted to a nine-month base. Academic base salary increases pertain to all Penn standing faculty members with an appointment at the time of fall census for both years. Faculty members on paid leave or unpaid leave are re-ported at their full salaries.Excluded are all members of the Faculty of Medicine except basic scientists, all Clinician Educators from four schools (Dental Medicine, Veterinary Medicine, Nursing, and Social Policy & Practice), faculty members on phased retirement, and Deans of all Schools.

ALMANAC Supplement May 6, 201412 www.upenn.edu/almanac
SENATE
Table 12Mean Academic Base Salary Levels of Penn Standing Faculty Members who Continued in
Rank by Gender and RankUnweighted Weighted
AcademicYear
Metric Women Men % Difference Women Men % Difference
Full Professor2008-2009 Mean $160,576 $171,779 7.0% $161,153 $171,779 6.6%
Median $143,983 $157,550 9.4% $155,980 $167,245 7.2%2009-2010 Mean $161,532 $175,440 8.6% $166,672 $175,440 5.3%
Median $148,541 $160,000 7.7% $165,669 $170,459 2.9%2010-2011 Mean $166,221 $180,044 8.3% $171,246 $180,044 5.1%
Median $152,030 $163,900 7.8% $169,116 $175,273 3.6%2011-2012 Mean $172,035 $186,174 8.2% $179,817 $186,174 3.5%
Median $158,631 $169,112 6.6% $178,818 $180,559 1.0%2012-2013 Mean $178,939 $191,240 6.9% $187,183 $191,240 2.2%
Median $167,606 $172,921 3.2% $185,992 $186,997 0.5%Associate Professor2008-2009 Mean $104,061 $114,076 9.6% $110,244 $114,076 3.5%
Median $93,636 $101,900 8.8% $110,470 $107,352 -2.8%2009-2010 Mean $101,538 $114,421 12.7% $111,580 $114,421 2.5%
Median $92,925 $102,750 10.6% $109,374 $108,377 -0.9%2010-2011 Mean $103,011 $116,923 13.5% $111,945 $116,923 4.4%
Median $93,557 $105,175 12.4% $111,297 $110,787 -0.5%2011-2012 Mean $107,783 $119,589 11.0% $118,674 $119,589 0.8%
Median $97,250 $108,000 11.1% $116,981 $116,890 -0.1%2012-2013 Mean $107,877 $123,145 14.2% $119,369 $123,145 3.2%
Median $98,350 $110,153 12.0% $120,389 $119,917 -0.4%Assistant Professor2008-2009 Mean $89,046 $100,012 12.3% $99,900 $100,012 0.1%
Median $76,400 $84,615 10.8% $97,667 $96,777 -0.9%2009-2010 Mean $89,601 $102,559 14.5% $99,455 $102,559 3.1%
Median $77,925 $85,152 9.3% $97,554 $99,938 2.4%2010-2011 Mean $98,764 $108,534 9.9% $105,668 $108,534 2.7%
Median $82,250 $90,253 9.7% $102,623 $104,670 2.0%2011-2012 Mean $104,768 $113,590 8.4% $109,710 $113,590 3.5%
Median $84,913 $94,425 11.2% $106,715 $110,943 4.0%2012-2013 Mean $104,802 $121,832 16.3% $118,713 $121,832 2.6%
Median $86,398 $97,732 13.1% $116,496 $122,546 5.2%
Notes: All salaries are converted to a nine-month base. Academic base salary increases pertain to all Penn standing faculty members with an appointment at the time of fall census for both years. Fac-ulty members on paid leave or unpaid leave are reported at their full salariesExcluded are all members of the Faculty of Medicine except basic scientists, all Clinician Educators from four schools (Dental Medicine, Veterinary Medicine, Nursing, and Social Policy & Practice), fac-ulty members on phased retirement and Deans of all Schools.Female faculty members are weighted using male weights. Male weights are calculated as a ratio of male faculty in each school/area to the total number of male faculty at Penn. Percent difference is cal-culated as the difference between male and female salaries divided by the female salary. Negative percent differences occur when the female salary exceeds the male salary.