
Seminar Series 1 Welcome How to Use a Chart Presented by United States Power Squadrons ® All Maps...
61
Seminar Series 1 Welcome How to Use a Chart Presented by United States Power Squadrons ® All Maps and Charts courtesy of MapTech >>
-
Upload
priscilla-allison -
Category
Documents
-
view
214 -
download
0
Transcript of Seminar Series 1 Welcome How to Use a Chart Presented by United States Power Squadrons ® All Maps...
Seminar Series
1
Welcome
How to Use a Chart
Presented by United States Power Squadrons®
All Maps and Charts courtesy of MapTech
>>

Seminar Series
2
Welcome
I am Harry Hebb, SNAlso Ron Swope, SN
Presented by United States Power Squadrons®
All Maps and Charts courtesy of MapTech
>>

Seminar Series
3
How to Use a Chart
This Seminar is intended to serve as an introduction to basic chart symbols and use.
>>
Chart Symbols Chart References Compass Rose Locating a position
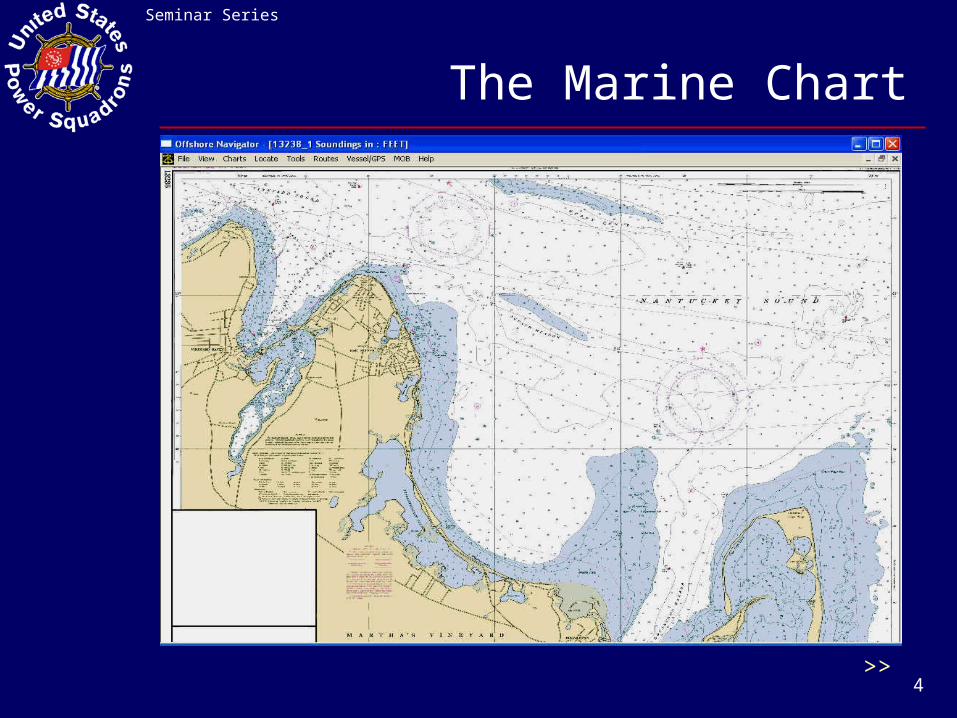
Seminar Series
4
The Marine Chart
>>

Seminar Series
5
Sources of Charts
Hydrographic Offices- U.S. – NOAA – NOS - U.K. – British Admiralty Charts- other…
Commercial- Maptech- Richardson’s- other…
>>

Seminar Series
6
More Detailed Information
For a complete list and explanation of all NOAA chart symbols, consult NOAA Chart Number 1, Nautical Chart Symbols Abbreviations and Terms … over 100 pages in the most nauseous of detail. Currently on-line only.
>>

Seminar Series
7
What Charts Show Navigators
Above the Water>>

Seminar Series
8
White
Blue
Green
Gold
Magenta
Colors Used on Charts
Deep, safe water
Shallow water
Areas covered at high water, bare at low water. Green buoys
Dry land, above mean high water
Lighted aids, boundary lines for special areas
>>

Seminar Series
9
Features Above the Water
>>

Seminar Series
10
Chart Information
Horizontal (position) Datum
Source Chart
Correction Date
Depth Units
Chart Scale
Mileage Scale
>>
NM = 6,076.1155 ft
WGS .. World Geodetic System
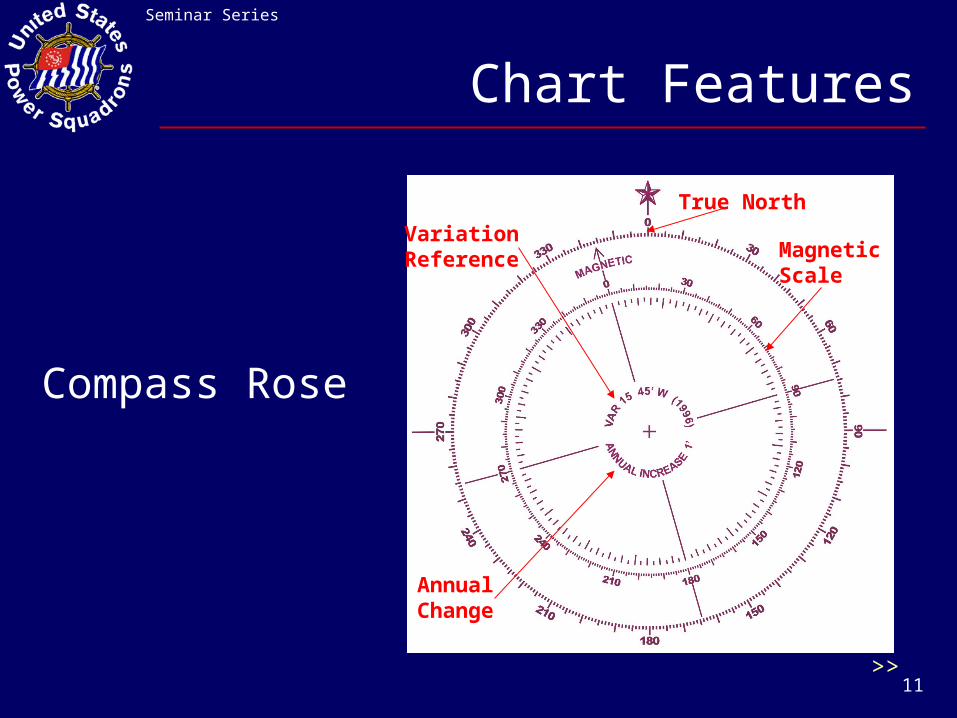
Seminar Series
11
Chart Features
Compass Rose
Variation Reference
AnnualChange
MagneticScale
True North
>>

Seminar Series
12
Chart Scales
>>

Seminar Series
13
Chart Scales
Charts are scaled representations- Scale is expressed as a ratio
• Example: 1:40,000:- One inch on chart = 40,000 inches on Earth (.6 nm)
- Typical scales• Sailing Chart 1: 600,000 … ? Small Scale• General Chart 1: 200,000• Coastal Chart 1: 80,000• Harbor Charts 1: 40,000
1: 20,000 1: 10,000 1: 5,000 ……. ? Large Scale
>>
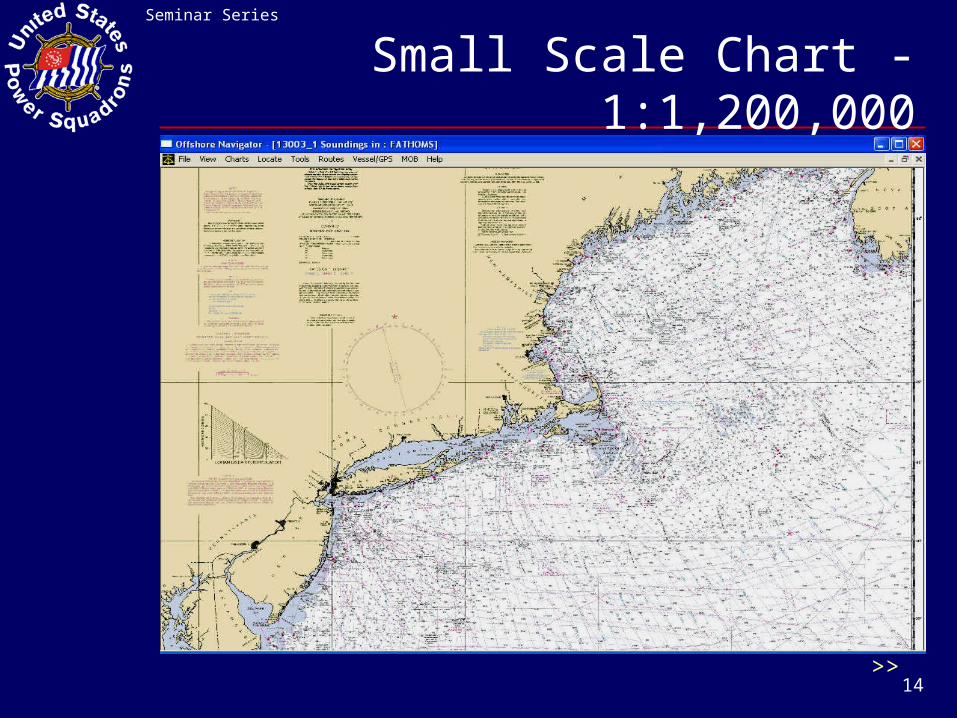
Seminar Series
14
Small Scale Chart - 1:1,200,000
>>
Seminar Series
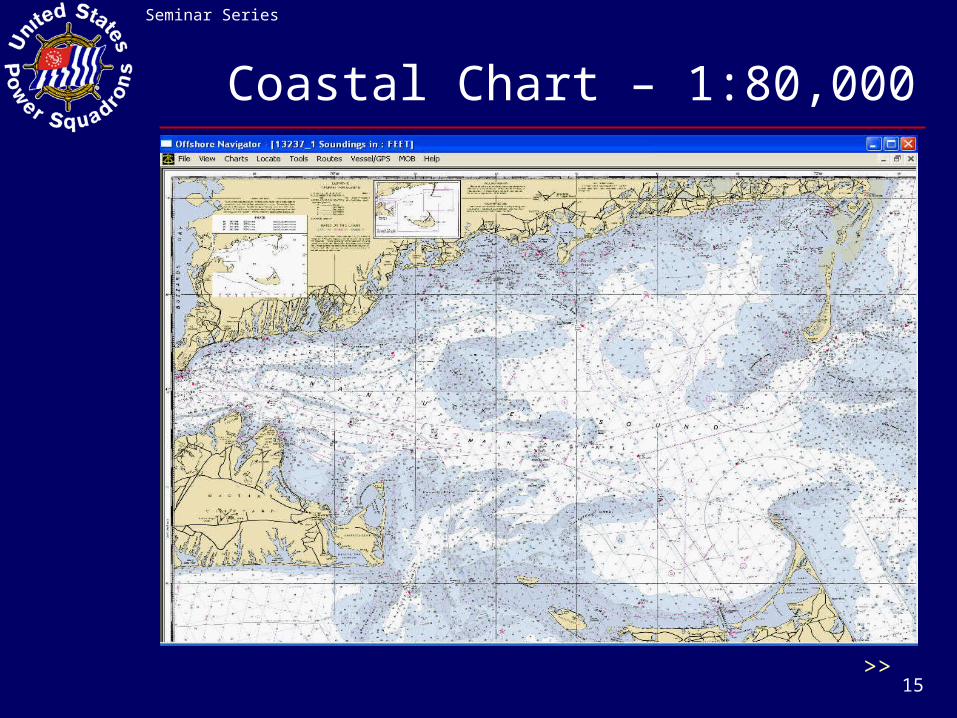
15
Coastal Chart – 1:80,000
>>
Seminar Series
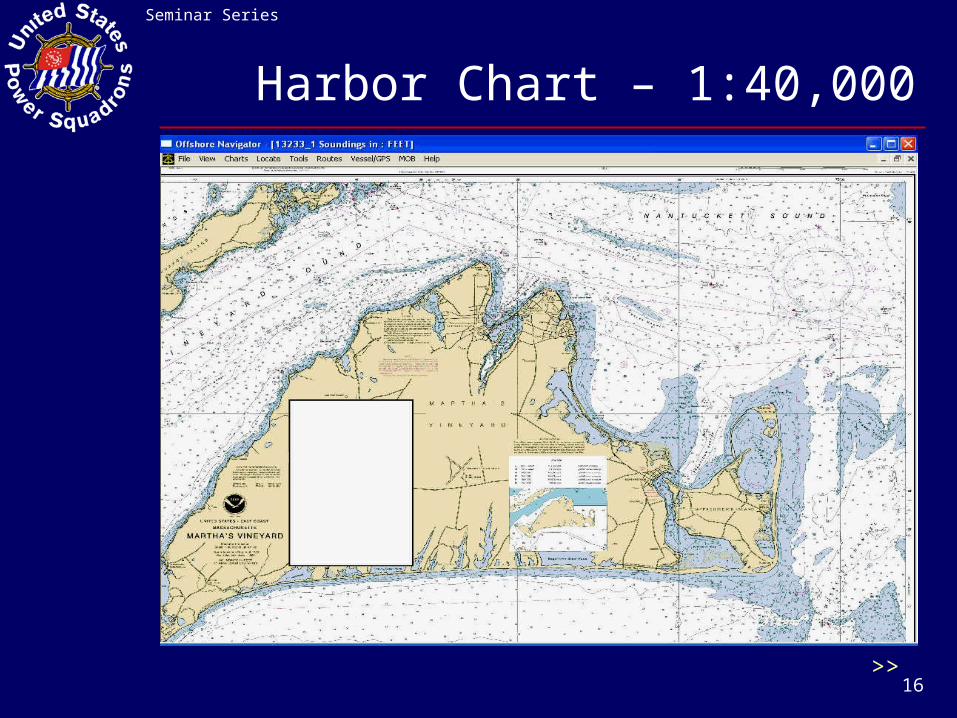
16
Harbor Chart – 1:40,000
>>

Seminar Series
17
Harbor Chart – 1:20,000
>>
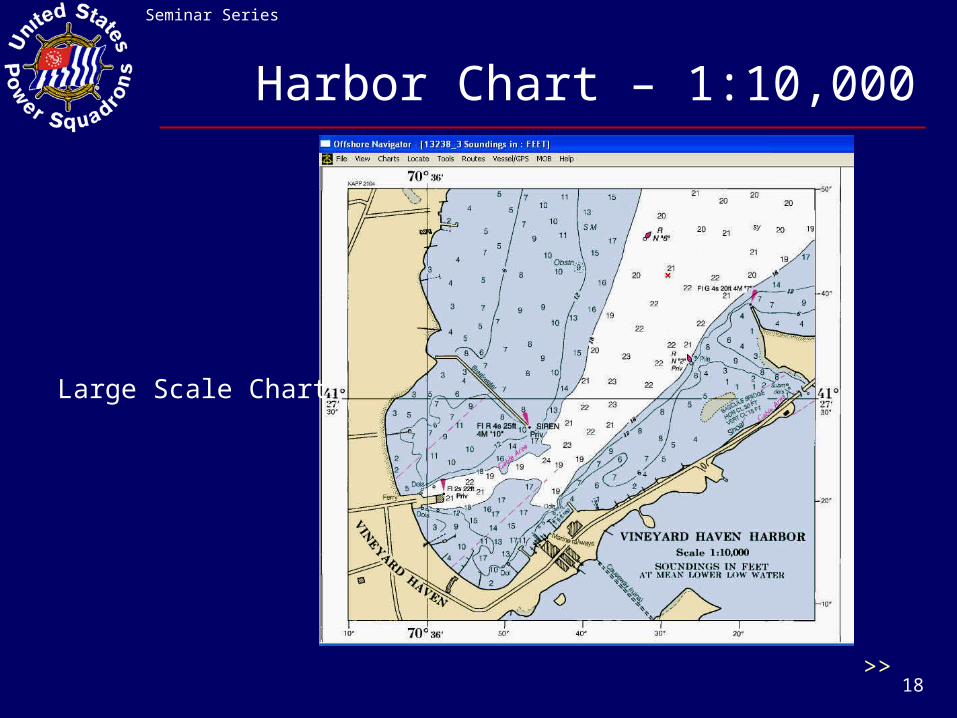
Seminar Series
18
Harbor Chart – 1:10,000
Large Scale Chart
>>
Seminar Series
19
What Charts Show Navigators
Below the Water
>>

Seminar Series
20
Charts Help Us “See” What’s Below
Courtesy Maptech >>

Seminar Series
21
Features Below the Water
>>

Seminar Series
22
Depths
Depth Soundingsat true position
[vertical numbers]
Drying heights above chart datum (green)[number is underlined]
Least depth inNarrow channel[number in parentheses]
No bottomat depth shown
SOUNDINGS
>>
Seminar Series
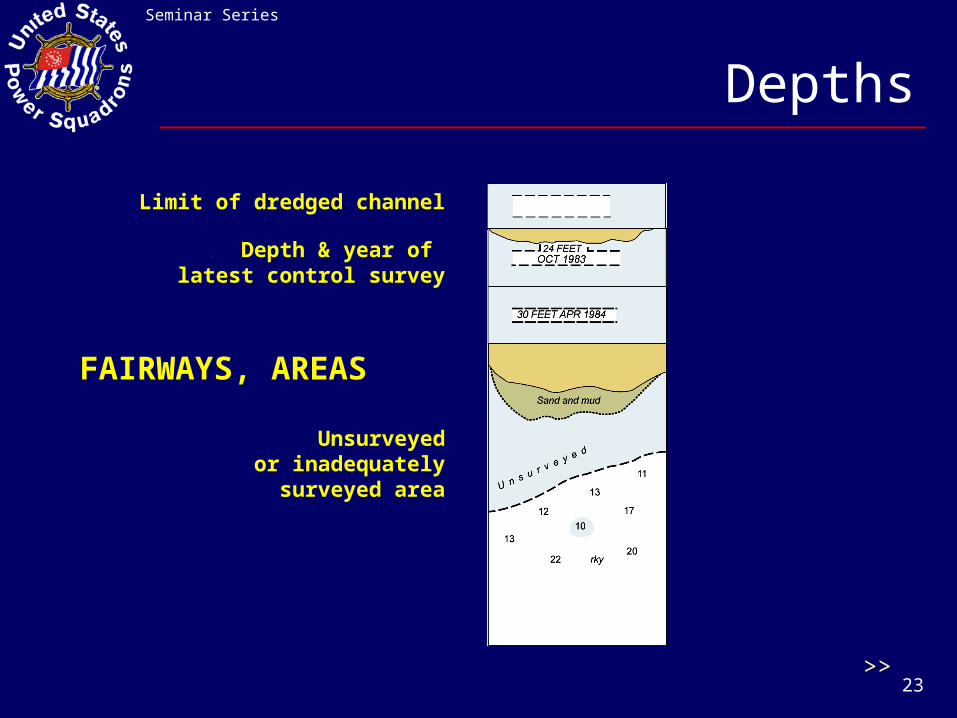
23
Depths
Limit of dredged channel
Unsurveyedor inadequately
surveyed area
Depth & year of latest control survey
FAIRWAYS, AREAS
>>

Seminar Series
24
Nature of the Seabed
Stones, gravel or shingle
Green: area that covers and uncovers
Rocky area
Coral reef
>>

Seminar Series
26
Land, Rocks, Wrecks & Obstructions
>>

Seminar Series
27
Depths and Heights
>>

Seminar Series
28
Charted Depth
>>

Seminar Series
29
Aids to Navigation(ATON)
Son of ATOM … he, he
>>

Seminar Series
30
Navigation Chart Symbols
>>

Seminar Series
31
Navigation Aid Symbols
Chart vs.
Reality
The object as it appears on the water is shown to the left of its symbol
>>

Seminar Series
32
Finding Your Wayby using Piloting
Piloting typically refers to navigation by using land based objects as opposed to
celestial bodies.
>>

Seminar Series
33
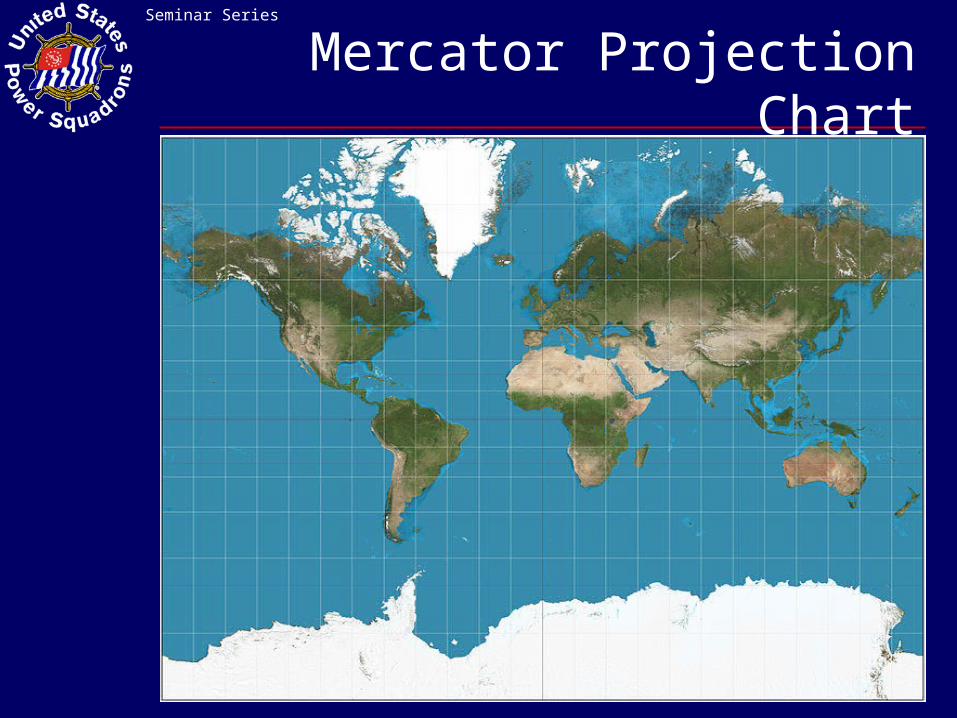
Mercator Projection Chart
>>
Seminar Series
34
Mercator Projection Chart
>>

Seminar Series
35
Latitude and Longitude
>>

Seminar Series
36
Coordinates
W Longitude
Latit
ude
N
>>

Seminar Series
37
Measure Latitude
>>
Seminar Series
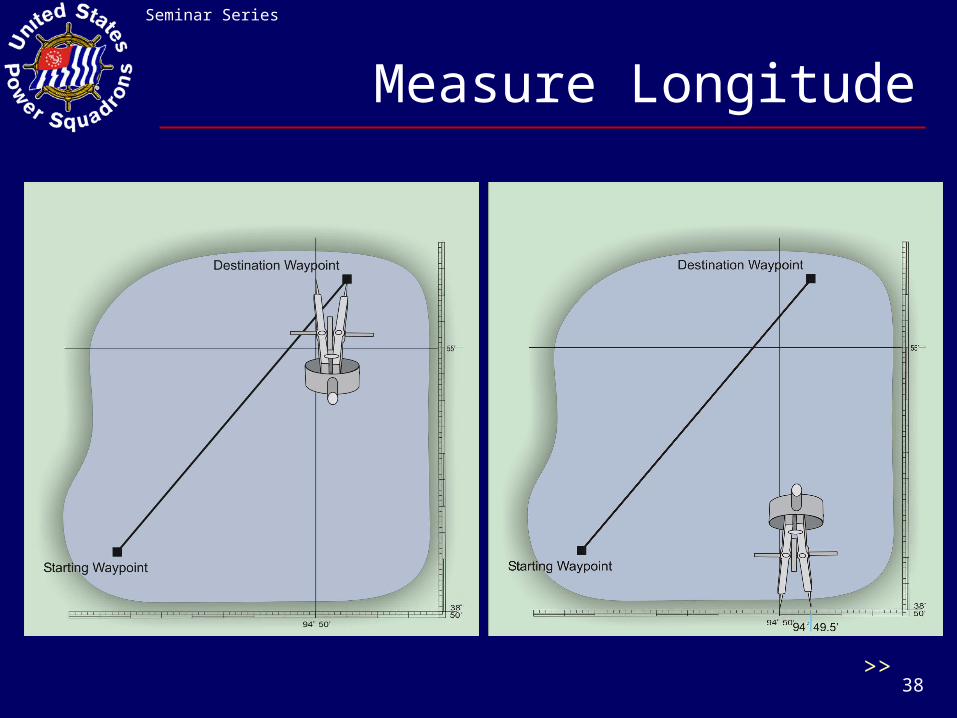
38
Measure Longitude
>>

Seminar Series
39
Measure Course
>>
Seminar Series
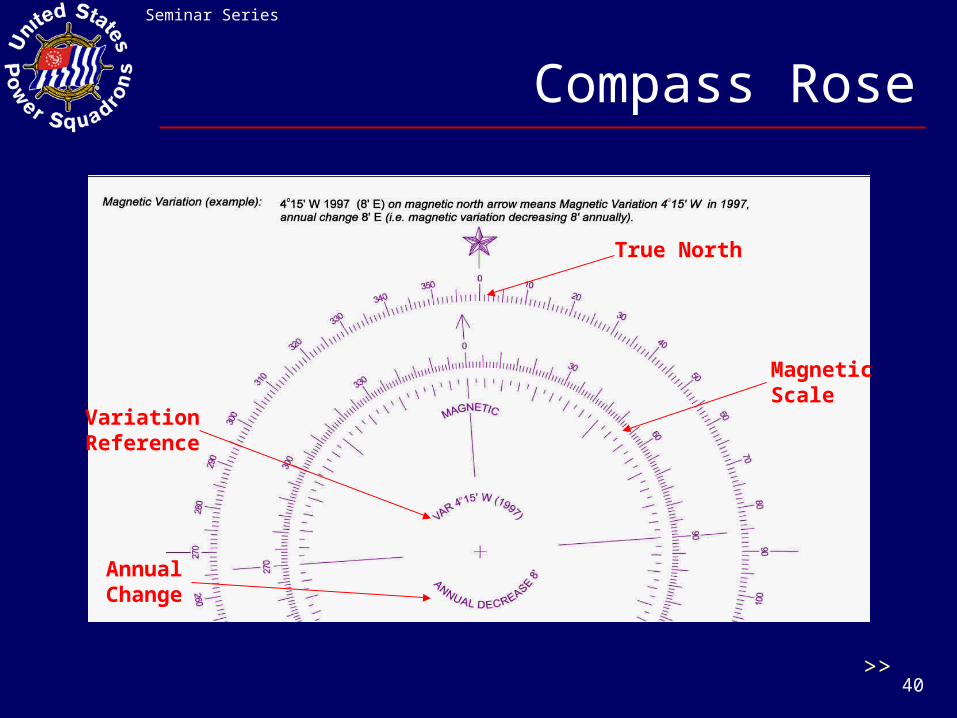
40
Compass Rose
Variation Reference
AnnualChange
MagneticScale
True North
>>
Seminar Series
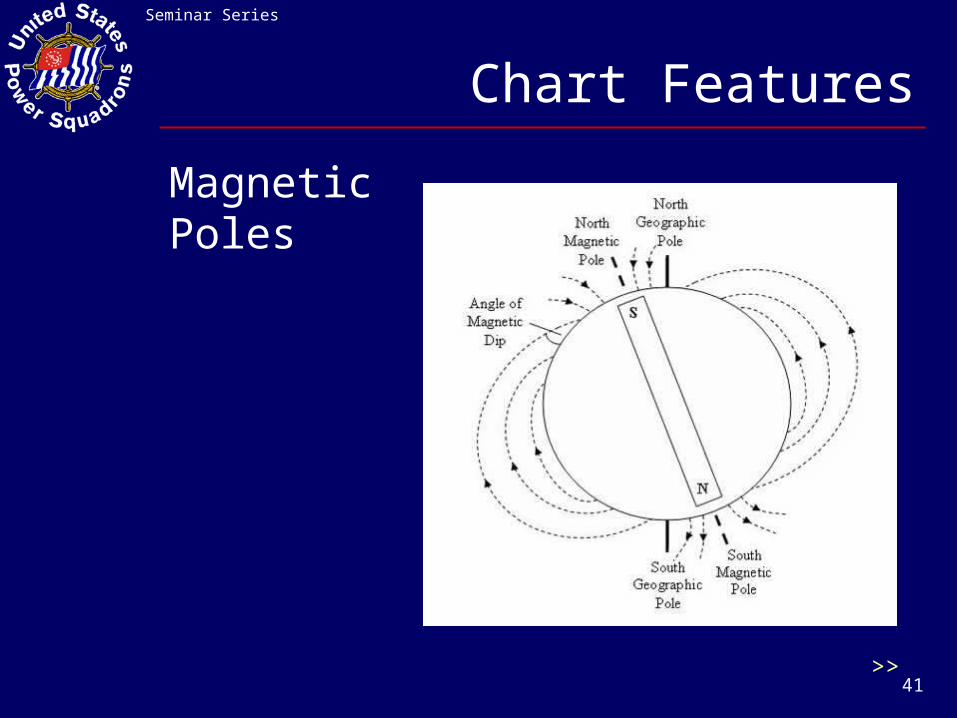
41
Chart Features
MagneticPoles
>>

Seminar Series
42
Chart Features
Magnetic Variation
>>

Seminar Series
43
Chart Features
Magnetic Variation
>>

Seminar Series
44
Chart Features
>>

Seminar Series
45
Chart Features
>>
MagneticDeviation
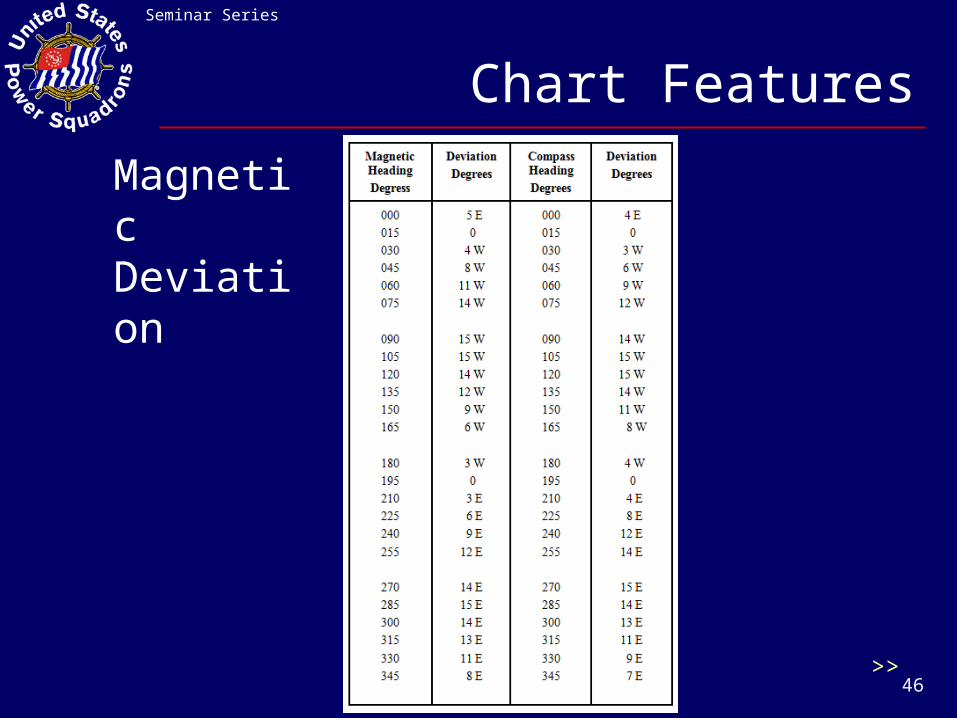
Seminar Series
46
Chart Features
>>
MagneticDeviation

Seminar Series
47
True versus Magnetic
Difference is called “Variation”
- Location of Magnetic North changes over time Variation
- East Coast - Magnetic North is to the West of True- West Coast - Magnetic North is to the East of True
Source of Information
- Compass Rose- Variation –
• Amount – East or West‘as of [date]’ and ‘annual change’
>>

Seminar Series
48
True versus Magnetic
T … true
V … variation
M … magnetic
D … deviation
C … compass
>>

Seminar Series
49
True versus Magnetic
T … true
V … variation
M … magnetic
D … deviation
C … compass
>>
True Virgins Make Dull Company … Add Whiskey
+ W or – E … from True to Comp
- W or + E … from Comp to True

Seminar Series
50
True versus Magnetic
T … ??
V … 4 W
M … ??
D … 0 deg
C … 360 deg
>>

Seminar Series
51
Compass Rose
Variation Reference
AnnualChange
MagneticScale
True North
>>

Seminar Series
52
Planning on Your Chart
>>

Seminar Series
53
Planning
You are here (START)
You want to go here (DESTINATION)
>>

Seminar Series
54
Planning
Travel from Point A to Point B – “Easy? Right?”
>>

Seminar Series
55
Planning
Shallow Water
Before you start – Check your Chart
>>
Seminar Series
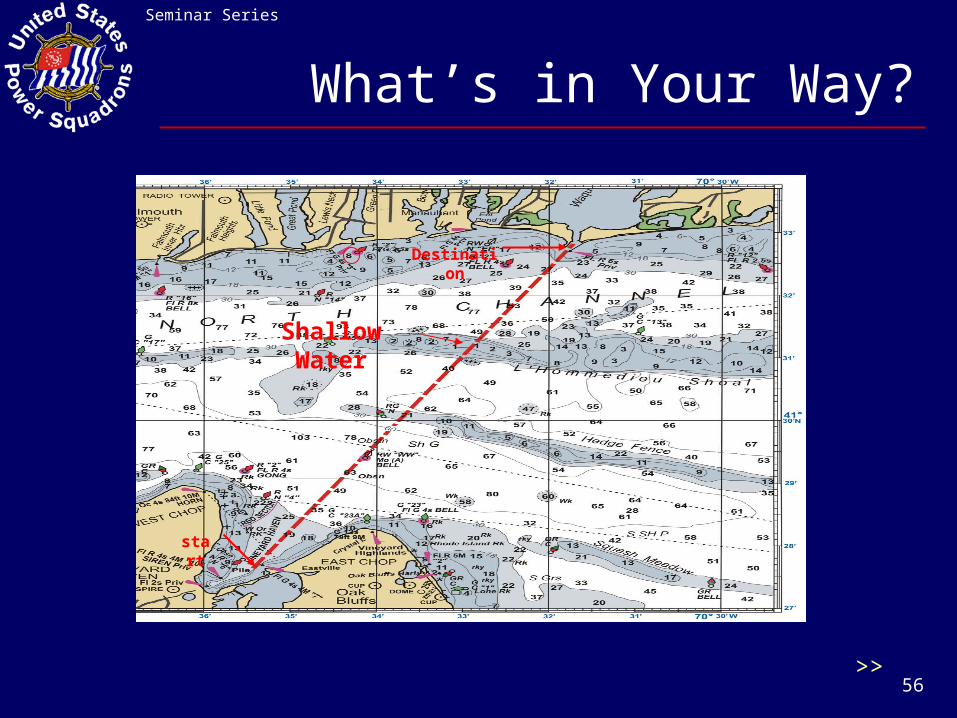
56
What’s in Your Way?
Destination
Shallow Water
start
>>

Seminar Series
57
Selecting a Safe Path
The direct path goes over a shoal – plan a safer passage.
>>

Seminar Series
58
What is a Good Path?
A careful scan along the path from Start to Destination will indicate features that will bar safe passage.
Clearly, careful Planning and a current Chart are essential tools for a navigator.
>>

Seminar Series
59
Chart and GPS Position Accuracy
Chart Correction Date:
• The older your Chart, the more differences between your Chart and reality!
• Check Notices to Mariners (now on-line)
>>
Seminar Series
60
Chart Accuracy
Environmental Factors:
• Large storms or just the daily effects of wind, tide, et cetera, cause coastal areas to be in a constant state of change.
• When in doubt, check the latest obtainable information and sources.
>>
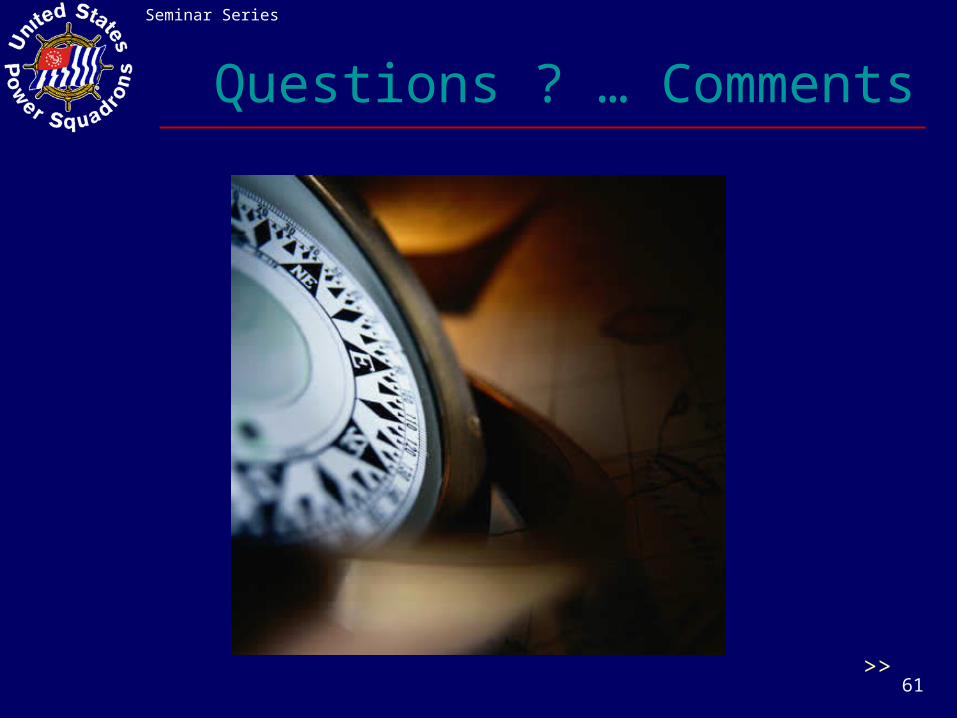
Seminar Series
61
Questions ? … Comments
>>

62
Joining USPS…Joining USPS…
Seminar Series
…and don’t forget to wear your life jacket
…and don’t forget to wear your life jacket
United States Power Squadrons ®
Expand your knowledge and enhance your enjoyment of recreational boating by …


