Seminar on Mainstreaming Energy Sustainable Development … · 2016-08-31 · Why is the social...
24
Energy Indicators for Sustainable Development: Social Dimensions Ralph D. Wahnschafft, Ph. D. Senior Advisor on Sustainable Development Policies Berlin, Germany Seminar on Mainstreaming Energy Sustainable Development Goals (SDGs), Target and Indicators into Statistical Programmes of Select African Countries ECA Conference Centre, Addis Ababa, Ethiopia, - 27-29 June 2016
Transcript of Seminar on Mainstreaming Energy Sustainable Development … · 2016-08-31 · Why is the social...

Energy Indicators
for Sustainable Development:
Social Dimensions
Ralph D. Wahnschafft, Ph. D.
Senior Advisor on Sustainable Development
Policies
Berlin, Germany
Seminar on
Mainstreaming Energy Sustainable Development Goals (SDGs), Target and
Indicators into Statistical Programmes of Select African Countries
ECA Conference Centre, Addis Ababa, Ethiopia, - 27-29 June 2016

United Nations
Global Development Agenda
to 2030:
Sustainable Development Goals (SDGs)
SDG 7: “Ensure access to affordable, reliable, sustainable and
modern energy for all”
Target 7.1: “By 2030, ensure universal access to affordable, reliable,
sustainable and modern energy services”
Target 7.2: “By 2030, increase substantially the share of renewable
energy in the global energy mix”
Target 7.3: “By 2030, double the rate of improvement in energy
efficiency”
2
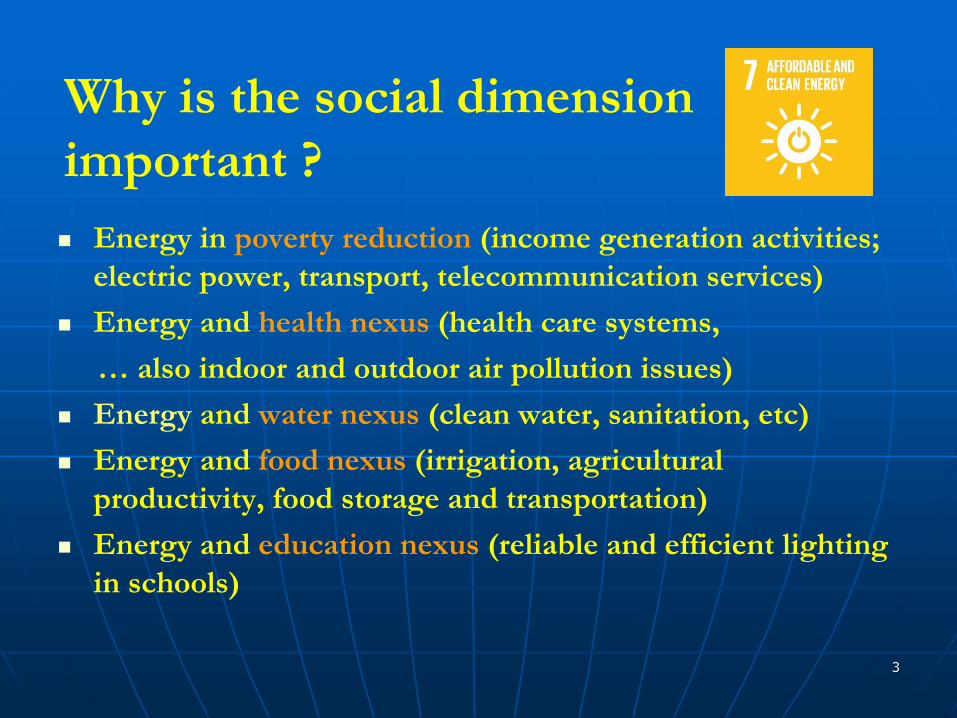
Why is the social dimension
important ?
Energy in poverty reduction (income generation activities;
electric power, transport, telecommunication services)
Energy and health nexus (health care systems,
… also indoor and outdoor air pollution issues)
Energy and water nexus (clean water, sanitation, etc)
Energy and food nexus (irrigation, agricultural
productivity, food storage and transportation)
Energy and education nexus (reliable and efficient lighting
in schools)
3

Lack of access to
modern energy services
1.16 billion people lack access to electricity = 18% of the world’s population –
= 22% of developing countries’ population
2.8 billion people use wood or coal and lack access
to modern energy services for cooking
= 37.5% of the world’s population
inadequate cooking stoves cause indoor air pollution
Mostly in sub-Saharan Africa and South Asia
Mostly in rural areas
4
“ The test of our progress is not whether we
add more to the abundance of those who have
much, it is whether we provide enough for
those who have too little ”
Franklin Roosevelt
5

Energy Indicators fir
Sustainable Development
6
Common methodology:
4 social indicators
16 economic indicators
10 environmental indicators

Social dimension indicators
7

Role and meaning of indicators ?
Essential basis for policy dialogue and policy making:
Basis for public awareness creation;
Basis for political debate and decision making at
national, provincial and local levels;
Basis for feasibility analysis and investment decisions
in businesses and in public (energy) infrastructure;
Basis for public private partnerships;
Indicators and measurements can have political
significance and may be subject to interpretation /
manipulation: Transparency remains essential
8
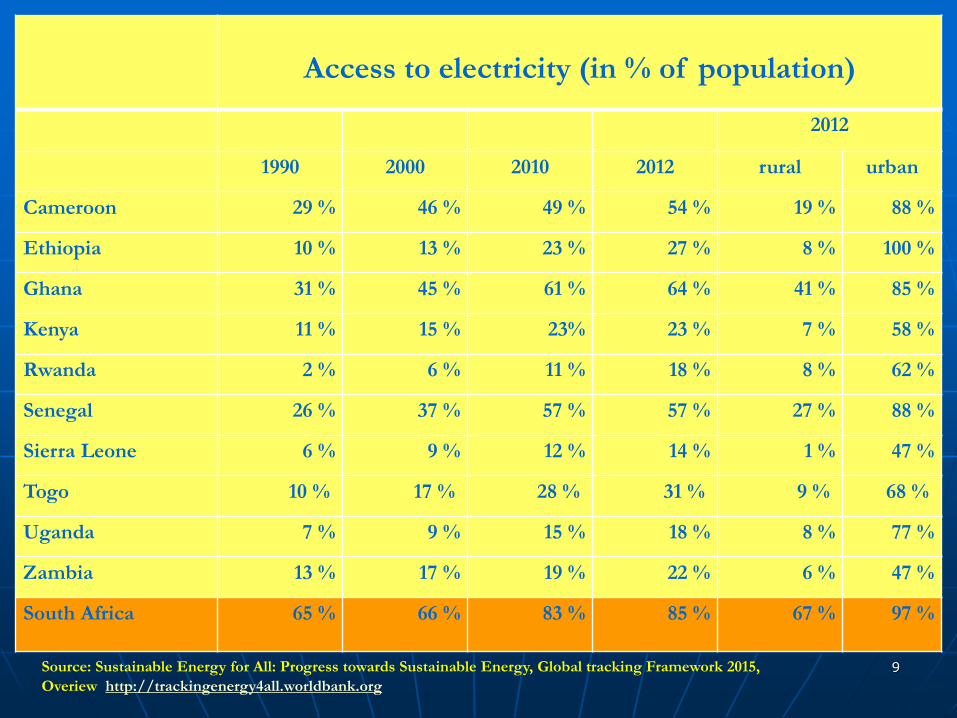
Access to electricity (in % of population)
2012
1990 2000 2010 2012 rural urban
Cameroon 29 % 46 % 49 % 54 % 19 % 88 %
Ethiopia 10 % 13 % 23 % 27 % 8 % 100 %
Ghana 31 % 45 % 61 % 64 % 41 % 85 %
Kenya 11 % 15 % 23% 23 % 7 % 58 %
Rwanda 2 % 6 % 11 % 18 % 8 % 62 %
Senegal 26 % 37 % 57 % 57 % 27 % 88 %
Sierra Leone 6 % 9 % 12 % 14 % 1 % 47 %
Togo 10 % 17 % 28 % 31 % 9 % 68 %
Uganda 7 % 9 % 15 % 18 % 8 % 77 %
Zambia 13 % 17 % 19 % 22 % 6 % 47 %
South Africa 65 % 66 % 83 % 85 % 67 % 97 %
9 Source: Sustainable Energy for All: Progress towards Sustainable Energy, Global tracking Framework 2015,
Overiew http://trackingenergy4all.worldbank.org

Source: International Energy Agency “Africa Energy Outlook” 2014 10

Potential challenges with Energy Access Indicators:
Lack of data, varying methods, varying definitions
Access to electricity – data collection and analysis
Comprehensive, comparable, systematic data collection
method (typically household surveys),
Reliability of energy supply ? (e.g electricity rationing, black-
out periods, …)
Recording of decentralized power generation (from diesel
generators, or from renewable sources of energy)
Proposed “Energy Access” Redefined: “adequate quantity,
available when needed, good quality, reliable, convenient,
affordable, legal, healthy and safe” (World Bank Group)
11

Recording the contribution of decentralized
power generation to Energy Access Data
Estimated 400 GW capacity of decentralized diesel generator
operating for rural industries, mines, and communities (world
wide), [… often not included in energy statistics];
IRENA estimates some 20 million households (or 100 million
people) are serviced by decentralized off-grid renewable
energy systems (world wide);
- including solar home systems (SHS); renewable-based mini grids; and small
wind turbines
According to some estimates, African developing countries
are installing some 70-100 MW (off-grid) renewables / year
12
Source: Off-Grid Renewable Energy Systems: Status, Methodologies, Issues, IRENA Working Paper 2015
and PV Magazine 2013

Access to non-solid commercial fuels
for cooking and heating
Solid fuels
(e.g. wood, charcoal,
agricultural residues,
briquettes)
Use of solid fuels in inefficient or without cook stoves causes indoor air pollution
(by particulates, black carbon, carbon monoxide) and respiratory diseases
Non-solid fuels
Liquid fuels (e.g. kerosene, ethanol, biofuels), or
Gaseous fuels (natural gas)
13
Photo source: flickr

Access to non-solid commercial fuels (in % of population)
2012
1990 2000 2010 2012 rural urban
Cameroon 14 % 20 % 22 % 22 % 4 % 41 %
Ethiopia 4 % 6 % 3 % 2 % 2 % 18 %
Ghana 2 % 8 % 15 % 17 % 4 % 29 %
Kenya 19 % 20 % 17 % 16 % 3 % 49 %
Rwanda 2 % 2 % 2 % 2 % 2 % 2 %
Senegal 32 % 38 % 39 % 39 % 8 % 69 %
Sierra Leone 6 % 6 % 2 % 2 % 2 % 2 %
Togo 2 % 2 % 4 % 5 % 2 % 9 %
Uganda 2 % 3 % 3 % 3 % 2 % 10 %
Zambia 4 % 13 % 17 % 17 % 3 % 42 %
South Africa 60 % 75 % 85 % 87 % 67 % 96 %
14 Source: Sustainable Energy for All: Progress towards Sustainable Energy, Global tracking Framework 2015,
Overiew http://trackingenergy4all.worldbank.org

15
IEA (2014): Africa Energy Outlook, page 132
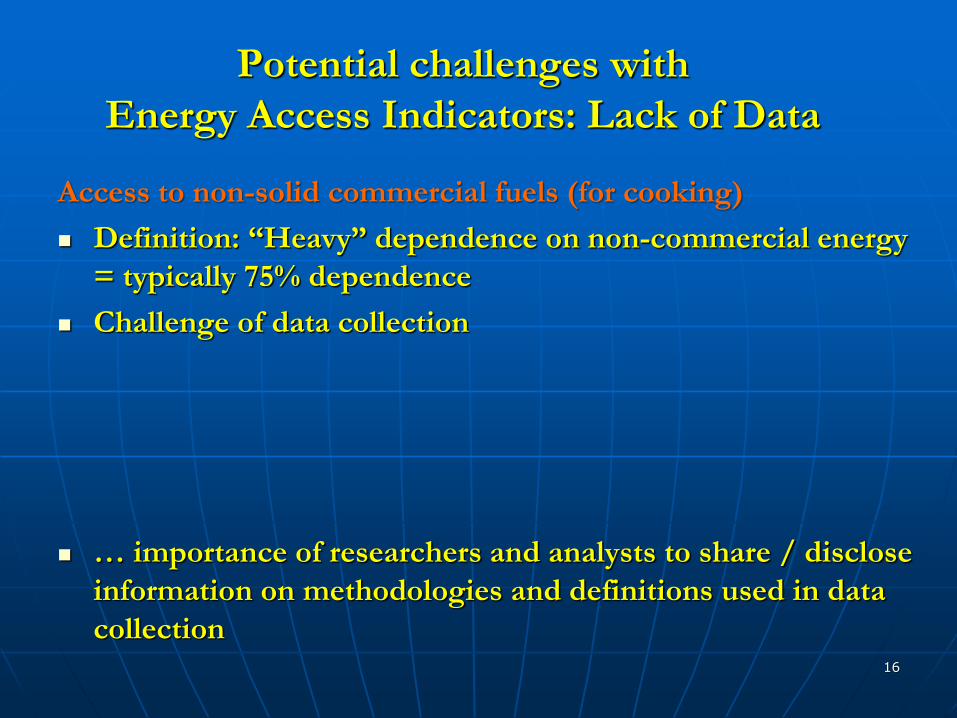
Potential challenges with
Energy Access Indicators: Lack of Data
Access to non-solid commercial fuels (for cooking)
Definition: “Heavy” dependence on non-commercial energy
= typically 75% dependence
Challenge of data collection
… importance of researchers and analysts to share / disclose
information on methodologies and definitions used in data
collection 16
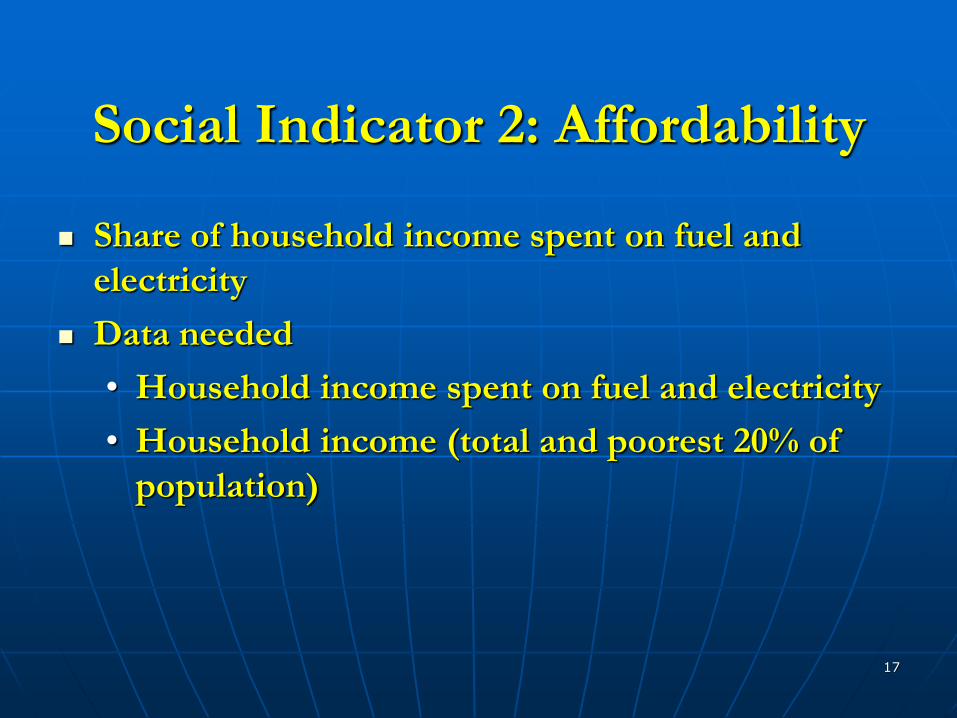
Social Indicator 2: Affordability
Share of household income spent on fuel and
electricity
Data needed
• Household income spent on fuel and electricity
• Household income (total and poorest 20% of
population)
17

“Energy Poverty” “Energy poverty” is an important social issue and concept,
even if no agreed definition exists.
Evidence from many countries indicate that poor households typically spend a higher percentage of their disposable income on energy than wealthier ones.
When households are forced
to spend as much as 10% to
20% of their cash income on
energy, they are being deprived
of other basic goods and
services necessary to
sustain life.
Migrant Workers Cooking-India: Photo WB/Curt Carnemark

Social Indicator 3: Disparities
Household energy use for each income group and
corresponding fuel mix
Data needed
• Energy use per household for each income
group (quintiles)
• Household income for each income group
(quintiles)
• Corresponding fuel mix for each income group
(quintiles)
19

Example: Household Energy
Spending in the UK 2002-2012
20
Source: Office of National Statistics, UK: 5 facts about household energy spending in the UK

21
Statistics South Africa (2012), IFC (2012), Barnes, Singh and Shi (2010) ,
in: IEA (2014): Africa Energy Outlook, page 67

22
IEA (2014): Africa Energy Outlook, page 66

Social Indicator 4: Safety
Accident fatalities per energy produced by
fuel chain
Data needed
• Annual fatalities by fuel chain
• Annual energy produced
23
Thank you
Further information:
Ralph D. Wahnschafft
D- 14163 Berlin, Germany, Tel: +49-(0)172-873 8606