SEMICONDUCTORS -...
30
Transcript of SEMICONDUCTORS -...


SEMICONDUCTORS AND SEMIMETALS VOLUME 19 Deep Levels, GaAs, Alloys, Photochemistry

This page intentionally left blank

SEMICONDUCTORS AND SEMIMETALS Edited by R . K . WILLARDSON
WILLARDSON CONSULTING SPOKANE, WASHINGTON
ALBERT C . BEER BATTELLE COLUMBUS LABORATORIES COLUMBUS, onio
VOLUME 19 Deep Levels, GaAs, Alloys, Photochemistry
1983
ACADEMIC PRESS A Subsidiary of ffarcourt Brace Jovanovich, Publishers
New York London Paris San Diego San Francisco Sdo Paul0 Sydney Tokyo Toronto

COPYRIGHT @ 1983, BY ACADEMIC PRESS, INC. ALL RIGHTS RESERVED. NO PART OF THIS PUBLICATION MAY BE REPRODUCED OR TRANSMITTED IN ANY FORM OR BY ANY MEANS, ELECTRONIC OR MECHANICAL, INCLUDING PHOTOCOPY, RECORDING, OR ANY INFORMATION STORAGE AND RETRIEVAL SYSTEM, WITHOUT PERMISSION IN WRITING FROM THE PUBLISHER.
ACADEMIC PRESS, INC. 111 Fifth Avenue, New York, New York 10003
United Kingdom Edition published by ACADEMIC PRESS, INC. (LONDON) LTD. 24/28 Oval Road, London NWl IDX
Library of Congress Cataloging in Publication Data (Revised for volume 19) Main entry under title:
Semiconductors and semimetals.
Includes bibliographical refercnccs and indexes. Contents: v. 1-2. Physics of Ill-V compounds-.
v. 3. Optical properties o f I l l -V compounds- [etc.] -- v. 19. Deep levels, GaAs, alloys, photochemistry.
1. Semiconductors--Collected works. 2. Semimetals-- Collected works. 1. Willardson, Robert K. 11. Beer, Albert C. QC610.9.S47 537.6'22 65-26048 ISBN 0-12-7521 19-4
PRINTED IN THE UNITED STATES OF AMERICA
83 84 85 86 9 8 1 6 5 4 3 2 1

Contents
LIST OF CONTRIBUTORS . . . . . . . . . . . . . PREFACE . . . . . . . . . . . . . . . .
Chapter 1 Deep Levels in Wide Band-Gap 111-V Semiconductors
G . F . Neurnark and K . Kosai
I . Introduction . . . . . . . . . . . . . . I1 . Experimental Characterization of Deep Levels . . . . . . .
111 . Observation and Intercomparison of Deep Levels . Results for GaAs and GaP . . . . . . . . . . .
IV . Theory of Recombination . . . . . . . . . . . V . Analysis of Optical Cross Sections . . . . . . . . .
References . . . . . . . . . . . . . .
Chapter 2 The Electrical and Photoelectronic Properties of Semi-Insulating GaAs
David C . Look
List of Symbols . . . . . . . . . . . . . I . Introduction . . . . . . . . . . . . . . I1 . Hall Effect and Magnetoresistance . . . . . . . . .
111 . Thermal Equilibrium Processes . . . . . . . . . . IV . Nonequilibrium Processes . . . . . . . . . . . V . Comparison of Techniques . . . . . . . . . . .
Appendix A . Charge Transport Theory . . . . . . . . Appendix B . Semiconductor Statistics . . . . . . . . Appendix C . Derivation of TSC and PITS Equations . . . . . References . . . . . . . . . . . . . .
Chapter 3 Associated Solution Model for Ga-In-Sb and Hg-Cd-Te
R . F . Brebrick. Ching-Hua Su. and Pok-Kai Liao
List of Symbols . . . . . . . . . . . . . I . Introduction . . . . . . . . . . . . . .
I1 . Thermodynamic Equations for the Liquidus Surface of (A,-.B,)C(s) . . 111 . Solution Thermodynamics . . . . . . . . . . . IV . Associated Solution Model for the Liquid Phase . . . . . .
V
vii ix
1 7
20 30 52 65
76 77 77 86 96
121 127 148 162 167
172 173 178 181 186

vi CONTENTS
V . Ga-In-SbTernary . . . . . . . . . . . . 197 VI . Hg-Cd-TeTernary . . . . . . . . . . . . 214
VII.Sununary . . . . . . . . . . . . . . 230 AppendixA . . . . . . . . . . . . . . 231 Appendix B . . . . . . . . . . . . . . 234 AppendixC . . . . . . . . . . . . . . 242 References . . . . . . . . . . . . . . 251
Chapter 4 Photoelectrochemistry of Semiconductors Yu . Yu . Gurevich and Yu . V . Pleskov
List of Symbols . . . . . . . . . . . . . 256 I . Introduction . . . . . . . . . . . . . . 257
I1 . General Concepts of the Electrochemistry of Semiconductors . . . . 259 III . The Theory of Processes Caused by Photoexcitation
of Semiconductors . . . . . . . . . . . . 273 IV . Photocorrosion and Its Prevention . . . . . . . . . 282 V . Light-Sensitive Etching of Semiconductors . . . . . . . 294
303 310
VIII . Conclusion: Problems and Prospects . . . . . . . . . 323 References . . . . . . . . . . . . . . 324
. . . VI . Processes Caused by Photoexcitation of Reactants in the Solution VII . Selected Problems in the Photoelectrochemistry of Semiconductors . . .
INDEX . . . . . . . . . . . . . . . . 329 CONTENTS OF PREVIOUS VOLUMES . . . . . . . . . . 339

List of Contributors
Numbers in parentheses indicate the pages on which the authors’ contributions begin
R. F. BREBRICK, Materials Science and Metallurgy Program, College of Engineering, Marquette University, Milwaukee, Wisconsin 53233 (171)
Yu. YA. GUREVICH, Institute of Electrochemistry, Academy of Sciences of the USSR, 117071 Moscow, USSR (255)
K. KOSAI,’ Philips Laboratories, Briarcliff Manor, New York 10510 (1)
POK-KAI LIAO, Materials Science and Metallurgy Program, College of Engineering, Marquette University, Milwaukee, Wisconsin 53233 (171)
DAVID C. LOOK, University Research Center, Wright State University, Dayton, Ohio 45435 (75)
G. F. NEUMARK, Philips Laboratories, Briarcliff Manor, New York 10510 (1)
Yu. V. PLESKOV, Institute of Electrochemistry, Academy of Sciences of the USSR, 117071 Moscow, USSR (255)
CHING-HUA Su, Materials Science and Metallurgy Program, College of Engineering, Marquette University, Milwaukee, Wisconsin 53233 (171)
I Present address: Santa Barbara Research Center, Goieta, California 931 17.
vii

This page intentionally left blank

Preface
This treatise reflects the rapid growth in the field of semiconductors and semimetals. Chapters 1 and 2 of the present volume are concerned with deep levels in wide band-gap III-V compounds and the measurement techniques used to characterize such levels. These chapters provide a background for the next volume, which will address the use of semi- insulating GaAs in digital and microwave integrated circuits (ICs) as well as providing valuable insight into methods of improving solar cells, lasers, and light-emitting diodes (LEDs). Chapter 3 in the present volume is concerned with thermodynamic modeling to improve Hg-Cd-Te phase diagrams applicable to the infrared detector arrays discussed in Volume 18 of this treatise. Chapter 4 treats photoelectrochemistry (PEC), an emerging technology.
Chapter 1 focuses on the characteristics of deep states in wide band-gap III-V compound semiconductors, particularly the recombination proper- ties which control minority-carrier lifetime and luminescence efficiency. These properties are significant for many optoelectronic devices, includ- ing lasers, LEDs, and solar cells. While this review emphasizes areas of extensive recent development, it also provides references to previous comprehensive reviews. The compilation of levels reported in GaAs and GaP since 1974 is an important contribution, as is the discussion of the methods used to characterize these levels.
Recombination at and excitation from deep levels are emphasized. Nonradiative transitions at defect levels-Auger, cascade capture, and multiphonon emission processes-are discussed in detail. Factors to be considered in the analysis of optical cross sections which can give infor- mation about the parity of the impurity wave function and thus about the symmetry of a particular center are reviewed.
In Chapter 2, not only are the electrical and optical properties of semi- insulating GaAs discussed, but also the measurement techniques are criti- cally reviewed. GaAs digital IC and monolithic microwave IC technolo- gies are dependent on the development of reliable substrate materials and an understanding of the deep levels of GaAs. Thus these first two chapters provide an important background to the discussion of the crystal growth and device fabrication techniques for GaAs, which are the subjects of Volume 20 of this treatise “Semiconductors and Semimetals .”
Automated computer-controlled measurement techniques for Hall ef- fect, photoconductivity, and photo-Hall measurements in semi-insulating
ix

x PREFACE
materials as well as methods for the calculation of electron mobilities for this case of mixed conduction are presented. Particularly significant is the comparison of the results of the various techniques to determine carrier lifetimes, impurity concentrations, and activation energies in addition to the identification of impurity and defect levels. The appendixes contain the derivation of pertinent charge transport theory for mixed conduction as well as the derivation of occupation factors and thermally stimulated (TSC) and photoinduced transient current spectroscopy (PITS) equa- tions.
Mercury-cadmium-telluride is the principal semiconductor now being used in advanced infrared systems, both for military and other surveil- lance applications. Its preparation and use in infrared detectors and ar- rays was the subject of Volume 18 of this treatise. New generations of detectors and arrays require sophisticated epitaxial growth, which in turn requires precise phase diagram data.
It is therefore essential that thermodynamic modeling be applied to obtain a simultaneous quantitative fit to the phase diagram and thermody- namic data in order to evaluate the internal consistency of the various published data. Then a reliable framework can be established for smooth- ing, interpolating, and extrapolating experimental data that are costly and laborious to obtain. In Chapter 3 an associated solution model is pre- sented. This model provides a good fit to the data for the Hg-Cd-Te system as well as for the Ga-In-Sb system, which is closer to the simpler picture of an ideal solution.
Photoelectrochemistry (PEC) is emerging from the research laborato- ries with the promise of significant practical applications. One application of PEC systems is the conversion and storage of solar energy. Chapter 4 reviews the main principles of the theory of PEC processes at semicon- ductor electrodes and discusses the most important experimental results of interactions at an illuminated semiconductor-electrolyte interface. In addition to the fundamentals of electrochemistry and photoexcitation of semiconductors, the phenomena of photocorrosion and photoetching are discussed. Other PEC phenomena treated are photoelectron emission, electrogenerated luminescence, and electroreflection. Relationships among the various PEC effects are established.
The editors are indebted to the many contributors and their employers who make this treatise possible. They wish to express their appreciation to Willardson Consulting and Battelle Memorial Institute for providing the facilities and the environment necessary for such an endeavor. Special thanks are also due the editors’ wives for their patience and under- standing.
R. K. WILLARDSON ALBERT C. BEER

SEMICONDUCTORS A N D SEMIMETALS. VOL. 19
CHAPTER 1
Deep Levels in Wide Band-Gap 111-V Semiconductors
G. F. Neumark and K . Kosai*
PHILIPS LABORATORIES BRIARCLIFF MANOR. NEW YORK
I. INTRODUCTION . . . . . . . . . . . . . '. . . . . . . . . . . . . . . . . 11. EXPERIMENTAL CHARACTERIZATION OF DEEP LEVELS . . . . . . . .
1. General Discussion . . . . . . . . . . . . . . . . . . . . . . . . . . 2. Experimental Techniques . . . . . . . . . . . . . . . . , . . . . . 3. Identification of Deep Levels . . . . . . . . . . . . . . . . . . . .
111. OBSERVATION AND INTERCOMPARISON OF DEEP LEVELS. RFSULTS F O R G A A S A N D G A P . . . . . . . . . . . . . . . . . . . . . . . . . . . 4. Introduction . . . . . . . . . . . . . . . . . . . . . . . . . . . . . 5 . G a P . . . . . . . . . . . . . . . . . . . . . . . . . . . . . . . . . . 6. GaAs . . . . . . . . . . . . . . . . . . . . . . . . . . . . . . . . .
IV. THEORY OF RECOMBINATION. . . . . . . . . . . . . . . . . . . . . . . I . Radiative Recornhination . . . . . . . . . . . . . . . . . . . . . . 8. Nonradiative Recombination: General Aspects . . . . . . . . . 9. Nonradiative Recornhination: Auger and Cascade. . . . . . . .
10. Nonradiative Recornhination: Multiphonon Emission . . . . . .
11. General Discussion. Complications . . . . . . . . . . . . . . . . . 12. Electronic Cross Section . . , . . . , . . . . . . . . . . . . . . . R-NC . . . . . . . . . . . . . . . . . . . . . . . . . . . . . . . . . .
v. ANALYSIS OF OPTICAL CROSS SECTIONS . . . . . . . . . . , . , . . .
1 i 7
15 19
20 20 26 26 30 30 30 32 35 52 52 56 65
I. Introduction
This chapter focuses on the properties of deep states in wide band-gap 111-V semiconductors. Deep states are important in semiconductors in general and very often determine the recombination properties. Wide band-gap 111-V compounds are now commonly used for many important optoelectronic devices (for example, lasers, light-emitting diodes, and Gunn diodes), and are being suggested for additional interesting applications (for example, solar cells). In view of the importance of such work there are a number of earlier
* Present address: Santa Barbara Research C e n t e r , Goleta, California.
Copyright @ 1983 by Academic Press, Inc. All rights of reproduction in any form reserved.
ISBN 012-7521 19-4
1

2 G. F. NEUMARK AND K. KOSAI
reviews on various aspects (see below for a partial listing), and these will be referred to when appropriate. However, those on deep states are generally not slanted specifically towards 111-V’s, and those on the 111-V materials either do not emphasize deep states or are fairly brief. We thus feel that the present work fills a noe l and appropriate slot.
In discussing deep levels in wide band-gap semiconductors, the first requirement is to define “deep” and “wide.” The latter can be done relatively easily, although arbitrarily. We list in Table I the 4°K band gaps of the various 111-V semiconductors, based on the tabulation by Strehlow and Cook (1973). We shall call those with E , > 1.5 eV the wide band-gap ones. In practice, our review will present data only on GaAs and on GaP as prototypes of direct and indirect gap materials of this class. These are also the only two materials of this class that have been extensively studied and that are in common use. Discussion of deep levels in ternary and quarternary alloys of 111-V semi- conductors are omitted since treating these in detail might well have doubled the size of this chapter.
The next step is the definition of “deep.” The choice of quantitative values will again involve some arbitrariness. However, a further complication is that there is at present no universally accepted qualitative criterion. For instance, from the point of view of energy level calculations it is often convenient to define deep states as noneffective-mass-like or as those with a localized potential (see, for example, Bassani and Pastori Parravicini, 1975; Jaros, 1980). However, the disadvantage of this definition of deep is that it includes many isoelectronic states that are very shallow on an energy scale. On the other hand, if one uses an energy criterion, should the states be deep with respect to some fraction of the band gap, with respect to kT, or with respect to some shallow levels? In this chapter we shall adopt an energy criterion for “deep,” and we shall require that our states be deep enough to be important in recombination. The importance of deep levels in recombination under many conditions of practical interest was already realized in the early work of Hall
TABLE I
BAND GAPS (9 AT 0 OR 4°K� ~
N P As Sb
B 3.4 A1 2.5 2.2 1.6 Ga 2.2 1.5 0.8 In 1.4 0.4 0.2
From Strehlow and Cook (1973).

1. DEEP LEVELS IN WIDE BAND-GAP 1II-V 3
(1952)� and of Shockley and Read (1952), based on a one-defect model. Qualitatively, if a carrier, say an electron, is captured by a center, the subsequent step can either be recombination or reemission to the band. The latter does not lead to recombination. Moreover, it is well known that the latter becomes increasingly more probable the closer a level is to the band. This aspect has, for instance, been used to separate levels into “traps,” with reemission more probable, or “recombination centers” [see, for example, Rose (1955, 1957), Bube (1960), or Blakemore (1962)l. A convenient way of quantifying this importance of “deep” levels to recombination is via the “occupancy” factor f of a level, i.e., the probability that a level is filled. This approach has often been used to analyze the decay in GaP (see, for example, Jayson et al., 1970; Dishman and DiDomenico, 1970; Neumark, 1974). Under quasiequilibrium conditions this occupancy factor gives the fraction of levels available for recombination. It can be shown that it is given (Neumark, 1974), e.g., for n-type material, by
f = [1‘+ (N,/gn)exp(-EJkT)]-’. (1 ) Here N , is the density of states in the conduction band, g the level degeneracy factor, n the carrier concentration in the band, EA the activation energy of the level, k Boltzmann’s constant, and T the temperature. Now, in general, except at fairly low temperatures, the occupancy for shallow levels (withf = fS) will be small, i.e., fs << 1, and consequently
f S = (yn/N,) exp(Ei/kT), (2) where E i is the energy of the shallow level. Now if we wish a deep level (with f = f ” ) to be appreciably more effective in recombination, the requirement is f” >> fS. A sufficient condition is obtained by omitting the factor of unity in Eq. (l), i.e., for
exp[(Ei - E;)/kT] >> 1 . (3)
f ” z l 0 f S (4)
E: - E i z 0.06 eV. ( 5 )
For an arbitrary criterion that, at room temperature,
this gives
In GaAs, the shallow acceptors (Zn, Cd) have an energy of ~ 0 . 0 3 eV, and we thus regard acceptors in GaAs as deep for E: 2 0.1 eV. The donors are more shallow, but we shall nevertheless also use the same criterion for the donors. In Gap, one commonly used acceptor, Zn, is at E A z 0.07 eV, but the common donors (S, Se, Te) as well as the Cd acceptor are at EA z 0.1 eV. Thus for GaP we use the criterion E: 2 0.15 eV.

4 G. F. NEUMARK AND K. KOSAI
The next factor we consider about deep levels is why they are important. Here, a particular reason why we defined “deep” in terms of the recombination properties is because of the profound influence of such recombination on material behavior. Properties specifically affected can include the minority- carrier lifetime and the luminescence efficiency. If deep levels dominate the recombination, these properties will be degraded from the value obtained from the “dopants.” (The dopants are deliberately added impurities, used to provide either desired electrical and/or luminescent properties. Dopants usually introduce shallow levels, although there are some exceptions-for example, red GaP diodes utilize a deep level.) Moreover, degradation of a diode or laser during operation can be caused by formation of deep levels. In this connection it can be noted that really deep levels-which at midgap in GaP would be located at - 1.1 eV from the band edge-can dominate the behavior at very low concentrations, possibly even at 1012-10’4 cm-3 [see Eq. (1) and related discussion]. It was thus soon realized that a study and understanding of deep levels is required for improved recombination performance. A second important role of such levels is in giving high resistivity material. This aspect has been covered, for instance, in Rees (1980) and in a recent detailed quantitative analysis by Neumark (1982); the latter emphasizes that the condition for obtaining high resistivity, in, e.g., n-type material, is NDl < N A < (ND1 + N,,), where ND1 is the concentration of shallow donors, N D , is that of deep donors, and N , is that of acceptors.
As regards this chapter, we shall emphasize areas of extensive recent development. However, this emphasis is subject to the constraint that we cover only briefly subjects that have been treated in adequately comprehensive recent reviews. Progress in experimental studies on deep levels has been both extensive and rapid. In Part I1 we cover the various methods available for characterization and in Part I11 give a compilation of levels reported in GaAs and GaP since 1974 (together with a few important levels that were already well characterized previously). This particular year was chosen since Milnes (1973) gives a good review of earlier values. On theoretical aspects, there have been corresponding numerous treatments. Such work has included calculations on both the energies of deep levels and on their properties. In this chapter we emphasize the properties, i.e., recombination at (Part IV) and excitation from (Part V) the deep levels. The reason is partly that it is these properties that determine the behavior of the material (the role of recombination has already been emphasized above). However, a second reason is due to several recent comprehensive reviews on level calculations. These are by Masterov and Samorukov (1978), Pantelides (1978), Jaros (1980,1982), Lannoo and Bourgoin (1981), and Vogl(1981), and among them they cover the field quite adequately. Consequently, we do not cover this topic in the main body of our chapter, but just give a comment here on the progress ofsuch calculations in the past few years. Thus in 1977 it was complained “that

1. DEEP LEVELS IN WIDE BAND-GAP 1II-V 5
there is no general formalism available . . . to predict the physical properties” of deep centers (Grimmeiss, 1977). However, already the same year, Mircea et al. (1977) argued on theoretical grounds against the A level in GaAs (at 0.75- 0.8 eV) being due to substitutional oxygen: “Comparison of the calculated activation energies with the experimental ones.. . can hardly support our hy- pothesis that the trap is 0 at the As site.” Two years later Huber et al. (1979) proved that, indeed, this trap was not due to OAs. A further restriction is that we try to cover the broad picture, applicable to levels in general, and use specific levels primarily as examples. We omit detailed discussion of any one level, since a book reviewing specific deep centers is currently in preparation (Pantelides, 1983).
It must also be kept in mind in connection with both analysis of data and theoretical calculations that most (although certainly not all) treatments assume “simple” levels. By this we mean that a level consists of a single ground state, with excitation to the band represented, if necessary, by a single upper state in the configuration coordinate picture (see Section 10b for a description of this model). Also, in this simple picture, effects of temperature (other than those included via the configuration coordinate model) and field are neglected. It has become apparent that in many cases this is an oversimplified picture. Complications can include excited states (which can also be metastable), multiple charge states, resonant “band” states, a distribution of level energies, and level properties that depend on field and/or temperature. Examples of treatments that include some complications-some of which will again be referred to subsequently-follow. Thus, evidence for an excited state of the one-electron center of GaP(0) has been obtained by Samuelson and Monemar (1978) from photo-cross-section data. Lang and Logan (1977) have postulated metastable states to explain persistent photoconduction in GaAlAs; such states have also been postulated by Bois and Vincent (1977) for a deep oxygen associated level in GaAs, based on photo- and thermal-cross- section results, as well as by Baraff et al. (1982) for the two-electron state of GaP(O), from theory. A theoretical treatment of multiphonon recombination preceded by capture at an excited state has been suggested by Gibb et al. (1977), and applied to a deep hole trap in Gap. As regards impurities with multiple charge states, a recently very thoroughly studied example is GaAs(Cr). This system, as well as some complications arising from such systems in general, are discussed for instance by Allen (1980), Blakemore (1980), Clark (1980), White (1980), and White et al. (1980). In this connection we should also mention the “Anderson negative-U case, consisting of systems with multiple levels whose relative stability depends on Fermi energy (Baraff et al., 1979); to date levels of this type have been postulated only in Si, although they may well exist also in other semiconductors. Possible effects of resonant states (with energies in the band region but with localized properties) on excitation spectra have been discussed by Pantelides and Grimmeiss (1 980).

6 G. F. NEUMARK A N D K. KOSAI
An excited state of Cr2+ lying above the conduction-band edge has since been fairly conclusively established for GaAs by Eaves et al. (1981) and by Hennel et al. (1981). Results from a distribution of levels have been analyzed by Ridley and Leach (1977), and applied to oxygen-doped GaAs by Leach and Ridley (1978) and by Arikan et al. (1980). As regards temperature dependence of level properties, the theory of the influence of entropy on the level ionization energies has been given by Van Vechten and Thurmond (1976). A detailed experimental study of the energy variation with temperature of the one- electron level of GaP(0) has been carried out by Samuelson and Monemar (1978). Results are at some variance with the Van Vechten and Thurmond theory, indicating that other factors may also play a role. There also can be temperature dependences for cross sections; this aspect, for multiphonon recombination, is treated in detailed in Section 10. On field dependences, that of the thermal cross section has recently been studied-experimentally and theoretically-by Vincent et al. (1979), Pons and Makram-Ebeid (1979), Makram-Ebeid (1980, 1981), Makram-Ebeid et al. (1980), Martin et al. (1981), and by Makram-Ebeid and Lannoo (1982a,b). Also, evidence for a field dependence of the optical cross section has been presented by Monemar and Samuelson (1978).
Despite the complications referred to in the above paragraph, many papers, and also in large part this chapter, treat only the simple case. As will become apparent from the subsequent treatment in this review, the simple case can by itself become quite complicated.
As the final part of this Introduction, we list earlier reviews of interest to deep levels and/or 111-V semiconductors. There are, of course, the volumes of this treatise. Authored books (i.e., not edited ones consisting of a compilation of articles) include Milnes (1973), of high general relevance, and, since 1975, Bassani and Pastori Parravicini (1975), Stoneham (1973, Englman (1979), Lannoo and Bourgoin (1981), Jaros (1982), all highly relevant to theory, and Watts (1977), combining experimental and theoretical aspects. As regards articles, we shall attempt to mention all of those published since 1977. Fairly general reviews are “Deep Level Impurities in Semiconductors” by Grimmeiss (1 977), and “111-V Compound Semiconductors” by Dean (1977). Papers emphasizing experimental methods are by Ikoma et al. (1977), Miller et al. (1977), Lang (1979), Bois and Chantre (1980), Grimmeiss (1980), Mircea et al. (1980), and Kimerling (1981). Theoretical calculations of level energies are covered by Masterov and Samorukov (1978), Pantelides (1978), Jaros (1980), Bernholc et al. (1981), and Vogl (1981). Work on recombination and nonradiative processes in general is reviewed by Stoneham (1977,1981), Mott (1978), Queisser (1978), and Toyozawa (1978), as well as in the book “Radiationless Processes,” edited by Di Bartolo (1 98 1). A listing of various deep levels is given by Ikoma et al. (1977), by Masterov and Samorukov (1978),

1. DEEP LEVELS IN WIDE BAND-GAP 1II-V 7
by Mircea and Bois (1979), and by Martin (1980). Reviews of optical and/or electron paramagnetic resonance characterization are by Kaufmann and Schneider (1980), Cavenett (1981), Corbett et al. (198l), Kennedy (1981), Monemar (I98 I), and Schneider and Kaufmann (I98 1). Somewhat more specialized aspects are covered by Lang (1977) on “Review of radiation- induced defects in III-V compounds,” by Landsberg and Robbins (1978) on “The first 70 semiconductor Auger processes,” by Abakumov et al. (1978) on the cascade process, “Capture of carriers by attractive centers in semiconductors,” by Langer (1980) on “Large defect-lattice relaxation phenomena in solids,” as well as by Dean and Choyke (1977) and Kimerling (1978, 1979) on recombination-enhanced defect reactions. Several additional review papers are also included in the 1978 “International Conference on the Physics of Semiconductors,” edited by Wilson (1979), as well as in the 1980 one, edited by Tanaka and Toyozawa (l980), as well as in “Semi-Insulating III-V Materials,” edited by Rees (1980).
11. Experimental Characterization of Deep Levels
1 . GENERAL DISCUSSION
A variety of experimental methods for the characterization of deep levels in semiconductors have been developed in the past decade and are discussed in several excellent review articles. Lang (1 979), Mircea et al. (1980), Sah (1976), and Sah ef al. (1970) review the application of space-charge regions to the study of deep levels. Grimmeiss (1974,1977,1980) concentrates on the various junction photocurrent and photocapacitance methods for determining the photoionization cross sections of deep states. Miller et al. (1977) discuss the capacitance transient methods that have been developed to measure thermal emission and capture rates. Martin (1980) treats, within the context of semi- insulating GaAs, those techniques most suited to highly resistive materials. Kaufmann and Schneider (1 980), Kennedy (1981), and Schneider and Kaufmann (1981) review optical spectroscopy and electron spin resonance of deep levels in III-V semiconductors. The book by Milnes (1973) is the standard reference to the work until the early part of the 1970s. It extensively treats the older deep level methods, including photoconductivity and thermally stimulated current.
Despite the success of purely optical methods such as luminescence and absorption in studying shallow energy levels, they are seldom used for characterization of deep states. This is mainly because the deeper levels of interest are usually nonradiative ones or “killer centers” for which such techniques are not applicable. In addition, the deep position within the energy gap means optical experiments must be performed in the infrared where

8 G. F. NEUMARK A N D K. KOSAI
detectors are not as sensitive as in the visible part of the spectrum. Notable instances where optical methods alone have been successfully employed are 0 (Monemar and Samuelson, 1978), as well as complexes such as Zn-0 (Jayson et al., 1972), and some Cu related ones (Monemar et al., 1982; Gislason et al., 1982) in Gap.
Capture and emission processes at a deep center are usually studied by experiments that use either electrical bias or absorbed photons to disturb the free-carrier density. The subsequent thermally or optically induced trapping or emission of carriers is detected as a change in the current or capacitance of a given device, and one is able to deduce the trap parameters from a measurement of these changes.
A description of the emission and capture processes at a trap will be useful before discussing the various experimental methods. Figure 1 depicts the capture and emission processes that can occur at a center with electron energy ET. The subscripts n and p denote electron and hole transitions, and the superscripts t and o differentiate between thermally and optically stimulated processes. It is assumed here that only thermal capture processes are occurring.
The rate equation for nT, the density of traps occupied by an electron, is
dflT/dt = (nC, + ei + eO,)(NT - ?IT)
- (Pep + ei + e%T, (6)
where N , is the total density of traps, n and p are the free-electron and free- hole concentrations, and the emission and capture constants are as defined in Fig. 1. If the free-carrier concentrations, n and p, are constant with time and spatially uniform, Eq. (6) is linear with a solution that exponentially approaches the steady state value
FIG. 1. Emission and capture processes at a deep level of energy E,. The quantities near the arrows are the rates (in s-’) of the processes. Subscripts indicate whether the transition is by an electron (n) or hole ( p ) , and the superscripts indicate a thermal (t) or optical (0) process. The symbol e is an emission rate, c a capture constant, n and p the concentrations of free electrons and holes in the conduction band (at energy E,) and valence band (at energy E J , �and hv, and hv, photon energies.

1. DEEP LEVELS IN WIDE BAND-GAP III-V 9
The time constant of the exponential is given by the sum of all the capture and emission rates:
T = (nc, + pc, + eb + eZ + ez + e;)-' . (8) The thermally activated emission rates are proportional to a Boltzmann
factor, and by use of the principle of detailed balance can be related to the capture cross section (a:):
e: = (a;(u)N,/g)exp( - A E T / k T ) . (9)
The parameter ( u ) is the average thermal velocity of an electron, N, the density of states in the conduction band, g the degeneracy of the deep level, and AET = E, - E, the electron transition energy. Equation (9) also relates the capture constant to the emission rate because of the definition
c, = .;<u>. (10) Similar equations hold for holes with n replaced by p in the subscripts, N , by the valence-band density of states N,, and A E , = ET - E, . The optical emission rate is related to the photoionization cross section (GO) by
eo = uO@,
where @ is the incident photon flux density in cm-2s-1. Equation (9) shows that for B' independent of T, measurement of the
emission rate as a function of temperature yields the trap energy. The temperature dependence of (0,) (a and N,(K T3I2) can be taken into account either by determining the slope of ln(ei/T2) as a function of 1/T or by subtracting 2kTm from the slope of In e: versus 1/T, where T,,, is the average temperature over which the slope of In e: was measured (Miller et al., 1977). However, 0' is often temperature dependent. For instance, Henry and Lang (1977) show that it frequently can be represented by
o'(T) = urn exp( - E , / k T ) , (1 1)
where a, is temperature independent (also see Section 10 for further discussion). This means that the activation energy derived from measure- ments of the temperature dependence of the emission rate includes a contri- bution from the capture cross section. Because e' and 0' are related by Eq. (lo), it is possible to obtain d as a function of temperature by measuring c'. Once this is done, E , can be evaluated and subtracted from the activation energy of the emission rate to yield AET.
Deep level experiments can be divided into thermal and optical categories, depending on which constants are being measured. Both categories can be further subdivided into steady state and transient techniques. An example

10 G. F. NEUMARK AND K. KOSAI
of the former is photoconductivity, whereas deep level transient spectroscopy (DLTS) is in the latter division.
The capture and emission processes at a deep center are most often analyzed by fabricating a device such that the centers under study are in the depletion region of either a p-n or metal-semiconductor junction. This is be- cause the absence of mobile electrons and holes in the space-charge region causes capture to become negligible compared to emission, permitting these two effects to be separated.
It is convenient to adopt the terminology of Miller e l al. (1977) and define a center to be an electron trap if ek >> el. and a hole trap if the reverse is true. In addition, a minority-carrier trap is one for which the emission rate of minority carriers emin is greater than that of majority carriers emaj, whereas for majority-carrier traps emaj >> emin. By these definitions, an electron trap is a majority-carrier trap in an n-type region and a minority-carrier trap in p-type. Note that these definitions are independent of whether the trap is a donor or an acceptor, terms that imply a specific charge state of the center (Pantelides, 1978). Because the emission rates are thermally activated [Eq. (9)], an electron trap usually lies in the upper half of the band gap and a hole trap in the lower.
Before continuing the discussion of deep states, it will be useful to review the p-n junction. Consider a p + - n step junction reverse biased to V volts and having the n-side uniformly doped with N,, net shallow donors and N , deep donor traps located in the upper half of the band gap (Fig. 2a). In the abrupt approximation it is assumed that in the region between x = 0 and x = W( V ) all impurities are ionized and that there are no mobile carriers. As a consequence of this assumption and the uniform distribution of dopants, Poisson’s equation can be easily integrated twice to give the electric field, electron potential, and W( V ) (Sze, 1969). Because the p-side doping is much greater than that of the n, the width of the space-charge region on the p-side can be neglected, giving
(12) w(v) = [2&(I/bi + V)/q(ND + NT)]�2,
where E is the permittivity of the semiconductor, Vbi the built-in potential, and q the elementary charge. Defining the capacitance of the junction as C = AdQ/dV, where A is the junction area and dQ the incremental change in charge per unit area on an increment dVin the reverse bias, yields
c(v) = &A/W(V) = A[qE(ND + N ~ ) / 2 ( V b j + v)]”2. (13) To illustrate the basic ideas of deep state experiments, assume that no
photons are incident on the junction of Fig. 2a, so that the optical emission rates ez and e i are zero. Under a reverse bias applied sufficiently long to give steady state, because n = p = 0, the capture terms of Eq. (7) are also

1. DEEP LEVELS IN WIDE BAND-GAP I1I-V 11
FIG. 2. Schematic energy band diagrams showing the use of a p’-n junction to study capture and emission processes at a deep level. The junction is shown at steady state with a reverse bias of V volts (a) and with 0 volts (b). The width of the space-charge region under these conditions is W( V ) and �(0). Immediately after the reverse bias is switched from 0 to V volts a nonequilibrium condition exists in which electrons occupying traps within the space-charge region are emitted to the conduction band and swept out (c). The shallow donor and acceptor that must be present have been omitted for clarity.
zero, which results in
n,lN, = ef,/(eL + ef,) (14)
in the space-charge region between x = 0 and x = W(V). Assuming that E , - ET is appreciably less than ET - E,, then, because el and ek are ther- mally activated [Eq. (9)J e(, is negligible compared with e:, giving nT << N , and thus empty traps at steady state. If the bias is now switched to zero (Fig. 2b), then in the region between W(0) and W ( V ) the electron concentration will be restored to the bulk equilibrium value n and traps will become oc- cupied by electrons provided
(15)
(pc, remains negligible because p z 0). This condition is achieved by choosing a sufficiently low temperature. Upon restoration of the reverse bias
nc, >> e: + ef,

12 G. F. NEUMARK AND K. KOSAI
at t = 0 (Fig. 2c), the time-dependent density of trapped electrons is given by
nT(t) w nT(0)exp( -e‘,t), (16)
where Eq. (8) has been used to calculate the time constant under the assump tion that e: dominates all other terms. For t > 0 and with inclusion of the trapped charge, it can be derived from Eq. (12) that constant reverse bias, i.e., constant (Vbi + V), requires
(ND + NT - nT(t))W2(t) = const = (ND + N T ) W z ( V ) ,
which causes the transient space-charge width W(t) to be greater than the steady state value W( V) (Fig. 2c). As trapped electrons are thermally emitted to the conduction band, they are rapidly swept out of the space-charge region by the electric field and therefore not retrapped. In addition, the transient space-charge width relaxes back to the steady state value.
Determination of e: and nT(t) can be performed by measuring the reverse current through the diode, or the change in space-charge capacitance. For t > 0 the total current at the plane x = W can be calculated (Sah et al., 1970) as the sum of the conduction current caused by the emission of electrons from traps
W ic(t) = - qA Jb dflT/dt d x (17a)
and the displacement current. The latter is due to the movement of con- duction-band electrons toward x = 0 at the edge of the depletion region as W ( t ) decays to W ( V ) , and is given by
W id@) = qAlo (dnT/dt) (x/W) dx.
Summing (17a) and (17b), the total junction current is
i(t) = qAWe’,ndt)/2. (18)
The time dependence of nT is given by Eq. (16), but the behavior of i(t) is not exponential except for n T ( t ) << ND because W is also time dependent through its dependence on nT. This can be seen by using Eq. (12) and ND + NT - ndt) in place of ND + NT for the positive space-charge in the depletion region, which yields
(19)
Defining C(co) as the steady state capacitance given in Eq. (13) and in- serting Eq. (19) into (13), the time-dependent capacitance change is calculated to be
w(t) = [2&(I/bi + V ) / q ( N , + NT - fldt))]”’.
AC(t) = C(t) - C(W)
= A[q&/2(Vbi + V)] l ’Z[(ND + NT - n~( t ) ) ’” - ( N , + NT)”’]. (20)

1. DEEP LEVELS IN WIDE BAND-GAP 1II-V 13
For N , , nT(t) << N D , this reduces to
AC(t)/C(a) Z -fl~(t)/ZN,. (21) Thus measurement of the time constant of either the current or capacitance transient gives e: if N T << ND. Note from Eqs. (18) and (21) that for a cur- rent transient i ( t ) is proportional to e:%&), whereas the capacitance signal is linear in n&). This means that if ei is large (i.e., the time constant of the transient is short), the current measurement is more sensitive. On the other hand, the capacitance transient is independent of e: and therefore more sensitive for slower transients.
As can be seen from Eqs. (18) and (21), the initial amplitude of the current or capacitance transient is proportional to nT(0). Therefore, if the bias has been kept at zero for a time sufficiently long to fill all traps with electrons, then nT(0) = NT and the trap concentration can be determined from the initial amplitude of the transient. The thermal capture rate is measured by restoring the reverse bias before the traps are completely filled by electrons. Adjusting conditions (low temperature) such that inequality (1 5) holds, then for a width tf of the filling pulse, the initial amplitude of the trap-emptying transient is gwen by
nT(d = NT[1 - ex~f-ncntf)], (22) and the slope of In", - nT(tf)] gives c, (n can be separately determined by, for example, a C-V measurement). Similar experiments can be performed by forward biasing the p + - n junction in order to inject holes into the n region. In this situation the injected holes can be trapped by levels that are occupied by electrons. The preceding analysis is still valid, except that the time constant gives the emission rate of holes to the valence band, and the initial amplitude the number of trapped holes. One difference from the elec- tron case is that the trapping of holes results in an increase of the positive space charge, giving
i ( t ) = q A We>pT(t)/2, (23)
Ac(t)/c(a) pT(t)/2ND. (24) Note that the sign of the current transient is unchanged, whereas the capaci- tance transient is now positive instead of negative. Therefore, if a minority- carrier injecting, forward-bias pulse is applied to a junction, majority-carrier traps can be distinguished from minority-carrier traps by the sign of their capacitance transients. This is not possible, however, for current transients or for metal-semiconductor junctions where a forward bias cannot inject minority carriers. It is important to note that because both mobile carriers are present during an injection pulse (one that injects minority carriers), recombination can occur through traps. Thus, depending on the relative magnitudes of nc,, pc,, e l , and e>, it may be impossible to fill a trap

14 G. F. NEUMARK AND K. KOSAI
completely or even partially so that an experiment could underestimate the trap concentration or not detect it at all. Also, because of problems in deter- mining the injected minority-carrier concentration, it is difficult to measure minority-carrier capture rates by varying the pulse width [Eq. (22)].
By using photons to ionize traps and cooling the sample to inhibit thermal emission processes, it is possible to measure optical emission rates with tech- niques similar to those previously discussed. For example, the junction bias can be reduced to zero to fill traps; then, after restoring the bias, illumination with photons of energy E, - E , 5 hv < E , - E , will give a transient whose time constant is l/e:(hv).
In the previous analysis it was assumed that deep states throughout the space-charge region, x = 0 to x = W, trap and emit carriers. However, as demonstrated by Braun and Grimmeiss (1973a), there are regions at the edges of the space-charge layer where a trap does not contribute to a current or capacitance transient. Consider again the case of a p + - n junction with a deep trap in the upper half of the band gap (Fig. 3). The space-charge region is between x = 0 and x = W, but only the area between x1 and x2 gives rise to a trap-emptying transient. This is because p and n are not truly zero in these regions, but exponentially decreasing from the bulk value. As can be seen in Fig. 3, between x2 and W the deep level lies below the electron quasi- Fermi level and therefore is always filled with electrons. Between x = 0 and x l r pck is sufficiently large that electrons cannot be trapped. The positions x1 and x2 are given by (Braun and Grimmeiss, 1973a)
p(x,)c', = ek + e', + e: + e; = n(x2)c',.
x = o I
FIG. 3. Schematic energy level diagram of a p+-n junction showing the edges of the space- charge region, x = 0 to x, and x = x2 to W, within which a deep trap does not trap and emit carriers. E,, and E,, are the quasi-Fermi levels for holes and electrons.

1. DEEP LEVELS IN WIDE BAND-GAP 1II-V 15
For the case where e; >> ei + e i + e; and ck/c‘, = 1, these conditions reduce to p ( x l ) = n(xr) = nl/g where n , = N,exp[-(E, - E,) /kT] and Eqs. (9) and (10) have been used to relate ek to ck. If N, = N , and g = 1 , then x , and x 2 are the positions where the quasi-Fermi levels for holes and elec- trons are E , - ET from the valence and conduction bands, respectively (Fig. 3). Thus, for deep levels it is possible that the region x2 - x1 in which they are effective as traps is substantially less than the total depletion layer thick- ness W. For the case of a current transient the effect of the edge region is to change the expression given by Eq. (18) to (Grimmeiss, 1977)
i(t) = qA(.x, - xl)f?:nT(t)/D, (25) where D can assume any value between 1 and 2 and is given by (Lang, 1979)
x2
X I 1/D = j ( 1 - x / W ) d x / ( x , - X I ) = 1 - (XI + X2)/2W.
For a p + - n junction where the edge region is negligible, x 1 = 0 and x2 = W so that D = 2 and Eq. (25) reduces to Eq. (18). Analogous corrections must also be considered for capacitance transients; results for the Schottky diode case have, for instance, been given by Noras and Szawelska (1982).
2. EXPERIMENTAL TECHNIQUES Because of the previously mentioned reviews (Sah et al., 1970; Milnes,
1973; Grimmeiss, 1974, 1977, 1980 Sah, 1976; Miller et al., 1977; Lang, 1979; Martin, 1980), this section will be brief and mainly discuss techniques not previously reviewed. However, in view of the widespread use of deep level transient spectroscopy (DLTS) and the number of variations it has inspired, it is appropriate to describe briefly the technique. The reader is referred to the original article by Lang (1974b) and the review papers by Miller et al. (1977) and Lang (1979) for details.
The sample, a reverse-biased p - n or metal-semiconductor junction, is placed in a capacitance bridge and the quiescent capacitance signal nulled out. The diode is then repetitively pulsed, either to lower reverse bias or into forward bias, and the transient due to the emission of trapped carriers is analyzed. As discussed in the preceding section, for a single deep state with N T << N , the transient is exponential with an initial amplitude that gives the trap concentration, and a time constant, its emission rate. The capacitance signal is processed by a “rate window” whose output peaks when the time constant of the input transient matches a preset value. The temperature of the sample is then scanned (usually from -77 to -450°K) and the output of the rate window plotted as a function of the temperature. This produces a “trap spectrum” that peaks when the emission rate of carriers equals the value determined by the window and is zero otherwise. If there are several traps present, the transient will be a sum of exponentials, each having a time

16 G. F. NEUMARK AND K. KOSAl
constant equal to the value set by the rate window at some characteristic temperature. The rate window separates the exponentials so that scanning the temperature produces a series of peaks, one for each trap contributing to the transient, whose amplitudes are proportional to the corresponding trap concentrations. This is the basic DLTS mode and, because of the spectrumlike data that it produces, it is useful as a survey technique. DLTS is also capable of measuring the activation energy of traps, their capture coefficients, and their spatial distribution in the direction perpendicular to the junction. If the sample is a p + - n junction and the amplitude of the pulse is sufficient to cause hole injection, negative DLTS peaks are due to electron emission and positive peaks to hole emission. Finally, because the capaci- tance transients are repetitively generated, the rate window function can be simultaneously performed with signal averaging, making DLTS very sensi- tive. The window function was originally performed with a dual-channel boxcar integrator, but a lock-in amplifier or exponential correlator (Miller et al., 1975) is also used. The rate window concept of DLTS has also been applied to current transients (Wessels, 1976; Hurtes et al., 1978; Fairman et al., 1979; Borsuk and Swanson, 1980).
Miller et al. (1975) generalized the rate window concept by showing that it is equivalent to correlation of the unknown transient with a weighting function. Thus the boxcar weighting function is a pair of positive and nega- tive rectangular pulses of unit amplitude. In the limit of very wide boxcar gates, this function becomes a square wave, which is the correlation function for a lock-in amplifier. Miller et al. (1975) calculate that an exponential weighting function gives the best signal-to-noise ratio, which is a factor of 2 greater than for the lock-in. Other weighting functions have been examined by Hodgart (1978, 1979) and by Crowell and Alipanahi (1981).
Lang (1974a) also developed a fast transient-response capacitance bridge for use in the DLTS apparatus, but for many routine applications a com- mercial capacitance meter is employed (Miller et al., 1977). Guldberg (1977) and Jansson et al. (1981) describe circuits that perform the dual sampling that is usually done by a two-channel boxcar integrator (Lang 1974b). The effects of the capacitance meter time constant on the measured trap emission rates are also discussed. Miller and Patterson (1977) give a circuit, to be used with a lock-in amplifier implementation, for synchronization and processing of the capacitance signal to remove the large transient caused by pulsing the sample bias. Day et al. (1979a) describe the effects of the boxcar gate widths being large compared to the delay times, as well as the effects of lock-in amplifier phasing and gate-off period, on the measured emission rate and activation energy. They also discuss the relative merits of the two methods of performing the emission rate analysis. In another paper Day et al. (1979b) show how Lang’s original capacitance bridge can be modified by inclusion of a dummy diode to keep the bridge balanced as the DLTS spectrum of a
1. DEEP LEVELS IN WIDE BAND-GAP II1-V 17
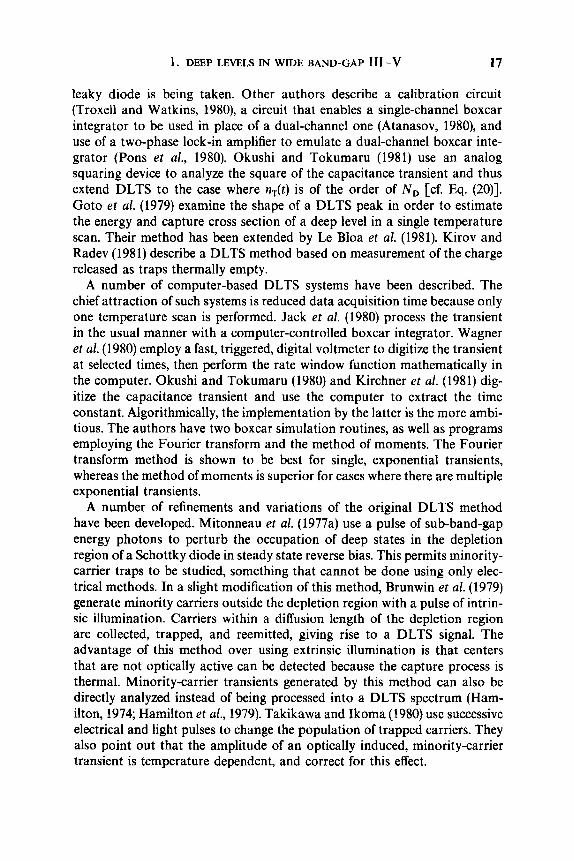
leaky diode is being taken. Other authors describe a calibration circuit (Troxell and Watkins, 1980), a circuit that enables a single-channel boxcar integrator to be used in place of a dual-channel one (Atanasov, 1980), and use of a two-phase lock-in amplifier to emulate a dual-channel boxcar inte- grator (Pons et al., 1980). Okushi and Tokumaru (1981) use an analog squaring device to analyze the square of the capacitance transient and thus extend DLTS to the case where nT(t) is of the order of N , [cf. Eq. (20)]. Goto et a!. (1979) examine the shape of a DLTS peak in order to estimate the energy and capture cross section of a deep level in a single temperature scan. Their method has been extended by Le Bloa et al. (1981). Kirov and Radev (1981) describe a DLTS method based on measurement of the charge released as traps thermally empty.
A number of computer-based DLTS systems have been described. The chief attraction of such systems is reduced data acquisition time because only one temperature scan is performed. Jack et al. (1980) process the transient in the usual manner with a computer-controlled boxcar integrator. Wagner et al. (1980) employ a fast, triggered, digital voltmeter to digitize the transient at selected times, then perform the rate window function mathematically in the computer. Okushi and Tokumaru (1980) and Kirchner et al. (1981) dig- itize the capacitance transient and use the computer to extract the time constant. Algorithmically, the implementation by the latter is the more ambi- tious. The authors have two boxcar simulation routines, as well as programs employing the Fourier transform and the method of moments. The Fourier transform method is shown to be best for single, exponential transients, whereas the method of moments is superior for cases where there are multiple exponential transients.
A number of refinements and variations of the original DLTS method have been developed. Mitonneau et al. (1977a) use a pulse of sub-band-gap energy photons to perturb the occupation of deep states in the depletion region of a Schottky diode in steady state reverse bias. This permits minority- carrier traps to be studied, something that cannot be done using only elec- trical methods. In a slight modification of this method, Brunwin et al. (1979) generate minority carriers outside the depletion region with a pulse of intrin- sic illumination. Carriers within a diffusion length of the depletion region are collected, trapped, and reemitted, giving rise to a DLTS signal. The advantage of this method over using extrinsic illumination is that centers that are not optically active can be detected because the capture process is thermal. Minority-carrier transients generated by this method can also be directly analyzed instead of being processed into a DLTS spectrum (Ham- ilton, 1974; Hamilton et al., 1979). Takikawa and Ikoma (1980) use successive electrical and light pulses to change the population of trapped carriers. They also point out that the amplitude of an optically induced, minority-carrier transient is temperature dependent, and correct for this effect.

18 G. F. NEUMARK AND K. KOSAI
Lefevre and Schulz (1977) developed a technique in which two reduced bias pulses, the second of slightly smaller amplitude, are alternately applied to the sample. The transients due to the two pulses are separately processed in the usual DLTS fashion, thcn these two signals are subtracted. This defines a spatial window in the depletion region of the sample that can be moved by varying the quiescent sample bias in order to obtain a high resolution spatial profile of the deep level concentration. This method has also been used to measure the effects of electric field on the emission rate of a charged carrier (Makram-Ebeid, 1980). Johnson et al. (1979) describe an apparatus where the technique of Lefevre and Schulz is combined with feedback that maintains the sample capacitance constant by varying the applied bias. Pro- cessing the transients in the bias permits trap concentrations to be measured accurately even at high densities.
Petroff and Lang (1977) combined DLTS with scanning electron micro- scopy in a method that allows spatial imaging of deep states in the plane of a junction. The scanned electron beam is pulsed on and off and the resulting thermally stimulated current or capacitance transient is analyzed using the usual DLTS methods.
Several methods not based on DLTS have also been described. White et al. (1976) present a two-light source, scanned photocapacitance technique that yields a spectrum of the deep states in the depletion region of a junction. The method is fast and sensitive, but most useful as a survey technique be- cause knowledge of the dependence of the photoionization cross section on photon energy is required to obtain accurate trap depths.
Chantre et al. (1981) have automated and extended the transient photo- capacitance methods described by Grimmeiss (1977). Initial trap populations are established by electrically pulsing the diode bias, by choice of sample temperature or illumination, and the time constant of the photocapacitance transient is determined by measuring its derivative at t = 0. Grimmeiss and Kullendorf (1980) extended the dual-light source, steady photocapacitance technique (Grimmeiss, 1977) to the case of large trap densities by use of feed- back to maintain the sample capacitance constant. The high trap density gives increased signal and the use of two light sources decreases the measure- ment time.
Majerfeld and Bhattacharya (1978) and Zylbersztejn (1978) both describe methods that derive the energy of a trap relative to the bulk equilibrium Fermi level by measuring the amount of band bending between the edge of the depletion region and the position where the quasi-Fermi level crosses the energy level of the trap. Majerfeld and Bhattacharya obtain this value from the difference between C - V measurements with the trap empty and filled. However, Grimmeiss et al. (1980) have shown that the filling of traps in the edge of the depletion region can be extremely slow and can cause a

1. DEEP LEVELS IN WIDE BAND-GAP 1II-V 19
serious misinterpretation of the results. Zylbersztejn ( 1978) estimates the band bending from the time dependence of the trap-refilling process at vari- ous reverse biases. The trap refilling is expected to be a single exponential below a certain voltage, V,,,, and two above, and the band bending can be calculated from V,,,. The effects of the transition zone at the edge of the depletion region have also been analyzed by Pons (1980), Vincent (1980), Noras (1981a,c) and Noras and Szawelska (1982) for capacitance transients, and by Borsuk and Swanson (1981) for current transients.
A disadvantage of methods that utilize a junction to analyze deep states is the effect of the electric field. Extrinsic photoconductivity can be performed at low fields and high sensitivity, but because capture processes are no longer negligible, the spectral dependence of the photoionization cross section can- not be determined except in special circumstances. Grimmeiss and Ledebo (1975a) have shown that if the light intensity is adjusted to maintain a constant photocurrent as the photon energy is varied, the photoionization cross section is proportional to the inverse of the photon flux. The method is also useful for materials, such as II-VI compounds, where fabrication of a p - n junction is not possible.
By optically creating carriers with a pulse of above band-gap illumination, then monitoring the subsequent current transient due to thermal detrapping, Hurtes et al. (1978) and Fairman et al. (1979) were able to apply the DLTS method to bulk, high-resistivity materials. This method, however, is unable to distinguish between electron and hole traps, and the calculation of trap densities is difficult.
3. IDENTIFICATION OF DEEP LEVELS
Although it is usually possible to show that an impurity introduced into a semiconductor gives rise to one or more deep levels, it is often difficult to identify the defect responsible for the observed states. For example, at least two donor and eight acceptor levels have been associated with the presence of Cu in GaAs (Milnes, 1973). A donor level at E , - 0.07 eV has been attri- buted to interstitial Cu, and states at E , + 0.15 and E , + 0.45 eV to Cu,, acting as a double acceptor. Other work, however, shows that the two ac- ceptor levels have different symmetries and, therefore, are not caused by the same center (Willmann et al., 1973). Another case is the dominant electron trap at E , - 0.75 eV in GaAs, which was assumed to be associated with 0, but the identification has been disproven (Huber et al., 1979). Still another example is provided by Cr-doped GaAs. For those interested in the dif- ficulties of clear-cut center identifications, a good summary of this case is given by several papers in “Semi-Insulating III-V Materials” (Rees, 1980). As a final note we mention that even identification of the relevant impurity is sometimes difficult; thus Kumar and Ledebo (198 1) argue that Cu is in fact


![INTERMEDIATE - preview.kingborn.netpreview.kingborn.net/920000/4344e7e68c624fa98fe9d9d76dffe1c1.pdf · FASB CODIFICATION FASB Codification References [1] FASB ASC 350-10-05. [Predecessor](https://static.fdocuments.in/doc/165x107/5b892df67f8b9a770a8cf6c0/intermediate-fasb-codification-fasb-codification-references-1-fasb-asc-350-10-05.jpg)
