
Semi-Annual Status Report - NASA OF CONTENTS ABSTRACT I. INTRODUCTION II. METABOLIC EFFECTS OF...
66
Semi-Annual Status Report .dm NASA Grant. NCjR 06-002-075 Colorado State University 3orf Collins, Colorado https://ntrs.nasa.gov/search.jsp?R=19710018707 2018-07-07T08:19:43+00:00Z
-
Upload
nguyenkhanh -
Category
Documents
-
view
214 -
download
0
Transcript of Semi-Annual Status Report - NASA OF CONTENTS ABSTRACT I. INTRODUCTION II. METABOLIC EFFECTS OF...
Semi-Annual Status Report . d m
NASA Grant. NCjR 06-002-075
Colorado State University 3orf Collins, Colorado
https://ntrs.nasa.gov/search.jsp?R=19710018707 2018-07-07T08:19:43+00:00Z
TABLE OF CONTENTS
ABSTRACT
I . INTRODUCTION
II. METABOLIC EFFECTS OF DILUENT GASES
111. EFFECTS OF MARGINAL OXYGEN TOXICITY ON CARBOHYDRATE METABOLISM
IV . TRACE METAL ALTERATIONS INDUCED BY A 5 PSIA-1000/o OXYGEN ENVIRONMENT
V . APPENDICIES
1 1 A. Theoretical Considerations of the Effect of Inert Gases on Oxygen Transport . I t
B. "Aberrational Effects of Space Capsule Atmospheres on the Rat Brain Coenzyme A Content. "
VI. STATUS REPORT REFERENCES
ABSTRACT
A protocol is described for the determination of subtle effects
resulting from exposure to a marginally stressful environment. The pro-
tocol is based upon the bioenergetic state of the organism since life has as
i ts most fundamental characteristic the need for energy. If one can evalu-
ate the energetic state of an organism, one can clearly observe m y sigirai-
ficant change in that organism.
Utilizing this protocol the metabolic effects of replacing nitrogen
with argon, neon, or helium as the diluent gas were investigated. Corro-
borating the results of others, we have previously reported a change in
metabolic rate when nitrogen was replaced by other diluent gases. By
measuring metabolic parameters in ra ts exposed to thermally isoconduc-
tive environments, comparing the above listed rare gases with nitrogen
under normoxic conditions, we observed changes in metabolic rate which
were inversely proportional to (a) the square root of the molecular weight
of the diluent gas, (b) the solubility parameter of the diluent gas as defmed
by Hildebrand, and (c) the molar refraction of the diluent gas which is a
measure of clathrate-forming capability. These are the identical para-
meters which show a relationship to the narcotizing capacity of the same
gases under hyperbaric conditions. The relationships held for neon,
nitrogen, and argon. They did not hold well for helium; the reasons for
this are discussed.
We conclude that (1) diluent gases have both a direct metabolic
effect which relates to the chemical characteristic of the diluent gas mole-
cule and an indirect metabolic effect which relates to the thermal eonduc-
tivity of the diluent gas a s it cools the body surface of the animal, and (2)
the direct metabolic effect is significant.
The penultimate studies of the mechanism of marginal oxygen toxicity
associated with the 5 psia- 100% oxygen environment a re described, U s k g
actinomycin D and cycloheximide in separate experiments, it is elear that
the hyperoxic environment induces glucose-6-phosphate dehydrogenase,
The induction is probably the result of the inhibition of one of the enzymies
either in glycolysis or the tricarboxylic acid cycle between glycerabdehyde -
3-phosphate dehydrogenase and succinic dehydrogenase. Injection s f
succinate into the experimental animals partially reduced the induelion of
glucose-6-phosphate dehydrogenase . As a part of the mechanism of adaptation to this environment, the
animal increased i ts utilization of the 'pentose phosphate pathway for the
metabolism of carbohydrate. Whereas only one fifth of the carbohydrate

was metabolized via this pathway in the control animals, animals exposed
to the 5 psia-100% oxygen environment metabolized approxha te ly 4070 of
their carbohydrate via the pentose phosphate pathway. Since the hypei-oxic
animals remained in bioenergetic balance, it is clear that the pyaxldine
nucleotides reduced via this pathway can be utilized a s an energy source.
The hyperoxic environment caused the translocation of certain
trace elements. Metabolically vital organs including the heart , kidney,
lung, and liver tend to concentrate iron, copper, and zinc while the th jmus
and brain tend to lose these cations. Cation studies of the hemotalogac
system a r e consistent with previous reports describing the early demise
of older red blood cells. This work is from the thesis of David N. Lanuord
submitted for the degree of Master of Science to the Graduate School of the
University of Oklahoma.
The report also includes an abstract of a paper entitled "Aberra-
tional Effects of Space Capsule Atmospheres on the Rat Brain Coenzyme A
1 1 Content, by D. V . Lass i ter , J . P. Jordan, and R. L . Colemm,

I. INTRODUCTION
Protocol:
Through the experiments conducted under this program over the
past several years, a protocol has been developed for the evaluation of $he
environmental effects on biological systems. The basis of this protocoi is
bioenergetics and the fact that life has as its most fundamental character-
istic the need for energy. If one can evaluate the energetic state of an
organism, one can clearly observe any significant change in the l i vhg
state of that organism.
The protocol involves three levels of investigation:
a . The first level is the initial survey which allows the investigator to determine whether there a re any signifiemt changes in the bioenergetic state of the organism based upon the measurement of four different parameters. In an animal these would include:
(1 ) the measurement of oxygen consumption over an extended period of time (preferably 24 hours).
(2) the measurement of C02 production (preferably over a 24 hour period).
(3) observations on the general physiologic state of the animal including his eating habits.
(4) the injection of acetate-l-14c and the trapping of the subsequent catabolic product, l4cO2.

The plot of the natural logarithm of the amount of remaining in the acetate pool versus time will yield a first order reaction, the slope of which is proportioinal to the rate of metabolism of acetate. From these data, the slope (which is in terms of reciprocal time) will lead to the calculation of the half-life of the acetate pool. This determination appears to be independent of the size of xhe pool. The determination in this case measures the effect of the environment specifically on the very importmt metabolic process of catabolizing acetate to COZ. (If
l u ~ o s e - l - ~ ~ ~ were injected, i ts rate of conversion to g4C02 would be approximately proportional to the overall metabolic rate and would be a desirable additional measure- ment. )
Section 11 of this report exemplifies the first level type s f experiment by investigating the effects of various diluent gases on the bioenergetic state of the animal. Parentheti- cally, the technique should be usable with any l ivhg organ- ism. For a plant, different measurements of energetic status would have to be utilized such as the production of oxygen and the uptake of 14C02 and i ts subsequent incor- poration into key plant metabolites. The point to be emphasized is that the protocol involves the use of bio- energetic parameters a s the key measurements of the overall effect of an environmental s t ress on an orgmism, The technique indicated above would be just a s adequate for microorganisms as it is for animals.
b. The next level of investigation has a s i ts purpose the bracketing of the site of the physiological manifestation of an environmental insult. An example is the use of glucose- 1- 14C and glucose-6- 14c to determine the relative impor- tance of the pentose phosphate: pathway compared with glycolysis and its attendant TCA cycle (see Section TII), Another example is the study of alterations in trace mhera l metabolism in animals exposed to the 5 psia-10870 oxygen environments reported in Section IV of this report. Thus, we know at least the sequence of reactions involved in the organism's successful or attempted adaptation.

c. The final step in the protocol is to identify the specnfle enzyme or limited number of enzymatic reactions and associated hormonal or organ level responses immediatel~r involved in the organism's successful or attempted adapta- tion. The study on the effects of marginal oxygen toxicity on carbohydrate metabolism described in Section III of this report is an example of this final step in the protocol, Here, work on glucose-6-phosphate dehydrogenase, glycer- aldehyde-3-phosphate dehydrogenase and suecinic dehydro- genase represent attempts to pinpoint the metabolic site of action that initiates the adaptation process in rats exposed to the 5 psia- 100% oxygen environment.
Focus is placed on the initial evaluation step (step a ) . It must be simple
sensitive, quantifiable, and decisive. The one described fulfills all those
criteria.
Proeram and Personnel:
During the period covered by this report David N . Lankford corn.-
pleted the requirements for the Master of Science Degree at the University
of Oklahoma Medical Center using the equipment and based upon the data
obtained through this program. His master's thesis is too extensive to be
reprinted in full in this report; however, his basic experimental outline
was presented in the October, 1969, Status Report and Section IV of this
report contains both the summary and conclusions reached in that study.
The thesis is now being prepared for submission to the editors of Aeso-
sDace Medicine.

Robert R . Gorman has worked full time on his doctoral dissertation
which looks promising a s a study of the mechanism of adaptation observed
in carbohydrate metabolism in animals exposed to the 5 psia-POO%~ oxygen
environment, a marginally hyperoxic condition. A progress report on his
work i s presented in Section 111. He expects to complete the requirements
for the Ph.D. degree by August, 1970.
The study of the metabolic effects of gases has been the n9a.b thrust
of the laboratory during the period covered by this report. The basic
question being asked is whether the change in metabolic rate associated
with the changes in diluent gas is due solely to the thermal conductivity
factor associated with the specific diluent gas or i f it is in part due to a
direct metabolic effect. The gases tested include helium, neon, nitrogen,
and argon. Christopher Schatte, a Ph. D. candidate in Physiology, has
been working on the question of the influence of diluent gases om the oxygen
concentration of the blood. His work is summarized in Appendix: 6%
which deals with the metabolic effects of diluent gases.
The long term significance of this research lies in the use of
diluent gases to control metabolic rate. In prolonged space flights, for
example, it may be important to fly the astronaut in a slightly narcotized
state, but during critical maneuvers it is important that the astronaut be

able to function at his maximum effectiveness. Data obtained in expers-
rnents reported here indicate that both requirements can be satisfied by
carefully selecting the diluent gas to be used during various phases of the
flight.
Additionally, this report includes an abstract of a paper presented
1 I to the American Federation for Clinical Research entitled, Aberrational
Effects of Space Capsule Atmospheres on Rat Brain Coenzyme A Content,"
by D. V . Lass i ter , J. P. Jordan, and R. L . Coleman.
11. METABOLIC EFFECTS OF DILUENT GASES
For the last three years we have studied the physiological effects of
nitrogen and certain selected r a r e gases on ra t s . The importance of these
experiments, from a pragmatic point of view, is the determination of the
ideal diluent gas used in prolonged space flight. F rom a basic research
point of view it is important to understand the mechanism by which diluent
gases including nitrogen produce physiological effects.
Reports from the laboratory of Harold Weiss and his co-workers at
Ohio State University ( I ) , William Pepelko at the School of Aerospace
Medicine (2), a s well a s Leon and Cook (3) , suggest that metabolic effects
seen in the presence of diluent gases a r e due essentially to the differen,ces
in thermal conductivity between the diluent gas being studied and nitrogen,
However, most experiments involving diluent gases other than nitrogen,
have used helium because of i t s availability and relative inexpensiveness.
As shown by Brauer and others (4, 5) , helium is the one member of the
r a r e gas family that tends not to follow a predicted pattern seen En the other
members.
We have already reported some experiments in which we replaced
nitrogen with neon at one atmosphere and exposed r a t s to this test
environment for up to four weeks. Animals exposed to the neon-nsrmoxic
enviraonment showed an altered rate of gain in body weight, a dramatie
increase in food consumption, a 35% increase in C o 2 production, and a
2570 greater oxygen consumption with a resultant increase in heat produc-
tion. The respiratory quotient remained essentially unchanged. The
neon-normoxic animals experienced a hematocrit change paralleling high
altitude exposure. When these animals were injected with acetate- l -I4c,
they converted that substrate to 14c02 at a considerably faster rate than
their comparable air control animals. We concluded from these data that
the metabolic rate of animals exposed to a neon-normoxic environment at
one atmosphere was increased significantly.
We also reported the results of an experiment in which the r a t s
were exposed to a 5 psia neon-normoxic environment in which the thernnal
conductivity of the environment was only 437'0 of that associated with air at
one atmosphere. Even under these conditions the animals in the low pres-
sure neon-normoxic environment showed an increase in metabolic rate
suggesting that the metabolic rate effect is due not only to the thermal
conductivity factor but may also be attributed, at least in part, to a d i rec t
metabolic effect. The experiments described in this report a re a first
step in evaluating whether diluent gases have an effect other than that
precipitated by their thermal conductivity.

Some Theoretical Considerations :
Gases have both density and viscosity. Consequently, it is impor-
tant to consider whether the work of breathing is influenced by the different
densities and viscosities of the diluent gas-oxygen mixtures used in the
experiments described in this section. Appendix A contains a detailed
discussion of the question, but we concluded that the work of breathhg
the diluent gases studied will not significantly affect the measured meta-
bolic rate under the conditions of our experiment.
The second question is whether the diluent gases selectively influ-
ence oxygen transport to the cell. Both from our theoretical calculations
and our experimental studies on the dog, neon and argon act like nitrogen
and, thus, do not produce an altered effective p02 in the blood. Theoreti-
cally, helium does produce an effect which should reduce the effective pa2
below nitrogen at comparable pressures . The detailed calculations on this
question a r e also found in Appendix A.
We a r e currently doing experiments on the dog to study the extent
to which the theoretical effect produces an actual effect, especially in an
environment made up of 160 mm Hg of oxygen and l e s s than 100 mm Hg of
helium (our 5 psia helium-normoxic environment).
Experimental Design :
Ten male Holtzman rats were placed i n each of two chambers with
the average weight of 392 grams each. After they were acelhat ized -to
chamber living for two weeks, baseline data were collected for two weeks .
1 I These are referred to a s zero time" data. The gaseous environment was
made up of 8070 nitrogen and 20% oxygen in both chambers durhg a141 four
weeks. Subsequently, each chamber was adjusted to pressure and gas
mixture a s indicated in Figure 1. Note that the experiment is essentially
duplicated with only the sequence of environments changed to negate residual
effects of the preceding environment. The animals were exposed to each
test environment for a period of eight days, data being collected during the
first seven days. In between each test-gas environment, the animals were
brought back to an 80% nitrogen- 2070 oxygen environment at 760 mm Rg:iE
for a period of four days. After the animals had been exposed Lo al~l the
test environments they were re-exposed to the air environment at 760 ~ m m IHg
for a period of seven days.
Procedures:
Oxygen consumption and C 0 2 production were measured daily as
outlined in the April, 1967; October, 1967; and April, 1969 Status Reports,
xC Hereafter referred to as the "air environment. 1 1

Body weight measurements were made on a weekly basis and on ea& day
14 that a group of animals was injected with acetate-1- C. Food consump-
tion was measured on a weekly basis during the first month when the animals
I I were exposed to air ' ' at one atmosphere, during the first seven days of
exposure to each test gas environment, and during the first three days when
the animals returned to the air environment between exposures to the vari-
ous test gas mixtures. Food consumption was also measured over the last
seven days of the experiment when the animals were exposed to an air
environment at 760 mm Hg. Monitoring of the environmental conditions
was accomplished as outlined in the October, 1967, Status Report,
Within each group of ten animals, five of them were injecked each
time the protocol called for the injection of acetate-l-14c (see Figure 2).
This was done because it had been observed in earlier experiments that
animals injected on a daily basis became hypersensitive to the iinljection
process and data from them were no longer reproducible, Consequentl!y,
in each chamber five of the animals were designated as the "green groups'
and five a s the "black group" for purposes of injection. Each group was
14 injected with acetate-1- C every fourth day throughout the series of the
experiments beginning with the acclimatization period. Each animal was
injected at the rate of 50 pc/kg of body weight.

DAYS
Figure 2, Detailed expesirraenatai, protoeoZ s f environment changes with bdica-led days of acetate- 1-I4c injection ( 1 4 ~ ) , days of body weight measurement (B. W. ), and days of food weight measurement (F , W, f . %Idditionally, O2 consumpti-im, C 0 2 produc"ciorr, w a k e consumption, and environmental pressure and temperature were measured daily.

During exposure to each of the test environments, groups of five
animals were injected on the f i rs t , third, fifth and seventh days. The
same protocol was followed during the final seven days of exposure to air
at one atmosphere which was accomplished at the end of the experimenii,,
During the interim periods of exposure to a i r at 760 mm Rg which occurred
between exposure to two successive environments, groups of five animals
were injected on the f i rs t and third day. The data presented in this report
constitute mean values for the replicate experiments. The tech ique fcsr
measurement of the expired 14C02 is outlined in the 31 October 1967 and
30 April 1969 Status Reports.
Results and Discussion:
With respect to each of the parameters used to measure metabolic
activity, the relationship among argon, nitrogen, and neon was both con-
sistent and predictable while that of helium was consistently lower than
would have been predicted. The data with respect to oxygen consumption
and CO production paralleled very nicely the 1 4 c 0 2 expiration data from 2
the injection of acetate-1 -l4c. Using the 1 4 c 0 2 data a s the example.
14 Figure 3 shows the plot of the C remaining in the acetate pool versus
time, a plot which was f i r s t presented in the April, 1969, Status Report as
a mechanism of determining the metabolic state of an animal wit81 respect

Q 10 20 30 40 50 60 70 84D
Minutes Post Injection
14 F*'igure 3 . Plot of Log (14c in'ected - CO expired) vs t imepas t uljec- 2 tion of a ~ e t a t e - l - ~ ~ c for four isothermal e G r o n m e n t s . Curves obtained f rom normalized means of each se r ies of injections.

to a specific metabolic pool. As was previously described, the slope elf
the curve is proportional to the rate at which that substrate is colnverted
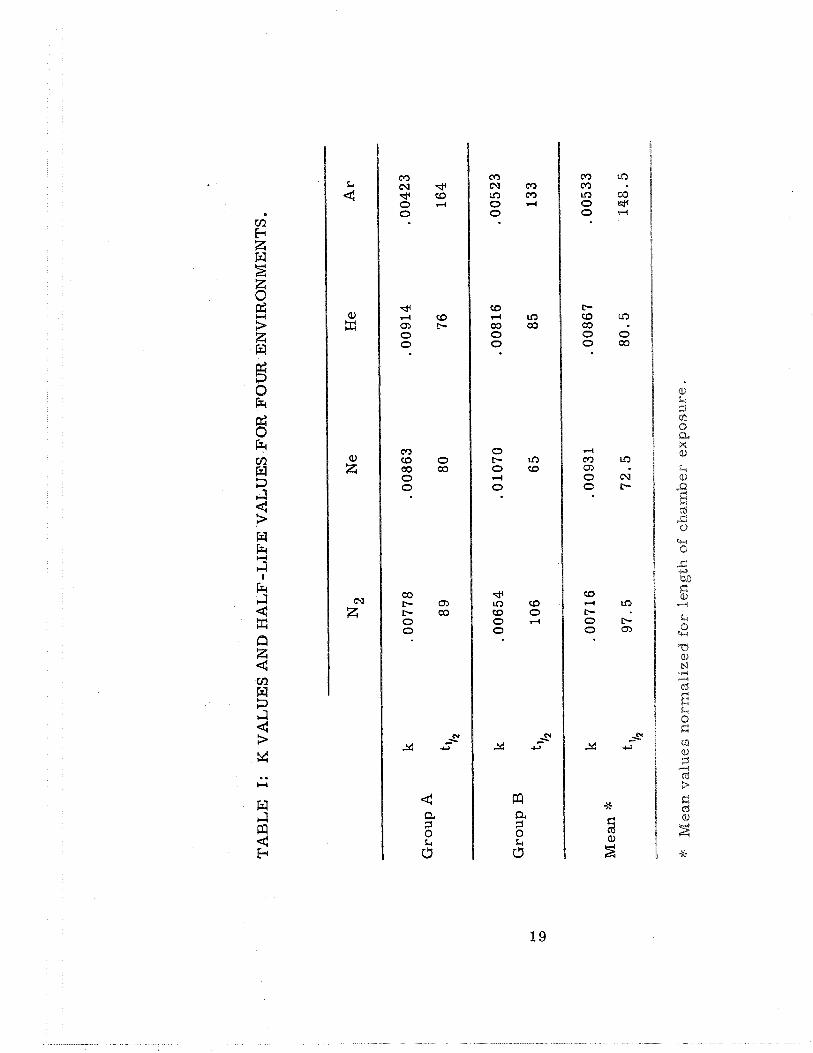
to 14c02 . Table I summarizes the k values for the slopes of each of
these curves and the half-life values in each instance.
Unequivocally, animals exposed to an argon environment cadabolize
acetate a t a slower ra te than their comparable a i r control animals (nitro-
gen a s diluent gas) while ra t s exposed to the neon-normoxic environment
catabolize acetate to I 4 c o 2 at a significantly faster ra te . Heliuim did not
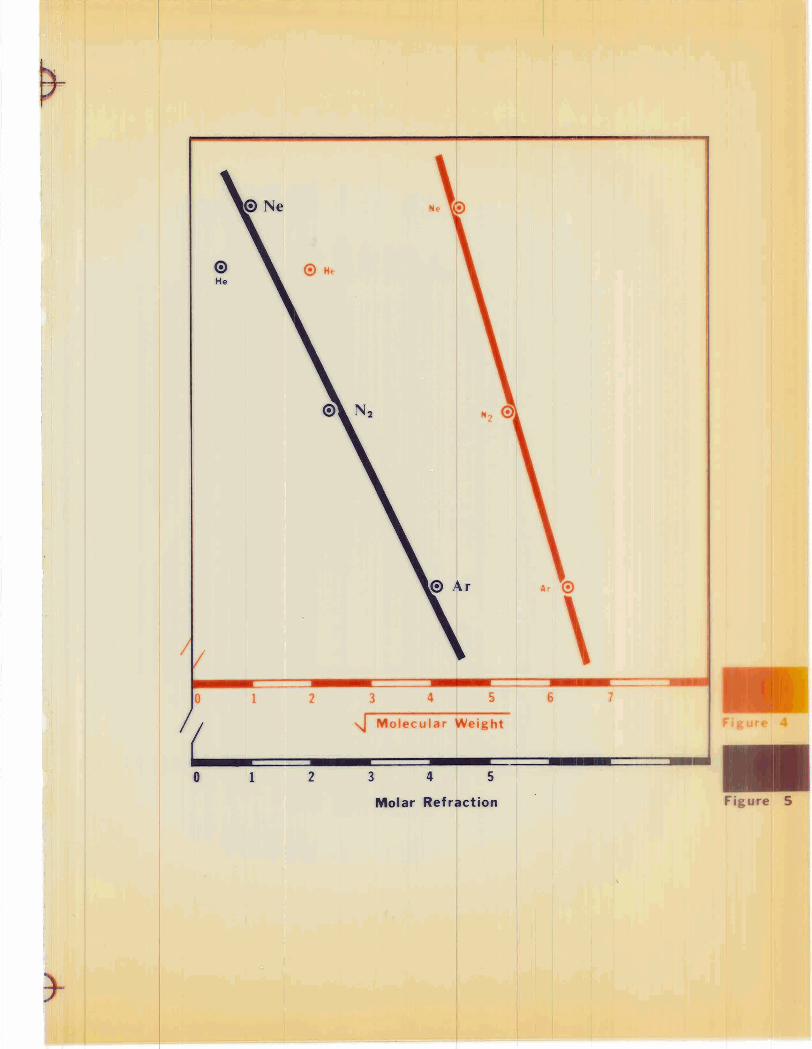
accelerate metabolic ra te a s much a s would be predicted. If one plots the
slope of these curves (the 1 4 c 0 2 rate constants) versus the square root of
the molecular weight of the diluent gas, a straight line relationship is
observed for argon, neon, and nitrogen (see Figure 4). H e l i m does not
fall on the curve.
These data clearly show that the theoretical considerations pre-
sented ear l ier in this section regarding the effects of diluent gas on oxygen
transport a r e qualitatively correct; that is to say, argon and neon had
little effect on oxygen transport when compared to nitrogen, while helium
caused a reduction in the transport of oxygen. Perhaps helium produced a
histotoxic hypoxia at the tissue level which was reflected in a decreased
metabolic rate over what one would have predicted for helium. In Figures
5 and 6 , plots of the I 4 c o 2 ra te constants versus molar refraction and the

9.0
8.0
7.0
C) 0 d
x 24
6.0
5.0
O H e
0- - - 0
0 1 2 3 4 5 6 7 8
"Solubility Parameterw - 6,
1 1 rate constants versus solubility parameter" give similarly good plots ,
All three of these plots a r e reminiscent of plots concerning narcotizhg
capacity versus the square root of the molecular weight of the diluent gases
(6 ) , narcotizing capacity versus lipid solubility (71, and narcotizhg c a p -
city versus molar refraction (8) which relates to the ability to form clath-
rates. With respect to the other three gases, it is impressive that their
effects in a thermally isoconductive environment a r e so predictable. The
data present strong evidence that there is indeed a direct metabolic effect
associated with the diluent gas.
Hildebrand (9) defines "solubility parameter" a s the square root of
the cohesive energy density. This is a measure of the attractive energy per
unit volume in the liquid and is a measure of the net attractive energy at
the minimum of the potential energy curve. It is a measure, also, of $.he
solubility of a gas in various liquids. The difference in solubility para-
meters of the gas and the liquid determines the gas solubility; the smaller
the difference, the greater the solubility. The solubility parameters of
the gases ( & T ) investigated lie in the lipid range; they a r e considerably
lower than the parameter for water. Plots of total C 0 2 production and
oxygen consumption against solubility parameter (Figure 7) yield similar
14 slopes and confirm the C 0 2 data. It is tempting, therefore, to grossly

""Slubility Parameter" - 6T
I'igur.a 7 . Oxygen consumption and C 0 2 production in ~ / k g / d a ~ plotted against "solubility parameter" - 6T of Hildebrand.

describe the effect of the diluent gas upon an interaction between the gas
molecules and lipids, perhaps in the membranes.
No correlation was observed with molecular size a s calculated
1 1 1 1 from (A) Van Der Waal's b and (B) gas viscosity data. No correlation
was observed with molecular polarizability . This latter function is a
measure of the ease of distortion of electrons to form an induced dipole
and is a measure of the attractive potential energy between molecules at
intermolecular distances considerably greater than the minimum in the
potential energy expression.
Data with respect to water consumption, food consumption, and
body weight gain a re consistent with the active parameters of metabolism,
namely, oxygen consumption, C02 production, and the rate of conversion
of acetate-l-14c to 14c02 .
We conclude that (a) diluent gases have both a direct metabolic
effect which relates to the chemical characteristics of the diluent gas
molecule and a n indirect metabolic effect which relates to thermal conduc-
tivity of the diluent gas a s it cools the body surface and (b) the direct meta-
bolic effect is significant. Using data from our October, 1969, Status
Report, the direct metabolic effect accounts for approximately one-third
of the increase in metabolic rate for a neon-normoxic environment at one
atmosphere.
In the next experiment it is obvious that we must correct for the
effect of the diluent gas on oxygen transport, at least to obtain comparab%e
data for helium. Under those conditions, the partial pressure of oxygen
will be in the vicinity of 1'76 mm Hg. Although corrections for argon aad
neon will also be made, it is obvious that in reality these gases have little
effect on oxygen transport.

111. EFFECTS OF MARGINAL OXYGEN TOXICITY ON CARBOHYDRATE METABOLISM
In the October, 1969, Status Report an induction of glucose-6-
phosphate dehydrogenase in ra t s exposed to a 5 psia-10070 oxygen environ-
ment was reported. Additionally, i t was reported that neither the specific
activity of glyceraldehyde-3-phosphate dehydrogenase o r isocitrate dehy-
drogenase were significantly affected by this environment. Pr ior to the
above report , we had been particularly interested in these enzymes for
two reasons: (1) a s indicators of pathway activities where glyceraldehyde-
3 -phosphate de hydrogenase represented glycolytic activity and isocitrate
dehydrogenase TCA activity; (2) additionally, glyceraldehyde-3-phosphate
dehydrogenase is a sulfhydryl enzyme and may be prone to oxidation and
subsequent inactivation. If glyceraldehyde- 3 -phosphate dehydrogenase was
shown to be inhibited by the 10070 oxygen environment, this could have been
an explanation for the shift in carbohydrate metabolism toward the pentose
phosphate pathway. Since inactivation of these enzymes proved not to be
the cause of the increase in shunt activity, we have shifted our at1;ention to
enzymes of the TCA cycle.
We do not feel glucose-6-phosphate dehydrogenase is directly
affected by oxygen. The induction of glucose- 6-phosphate dehydrogenase
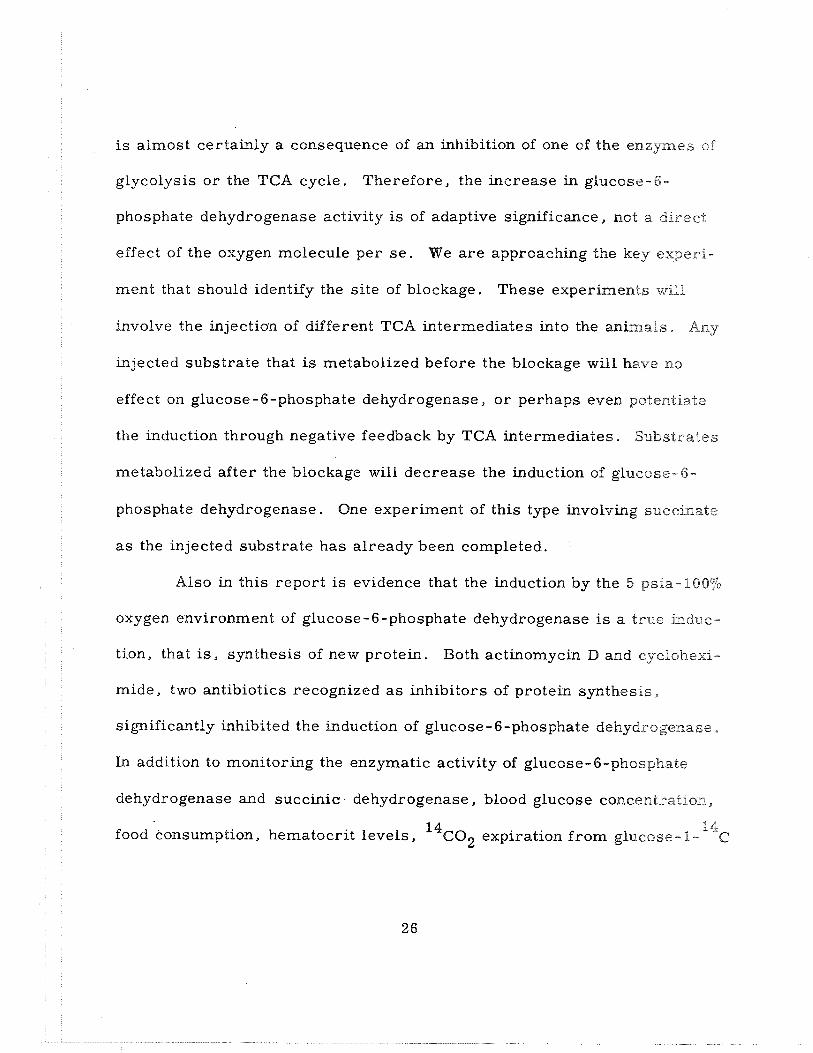
is almost certainly a consequence of an inhibition of one of the enzymes of
glycolysis or the TCA cycle. Therefore, the increase in glucose-6-
phosphate dehydrogenase activity is of adaptive significance, not a drreet
effect of the oxygen molecule per s e . We a r e approaching the key experi-
ment that should identify the site of blockage. These experiments will
involve the injection of different TCA intermediates into the animals. Any
injected substrate that is metabolized before the blockage will have no
effect on glucose-6-phosphate dehydrogenase, o r perhaps even potentiate
the induction through negative feedback by TCA intermediates. Substrates
metabolized after the blockage will decrease the induction of glueose- 6 -
phosphate dehydrogenase. One experiment of this type involving sueebrate
a s the injected substrate has already been completed.
Also in this report is evidence that the induction by the 5 psia--10070
oxygen environment of glucose-6-phosphate dehydrogenase is a true indue-
tion, that is, synthesis of new protein. Both actinomycin D and eyelob~~xi-
mide, two antibiotics recognized a s inhibitors of protein synthesis,
significantly inhibited the induction of glucose-6-phosphate dehydrogenase.
In addition to monitoring the enzymatic activity of glucose-6-phosphate
dehydrogenase and succinic dehydrogenase , blood glucose concentration,
14 food ~ o n s u m ~ t i o n , hematocrit levels, 14C02 expiration from glucose - 1 - C

and g l u ~ o s e - 6 - ~ ~ ~ , O2 consumption and C 0 2 production, and incorporation
of glucose- 1 - 14c and glucose- 6-14c into glycerol were also measured in
these experiments.
Experimental:
Five experiments with the same basic experimental design have
been completed (see Figure 8); the only variations in the five experiments
were the nature of the substrate injected and the enzymes that were assayed,
In addition to glucose- 6-phosphate dehydrogenase activity, suceinic
dehydrogenase activity was also recorded in the g lucose- l -14~ , the glucose-
14 6 - C, and the succinate injection experiments. In the experimealts mirol-
ving actinomycin D and cycloheximide , glucose- 6-phosphate dehjrdroge~nase
was the only enzyme that was assayed.
In each experiment 10 male Holtzman ra t s (220-240 gm) were
allowed to acclimate to chamber living at 760 mm Rg for a period of two
weeks. At the end of the two-week period, 5 r a t s were selected at random
a s controls and the other 5 a s experimental animals. The control anin~als:
were maintained in a i r at sea level pressure and the experimentals in 3 0070
oxygen at 5 psia. The appropriate substrate o r antibiotic was then injected
into both the controls and experimentals. All of the animals were autopsied
after 2 days exposure. I

Succinic DH
Sml of e.4 lUIl
Figure 8. Protocol for five experiments at 5 psia-10070 oxygen showhg substrate injected, injection rates, days acclimatization, days exposure, and injection schedule.

At autopsy the animals were guillotined and the blood collected in
heparinized beakers. Samples of the blood were placed in hematocrit
tubes for centrifugation and subsequent analysis. A two- gram piece of
liver was homogenized in cold 0.14 M KC1 in a Potter-Elvehjem homogen-
i ze r . The homogenate was then centrifuged at 65,000 X g for a period of
30 minutes. The resultant supernatant was used for glucose-6-phosphate
dehydrogenase analysis according to the procedure of Szepesi and Freed-
land (10) using a Beckman DBG recording spectrophotometer a t 340 m-e;,,
An additional two-gram piece of liver was removed and homogenized
in 0.25 M sucrose and the mitochondria prepared according to Sche ide r
and Hogoboom (1 1 ). The succinic dehydrogenase assays were performed on
these mitochondria according to the procedure of Green, - et a l . (12 ) - The
remainder of the liver was weighed and frozen in liquid nitrogen and stored
for subsequent analysis.
Results :
The data obtained from the actinomycin and cyclohexirnide experi-
ments clearly show that the increase in glucose-6-phosphate dehydrogenase
activity is a true induction. Figure 9 shows that the induction which a s
usually seen at 24-48 hours is eliminated almost entirely by the admhistra-
tion of either antibiotic. It is apparent that new protein biosynthesis must
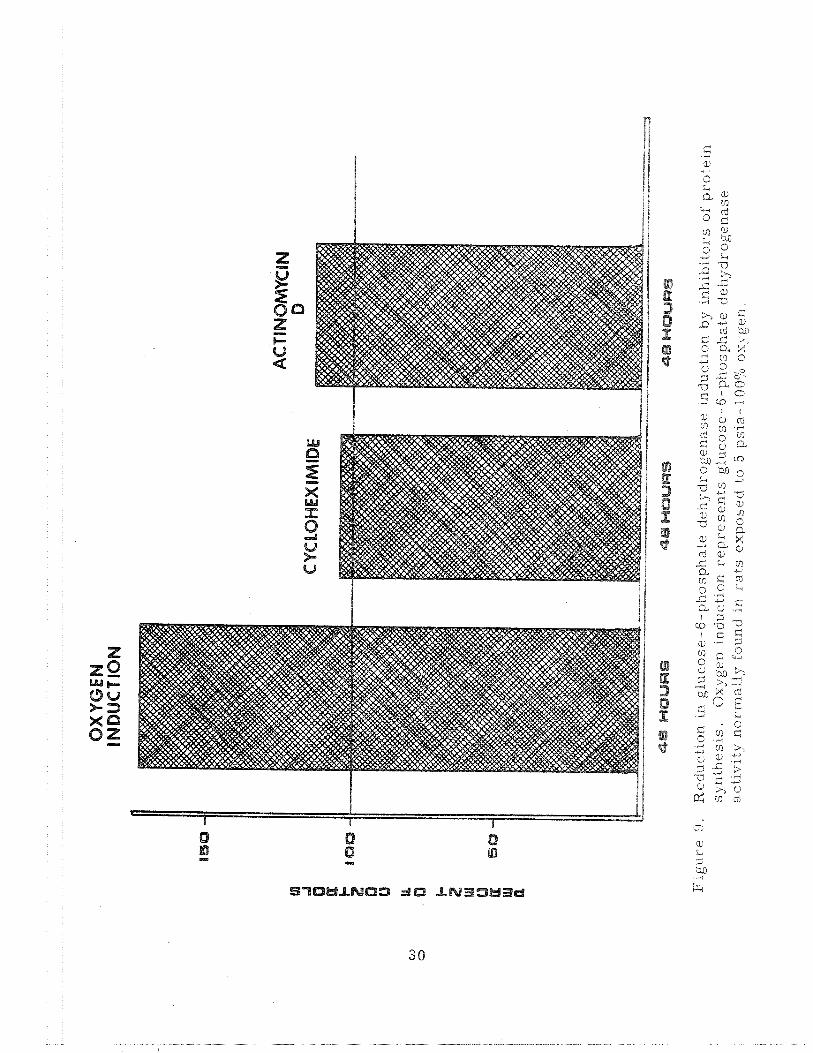

occur for the increase in shunt activity to appear. Therefore, new protein
biosynthesis is necessary for the adaptation itself.
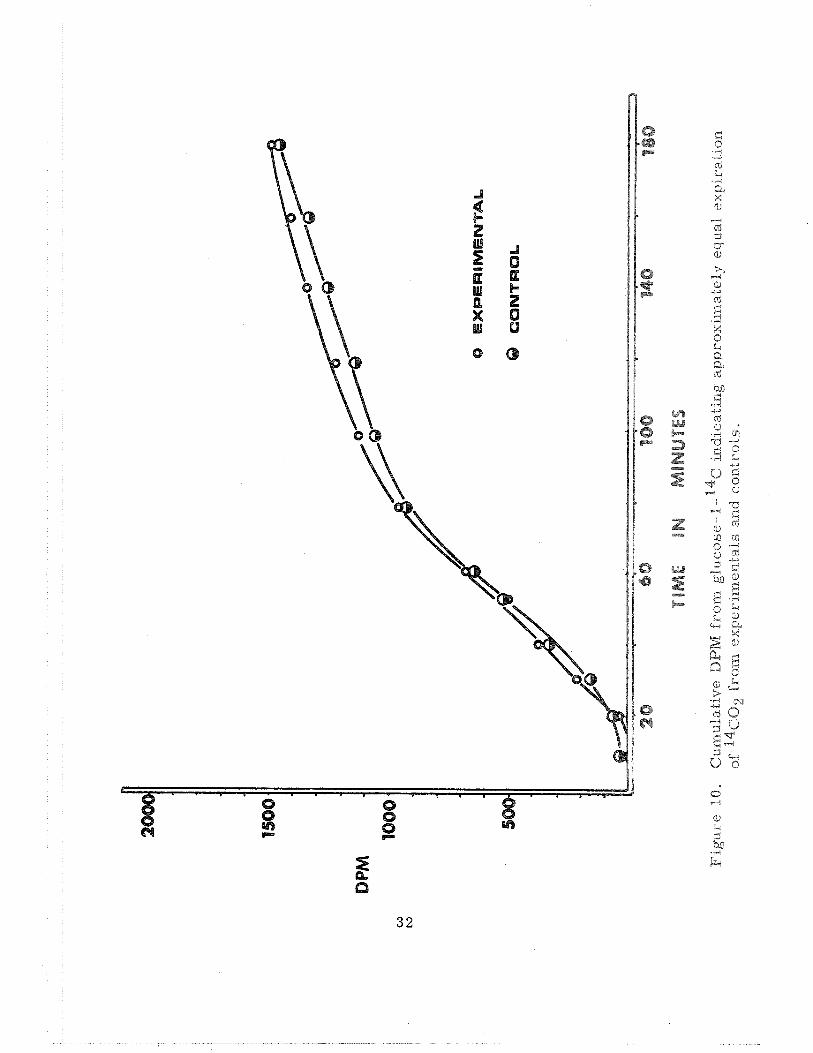
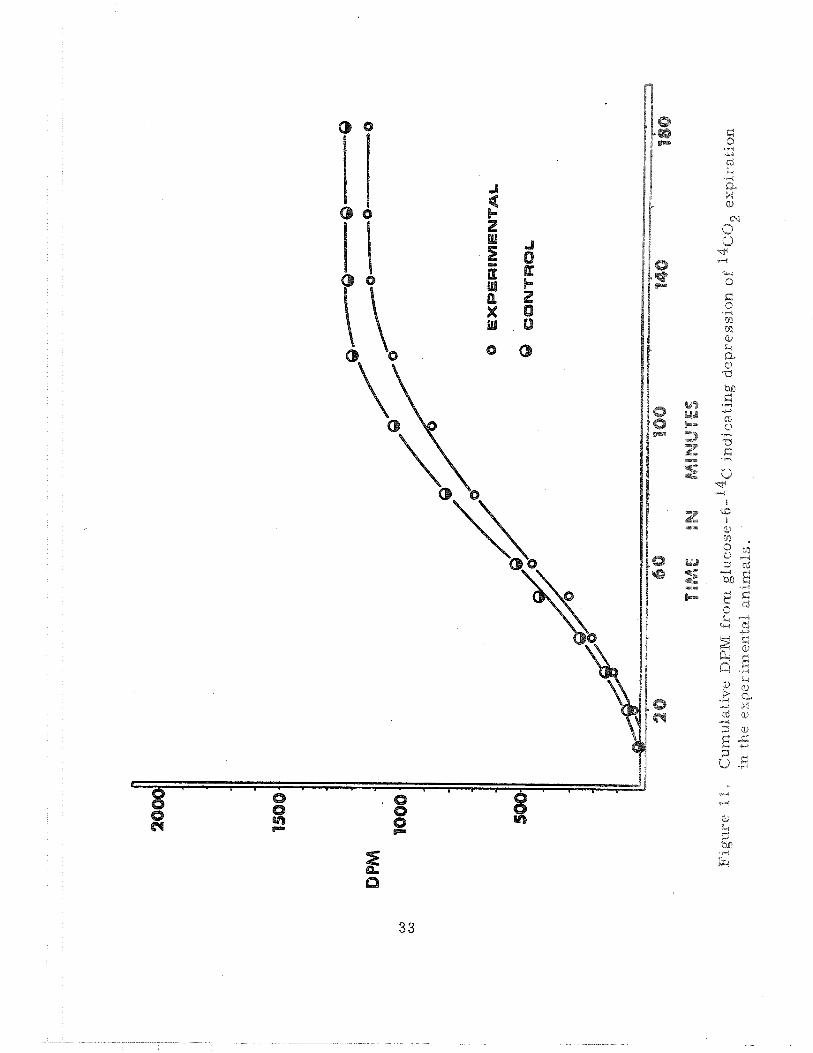
Two additional experiments involving glucose - 1- 1 4 c and glucose - 6-
14C! a s the injected substrates have been completed. From Figure 10 it
is evident that both groups of animals expired approximately the same
amount of 14c02 from glucose- 1- 14c . However, the 14c02 expiration from
glucose-6-14~ was quite depressed in the experimental animals when com-
pared to control animals (Figure 11 ). The interpretation is that more
carbohydrate was metabolized via the pentose phosphate pathway in the
experimental animals compared to the a i r controls. Additional data consis-
ting of '*c incorporate into glycerol has also been collected. U s h g the
14 incorporation of g lucose - l -14~ and glucose-6- C into glycerol, we are
able to determine the importance of the pentose phosphate pathway to
carbohydrate metabolism a s follows: Both in vivo and in vitro the activity
of liver triosephosphate isomerase is not adequate to equilibrate the triose-
phosphates. Indeed, Schambye, et a l . (13) have reported that liver glycogen
formed from 14c glycerol had more 14c in carbons 1 , 2 , and 3 than in
14 carbons 4, 5 , and 6; and the reverse was observed with pyruvate and C 0 2 -
Rose, et a l . (14) have shown that such is the result of a slow rate of isom- - erization via triosephosphate isomerase. Thus, it is apparent that

tiihytloxyacetone phosphate is a preferential precursor of glyceroi while
glyceraldehyde - 3 -phosphate is preferentially incorporated into fatty acids.
It should, therefore, be possible to adjust the amount of I4c0 2
14 expired a s a result of catabolism of glucose- 1- C or g l u ~ o s e - 6 - ' ~ ~ to
reflect the true picture i f one also has measured incorporation of these
particular substrates into glycerol, i. e . , one should be able to .normalize
14 the C02 output data. We have done this utilizing the ratio:
14c in glycerol from g lucose - l -14~ = 6
14C in glycerol from glucose-6-14~
a s suggested by Katz, et a l . (15). Our further calculations a r e made on. - the presumption that glucose- 1 -14C can be catabolized to via the
pentose phosphate pathway a s well a s the glycolytic pathway and its atten-
dant tricarboxylic acid cycle while labels from glucose-6-14~ show up in
1 4 c 0 2 only a s the result of metabolism via the glycolytic pathway + TCA
cycle. Therefore, the relative importance of the pentose cycle is:
14 14 where 14
" 2 ( ~ 1 ) and " 2 ( ~ 6 ) represent the total amount of CgS2 expired 14 over a three-hour period from injected glucose- l - C and g lucose-6-14~,
respectively. 34

Using this approach, the data (Table 11) clear ly show a marked
increase in the importance of the pentose phosphate pathway in rats ex.posed
to a 5 psia-10070 oxygen environment. The experimental animals are
metabolizing twice as much carbohydrate through the shunt, and 20'70 less
through glycolysis and the TCA cycle. This is strong support for our hypo-
thesis that a block in metabolism in the glycolytic o r TCA pathways is
responsible for the increased shunt activity that we see .
TABLE 11. CARBOHYDRATE METABOLIZED VIA. GLYCOLYSIS PLUS TCA CYCLES VS . PENTOSE PHOSPHATE PATHWAY.
As mentioned previously succinic dehydrogenase was monitored in
14 both the g lucose- l - C , the g l u c o s e - 6 - 1 4 ~ and the succinate injection
experiment. The re was s t rong evidence that succinic dehydrogenase n'?aight
be susceptible to changes iq oxygen part ia l p r e s s u r e s . Ramasasma , et al,
(16) reported an increase in succinic dehydrogenase activity in hypoxic

environments. Therefore, we decided there rnight be an hhibitisn of
succinic dehydrogenase in a hyperoxic environment. However, there were
no significant changes in succinic dehydrogenase activity in m y of these
experiments indicating that succinic dehydrogenase was not the site s f
blockage.
The fifth experiment involved the injection of 5 ml of 0 . 4 Id sucei-
nate. It has been demonstrated previously that succinate is an effective
prophylactic against oxygen toxicity and i t s injection might reduce the
s t r e s s we see (17). Figure 1 2 shows that succinate was successful in
reducing the induction of glucose-6-phosphate dehydrogenase in our animals,
However, the reduction is not a s pronounced a s the figure would ~ndicate .
The control animals' specific activity was 3 0% higher in this experiment
when compared to control values in previous experiments. Apparently,
this is the result of the succinate injection. Actually, when gluccrse-6-
phosphate dehydrogenase activity in the experimentals in this experi~ment
is compared to previous control levels, the induction is only slightly de-
pressed. This limited ability of succinate to reduce shunt activity indicates
that the block in metabolism which results in increased pentose shunt acti-
vity is probably before succinic dehydrogenase in the TCA cycle. ID. order
for a complete protection from oxygen toxicity to be achieved, suceinate


would probably have to be continually infused into the animals. Single
injections apparently help but do not entirely res tore normal metabokis~n
As a result of experiments now in progress, we should be able t:o
pinpoint the block in metabolism and elucidate the mechanism responsil~le
for the shift in metabolism from glycolysis and the TGA cycle towards
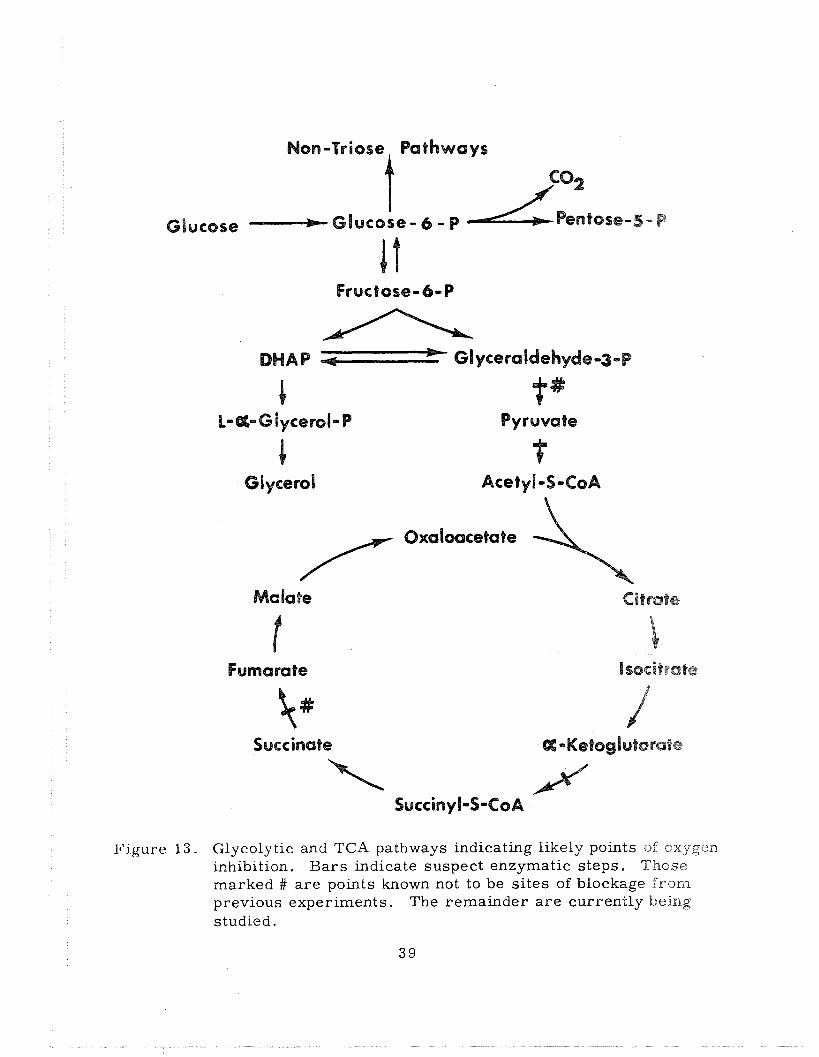
the pentose phosphate pathway (Figure 1 3 ) .
The usual depression in hematocrit was noticed in the experimental
animals although over this short period of exposure to 100'% oxygen (2 days)
the reduction is slight (Table 111).
TABLE 111. EXPERIMENTAL HEMATOCRIT VALUES AS A PER CENT OF CONTROLS.
An interesting observation has been noticed in the food consumption
data (Table IV). The experimental animals eat approximately 770 less food
Non-Trioss Pathways
Glucose Glucose - d - P
DWAP
L-aL-Glycerol-P Pyruvate
M a late
Succinate OC -Ketogbtarate
ll'igure 13. Glycolytic and TCA pathways indicating likely points of oxygen inhibition. Bars indicate suspect enzymatic steps. Those marked # a re points known not to be si tes of blockage from previous experiments. The remainder a r e currently being studied.

TABI,E IV. FOOD CONSUMPTION IN GRAMS/DAY /KG. BODY WEIGHT,
TREATMENT CONTROLS CON'TROLS
Actinomycin D
Cycloheximide
per kilogram of body weight when compared to the control ra t s . This is
particularly important when one realizes that it has been establiskaed by
Tepperman and Tepperman (18) that pentose shunt activity drops as food
consumption decreases; however, in our experimental animals pentose
phosphate pathway activity is actually increasing, although their food e o n ~ u r n -
tion is down.
The experimentals also showed an increased oxygen consumption
when compared to control values (Table V ) . These data a r e based on a
limited number of readings, but the increased oxygen consumption is s t r i k -
ingly parallel in time frame to the induction in glucose-6-phosphate dehy-
drogenase. Both appear to be maximal at about 48 hours exposure to the
10070 oxygen environment.
40
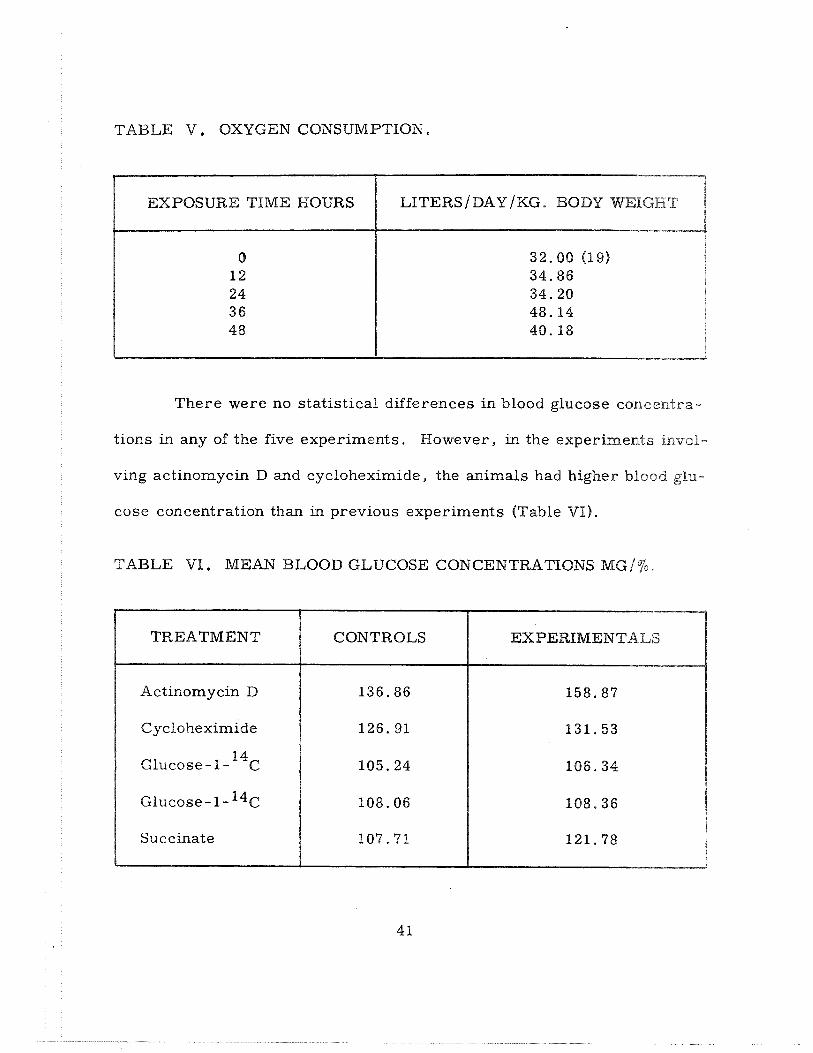
TABLE V. OXYGEN CONSUMPTION.
EXPOSURE TIME HOURS LITERS /DAY /KG. BODY WEIGHT
There were no statistical differences in blood glucose con.centra-
tions in any of the five experiments. However, in the experiments invol-
ving actinomycin D and cycloheximide, the animals had higher blood glu-
cose concentration than in previous experiments (Table VI).
TABLE VI. MEAN BLOOD GLUCOSE CONCENTRATIONS M G / ~ O .
TREATMENT CONTROLS EXPERIMENTALS
Actinomycin D
Cycloheximide
~ l u c o s e - 1- 14C
Succinate

f lowcver, the increase was probably the usual effect of the antibiotics,
(;lyc.ogen depletion and blood glucose increases a r e usual results of treat-
ment with inhibitors of protein synthesis, Bitman, - et al . (20).
Discussion:
It is apparent that the induction of glucose-6-phosphate dehydro-
genase is a true induction of new protein synthesis. Additionally, this
induction is probably the result of an inhibition of one of the e n z p e s of
glycolysis after glyceraldehyde-3-phosphate dehydrogenase, o r an enzyme
located between pyruvate dehydrogenase and succinic dehydrogenase in the
TCA cycle. If the particular enzyme involved in this inhibition is identified,
then the mechanism involved here may be basic in overt as well as margi-
nal oxygen toxicity. Regardless of the severity of the oxygen s t r e s s , the
basis for any change in metabolism could be the same. If the cell were to
have a block in the TCA cycle, available ATP s tores would be rapidly
depleted and convulsions would be the result. In our system the toxicity
is mild and the animal is able to adapt through energy transfer from the
pentose phosphate pathway. If the s t r e s s were more severe, say 5 atm at
100% oxygen, the ATP would be so rapidly and irreversibly depleted that
death would certainly occur. Therefore, many of the rapidly appearkg
symptoms of overt oxygen toxicity may be explained through this simple
imbalance in adenylate energy charge within the cell.

IV. TRACE METAL ALTERATIONS INDUCED BY A 5 PSIA- 10070 OXYGEN ENVLItONMENT
The particulars of this experiment were reported in detail in the
31 October 1969 Status Report and constitute the principal part of the thesis
submitted in partial fulfillment of the requirements for the degree of Master
of Science by David N . Lankford. The main thrust of this work revolves
around the significant role played by cations in enzymatic reacticsras with
particular emphasis on those involved in oxidation reactions, namely ison,
copper, and zinc.
After acclimatization to chamber living at one atmosphere in air
for a period of two weeks, groups of animals were exposed to the 5 psia-
100"r' oxygen environment for periods of 1 , 2 , 4 , 7 , 14, o r 28 days. The
animals were sacrificed in the test environment; subsequently, the liver,
thymus, hear t , spleen, kidney, lung, brain, red blood cells , and blood
serum were prepared for trace metal analysis. Additionally, an aliquot
of each liver was homogenized and fractionated into mitochondria, micro-
somes, and cytoplasmic fractions for trace metal determinations. The
specifics of the technique using the atomic absorption spectrophotometer
a r e outlined in the 31 October 1969 Status Report. The absolute values
reported for each fraction in each metal with the statistical treatment s f
the data a r e presented in detail in David Lankford's thesis. However,
there appear to be some general conclusions which can be summarized.
The trend of the data is clear; the metabolically vital organs "tend
to concentrate the three cations in question. The heart showed an h c r e a s e
in concentration of all three metals; the kidneys showed an increase in both
copper and zinc with iron essentially remaining unchanged. The liver and
the various fractions of the liver generally showed an increase in both
iron and zinc throughout the experiment with no bold change in the amount
of copper present. The lung consistently showed an impressive h e r ease
in iron and zinc with a decrease in copper. The lung results may be related
to the lability of cytochrome oxidation in comparison with other cy"i&hrme
chain enzymes since this tissue is openly exposed to the hyperoxic envir-on-
ment .
The translocation of cations observed in the four t issues above seem
to occur at the expense of organs which a r e not metabolically a s vital. The
thymus, for example, showed a decrease in all three metals either on an
absolute basis o r on a concentration basis; this parallels other data show-
ing the involution of the thymus gland. The brain lost iron and capper
while zinc was apparently unaffected. One is tempted to predict that other
organs which a r e not so immediately involved in the homeostatic mechanism
of the animal may be additional sources of cations.

With respect to the hemotologic system, the spleen shows an increase
in iron which paralleled the data by Kaplan (21) which indicate an increarse in
the destruction of red blood cells involving principally older red blood cells.
There were no bold changes with respect to copper o r zinc in the spleen,
There was a decrease in both iron and copper in red blood cells cianccami.tant
with a tendency towards higher values for zinc. This may reflect a defi-- -
ciency of iron and copper in the bone marrow but also might be inlerpre4;ed
a s a part of the homeostatic mechanism reducing the amount of oxygen
being carried to the cell by reducing the amount of ca r r ie r cations in the
blood. These changes in the red blood cell cation content were observable
in t e rms of total concentration of the cations in the red blood cells arnd on a
relative basis , that is, cation concentration per milligram of red blood
cells. Consequently, the decrease in concentration of iron and copper was
not simply a reflection of the decreased hematocrit value. It is interes-
ting that cation concentrations within the serum were essentially maffeeted
by this environmental s t r e s s .
In preparing this work for publication, interpretation is b e h g
approached from the following four points of view: (a) individual metal,
(b) individual tissue, (c) key enzymes o r enzyme systems, and (dl bas-
energetic pathways. Each of these points of view provides an h t e r e s l k g
story which will be presented in the next status report.

APPENDIX A
The following is a detailed discussion of the theoretical considera-
tions of the effect of diluent gas on oxygen transport briefly sumrnarize~i
in Section 11.
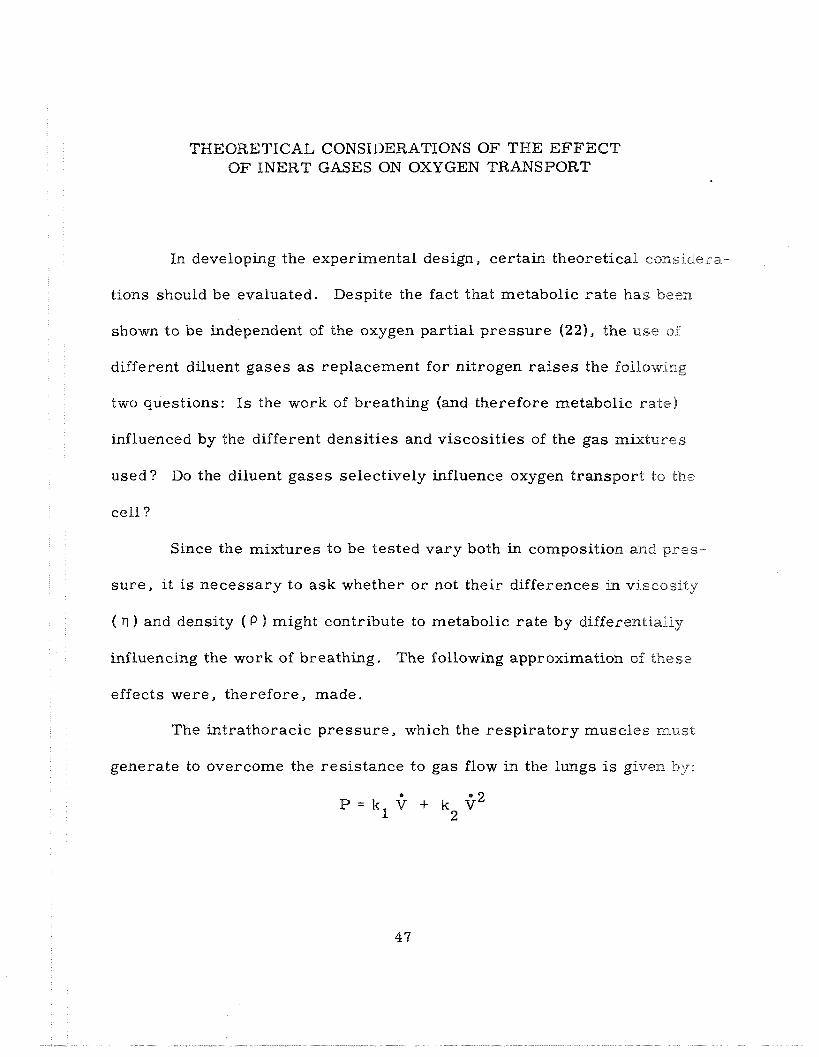
THEORETICAL CONSIDERATIONS OF TI-IE EFFECT OF INERT GASES ON OXYGEN TRANSPORT
In developing the experimental design, certain theoretical considera-
tions should be evaluated. Despite the fact that metabolic ra te has been
shown to be independent of the oxygen partial pressure (221, the use of
different diluent gases a s replacement for nitrogen ra i ses the follo\ving
two questions: I s the work of breathing (and therefore metabolic rate)
influenced by the different densities and viscosities of the gas mixtures
used? Do the diluent gases selectively influence oxygen transport to the
cell ?
Since the mixtures to be tested vary both in composition and pres-
sure , i t is necessary to ask whether o r not their differences in viscosity
( r7 ) and density ( P ) might contribute to metabolic rate by differentially
influencing the work of breathing. The following approximation of these
effects were, therefore, made.
The intrathoracic pressure, which the respiratory muscles m.ust
generate to overcome the resistance to gas flow in the lungs is given by:

e
where : V = time derivative of gas flow kl = proportionality constant based on the effect of viscosity k2 = proportionality constant based on the effect of density.
In general, the kli' t e rm characterizes the laminar flow component
* 2 while k V represents the turbulent flow factor. Breathing, thus, entails 2
both laminar and turbulent gas flow with laminar predominating at rest and
during light work, while turbulent flow increases with increasing work
load and ventilation ra te . Although almost impossible to measure, it is
necessary to approximate the degree to which each of these flow components
influences gas flow and the intrathoracic pressure at "normal" ventil.ation
ra tes . The Reynold's Number (NR) approximates this by the equation:
where: P = gas density in g / cm Y
$ = ventilation rate in ml / s ec r = tube radius in cm rl = gas viscosity in poise.
Using standard viscosity and density values (Table VII), the relative
densities, viscosities, and Reynold's Number of the various mixtures were
calculated and a r e listed in Table VIII.
As a rough guideline, NR values l ess than 2000 a r e considered pri-
marily laminar in nature, those above 4000 primarily turbulent, with inter -
mediate figures representing a combination of both. Since the l hk ig of the

Table VII. Standard values for viscosity ( II ) and ( P ) (23).
Gas n * P ::*
Oxygen 189 1.429 Helium 186 . I 78 Neon 2 97 .900 Nitrogen 168 I . 250 Argon 209 1.784
* in micropoise at 2 7 3 ' ~ :$* in g / ~ at 2 7 3 O ~
Table VIIP. Calculated values of gas mixtures for density, viscosity, and Reynold's number (N ) at ~ 7 3 ~ ~ . All mixtures contain oxygen
S at 160 mm Hg partia pressure .
J,
P .b .b
Mixture P ~ l ‘ rl N ~ * 'I-
): Total p ressure in m m Hg. >iC* U s i n g 9 = .073 ~ / m i n ( 2 4 ) a n d r = .O1 cm (25).
bronchial t ree is not smooth, predominantly turbulent flow in the lungs
occurs a t values around 3000. On this bas is , we can see f rom the calm-
lated NR for the different mixtures (Table VIII) that resting ventilaiion
ra te effects mainly laminar flow and that a five- to ten-fold increase in
ventilation would be necessary before turbulent flow would be predomkant ,
i f tube diameters do not vary appreciably.
49
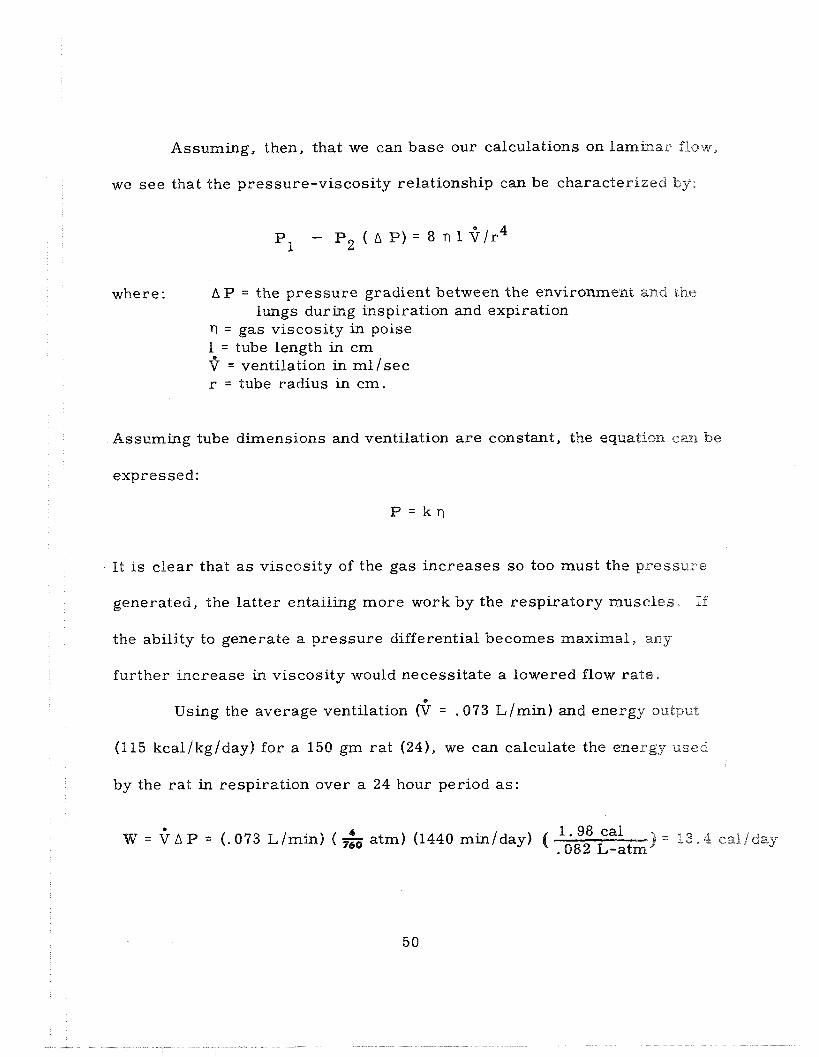
Assuming, then, that we can base our calculations on l ambar flaw,
we see that the pressure-viscosity relationship can be characterized by:
where: AP = the pressure gradient between the environment %ad the lungs during inspiration and expiration
17 = gas viscosity in poise 1 = tube length in cm $ = ventilation in ml/sec r = tube radius in cm.
Assuming tube dimensions and ventilation are constant, the equation care be
expressed:
P = k r l
It is clear that a s viscosity of the gas increases so too must the p res su re
generated, the latter entailing more work by the respiratory muslcles, If
the ability to generate a pressure differential becomes maximal, any
further increase in viscosity would necessitate a lowered flow rats .
0
Using the average ventilation (V = .073 L/min) and energy output
(1 15 kcal/kg/day) for a 150 gm rat (24), we can calculate the energy used
by the rat in respiration over a 24 hour period as:
1 .98 cal W = $ A P = (. 073 Llmin) ( & atm) (1440 miniday) ( . 082 L-atm ) = 1 3 , 4 ca18day.

Since the efficiency of breathing averages 8-1270, the total energy to 'be
produced would be approximately:
(13.4 cal /day) X 10 = 134 callday
A s a percentage of the total energy output, this value represents:
134 c:al/day (. 150 kg) (115 kcal/kg/day) = .8%
Based on s imi lar calculations for both energy and oxygen eonsumpLion in
man (1-5701, this value is somewhat low; but it does appear to be in the
general range that is usually quoted (26). Since the viscosity values of
the different gases (Table VIII) range only 50% greated than that for air,
we can assume that the percent of work in breathing would not deviate more
than half again a s much a s the above figure. On that bas is , we concluded
that the work of breathing the diluent gases studied under al l but heavy
exercise o r emotional conditions will not significantly affect the measured
metabolic ra te .
This treatment admittedly has been crude, but it seems unlikely
that the calculations have not been in e r r o r by a factor of more than two o r
three and that, given the ra ther great difference between our calculated
value and one which would be considered significant (5%), we a r e confident

that the experimental results can be interpreted without undue concern
about the effect of the work of breathing.
The second question to be resolved deals with the effect, if any, of
the various r a r e gases upon transport of oxygen and carbon dioxide from
the alveoli to the blood and thence by the blood to the tissues. Specifically,
we must determine whether o r not the animals in one environment might
be hypoxic relative to those in another. Hypoxia in a group of aniimals
would lead to increased ventilation and protein turnover both of which
influence metabolic rate.
The works of Featherstone, - et a l . (27) and others (28, 29) have
conclusively shown that proteins can undergo structural changes when
combined with biologically inert anesthetic gases. Since the membranes
through which oxygen must diffuse and hemoglobin itself both eontak pro-
tein, there is reason to ask whether o r not this phenomenon influences
oxygen transport. If the "inert" gas bound to the protein were to sterically
hinder oxygen passage through membrane o r chemically hinder oxygen-
heme interaction, one would expect to see an altered oxygen-carrying
capacity. More specifically, Overfield, et al . (30) observed a doublhg
of the alveolar-arterial oxygen tension difference ((A-a) DO2) in men
exposed to a 99.170 helium-0.9% oxygen environment at 31.3 Ata. They
concluded that the increased "inert" gas partial pressure was p r ~ b a b l y the

cause but felt the effect was not biologically significant. Most dramatic is
the work of Altland, - et a l . (31) who demonstrated a distinctly patterned
mortality rate in r a t s exposed to different diluent gas-oxygen mixtures at
one atmosphere where the oxygen fraction was varied between 20,93% and
4. 9%. The mortality rate increased with increasing hypoxia and the inert
gas used a s follows:
The site of the apparent diluent gas potentiation of hypoxia was not studied
but blood gas transport cannot be overlooked.
The two most probable loci of action a r e the alveolar-arterial
exchange and oxygen binding by hemoglobin. If the former site was
affected, one would expect to see a variation in the difference between the
alveolar oxygen tension (P 0 ) and that of the blood (P 0 ). There are A 2 a 2
several factors (exercise, disease, anesthesia) which enlarge this dif -
ference , making data interpretation difficult. With a "normal" range of'
2-10 mm Hg, we would consider a value on the order of 15-20 rnm Hg as
significant. However, the (A-a) DO2 would not be meaningful if the P 0 a 2
of the various animals were approximately equal in the different environ-
ments. Since the ability to load hemoglobin with oxygen is dependent on

the P,02, a measurement of the Pa02 versus oxygen saturation (OS) is
necessary. If these parameters a re dissimilar between the test environ-
ments, we would suspect diluent gas interference with oxygen-heme inter-
action. Specifically, if this were to occur, a higher P 0 would be se - a 2
quired to produce the same OS as that measured in an environment in
which there was interference. Alternatively, one might see a lesser OS
at an equivalent P O in an atmosphere which effects this phenomenon, a 2
It would be assumed, then, that oxygen transport to the tissues wsukd be
relatively deficient.
Since a normal Pa02 determination is difficult to make in animaJ.s,
alveolar oxygen pressure was estimated using the alveolar gas equation1 (32):
1 - F-0-
where: FI02 = fraction of inspired oxygen
PT = total barometric pressure
0 = vapor pressure of water at 37 C
p ~ 2 0 . PAC02 = partial pressure of carbon dioxide in the alveoli
R = gas exchange ratio, c02/02.
The calculated values a re given in Table IX.

Table IX. Calculated values for P O in the various A 2
environments.
Mixture F ~ 0 2 'A02*
Argon- oxygen Nitrogen- oxygen Neon-oxygen Helium - oxygen
assumes: PAC02 = 40 mm Hg
PHZO = 47 mm Hg
* rnrn Hg
R = 0.85
To tes t the theoretical calculations, we sampled ar ter ia l blood from
the aorta of mongrel dogs for the P O and OS determinations. LPbikiall'q, a 2
anesthetized dogs were tested using constant respiratory conditions. After
the animal was anesthetized and intubated to deliver the b rea thbg mixture,
the left common carotid a r te ry was exposed and a teflon catheter was
passed through i t into the lumen of the aortic arch. After the entire prepara
tion and technician were taken to the experimental pressure, a pneuma-.
thorax was performed, and the dog was artificially respired using the test
gas mixture delivered by a Bennett respirator at constant ra te and pressure
of delivery. The animal was respired 15-20 minutes with the test mixture
to assure saturation of the blood with the gas, af ter which samples were
drawn under anaerobic conditions. The preparation was then taken to the
next experimental pressure and the procedure repeated.
55

Additionally, we have used alert dogs comfortably restrained in a
sling with a chronically implanted catheter and breathing through a f i t ted
mask. With adequate training, the animal can be induced into a r e s t i ~ g
state for prolonged periods of time such that it can be tested successively
in all the experimental environments with little or no perturbation.
All blood samples were chilled to OOC until analysis which was
carried out in duplicate on a Radiometer blood-gas apparatus equipped
with microelectrodes and an American Optical Oximeter at ambient p r e s -
sure (632 mm Hg). The results a re shown in Tables X.
Table X . Averages for arterial blood-gas parameters for anesthetized and alert dogs.
Anesthetized
Alert
':c mm Hg 'io:E based on calculated P CO using actual P CO measured
A 2 a 2
Interpretation of the data for anesthetized dogs must be made on a
relative basis since the effects of anesthesia cannot be quantified. Despite
controlled respiration, the animals had a fairly wide PaCO range (25- 45 2
mm Hg) which also makes interpretation difficult. However, it can be
seen that the PaOZ and OS compared favorably in air and argon-oxygen;
and we feel that any differences a re accounted for by experimental e r ro r ,
The preliminary results for alert dogs a re very encouraghg since
the values a re almost identical with those reported for a ir (331, and the
range of values was quite narrow indicating good reproducibility. Here
too, differences i n P 0 and OS are probably due only to experimental a 2
e r ro r . The rather large (A-a)D02 values a re almost certainly due to the
somewhat hyperventilated state of the animals, a problem which we are
presently working to resolve. While the apparent difference in (A-a)D02
between air and argon-oxygen may be real, it has little biological signifi-
cance since the end result (Pa02) seems to be nearly identical in both
cases.
We intend to expand the study with alert dogs using argon-oxygen,
helium-oxygen, and air with the goal of obtaining accurate and statistically
valid data for these blood parameters in these atmospheres. Neon-oxygen
will probably not be tested due to its prohibitive cost; but it is reasonable
to assume that, since it falls within a range of expected values bounded by
argon-oxygen and helium-oxygen, it will not be significxnt with regard to

hemoglobin binding of oxygen. It will be tested, though, i f necessary, The
results of this study will then be used in the design of a complementary
experiment.
APPENDIX B
t I The following is the abstract of a paper entitled, Aberrational.
Effects of Space Capsule Atmospheres on Rat Brain Coenzyme A Conten~t, ' '
which was presented at the American Federation for Clinical Research
meeting held in Oklahoma City, Oklahoma, on 7 April 1970.
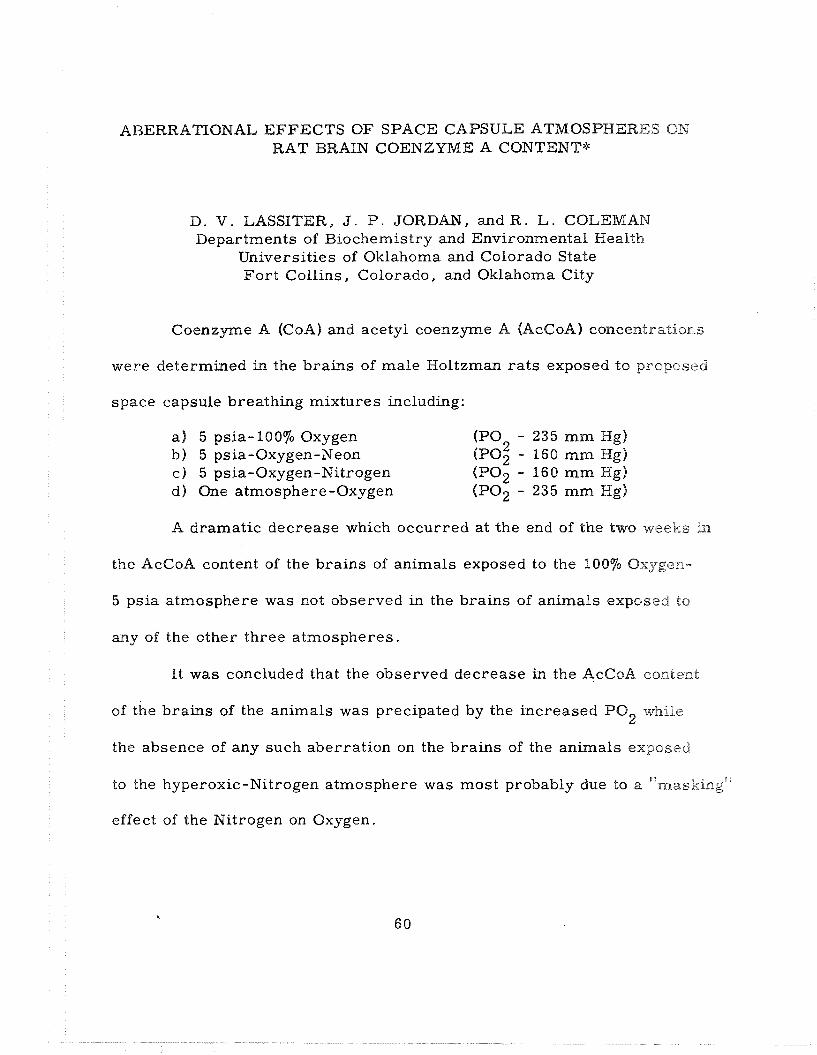
ABERRATIONAL EFFECTS OF SPACE CAPSULE ATMOSPHERES ON RAT BRAIN COENZYME A CONTENT*
D. V . LASSITER, J . P . JORDAN, and R . L . COLEMAN Departments of Biochemistry and Environmental Health
Universities of Oklahoma and Colorado State For t Collins, Colorado, and Oklahoma City
Coenzyme A (CoA) and acetyl coenzyme A (AcCoA) concentration!^
were determined in the brains of male Holtzman r a t s exposed to proposc3d
space capsule breathing mixtures including:
a ) 5 psia-100% Oxygen (POZ - 235 m m Hg) b) 5 psia-Oxygen-Neon (POz - 160 rnm Kg) c ) 5 psia-Oxygen-Nitrogen (PO2 - 160 m m Hg) d) One atmosphere-Oxygen (PO2 - 235 m m Hg)
A dramatic decrease which occurred at the end of the two weeks in
the AcCoA content of the brains of animals exposed to the 10070 Oxygen-
5 psia atmosphere was not observed in the brains of animals exposed to
any of the other three atmospheres.
It was concluded that the observed decrease in the AcCoA content
of the brains of the animals was precipated by the increased POz while
the absence of any such aberration on the bra ins of the animals exposed
to the hyperoxic-Nitrogen atmosphere was most probably due to a "masking"
effect of the Nitrogen on Oxygen.
VI. REFERENCES
1. Rhoades , R . A . , R . A . Wright , E . P . Hiat t , and H. S. Weiss , Metabolic and T h e r m a l Responses of the R a t to a Heliurn-Oxygen Environment , Am. J. Phys io l . , 213:1009-1014, 1967.
2 . Pepelko, W . E . , Effect of Different I ne r t G a s e s and Low P r e s s u r e Normoxic Environment on Oxygen Uptake in Mice , SAM-TR- 66- 84, USAF School of Ae rospace Medicine , Brooks AFB, T e x a s , October, 1966.
3 . Leon, H. A . and S . F. Cook, A Mechanism by Which Hel ium Increases Metabol ism in Sma l l M a m m a l s , Am. J . Physiol . , 199:243-245, 1960.
4. B r a u e r , R . W . , M . R . Jo rdan , R . 0 . Way, and M . E . Sheehan, High P r e s s u r e Hyperexcitabil i ty Syndrome in the Squ i r r e l Monkey, Fed. P r o c . , 28:655, 1969.
5 . Cook, S . F . and South, F. E . , Helium and Comparat ive In Witro Metabol ism of Mouse T i s s u e S l i ce s , A m . J . Phys io l . , 173: 542, 1953.
6 . Sch re ine r , H. R . , R . C . Ge rgo i r e , and J . A . Lawr i e , New BnsiogieaB Effect of the G a s e s of the Helium Group , Science, 1363653-654, 1962.
7 . Fea the r s tone , R . M . and C. A . Muehlbaecher , The Cur r en t Role of I n e r t G a s e s in the Sea rch f o r Anesthetic Mechanism, Pharmaccsl. R e v . , 15:97-121, 1963.
8. Paul ing, L . , A Molecular Theo ry of Genera l Anesthesia , Science, 134:15-21, 1961.
9. Hi ldebrand, J . H. and R . L . Scott , Reinhold Publ ishing Corp . , New York, 1950, pp. 424-434.
10. Szepes i , B. and R . A . F reed l and , J . N u t r . , 94:37-46, 1968

11. Schneider , W. C . and 6 . H. Hogeboom, J . Biol . C h e m . , 183:123,# 1950.
12. Green , D. W . , S. Mi i , and D. M . Kohout, J . Biol . C h e m . , 287: 651, 1955.
13. Schambye, P . , H. 6 . Wood, and G . Popjack, J . Biol . Che rn . , 206:875, 1953.
14. R o s e , I. A . , R . K e l l e r m e y e r , R . S t je rnholm, and H . G. Wood, 3 . Biol. C h e m . , 237:3325, 1962.
15. Katz , J . , B . R . Landau, and G . E . B a r t s c h , J. Biol . C h e m , , 241: 727, 1966.
16. R a m a s a r m a , T . and H. N . Aithal , Biochem. J . , 115:77-83, 1989
17. Sande r s , A . P . , I. H . Hal l , B . Woodhall, Science, 150:1830-1831, 1965.
18. Teppe rman , H . M . and J. Tepperman, Adv. Enz . Regulation, 1:121- 136, 1963.
19 . Biology Data Book, P. L. Altman and D. S . D i t tmer , e d s . , Federa- tion of Amer i can Socie t ies f o r Exper imenta l Biology, Washkg ton , D . C . , 1964, p . 347.
20. Bi tman, J . , L . A . T r e z i s e , and H . C . Cec i l , Arch . Biochem. Bio- phys . , 114:414-420, 1966.
21. Kaplan, H. P . , Hematologic Effects of I nc r ea sed Oxygen Tensions, Aerospace M e d . , 38:676-685, 1967.
22. Maio, D. A . and S . R . Nevil le, Effect of Chemical ly Ine r t Gases csn Oxygen Consumption i n Living T i s s u e s . Ae rospace Med. , 38: 1049, 1967.
23. Handbook of Chemis t ry and Phys i c s , 45th Edit ion, Neas t , Senby, and Hodgman, e d s . , The Chemica l Rubber Co. , Cleveland, Ohio, 1964.
24. Biology Data Book, P. L . Altman and D. S . Dittmer, eds . , Federa- tion of American Societies f o r Experimental Biology, Washhgton, D. C . , 1964, p . 220.
25. Wiebel, E . R . , Morphometr ics of the Lung in Respiration, V01. I , Handbook of Physiology, W . 0 . Fenn and H. Rahn, eds . , Amerid3m Physiological Society, Washington, D. C . , 1964, pp. 285-308,
26. Otis , A. B . , The Work of Breathing, Vol. I , a
W . 0. Fenn and H . Rahn, eds . , American Physiological Society, Washington, D. C . , 1964, pp. 463-476.
27. Featherstone, R. M . , C . A. Muehlbaecher, F. L. DeBon, and 3. A . Forsa i th , Interactions of Iner t Anesthetic Gases with Pro te ins , Anesthesiology, 22:977-981, 1961.
28. Kwan, E . and A. Trevor , The Association of Xenon with Subcellular Components of Rat Cerebra l Cortex. Mol. Pharmacol . , 5:2%6- 243, 1969.
29. Schoenborn, B . P. , Binding of Anesthetics to Protein: an X-ray Crystallographic Investigation, Fed . P r o c . , 27:888-894, 1968
30. Overfield, E . M . , H . A . Saltzman, J. A. Kylstra , and J . V . Salzzmo, Respi ra tory Gas Exchange in Normal Men Breathing 0.970 Bxygei? in Helium a t 31 .3 Ata. , J. Appl. Physiol. , 27:471-475, P 969.
31. Altland, P. D . , H. R . Brubach, and M. G. P a r k e r , Effects of Inert Gases on Tolerance of Rats to Hypoxia, J . Appl. Physiol. , 24: 778-781, 1968.
32. Comroe, J . H. , Physiology of Respiration, Year Book Medical Pub- l i s h e r s , Inc. , Chicago, 1968, p . 19.
33. Donald W . DeYoung, Colorado State University, personal cornmuica t ion .