Semi-Annual Report - RiverPark Funds
56
Semi-Annual Report March 31, 2021 (Unaudited) Investment Adviser: RiverPark Advisors, LLC RiverPark Large Growth Fund Retail Class Shares and Institutional Class Shares Wedgewood Fund Retail Class Shares and Institutional Class Shares RiverPark Short Term High Yield Fund Retail Class Shares and Institutional Class Shares RiverPark Long/Short Opportunity Fund Retail Class Shares and Institutional Class Shares RiverPark Strategic Income Fund Retail Class Shares and Institutional Class Shares RiverPark Floating Rate CMBS Fund Retail Class Shares and Institutional Class Shares Beginning on January 1, 2021, as permitted by regulations adopted by the Securities and Exchange Commission, paper copies of the Funds’ shareholder reports no longer will be sent by mail, unless you specifically request paper copies of the reports from the Funds or from your financial intermediary, such as a broker-dealer or bank. Instead, the reports will be made available on a website, and you will be notified by mail each time a report is posted and provided with a website link to access the report. If you already elected to receive shareholder reports electronically, you will not be affected by this change and you need not take any action. You may elect to receive shareholder reports and other communications from the Funds electronically by contacting your financial intermediary, or, if you are a direct investor, by calling 888-564-4517. You may elect to receive all future reports in paper free of charge. If you invest through a financial intermediary, you can follow the instructions included with this disclosure, if applicable, or you can contact your financial intermediary to inform it that you wish to continue receiving paper copies of your shareholder reports. If you invest directly with the Funds, you can inform the Funds that you wish to continue receiving paper copies of your shareholder reports by calling 888-564-4517.Your election to receive reports in paper will apply to all funds held with your financial intermediary if you invest through a financial intermediary or all RiverPark Funds if you invest directly with the Funds.
Transcript of Semi-Annual Report - RiverPark Funds
Semi-Annual ReportMarch 31, 2021 (Unaudited)
Investment Adviser: RiverPark Advisors, LLC
RiverPark Large Growth FundRetail Class Shares and Institutional Class Shares
Wedgewood FundRetail Class Shares and Institutional Class Shares
RiverPark Short Term High Yield FundRetail Class Shares and Institutional Class Shares
RiverPark Long/Short Opportunity FundRetail Class Shares and Institutional Class Shares
RiverPark Strategic Income FundRetail Class Shares and Institutional Class Shares
RiverPark Floating Rate CMBS FundRetail Class Shares and Institutional Class Shares
Beginning on January 1, 2021, as permitted by regulations adopted by the Securities and Exchange Commission, paper copies of the Funds’ shareholder reports no longer will be sent by mail, unless you specifically request paper copies of the reports from the Funds or from your financial intermediary, such as a broker-dealer or bank. Instead, the reports will be made available on a website, and you will be notified by mail each time a report is posted and provided with a website link to access the report.
If you already elected to receive shareholder reports electronically, you will not be affected by this change and you need not take any action. You may elect to receive shareholder reports and other communications from the Funds electronically by contacting your financial intermediary, or, if you are a direct investor, by calling 888-564-4517.
You may elect to receive all future reports in paper free of charge. If you invest through a financial intermediary, you can follow the instructions included with this disclosure, if applicable, or you can contact your financial intermediary to inform it that you wish to continue receiving paper copies of your shareholder reports. If you invest directly with the Funds, you can inform the Funds that you wish to continue receiving paper copies of your shareholder reports by calling 888-564-4517.Your election to receive reports in paper will apply to all funds held with your financial intermediary if you invest through a financial intermediary or all RiverPark Funds if you invest directly with the Funds.
Table of Contents
Schedules of Investments
RiverPark Large Growth Fund . . . . . . . . . . . . . . . . . . . . . . . . . . . . . . . . . . . . . . . . . . . . . . . . . . . . . . . . . . . . . . . . . . . . . . 1
Wedgewood Fund . . . . . . . . . . . . . . . . . . . . . . . . . . . . . . . . . . . . . . . . . . . . . . . . . . . . . . . . . . . . . . . . . . . . . . . . . . . . . . . 2
RiverPark Short Term High Yield Fund . . . . . . . . . . . . . . . . . . . . . . . . . . . . . . . . . . . . . . . . . . . . . . . . . . . . . . . . . . . . . . . 3
RiverPark Long/Short Opportunity Fund . . . . . . . . . . . . . . . . . . . . . . . . . . . . . . . . . . . . . . . . . . . . . . . . . . . . . . . . . . . . . . 7
RiverPark Strategic Income Fund . . . . . . . . . . . . . . . . . . . . . . . . . . . . . . . . . . . . . . . . . . . . . . . . . . . . . . . . . . . . . . . . . . . 10
RiverPark Floating Rate CMBS Fund . . . . . . . . . . . . . . . . . . . . . . . . . . . . . . . . . . . . . . . . . . . . . . . . . . . . . . . . . . . . . . . . 19
Statements of Assets and Liabilities . . . . . . . . . . . . . . . . . . . . . . . . . . . . . . . . . . . . . . . . . . . . . . . . . . . . . . . . . . . . . . . . . . . 21
Statements of Operations . . . . . . . . . . . . . . . . . . . . . . . . . . . . . . . . . . . . . . . . . . . . . . . . . . . . . . . . . . . . . . . . . . . . . . . . . . . 23
Statements of Changes in Net Assets . . . . . . . . . . . . . . . . . . . . . . . . . . . . . . . . . . . . . . . . . . . . . . . . . . . . . . . . . . . . . . . . . 25
Financial Highlights . . . . . . . . . . . . . . . . . . . . . . . . . . . . . . . . . . . . . . . . . . . . . . . . . . . . . . . . . . . . . . . . . . . . . . . . . . . . . . . 28
Notes to Financial Statements . . . . . . . . . . . . . . . . . . . . . . . . . . . . . . . . . . . . . . . . . . . . . . . . . . . . . . . . . . . . . . . . . . . . . . . 34
Disclosure of Fund Expenses . . . . . . . . . . . . . . . . . . . . . . . . . . . . . . . . . . . . . . . . . . . . . . . . . . . . . . . . . . . . . . . . . . . . . . . . 52
The RiverPark Funds file their complete schedules of fund holdings with the Securities and Exchange Commission (the “Commission”) for the first and third quarters of each fiscal year on Form N-Q or as an exhibit to its reports on Form N-Port within sixty days after the end of the period. The Funds’ Forms N-Q and Form N-Port reports are available on the Commission’s website at http://www.sec.gov, and may be reviewed and copied at the Commission’s Public Reference Room in Washington, D.C. Information on the operation of the Public Reference Room may be obtained by calling 1-800-SEC-0330.
A description of the policies and procedures that the Funds use to determine how to vote proxies relating to fund securities, as well as information relating to how a Fund voted proxies relating to fund securities during the most recent period ended June 30 is available (i) without charge, upon request, by calling 888-564-4517; and (ii) on the Commission’s website at http://www.sec.gov.
1The accompanying notes are an integral part of the financial statements.
0 50
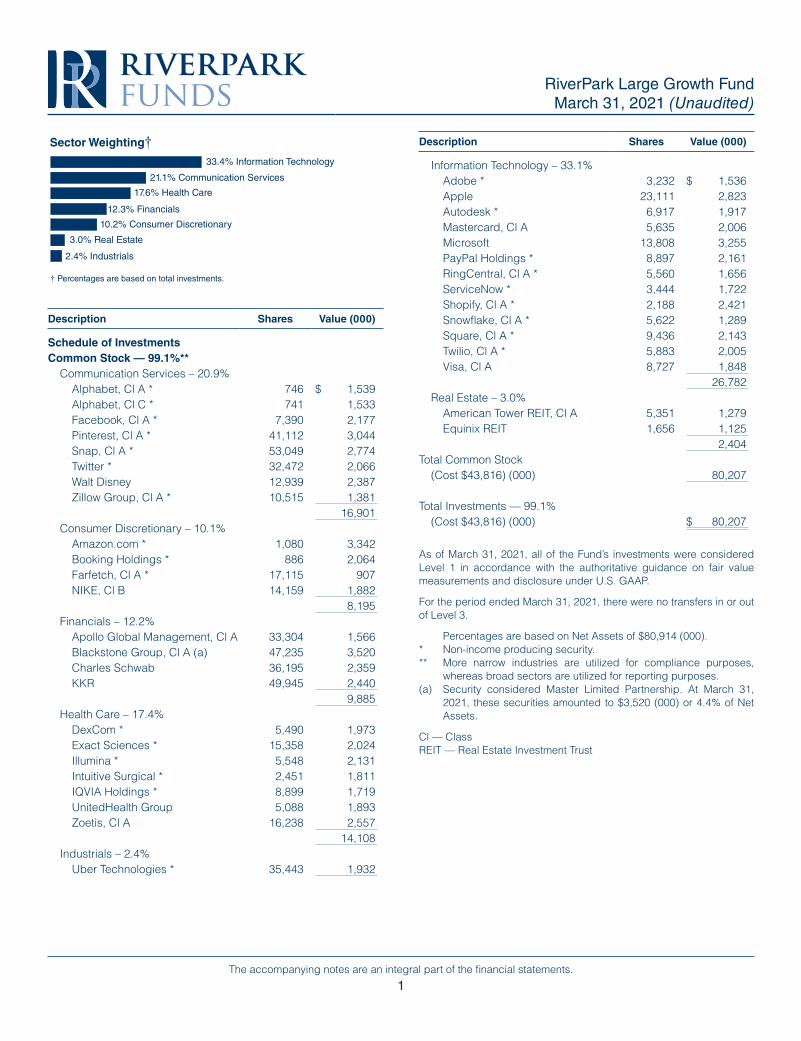
33.4% Information Technology
† Percentages are based on total investments.
10.2% Consumer Discretionary
21.1% Communication Services
17.6% Health Care
Sector Weighting†
12.3% Financials
3.0% Real Estate
2.4% Industrials
Description Shares Value (000)
Schedule of InvestmentsCommon Stock — 99.1%**
Communication Services – 20.9%Alphabet, Cl A * 746 $ 1,539Alphabet, Cl C * 741 1,533Facebook, Cl A * 7,390 2,177Pinterest, Cl A * 41,112 3,044Snap, Cl A * 53,049 2,774Twitter * 32,472 2,066Walt Disney 12,939 2,387Zillow Group, Cl A * 10,515 1,381
16,901Consumer Discretionary – 10.1%
Amazon.com * 1,080 3,342Booking Holdings * 886 2,064Farfetch, Cl A * 17,115 907NIKE, Cl B 14,159 1,882
8,195Financials – 12.2%
Apollo Global Management, Cl A 33,304 1,566Blackstone Group, Cl A (a) 47,235 3,520Charles Schwab 36,195 2,359KKR 49,945 2,440
9,885Health Care – 17.4%
DexCom * 5,490 1,973Exact Sciences * 15,358 2,024Illumina * 5,548 2,131Intuitive Surgical * 2,451 1,811IQVIA Holdings * 8,899 1,719UnitedHealth Group 5,088 1,893Zoetis, Cl A 16,238 2,557
14,108Industrials – 2.4%
Uber Technologies * 35,443 1,932
Description Shares Value (000)
Information Technology – 33.1%Adobe * 3,232 $ 1,536Apple 23,111 2,823Autodesk * 6,917 1,917Mastercard, Cl A 5,635 2,006Microsoft 13,808 3,255PayPal Holdings * 8,897 2,161RingCentral, Cl A * 5,560 1,656ServiceNow * 3,444 1,722Shopify, Cl A * 2,188 2,421Snowflake, Cl A * 5,622 1,289Square, Cl A * 9,436 2,143Twilio, Cl A * 5,883 2,005Visa, Cl A 8,727 1,848
26,782Real Estate – 3.0%
American Tower REIT, Cl A 5,351 1,279Equinix REIT 1,656 1,125
2,404Total Common Stock
(Cost $43,816) (000) 80,207
Total Investments — 99.1%(Cost $43,816) (000) $ 80,207
As of March 31, 2021, all of the Fund’s investments were considered Level 1 in accordance with the authoritative guidance on fair value measurements and disclosure under U.S. GAAP.
For the period ended March 31, 2021, there were no transfers in or out of Level 3.
Percentages are based on Net Assets of $80,914 (000).* Non-income producing security.** More narrow industries are utilized for compliance purposes,
whereas broad sectors are utilized for reporting purposes.(a) Security considered Master Limited Partnership. At March 31,
2021, these securities amounted to $3,520 (000) or 4.4% of Net Assets.
Cl — ClassREIT — Real Estate Investment Trust
RiverPark Large Growth FundMarch 31, 2021 (Unaudited)
2The accompanying notes are an integral part of the financial statements.
0 50
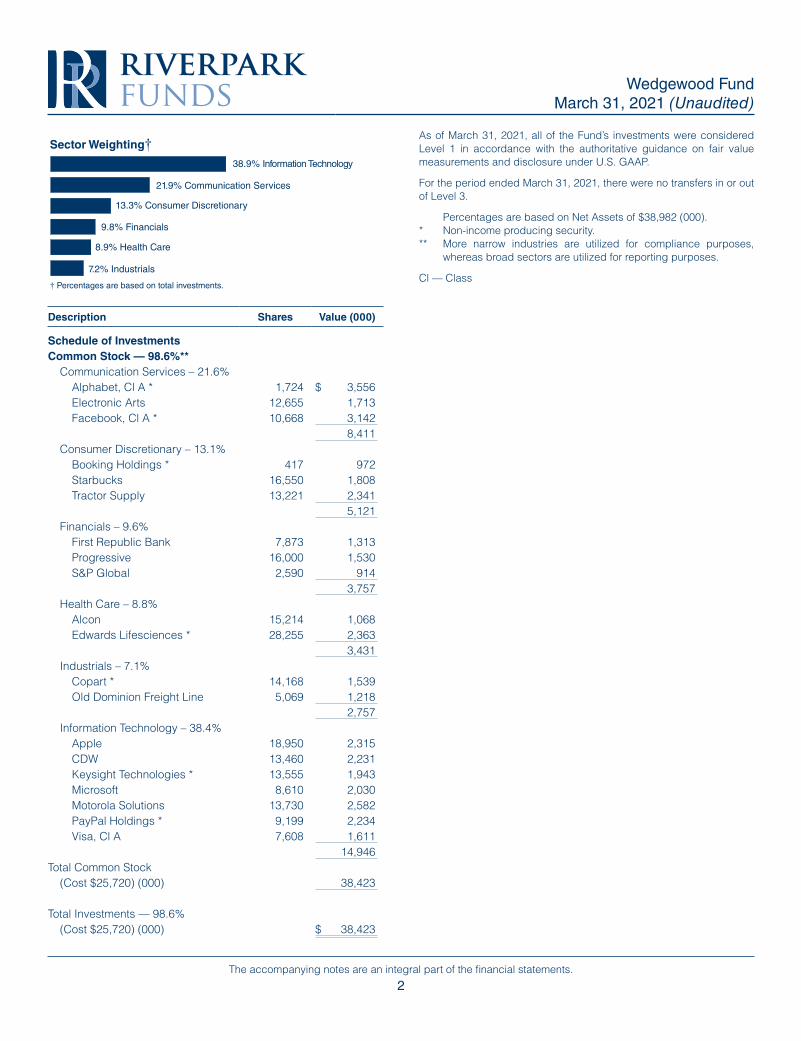
38.9% Information Technology
Sector Weighting†
† Percentages are based on total investments.
8.9% Health Care
7.2% Industrials
9.8% Financials
13.3% Consumer Discretionary
21.9% Communication Services
Description Shares Value (000)
Schedule of InvestmentsCommon Stock — 98.6%**
Communication Services – 21.6%Alphabet, Cl A * 1,724 $ 3,556Electronic Arts 12,655 1,713Facebook, Cl A * 10,668 3,142
8,411Consumer Discretionary – 13.1%
Booking Holdings * 417 972Starbucks 16,550 1,808Tractor Supply 13,221 2,341
5,121Financials – 9.6%
First Republic Bank 7,873 1,313Progressive 16,000 1,530S&P Global 2,590 914
3,757Health Care – 8.8%
Alcon 15,214 1,068Edwards Lifesciences * 28,255 2,363
3,431Industrials – 7.1%
Copart * 14,168 1,539Old Dominion Freight Line 5,069 1,218
2,757Information Technology – 38.4%
Apple 18,950 2,315CDW 13,460 2,231Keysight Technologies * 13,555 1,943Microsoft 8,610 2,030Motorola Solutions 13,730 2,582PayPal Holdings * 9,199 2,234Visa, Cl A 7,608 1,611
14,946Total Common Stock
(Cost $25,720) (000) 38,423
Total Investments — 98.6%(Cost $25,720) (000) $ 38,423
As of March 31, 2021, all of the Fund’s investments were considered Level 1 in accordance with the authoritative guidance on fair value measurements and disclosure under U.S. GAAP.
For the period ended March 31, 2021, there were no transfers in or out of Level 3.
Percentages are based on Net Assets of $38,982 (000).* Non-income producing security.** More narrow industries are utilized for compliance purposes,
whereas broad sectors are utilized for reporting purposes.
Cl — Class
Wedgewood FundMarch 31, 2021 (Unaudited)
3The accompanying notes are an integral part of the financial statements.
0 100
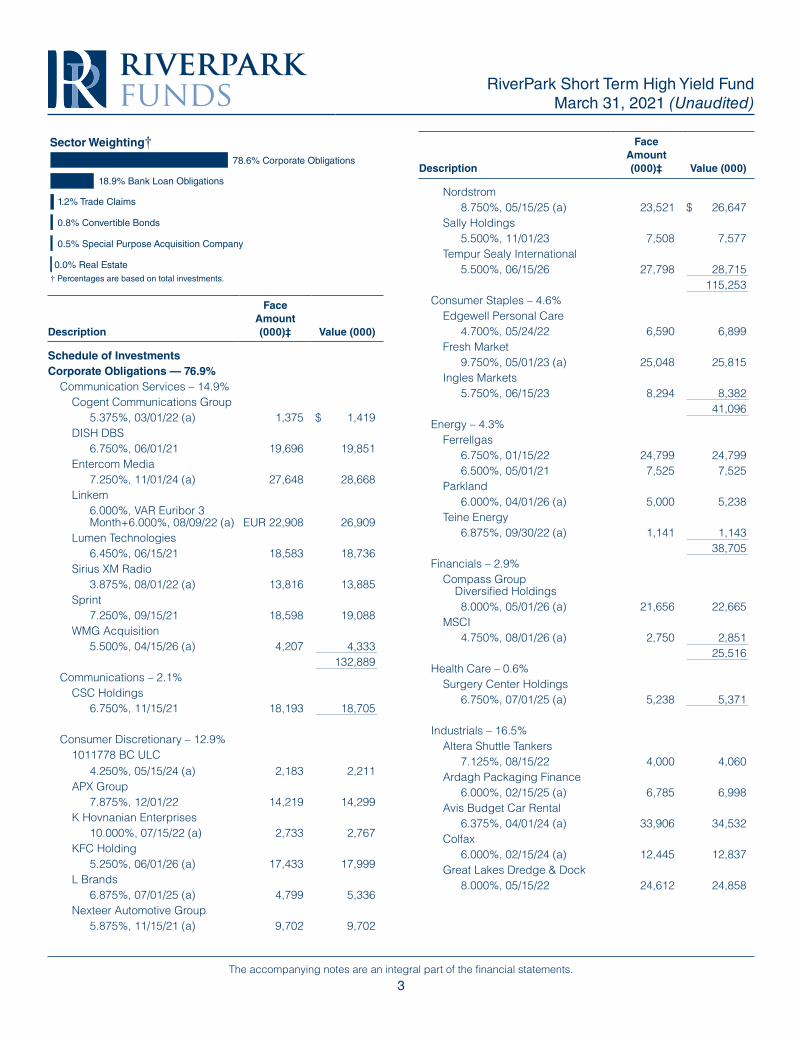
78.6% Corporate Obligations
† Percentages are based on total investments.
18.9% Bank Loan Obligations
1.2% Trade Claims
Sector Weighting†
0.0% Real Estate
0.5% Special Purpose Acquisition Company
0.8% Convertible Bonds
Description
Face Amount (000)‡ Value (000)
Schedule of InvestmentsCorporate Obligations — 76.9%
Communication Services – 14.9%Cogent Communications Group
5.375%, 03/01/22 (a) 1,375 $ 1,419DISH DBS
6.750%, 06/01/21 19,696 19,851Entercom Media
7.250%, 11/01/24 (a) 27,648 28,668Linkem
6.000%, VAR Euribor 3 Month+6.000%, 08/09/22 (a) EUR 22,908 26,909
Lumen Technologies6.450%, 06/15/21 18,583 18,736
Sirius XM Radio3.875%, 08/01/22 (a) 13,816 13,885
Sprint7.250%, 09/15/21 18,598 19,088
WMG Acquisition5.500%, 04/15/26 (a) 4,207 4,333
132,889Communications – 2.1%
CSC Holdings6.750%, 11/15/21 18,193 18,705
Consumer Discretionary – 12.9%1011778 BC ULC
4.250%, 05/15/24 (a) 2,183 2,211APX Group
7.875%, 12/01/22 14,219 14,299K Hovnanian Enterprises
10.000%, 07/15/22 (a) 2,733 2,767KFC Holding
5.250%, 06/01/26 (a) 17,433 17,999L Brands
6.875%, 07/01/25 (a) 4,799 5,336Nexteer Automotive Group
5.875%, 11/15/21 (a) 9,702 9,702
Description
Face Amount (000)‡ Value (000)
Nordstrom8.750%, 05/15/25 (a) 23,521 $ 26,647
Sally Holdings5.500%, 11/01/23 7,508 7,577
Tempur Sealy International5.500%, 06/15/26 27,798 28,715
115,253Consumer Staples – 4.6%
Edgewell Personal Care4.700%, 05/24/22 6,590 6,899
Fresh Market9.750%, 05/01/23 (a) 25,048 25,815
Ingles Markets5.750%, 06/15/23 8,294 8,382
41,096Energy – 4.3%
Ferrellgas6.750%, 01/15/22 24,799 24,7996.500%, 05/01/21 7,525 7,525
Parkland6.000%, 04/01/26 (a) 5,000 5,238
Teine Energy6.875%, 09/30/22 (a) 1,141 1,143
38,705Financials – 2.9%
Compass Group Diversified Holdings8.000%, 05/01/26 (a) 21,656 22,665
MSCI4.750%, 08/01/26 (a) 2,750 2,851
25,516Health Care – 0.6%
Surgery Center Holdings6.750%, 07/01/25 (a) 5,238 5,371
Industrials – 16.5%Altera Shuttle Tankers
7.125%, 08/15/22 4,000 4,060Ardagh Packaging Finance
6.000%, 02/15/25 (a) 6,785 6,998Avis Budget Car Rental
6.375%, 04/01/24 (a) 33,906 34,532Colfax
6.000%, 02/15/24 (a) 12,445 12,837Great Lakes Dredge & Dock
8.000%, 05/15/22 24,612 24,858
RiverPark Short Term High Yield FundMarch 31, 2021 (Unaudited)
4The accompanying notes are an integral part of the financial statements.
Description
Face Amount (000)‡ Value (000)
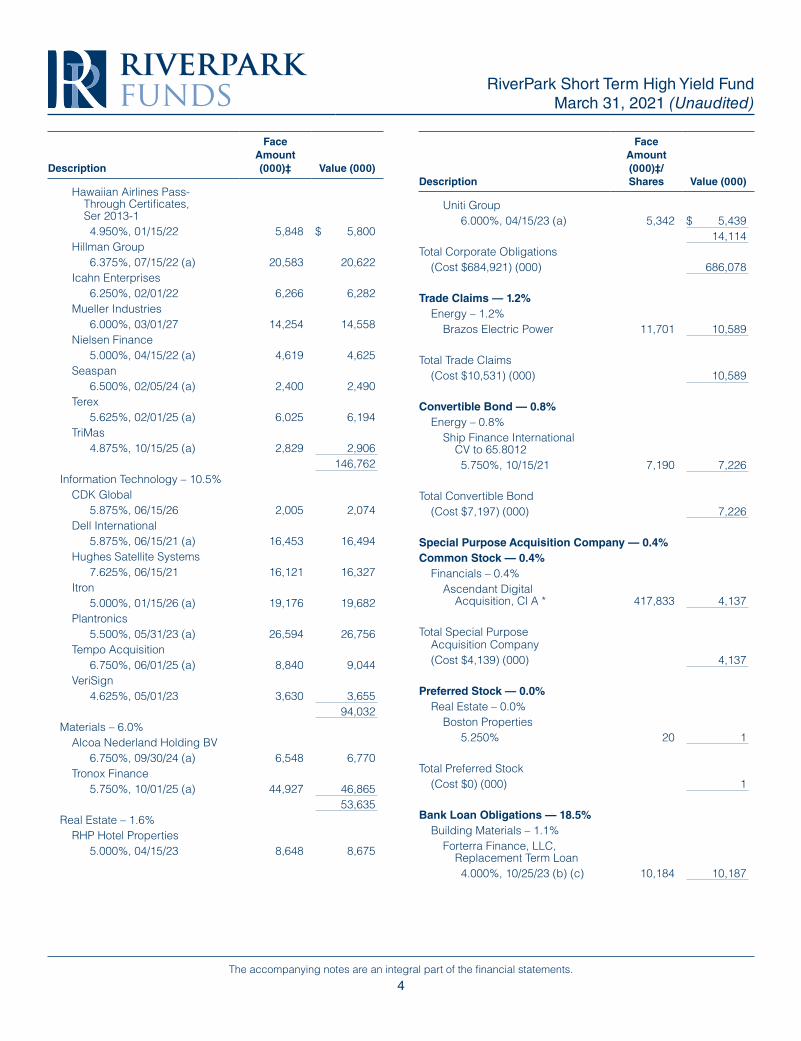
Hawaiian Airlines Pass-Through Certificates, Ser 2013-14.950%, 01/15/22 5,848 $ 5,800
Hillman Group6.375%, 07/15/22 (a) 20,583 20,622
Icahn Enterprises6.250%, 02/01/22 6,266 6,282
Mueller Industries6.000%, 03/01/27 14,254 14,558
Nielsen Finance5.000%, 04/15/22 (a) 4,619 4,625
Seaspan6.500%, 02/05/24 (a) 2,400 2,490
Terex5.625%, 02/01/25 (a) 6,025 6,194
TriMas4.875%, 10/15/25 (a) 2,829 2,906
146,762Information Technology – 10.5%
CDK Global5.875%, 06/15/26 2,005 2,074
Dell International5.875%, 06/15/21 (a) 16,453 16,494
Hughes Satellite Systems7.625%, 06/15/21 16,121 16,327
Itron5.000%, 01/15/26 (a) 19,176 19,682
Plantronics5.500%, 05/31/23 (a) 26,594 26,756
Tempo Acquisition6.750%, 06/01/25 (a) 8,840 9,044
VeriSign4.625%, 05/01/23 3,630 3,655
94,032Materials – 6.0%
Alcoa Nederland Holding BV6.750%, 09/30/24 (a) 6,548 6,770
Tronox Finance5.750%, 10/01/25 (a) 44,927 46,865
53,635Real Estate – 1.6%
RHP Hotel Properties5.000%, 04/15/23 8,648 8,675
Description
Face Amount (000)‡/ Shares Value (000)
Uniti Group6.000%, 04/15/23 (a) 5,342 $ 5,439
14,114Total Corporate Obligations
(Cost $684,921) (000) 686,078
Trade Claims — 1.2%Energy – 1.2%
Brazos Electric Power 11,701 10,589
Total Trade Claims(Cost $10,531) (000) 10,589
Convertible Bond — 0.8%Energy – 0.8%
Ship Finance International CV to 65.80125.750%, 10/15/21 7,190 7,226
Total Convertible Bond(Cost $7,197) (000) 7,226
Special Purpose Acquisition Company — 0.4%Common Stock — 0.4%
Financials – 0.4%Ascendant Digital
Acquisition, Cl A * 417,833 4,137
Total Special Purpose Acquisition Company(Cost $4,139) (000) 4,137
Preferred Stock — 0.0%Real Estate – 0.0%
Boston Properties5.250% 20 1
Total Preferred Stock(Cost $0) (000) 1
Bank Loan Obligations — 18.5%Building Materials – 1.1%
Forterra Finance, LLC, Replacement Term Loan4.000%, 10/25/23 (b) (c) 10,184 10,187
RiverPark Short Term High Yield Fund March 31, 2021 (Unaudited)
5The accompanying notes are an integral part of the financial statements.
Description
Face Amount (000)‡ Value (000)
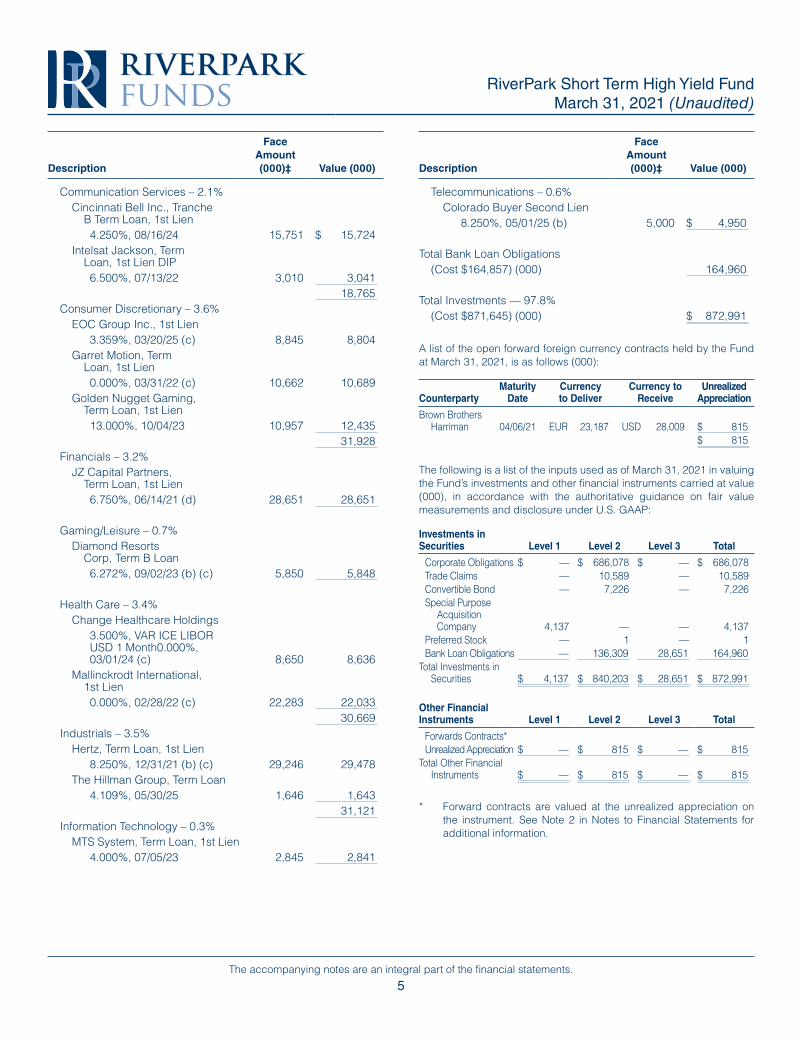
Communication Services – 2.1%Cincinnati Bell Inc., Tranche
B Term Loan, 1st Lien4.250%, 08/16/24 15,751 $ 15,724
Intelsat Jackson, Term Loan, 1st Lien DIP6.500%, 07/13/22 3,010 3,041
18,765Consumer Discretionary – 3.6%
EOC Group Inc., 1st Lien3.359%, 03/20/25 (c) 8,845 8,804
Garret Motion, Term Loan, 1st Lien0.000%, 03/31/22 (c) 10,662 10,689
Golden Nugget Gaming, Term Loan, 1st Lien13.000%, 10/04/23 10,957 12,435
31,928Financials – 3.2%
JZ Capital Partners, Term Loan, 1st Lien6.750%, 06/14/21 (d) 28,651 28,651
Gaming/Leisure – 0.7%Diamond Resorts
Corp, Term B Loan6.272%, 09/02/23 (b) (c) 5,850 5,848
Health Care – 3.4%Change Healthcare Holdings
3.500%, VAR ICE LIBOR USD 1 Month0.000%, 03/01/24 (c) 8,650 8,636
Mallinckrodt International, 1st Lien0.000%, 02/28/22 (c) 22,283 22,033
30,669Industrials – 3.5%
Hertz, Term Loan, 1st Lien8.250%, 12/31/21 (b) (c) 29,246 29,478
The Hillman Group, Term Loan4.109%, 05/30/25 1,646 1,643
31,121Information Technology – 0.3%
MTS System, Term Loan, 1st Lien4.000%, 07/05/23 2,845 2,841
Description
Face Amount (000)‡ Value (000)
Telecommunications – 0.6%Colorado Buyer Second Lien
8.250%, 05/01/25 (b) 5,000 $ 4,950
Total Bank Loan Obligations(Cost $164,857) (000) 164,960
Total Investments — 97.8%(Cost $871,645) (000) $ 872,991
A list of the open forward foreign currency contracts held by the Fund at March 31, 2021, is as follows (000):
CounterpartyMaturity
DateCurrency to Deliver
Currency to Receive
Unrealized Appreciation
Brown Brothers Harriman 04/06/21 EUR 23,187 USD 28,009 $ 815
$ 815
The following is a list of the inputs used as of March 31, 2021 in valuing the Fund’s investments and other financial instruments carried at value (000), in accordance with the authoritative guidance on fair value measurements and disclosure under U.S. GAAP:
Investments in Securities Level 1 Level 2 Level 3 Total
Corporate Obligations $ — $ 686,078 $ — $ 686,078Trade Claims — 10,589 — 10,589Convertible Bond — 7,226 — 7,226Special Purpose
Acquisition Company 4,137 — — 4,137
Preferred Stock — 1 — 1Bank Loan Obligations — 136,309 28,651 164,960
Total Investments in Securities $ 4,137 $ 840,203 $ 28,651 $ 872,991
Other Financial Instruments Level 1 Level 2 Level 3 Total
Forwards Contracts*Unrealized Appreciation $ — $ 815 $ — $ 815
Total Other Financial Instruments $ — $ 815 $ — $ 815
* Forward contracts are valued at the unrealized appreciation on the instrument. See Note 2 in Notes to Financial Statements for additional information.
RiverPark Short Term High Yield Fund March 31, 2021 (Unaudited)
6The accompanying notes are an integral part of the financial statements.
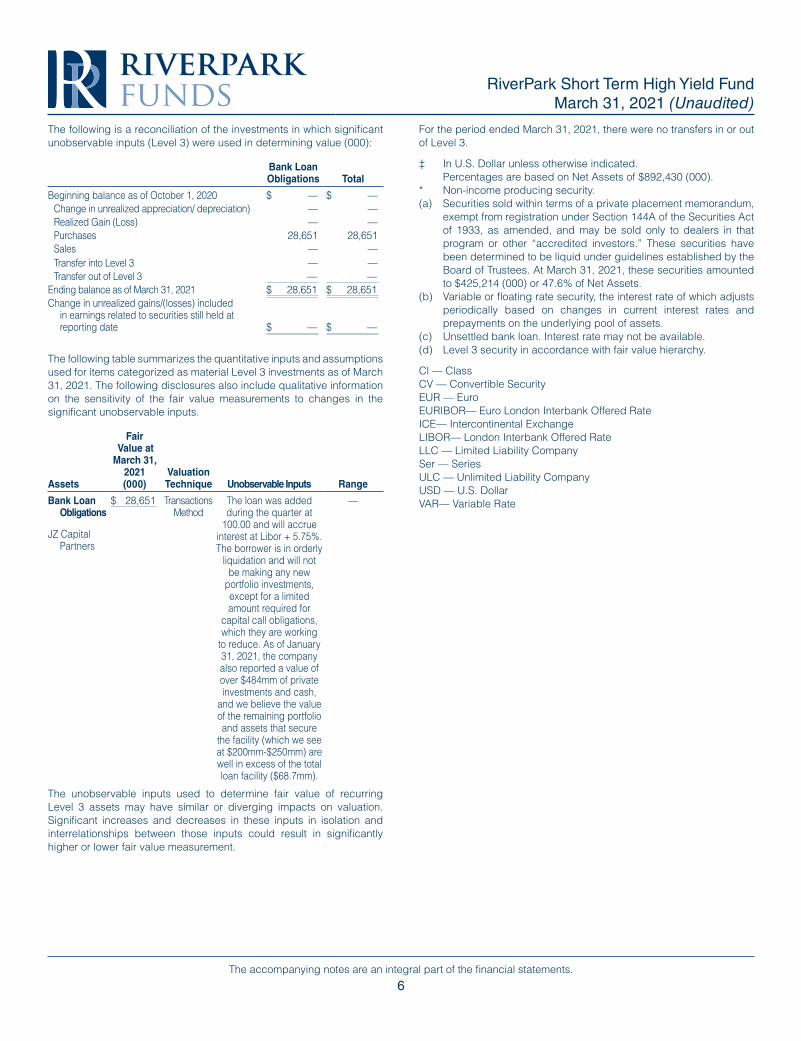
The following is a reconciliation of the investments in which significant unobservable inputs (Level 3) were used in determining value (000):
Bank Loan Obligations Total
Beginning balance as of October 1, 2020 $ — $ — Change in unrealized appreciation/ depreciation) — — Realized Gain (Loss) — — Purchases 28,651 28,651 Sales — — Transfer into Level 3 — — Transfer out of Level 3 — —
Ending balance as of March 31, 2021 $ 28,651 $ 28,651 Change in unrealized gains/(losses) included
in earnings related to securities still held at reporting date $ — $ —
The following table summarizes the quantitative inputs and assumptions used for items categorized as material Level 3 investments as of March 31, 2021. The following disclosures also include qualitative information on the sensitivity of the fair value measurements to changes in the significant unobservable inputs.
Assets
Fair Value at
March 31, 2021 (000)
Valuation Technique Unobservable Inputs Range
Bank Loan Obligations
JZ Capital Partners
$ 28,651 Transactions Method
The loan was added during the quarter at
100.00 and will accrue interest at Libor + 5.75%. The borrower is in orderly
liquidation and will not be making any new
portfolio investments, except for a limited amount required for
capital call obligations, which they are working
to reduce. As of January 31, 2021, the company also reported a value of over $484mm of private investments and cash,
and we believe the value of the remaining portfolio and assets that secure
the facility (which we see at $200mm-$250mm) are well in excess of the total loan facility ($68.7mm).
—
The unobservable inputs used to determine fair value of recurring Level 3 assets may have similar or diverging impacts on valuation. Significant increases and decreases in these inputs in isolation and interrelationships between those inputs could result in significantly higher or lower fair value measurement.
For the period ended March 31, 2021, there were no transfers in or out of Level 3.
‡ In U.S. Dollar unless otherwise indicated. Percentages are based on Net Assets of $892,430 (000).* Non-income producing security.(a) Securities sold within terms of a private placement memorandum,
exempt from registration under Section 144A of the Securities Act of 1933, as amended, and may be sold only to dealers in that program or other “accredited investors.” These securities have been determined to be liquid under guidelines established by the Board of Trustees. At March 31, 2021, these securities amounted to $425,214 (000) or 47.6% of Net Assets.
(b) Variable or floating rate security, the interest rate of which adjusts periodically based on changes in current interest rates and prepayments on the underlying pool of assets.
(c) Unsettled bank loan. Interest rate may not be available.(d) Level 3 security in accordance with fair value hierarchy.
Cl — ClassCV — Convertible SecurityEUR — EuroEURIBOR— Euro London Interbank Offered RateICE— Intercontinental ExchangeLIBOR— London Interbank Offered RateLLC — Limited Liability CompanySer — SeriesULC — Unlimited Liability CompanyUSD — U.S. DollarVAR— Variable Rate
RiverPark Short Term High Yield Fund March 31, 2021 (Unaudited)
7The accompanying notes are an integral part of the financial statements.
0 75
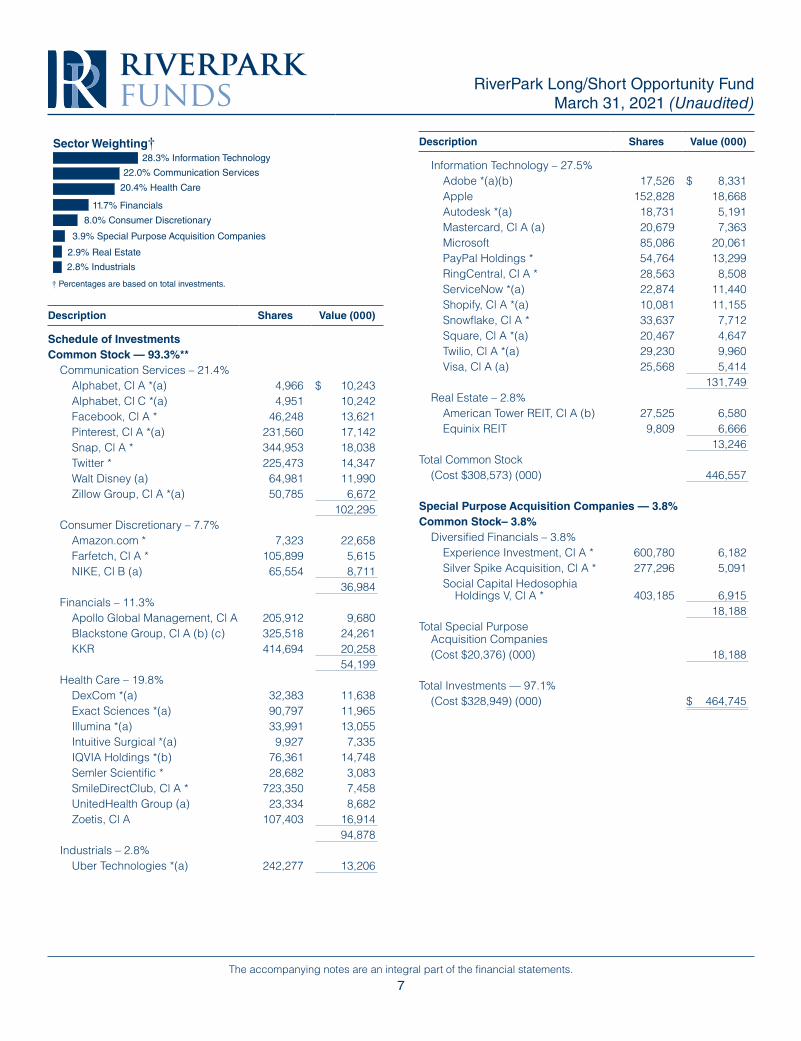
28.3% Information TechnologySector Weighting†
† Percentages are based on total investments.
22.0% Communication Services
8.0% Consumer Discretionary
20.4% Health Care
2.9% Real Estate
11.7% Financials
2.8% Industrials
3.9% Special Purpose Acquisition Companies
Description Shares Value (000)
Schedule of InvestmentsCommon Stock — 93.3%**
Communication Services – 21.4%Alphabet, Cl A *(a) 4,966 $ 10,243Alphabet, Cl C *(a) 4,951 10,242Facebook, Cl A * 46,248 13,621Pinterest, Cl A *(a) 231,560 17,142Snap, Cl A * 344,953 18,038Twitter * 225,473 14,347Walt Disney (a) 64,981 11,990Zillow Group, Cl A *(a) 50,785 6,672
102,295Consumer Discretionary – 7.7%
Amazon.com * 7,323 22,658Farfetch, Cl A * 105,899 5,615NIKE, Cl B (a) 65,554 8,711
36,984Financials – 11.3%
Apollo Global Management, Cl A 205,912 9,680Blackstone Group, Cl A (b) (c) 325,518 24,261KKR 414,694 20,258
54,199Health Care – 19.8%
DexCom *(a) 32,383 11,638Exact Sciences *(a) 90,797 11,965Illumina *(a) 33,991 13,055Intuitive Surgical *(a) 9,927 7,335IQVIA Holdings *(b) 76,361 14,748Semler Scientific * 28,682 3,083SmileDirectClub, Cl A * 723,350 7,458UnitedHealth Group (a) 23,334 8,682Zoetis, Cl A 107,403 16,914
94,878Industrials – 2.8%
Uber Technologies *(a) 242,277 13,206
Description Shares Value (000)
Information Technology – 27.5%Adobe *(a)(b) 17,526 $ 8,331Apple 152,828 18,668Autodesk *(a) 18,731 5,191Mastercard, Cl A (a) 20,679 7,363Microsoft 85,086 20,061PayPal Holdings * 54,764 13,299RingCentral, Cl A * 28,563 8,508ServiceNow *(a) 22,874 11,440Shopify, Cl A *(a) 10,081 11,155Snowflake, Cl A * 33,637 7,712Square, Cl A *(a) 20,467 4,647Twilio, Cl A *(a) 29,230 9,960Visa, Cl A (a) 25,568 5,414
131,749Real Estate – 2.8%
American Tower REIT, Cl A (b) 27,525 6,580Equinix REIT 9,809 6,666
13,246Total Common Stock
(Cost $308,573) (000) 446,557
Special Purpose Acquisition Companies — 3.8%Common Stock– 3.8%
Diversified Financials – 3.8%Experience Investment, Cl A * 600,780 6,182Silver Spike Acquisition, Cl A * 277,296 5,091Social Capital Hedosophia
Holdings V, Cl A * 403,185 6,91518,188
Total Special Purpose Acquisition Companies(Cost $20,376) (000) 18,188
Total Investments — 97.1%(Cost $328,949) (000) $ 464,745
RiverPark Long/Short Opportunity FundMarch 31, 2021 (Unaudited)
8The accompanying notes are an integral part of the financial statements.
RiverPark Long/Short Opportunity Fund March 31, 2021 (Unaudited)
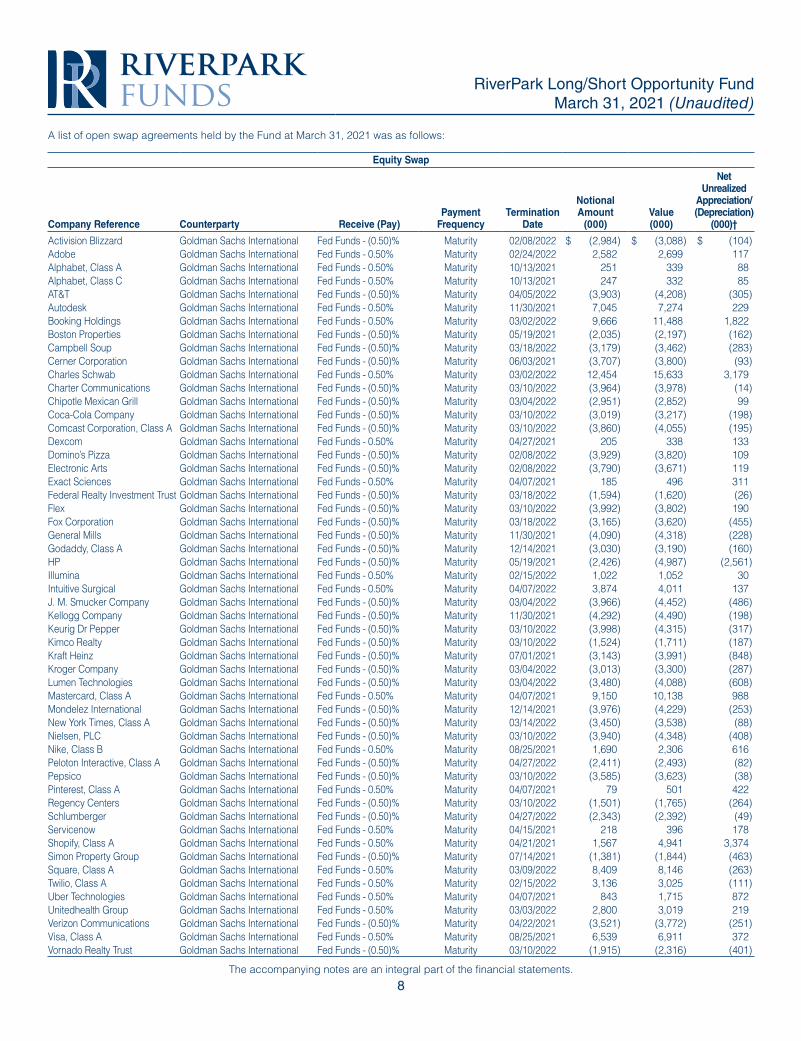
A list of open swap agreements held by the Fund at March 31, 2021 was as follows:
Equity Swap
Company Reference Counterparty Receive (Pay) Payment
FrequencyTermination
Date
Notional Amount
(000)Value (000)
Net Unrealized
Appreciation/ (Depreciation)
(000)†
Activision Blizzard Goldman Sachs International Fed Funds - (0.50)% Maturity 02/08/2022 $ (2,984) $ (3,088) $ (104)Adobe Goldman Sachs International Fed Funds - 0.50% Maturity 02/24/2022 2,582 2,699 117Alphabet, Class A Goldman Sachs International Fed Funds - 0.50% Maturity 10/13/2021 251 339 88Alphabet, Class C Goldman Sachs International Fed Funds - 0.50% Maturity 10/13/2021 247 332 85AT&T Goldman Sachs International Fed Funds - (0.50)% Maturity 04/05/2022 (3,903) (4,208) (305)Autodesk Goldman Sachs International Fed Funds - 0.50% Maturity 11/30/2021 7,045 7,274 229Booking Holdings Goldman Sachs International Fed Funds - 0.50% Maturity 03/02/2022 9,666 11,488 1,822Boston Properties Goldman Sachs International Fed Funds - (0.50)% Maturity 05/19/2021 (2,035) (2,197) (162)Campbell Soup Goldman Sachs International Fed Funds - (0.50)% Maturity 03/18/2022 (3,179) (3,462) (283)Cerner Corporation Goldman Sachs International Fed Funds - (0.50)% Maturity 06/03/2021 (3,707) (3,800) (93)Charles Schwab Goldman Sachs International Fed Funds - 0.50% Maturity 03/02/2022 12,454 15,633 3,179Charter Communications Goldman Sachs International Fed Funds - (0.50)% Maturity 03/10/2022 (3,964) (3,978) (14)Chipotle Mexican Grill Goldman Sachs International Fed Funds - (0.50)% Maturity 03/04/2022 (2,951) (2,852) 99Coca-Cola Company Goldman Sachs International Fed Funds - (0.50)% Maturity 03/10/2022 (3,019) (3,217) (198)Comcast Corporation, Class A Goldman Sachs International Fed Funds - (0.50)% Maturity 03/10/2022 (3,860) (4,055) (195)Dexcom Goldman Sachs International Fed Funds - 0.50% Maturity 04/27/2021 205 338 133Domino’s Pizza Goldman Sachs International Fed Funds - (0.50)% Maturity 02/08/2022 (3,929) (3,820) 109Electronic Arts Goldman Sachs International Fed Funds - (0.50)% Maturity 02/08/2022 (3,790) (3,671) 119Exact Sciences Goldman Sachs International Fed Funds - 0.50% Maturity 04/07/2021 185 496 311Federal Realty Investment Trust Goldman Sachs International Fed Funds - (0.50)% Maturity 03/18/2022 (1,594) (1,620) (26)Flex Goldman Sachs International Fed Funds - (0.50)% Maturity 03/10/2022 (3,992) (3,802) 190Fox Corporation Goldman Sachs International Fed Funds - (0.50)% Maturity 03/18/2022 (3,165) (3,620) (455)General Mills Goldman Sachs International Fed Funds - (0.50)% Maturity 11/30/2021 (4,090) (4,318) (228)Godaddy, Class A Goldman Sachs International Fed Funds - (0.50)% Maturity 12/14/2021 (3,030) (3,190) (160)HP Goldman Sachs International Fed Funds - (0.50)% Maturity 05/19/2021 (2,426) (4,987) (2,561)Illumina Goldman Sachs International Fed Funds - 0.50% Maturity 02/15/2022 1,022 1,052 30Intuitive Surgical Goldman Sachs International Fed Funds - 0.50% Maturity 04/07/2022 3,874 4,011 137J. M. Smucker Company Goldman Sachs International Fed Funds - (0.50)% Maturity 03/04/2022 (3,966) (4,452) (486)Kellogg Company Goldman Sachs International Fed Funds - (0.50)% Maturity 11/30/2021 (4,292) (4,490) (198)Keurig Dr Pepper Goldman Sachs International Fed Funds - (0.50)% Maturity 03/10/2022 (3,998) (4,315) (317)Kimco Realty Goldman Sachs International Fed Funds - (0.50)% Maturity 03/10/2022 (1,524) (1,711) (187)Kraft Heinz Goldman Sachs International Fed Funds - (0.50)% Maturity 07/01/2021 (3,143) (3,991) (848)Kroger Company Goldman Sachs International Fed Funds - (0.50)% Maturity 03/04/2022 (3,013) (3,300) (287)Lumen Technologies Goldman Sachs International Fed Funds - (0.50)% Maturity 03/04/2022 (3,480) (4,088) (608)Mastercard, Class A Goldman Sachs International Fed Funds - 0.50% Maturity 04/07/2021 9,150 10,138 988Mondelez International Goldman Sachs International Fed Funds - (0.50)% Maturity 12/14/2021 (3,976) (4,229) (253)New York Times, Class A Goldman Sachs International Fed Funds - (0.50)% Maturity 03/14/2022 (3,450) (3,538) (88)Nielsen, PLC Goldman Sachs International Fed Funds - (0.50)% Maturity 03/10/2022 (3,940) (4,348) (408)Nike, Class B Goldman Sachs International Fed Funds - 0.50% Maturity 08/25/2021 1,690 2,306 616Peloton Interactive, Class A Goldman Sachs International Fed Funds - (0.50)% Maturity 04/27/2022 (2,411) (2,493) (82)Pepsico Goldman Sachs International Fed Funds - (0.50)% Maturity 03/10/2022 (3,585) (3,623) (38)Pinterest, Class A Goldman Sachs International Fed Funds - 0.50% Maturity 04/07/2021 79 501 422Regency Centers Goldman Sachs International Fed Funds - (0.50)% Maturity 03/10/2022 (1,501) (1,765) (264)Schlumberger Goldman Sachs International Fed Funds - (0.50)% Maturity 04/27/2022 (2,343) (2,392) (49)Servicenow Goldman Sachs International Fed Funds - 0.50% Maturity 04/15/2021 218 396 178Shopify, Class A Goldman Sachs International Fed Funds - 0.50% Maturity 04/21/2021 1,567 4,941 3,374Simon Property Group Goldman Sachs International Fed Funds - (0.50)% Maturity 07/14/2021 (1,381) (1,844) (463)Square, Class A Goldman Sachs International Fed Funds - 0.50% Maturity 03/09/2022 8,409 8,146 (263)Twilio, Class A Goldman Sachs International Fed Funds - 0.50% Maturity 02/15/2022 3,136 3,025 (111)Uber Technologies Goldman Sachs International Fed Funds - 0.50% Maturity 04/07/2021 843 1,715 872Unitedhealth Group Goldman Sachs International Fed Funds - 0.50% Maturity 03/03/2022 2,800 3,019 219Verizon Communications Goldman Sachs International Fed Funds - (0.50)% Maturity 04/22/2021 (3,521) (3,772) (251)Visa, Class A Goldman Sachs International Fed Funds - 0.50% Maturity 08/25/2021 6,539 6,911 372Vornado Realty Trust Goldman Sachs International Fed Funds - (0.50)% Maturity 03/10/2022 (1,915) (2,316) (401)
9The accompanying notes are an integral part of the financial statements.
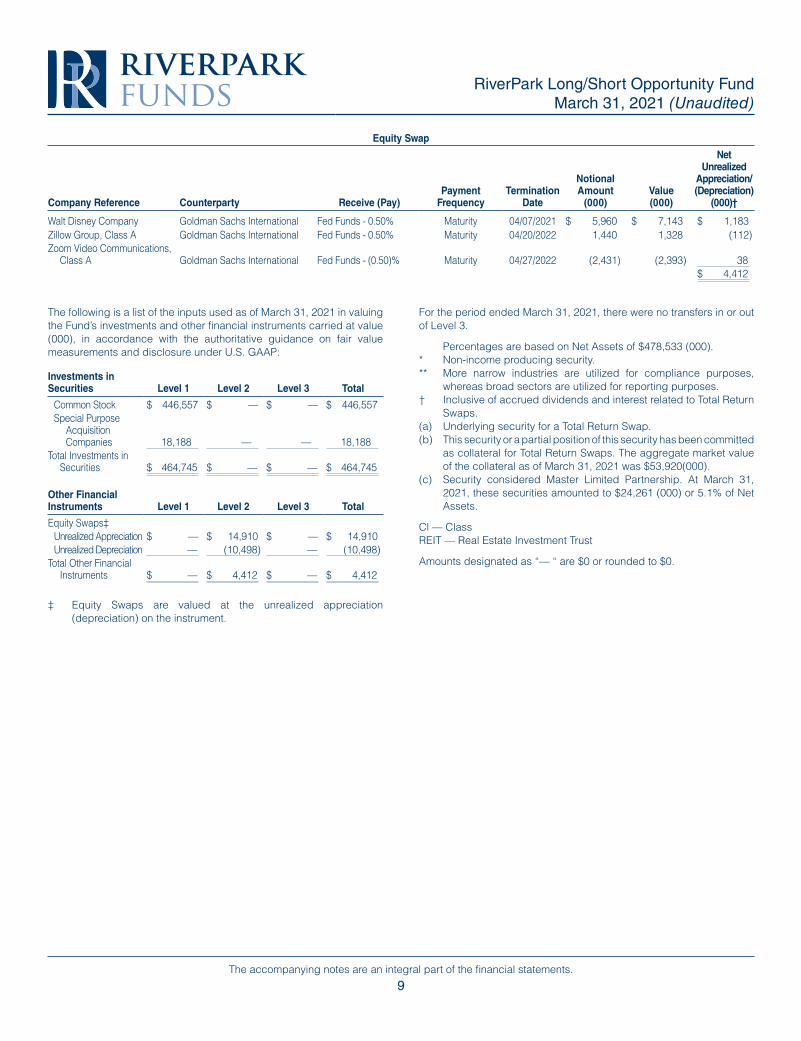
Equity Swap
Company Reference Counterparty Receive (Pay) Payment
FrequencyTermination
Date
Notional Amount
(000)Value (000)
Net Unrealized
Appreciation/ (Depreciation)
(000)†
Walt Disney Company Goldman Sachs International Fed Funds - 0.50% Maturity 04/07/2021 $ 5,960 $ 7,143 $ 1,183Zillow Group, Class A Goldman Sachs International Fed Funds - 0.50% Maturity 04/20/2022 1,440 1,328 (112)Zoom Video Communications,
Class A Goldman Sachs International Fed Funds - (0.50)% Maturity 04/27/2022 (2,431) (2,393) 38$ 4,412
RiverPark Long/Short Opportunity Fund March 31, 2021 (Unaudited)
The following is a list of the inputs used as of March 31, 2021 in valuing the Fund’s investments and other financial instruments carried at value (000), in accordance with the authoritative guidance on fair value measurements and disclosure under U.S. GAAP:
Investments in Securities Level 1 Level 2 Level 3 Total
Common Stock $ 446,557 $ — $ — $ 446,557Special Purpose
Acquisition Companies 18,188 — — 18,188
Total Investments in Securities $ 464,745 $ — $ — $ 464,745
Other Financial Instruments Level 1 Level 2 Level 3 Total
Equity Swaps‡Unrealized Appreciation $ — $ 14,910 $ — $ 14,910Unrealized Depreciation — (10,498) — (10,498)
Total Other Financial Instruments $ — $ 4,412 $ — $ 4,412
‡ Equity Swaps are valued at the unrealized appreciation (depreciation) on the instrument.
For the period ended March 31, 2021, there were no transfers in or out of Level 3.
Percentages are based on Net Assets of $478,533 (000).* Non-income producing security.** More narrow industries are utilized for compliance purposes,
whereas broad sectors are utilized for reporting purposes.† Inclusive of accrued dividends and interest related to Total Return
Swaps.(a) Underlying security for a Total Return Swap.(b) This security or a partial position of this security has been committed
as collateral for Total Return Swaps. The aggregate market value of the collateral as of March 31, 2021 was $53,920(000).
(c) Security considered Master Limited Partnership. At March 31, 2021, these securities amounted to $24,261 (000) or 5.1% of Net Assets.
Cl — ClassREIT — Real Estate Investment Trust
Amounts designated as “— “ are $0 or rounded to $0.
10The accompanying notes are an integral part of the financial statements.
RiverPark Strategic Income FundMarch 31, 2021 (Unaudited)
0 100
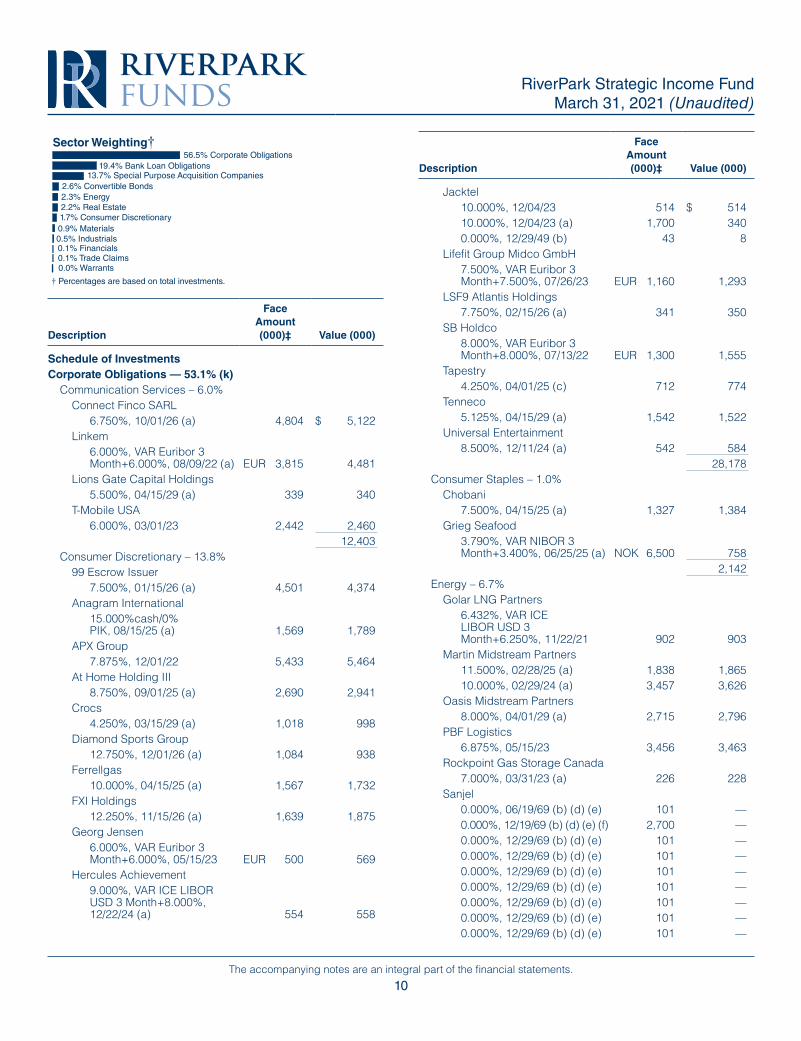
56.5% Corporate ObligationsSector Weighting†
† Percentages are based on total investments.
1.7% Consumer Discretionary
2.6% Convertible Bonds
2.2% Real Estate
0.5% Industrials0.9% Materials
2.3% Energy
0.1% Trade Claims0.0% Warrants
13.7% Special Purpose Acquisition Companies
0.1% Financials
19.4% Bank Loan Obligations
Description
Face Amount (000)‡ Value (000)
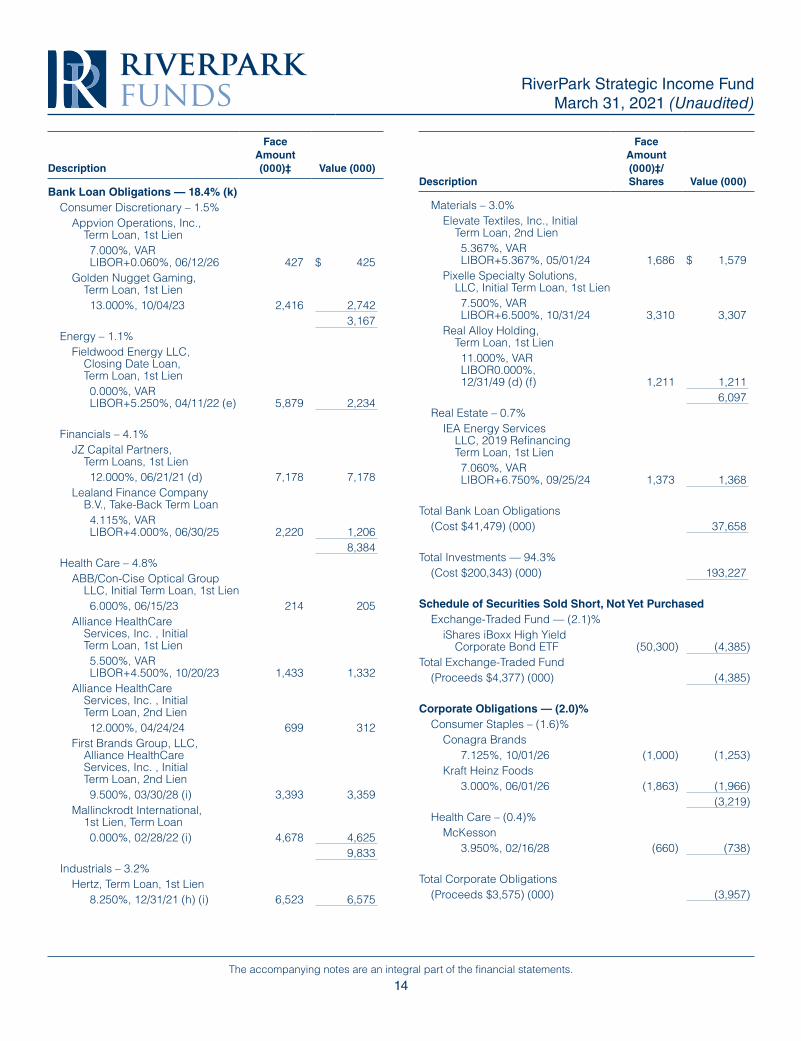
Schedule of InvestmentsCorporate Obligations — 53.1% (k)
Communication Services – 6.0%Connect Finco SARL
6.750%, 10/01/26 (a) 4,804 $ 5,122Linkem
6.000%, VAR Euribor 3 Month+6.000%, 08/09/22 (a) EUR 3,815 4,481
Lions Gate Capital Holdings5.500%, 04/15/29 (a) 339 340
T-Mobile USA6.000%, 03/01/23 2,442 2,460
12,403Consumer Discretionary – 13.8%
99 Escrow Issuer7.500%, 01/15/26 (a) 4,501 4,374
Anagram International15.000%cash/0% PIK, 08/15/25 (a) 1,569 1,789
APX Group7.875%, 12/01/22 5,433 5,464
At Home Holding III8.750%, 09/01/25 (a) 2,690 2,941
Crocs4.250%, 03/15/29 (a) 1,018 998
Diamond Sports Group12.750%, 12/01/26 (a) 1,084 938
Ferrellgas10.000%, 04/15/25 (a) 1,567 1,732
FXI Holdings12.250%, 11/15/26 (a) 1,639 1,875
Georg Jensen6.000%, VAR Euribor 3 Month+6.000%, 05/15/23 EUR 500 569
Hercules Achievement9.000%, VAR ICE LIBOR USD 3 Month+8.000%, 12/22/24 (a) 554 558
Description
Face Amount (000)‡ Value (000)
Jacktel10.000%, 12/04/23 514 $ 51410.000%, 12/04/23 (a) 1,700 3400.000%, 12/29/49 (b) 43 8
Lifefit Group Midco GmbH7.500%, VAR Euribor 3 Month+7.500%, 07/26/23 EUR 1,160 1,293
LSF9 Atlantis Holdings7.750%, 02/15/26 (a) 341 350
SB Holdco8.000%, VAR Euribor 3 Month+8.000%, 07/13/22 EUR 1,300 1,555
Tapestry4.250%, 04/01/25 (c) 712 774
Tenneco5.125%, 04/15/29 (a) 1,542 1,522
Universal Entertainment8.500%, 12/11/24 (a) 542 584
28,178Consumer Staples – 1.0%
Chobani7.500%, 04/15/25 (a) 1,327 1,384
Grieg Seafood3.790%, VAR NIBOR 3 Month+3.400%, 06/25/25 (a) NOK 6,500 758
2,142Energy – 6.7%
Golar LNG Partners6.432%, VAR ICE LIBOR USD 3 Month+6.250%, 11/22/21 902 903
Martin Midstream Partners11.500%, 02/28/25 (a) 1,838 1,86510.000%, 02/29/24 (a) 3,457 3,626
Oasis Midstream Partners8.000%, 04/01/29 (a) 2,715 2,796
PBF Logistics6.875%, 05/15/23 3,456 3,463
Rockpoint Gas Storage Canada7.000%, 03/31/23 (a) 226 228
Sanjel0.000%, 06/19/69 (b) (d) (e) 101 —0.000%, 12/19/69 (b) (d) (e) (f) 2,700 —0.000%, 12/29/69 (b) (d) (e) 101 —0.000%, 12/29/69 (b) (d) (e) 101 —0.000%, 12/29/69 (b) (d) (e) 101 —0.000%, 12/29/69 (b) (d) (e) 101 —0.000%, 12/29/69 (b) (d) (e) 101 —0.000%, 12/29/69 (b) (d) (e) 101 —0.000%, 12/29/69 (b) (d) (e) 101 —
11The accompanying notes are an integral part of the financial statements.
Description
Face Amount (000)‡ Value (000)
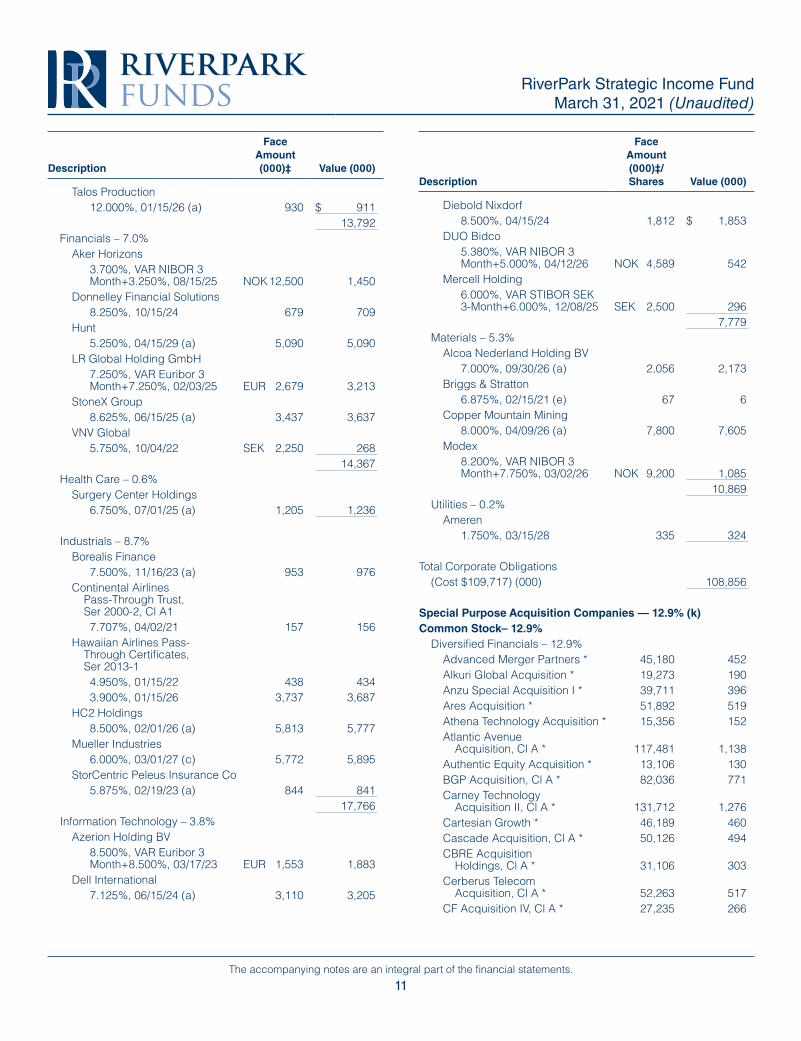
Talos Production12.000%, 01/15/26 (a) 930 $ 911
13,792Financials – 7.0%
Aker Horizons3.700%, VAR NIBOR 3 Month+3.250%, 08/15/25 NOK 12,500 1,450
Donnelley Financial Solutions8.250%, 10/15/24 679 709
Hunt5.250%, 04/15/29 (a) 5,090 5,090
LR Global Holding GmbH7.250%, VAR Euribor 3 Month+7.250%, 02/03/25 EUR 2,679 3,213
StoneX Group8.625%, 06/15/25 (a) 3,437 3,637
VNV Global5.750%, 10/04/22 SEK 2,250 268
14,367Health Care – 0.6%
Surgery Center Holdings6.750%, 07/01/25 (a) 1,205 1,236
Industrials – 8.7%Borealis Finance
7.500%, 11/16/23 (a) 953 976Continental Airlines
Pass-Through Trust, Ser 2000-2, Cl A17.707%, 04/02/21 157 156
Hawaiian Airlines Pass-Through Certificates, Ser 2013-14.950%, 01/15/22 438 4343.900%, 01/15/26 3,737 3,687
HC2 Holdings8.500%, 02/01/26 (a) 5,813 5,777
Mueller Industries6.000%, 03/01/27 (c) 5,772 5,895
StorCentric Peleus Insurance Co5.875%, 02/19/23 (a) 844 841
17,766Information Technology – 3.8%
Azerion Holding BV8.500%, VAR Euribor 3 Month+8.500%, 03/17/23 EUR 1,553 1,883
Dell International7.125%, 06/15/24 (a) 3,110 3,205
Description
Face Amount (000)‡/ Shares Value (000)
Diebold Nixdorf8.500%, 04/15/24 1,812 $ 1,853
DUO Bidco5.380%, VAR NIBOR 3 Month+5.000%, 04/12/26 NOK 4,589 542
Mercell Holding6.000%, VAR STIBOR SEK 3-Month+6.000%, 12/08/25 SEK 2,500 296
7,779Materials – 5.3%
Alcoa Nederland Holding BV7.000%, 09/30/26 (a) 2,056 2,173
Briggs & Stratton6.875%, 02/15/21 (e) 67 6
Copper Mountain Mining8.000%, 04/09/26 (a) 7,800 7,605
Modex8.200%, VAR NIBOR 3 Month+7.750%, 03/02/26 NOK 9,200 1,085
10,869Utilities – 0.2%
Ameren1.750%, 03/15/28 335 324
Total Corporate Obligations(Cost $109,717) (000) 108,856
Special Purpose Acquisition Companies — 12.9% (k)Common Stock– 12.9%
Diversified Financials – 12.9%Advanced Merger Partners * 45,180 452Alkuri Global Acquisition * 19,273 190Anzu Special Acquisition I * 39,711 396Ares Acquisition * 51,892 519Athena Technology Acquisition * 15,356 152Atlantic Avenue
Acquisition, Cl A * 117,481 1,138Authentic Equity Acquisition * 13,106 130BGP Acquisition, Cl A * 82,036 771Carney Technology
Acquisition II, Cl A * 131,712 1,276Cartesian Growth * 46,189 460Cascade Acquisition, Cl A * 50,126 494CBRE Acquisition
Holdings, Cl A * 31,106 303Cerberus Telecom
Acquisition, Cl A * 52,263 517CF Acquisition IV, Cl A * 27,235 266
RiverPark Strategic Income Fund March 31, 2021 (Unaudited)
12The accompanying notes are an integral part of the financial statements.
Description Shares Value (000)
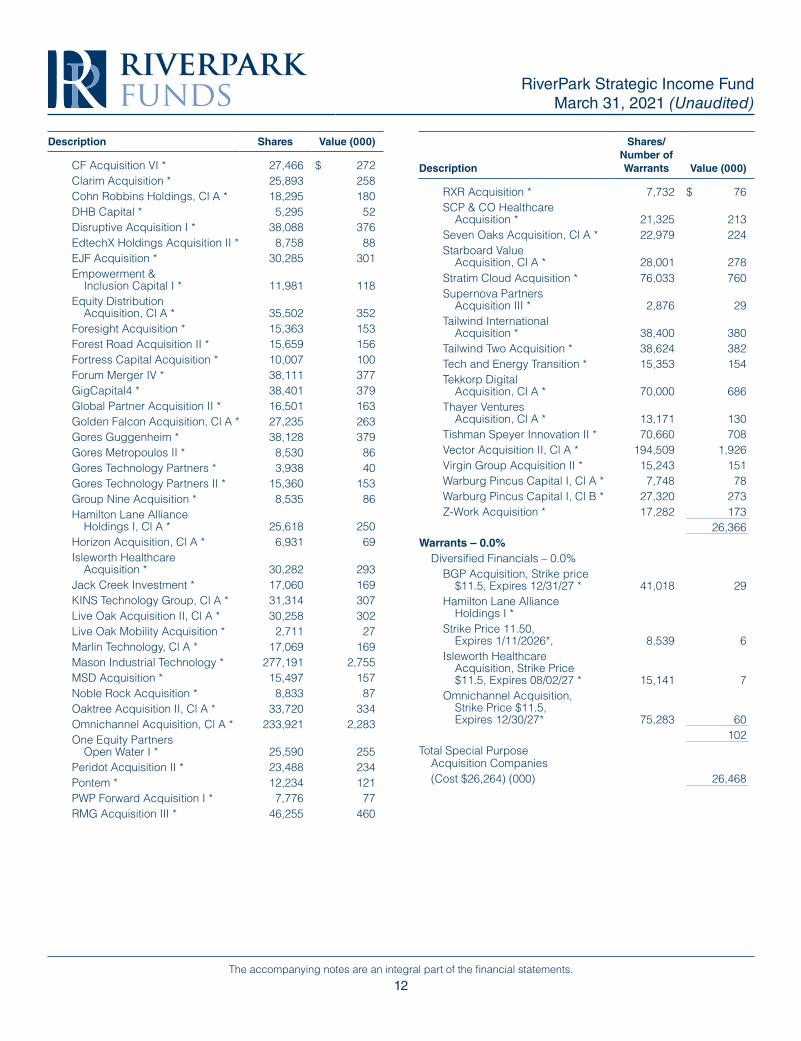
CF Acquisition VI * 27,466 $ 272Clarim Acquisition * 25,893 258Cohn Robbins Holdings, Cl A * 18,295 180DHB Capital * 5,295 52Disruptive Acquisition I * 38,088 376EdtechX Holdings Acquisition II * 8,758 88EJF Acquisition * 30,285 301Empowerment &
Inclusion Capital I * 11,981 118Equity Distribution
Acquisition, Cl A * 35,502 352Foresight Acquisition * 15,363 153Forest Road Acquisition II * 15,659 156Fortress Capital Acquisition * 10,007 100Forum Merger IV * 38,111 377GigCapital4 * 38,401 379Global Partner Acquisition II * 16,501 163Golden Falcon Acquisition, Cl A * 27,235 263Gores Guggenheim * 38,128 379Gores Metropoulos II * 8,530 86Gores Technology Partners * 3,938 40Gores Technology Partners II * 15,360 153Group Nine Acquisition * 8,535 86Hamilton Lane Alliance
Holdings I, Cl A * 25,618 250Horizon Acquisition, Cl A * 6,931 69Isleworth Healthcare
Acquisition * 30,282 293Jack Creek Investment * 17,060 169KINS Technology Group, Cl A * 31,314 307Live Oak Acquisition II, Cl A * 30,258 302Live Oak Mobility Acquisition * 2,711 27Marlin Technology, Cl A * 17,069 169Mason Industrial Technology * 277,191 2,755MSD Acquisition * 15,497 157Noble Rock Acquisition * 8,833 87Oaktree Acquisition II, Cl A * 33,720 334Omnichannel Acquisition, Cl A * 233,921 2,283One Equity Partners
Open Water I * 25,590 255Peridot Acquisition II * 23,488 234Pontem * 12,234 121PWP Forward Acquisition I * 7,776 77RMG Acquisition III * 46,255 460
Description
Shares/Number of Warrants Value (000)
RXR Acquisition * 7,732 $ 76SCP & CO Healthcare
Acquisition * 21,325 213Seven Oaks Acquisition, Cl A * 22,979 224Starboard Value
Acquisition, Cl A * 28,001 278Stratim Cloud Acquisition * 76,033 760Supernova Partners
Acquisition III * 2,876 29Tailwind International
Acquisition * 38,400 380Tailwind Two Acquisition * 38,624 382Tech and Energy Transition * 15,353 154Tekkorp Digital
Acquisition, Cl A * 70,000 686Thayer Ventures
Acquisition, Cl A * 13,171 130Tishman Speyer Innovation II * 70,660 708Vector Acquisition II, Cl A * 194,509 1,926Virgin Group Acquisition II * 15,243 151Warburg Pincus Capital I, Cl A * 7,748 78Warburg Pincus Capital I, Cl B * 27,320 273Z-Work Acquisition * 17,282 173
26,366Warrants – 0.0%
Diversified Financials – 0.0%BGP Acquisition, Strike price
$11.5, Expires 12/31/27 * 41,018 29Hamilton Lane Alliance
Holdings I *Strike Price 11.50,
Expires 1/11/2026*, 8,539 6Isleworth Healthcare
Acquisition, Strike Price $11.5, Expires 08/02/27 * 15,141 7
Omnichannel Acquisition, Strike Price $11.5, Expires 12/30/27* 75,283 60
102Total Special Purpose
Acquisition Companies(Cost $26,264) (000) 26,468
RiverPark Strategic Income Fund March 31, 2021 (Unaudited)
13The accompanying notes are an integral part of the financial statements.
Description Shares Value (000)
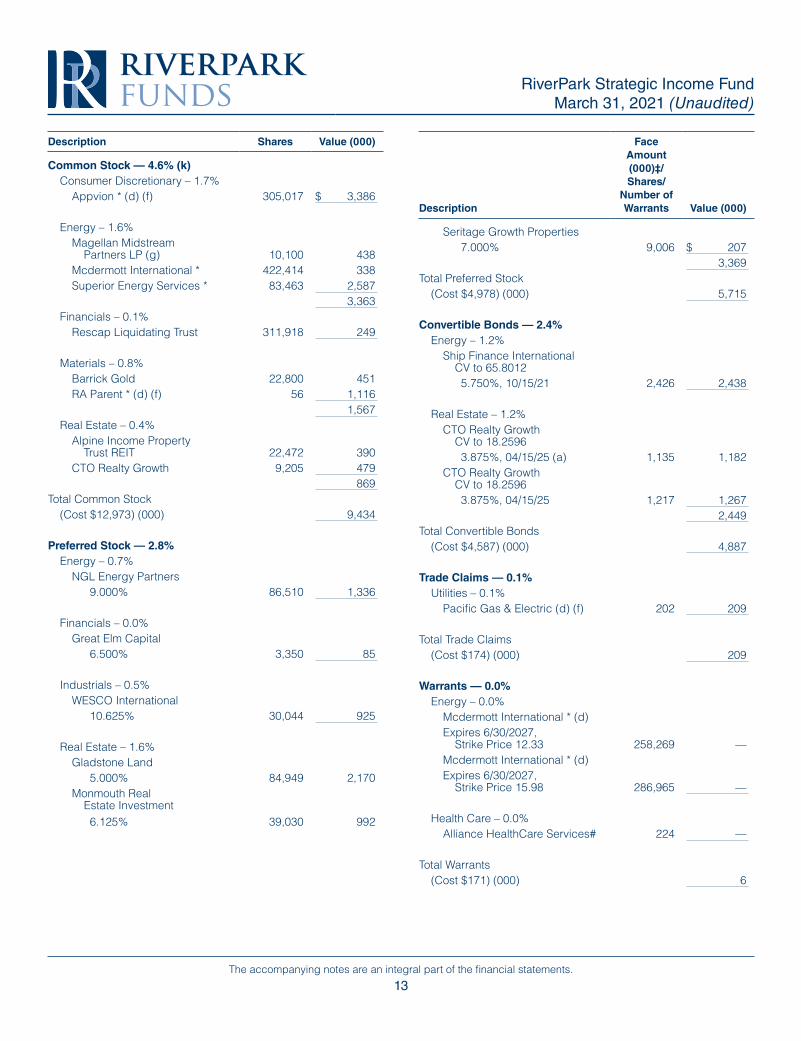
Common Stock — 4.6% (k)Consumer Discretionary – 1.7%
Appvion * (d) (f) 305,017 $ 3,386
Energy – 1.6%Magellan Midstream
Partners LP (g) 10,100 438Mcdermott International * 422,414 338Superior Energy Services * 83,463 2,587
3,363Financials – 0.1%
Rescap Liquidating Trust 311,918 249
Materials – 0.8%Barrick Gold 22,800 451RA Parent * (d) (f) 56 1,116
1,567Real Estate – 0.4%
Alpine Income Property Trust REIT 22,472 390
CTO Realty Growth 9,205 479869
Total Common Stock(Cost $12,973) (000) 9,434
Preferred Stock — 2.8%Energy – 0.7%
NGL Energy Partners9.000% 86,510 1,336
Financials – 0.0%Great Elm Capital
6.500% 3,350 85
Industrials – 0.5%WESCO International
10.625% 30,044 925
Real Estate – 1.6%Gladstone Land
5.000% 84,949 2,170Monmouth Real
Estate Investment6.125% 39,030 992
Description
Face Amount (000)‡/ Shares/
Number of Warrants Value (000)
Seritage Growth Properties7.000% 9,006 $ 207
3,369Total Preferred Stock
(Cost $4,978) (000) 5,715
Convertible Bonds — 2.4%Energy – 1.2%
Ship Finance International CV to 65.80125.750%, 10/15/21 2,426 2,438
Real Estate – 1.2%CTO Realty Growth
CV to 18.25963.875%, 04/15/25 (a) 1,135 1,182
CTO Realty Growth CV to 18.25963.875%, 04/15/25 1,217 1,267
2,449Total Convertible Bonds
(Cost $4,587) (000) 4,887
Trade Claims — 0.1%Utilities – 0.1%
Pacific Gas & Electric (d) (f) 202 209
Total Trade Claims(Cost $174) (000) 209
Warrants — 0.0%Energy – 0.0%
Mcdermott International * (d)Expires 6/30/2027,
Strike Price 12.33 258,269 —Mcdermott International * (d)Expires 6/30/2027,
Strike Price 15.98 286,965 —
Health Care – 0.0%Alliance HealthCare Services# 224 —
Total Warrants(Cost $171) (000) 6
RiverPark Strategic Income Fund March 31, 2021 (Unaudited)
14The accompanying notes are an integral part of the financial statements.
Description
Face Amount (000)‡ Value (000)
Bank Loan Obligations — 18.4% (k) Consumer Discretionary – 1.5%
Appvion Operations, Inc., Term Loan, 1st Lien7.000%, VAR LIBOR+0.060%, 06/12/26 427 $ 425
Golden Nugget Gaming, Term Loan, 1st Lien13.000%, 10/04/23 2,416 2,742
3,167Energy – 1.1%
Fieldwood Energy LLC, Closing Date Loan, Term Loan, 1st Lien0.000%, VAR LIBOR+5.250%, 04/11/22 (e) 5,879 2,234
Financials – 4.1%JZ Capital Partners,
Term Loans, 1st Lien12.000%, 06/21/21 (d) 7,178 7,178
Lealand Finance Company B.V., Take-Back Term Loan4.115%, VAR LIBOR+4.000%, 06/30/25 2,220 1,206
8,384Health Care – 4.8%
ABB/Con-Cise Optical Group LLC, Initial Term Loan, 1st Lien6.000%, 06/15/23 214 205
Alliance HealthCare Services, Inc. , Initial Term Loan, 1st Lien5.500%, VAR LIBOR+4.500%, 10/20/23 1,433 1,332
Alliance HealthCare Services, Inc. , Initial Term Loan, 2nd Lien12.000%, 04/24/24 699 312
First Brands Group, LLC, Alliance HealthCare Services, Inc. , Initial Term Loan, 2nd Lien9.500%, 03/30/28 (i) 3,393 3,359
Mallinckrodt International, 1st Lien, Term Loan0.000%, 02/28/22 (i) 4,678 4,625
9,833Industrials – 3.2%
Hertz, Term Loan, 1st Lien8.250%, 12/31/21 (h) (i) 6,523 6,575
Description
Face Amount (000)‡/ Shares Value (000)
Materials – 3.0% Elevate Textiles, Inc., Initial
Term Loan, 2nd Lien5.367%, VAR LIBOR+5.367%, 05/01/24 1,686 $ 1,579
Pixelle Specialty Solutions, LLC, Initial Term Loan, 1st Lien7.500%, VAR LIBOR+6.500%, 10/31/24 3,310 3,307
Real Alloy Holding, Term Loan, 1st Lien11.000%, VAR LIBOR0.000%, 12/31/49 (d) (f) 1,211 1,211
6,097Real Estate – 0.7%
IEA Energy Services LLC, 2019 Refinancing Term Loan, 1st Lien7.060%, VAR LIBOR+6.750%, 09/25/24 1,373 1,368
Total Bank Loan Obligations(Cost $41,479) (000) 37,658
Total Investments — 94.3%(Cost $200,343) (000) 193,227
Schedule of Securities Sold Short, Not Yet PurchasedExchange-Traded Fund — (2.1)%
iShares iBoxx High Yield Corporate Bond ETF (50,300) (4,385)
Total Exchange-Traded Fund(Proceeds $4,377) (000) (4,385)
Corporate Obligations — (2.0)%Consumer Staples – (1.6)%
Conagra Brands7.125%, 10/01/26 (1,000) (1,253)
Kraft Heinz Foods3.000%, 06/01/26 (1,863) (1,966)
(3,219)Health Care – (0.4)%
McKesson3.950%, 02/16/28 (660) (738)
Total Corporate Obligations(Proceeds $3,575) (000) (3,957)
RiverPark Strategic Income Fund March 31, 2021 (Unaudited)
15The accompanying notes are an integral part of the financial statements.
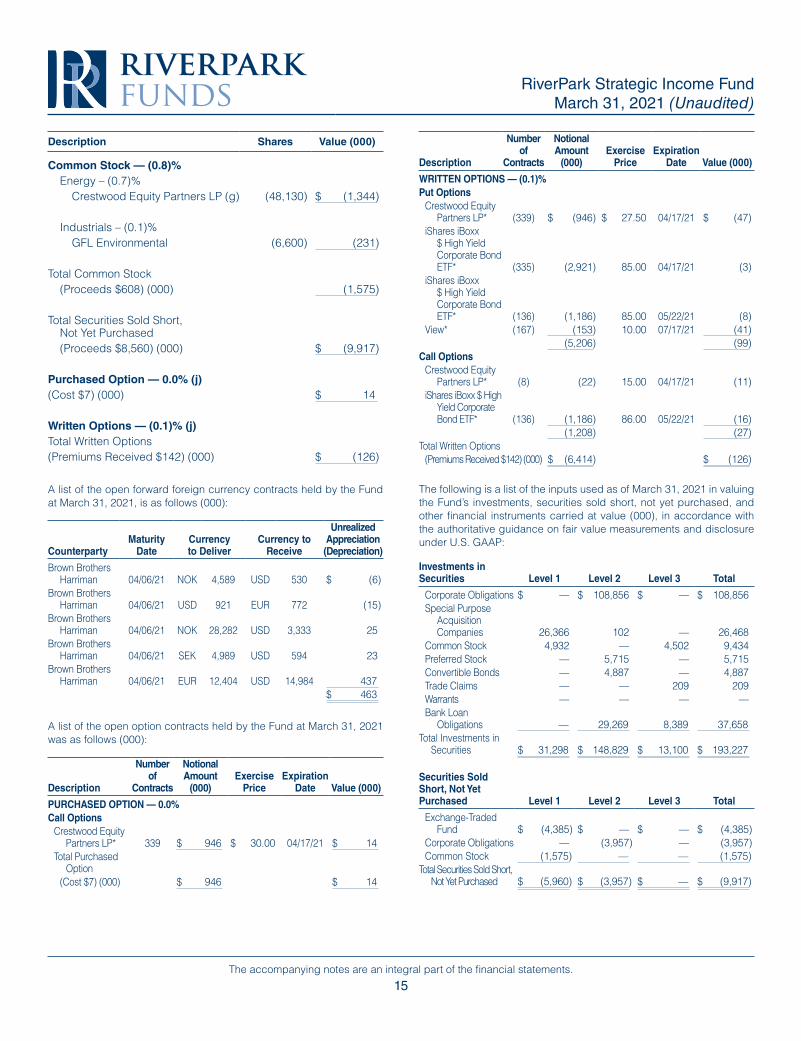
Description Shares Value (000)
Common Stock — (0.8)%Energy – (0.7)%
Crestwood Equity Partners LP (g) (48,130) $ (1,344) Industrials – (0.1)%
GFL Environmental (6,600) (231)
Total Common Stock(Proceeds $608) (000) (1,575)
Total Securities Sold Short, Not Yet Purchased(Proceeds $8,560) (000) $ (9,917)
Purchased Option — 0.0% (j)(Cost $7) (000) $ 14
Written Options — (0.1)% (j)Total Written Options(Premiums Received $142) (000) $ (126)
A list of the open forward foreign currency contracts held by the Fund at March 31, 2021, is as follows (000):
CounterpartyMaturity
DateCurrency to Deliver
Currency to Receive
Unrealized Appreciation (Depreciation)
Brown Brothers Harriman 04/06/21 NOK 4,589 USD 530 $ (6)
Brown Brothers Harriman 04/06/21 USD 921 EUR 772 (15)
Brown Brothers Harriman 04/06/21 NOK 28,282 USD 3,333 25
Brown Brothers Harriman 04/06/21 SEK 4,989 USD 594 23
Brown Brothers Harriman 04/06/21 EUR 12,404 USD 14,984 437
$ 463
A list of the open option contracts held by the Fund at March 31, 2021 was as follows (000):
Description
Number of
Contracts
Notional Amount
(000)Exercise
PriceExpiration
Date Value (000)
PURCHASED OPTION — 0.0%Call Options
Crestwood Equity Partners LP* 339 $ 946 $ 30.00 04/17/21 $ 14
Total Purchased Option
(Cost $7) (000) $ 946 $ 14
Description
Number of
Contracts
Notional Amount
(000)Exercise
PriceExpiration
Date Value (000)
WRITTEN OPTIONS — (0.1)%Put Options
Crestwood Equity Partners LP* (339) $ (946) $ 27.50 04/17/21 $ (47)
iShares iBoxx $ High Yield Corporate Bond ETF* (335) (2,921) 85.00 04/17/21 (3)
iShares iBoxx $ High Yield Corporate Bond ETF* (136) (1,186) 85.00 05/22/21 (8)
View* (167) (153) 10.00 07/17/21 (41)(5,206) (99)
Call OptionsCrestwood Equity
Partners LP* (8) (22) 15.00 04/17/21 (11)iShares iBoxx $ High
Yield Corporate Bond ETF* (136) (1,186) 86.00 05/22/21 (16)
(1,208) (27)Total Written Options
(Premiums Received $142) (000) $ (6,414) $ (126)
The following is a list of the inputs used as of March 31, 2021 in valuing the Fund’s investments, securities sold short, not yet purchased, and other financial instruments carried at value (000), in accordance with the authoritative guidance on fair value measurements and disclosure under U.S. GAAP:
Investments in Securities Level 1 Level 2 Level 3 Total
Corporate Obligations $ — $ 108,856 $ — $ 108,856Special Purpose
Acquisition Companies 26,366 102 — 26,468
Common Stock 4,932 — 4,502 9,434Preferred Stock — 5,715 — 5,715Convertible Bonds — 4,887 — 4,887Trade Claims — — 209 209Warrants — — — —Bank Loan
Obligations — 29,269 8,389 37,658Total Investments in
Securities $ 31,298 $ 148,829 $ 13,100 $ 193,227
Securities Sold Short, Not Yet Purchased Level 1 Level 2 Level 3 Total
Exchange-Traded Fund $ (4,385) $ — $ — $ (4,385)
Corporate Obligations — (3,957) — (3,957)Common Stock (1,575) — — (1,575)
Total Securities Sold Short, Not Yet Purchased $ (5,960) $ (3,957) $ — $ (9,917)
RiverPark Strategic Income Fund March 31, 2021 (Unaudited)
16The accompanying notes are an integral part of the financial statements.
RiverPark Strategic Income Fund March 31, 2021 (Unaudited)
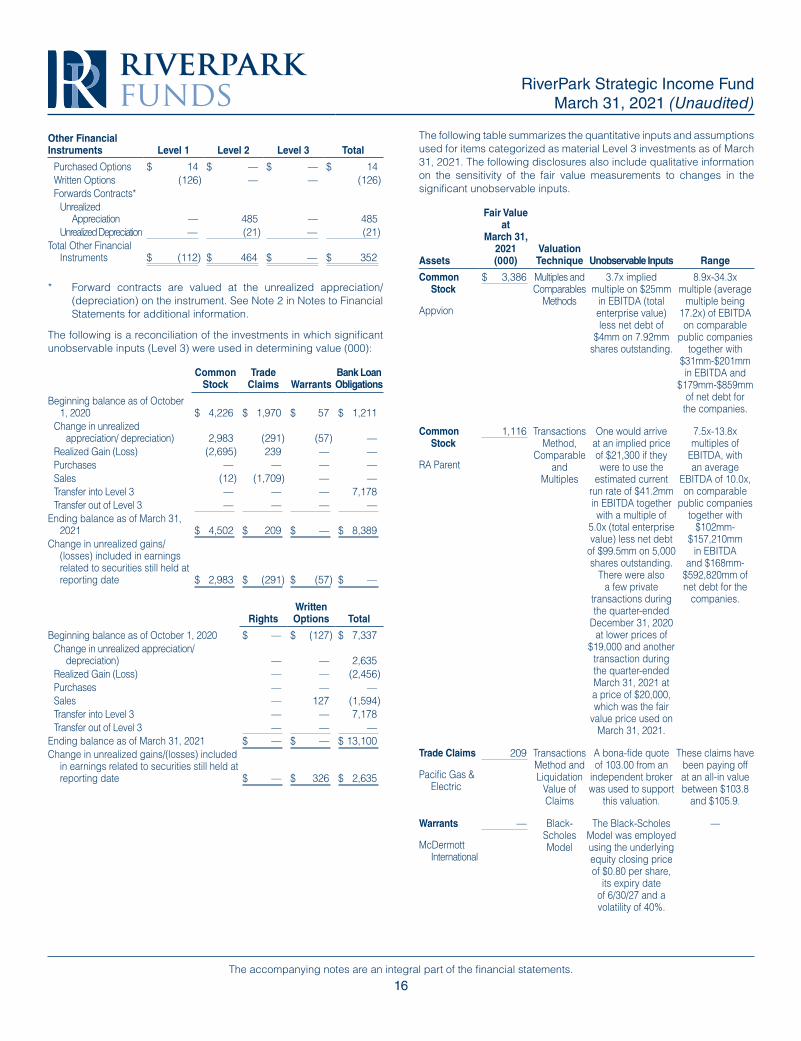
Other Financial Instruments Level 1 Level 2 Level 3 Total
Purchased Options $ 14 $ — $ — $ 14Written Options (126) — — (126)Forwards Contracts*
Unrealized Appreciation — 485 — 485
Unrealized Depreciation — (21) — (21)Total Other Financial
Instruments $ (112) $ 464 $ — $ 352
* Forward contracts are valued at the unrealized appreciation/(depreciation) on the instrument. See Note 2 in Notes to Financial Statements for additional information.
The following is a reconciliation of the investments in which significant unobservable inputs (Level 3) were used in determining value (000):
Common Stock
Trade Claims Warrants
Bank Loan Obligations
Beginning balance as of October 1, 2020 $ 4,226 $ 1,970 $ 57 $ 1,211
Change in unrealized appreciation/ depreciation) 2,983 (291) (57) —
Realized Gain (Loss) (2,695) 239 — —Purchases — — — —Sales (12) (1,709) — —Transfer into Level 3 — — — 7,178Transfer out of Level 3 — — — —
Ending balance as of March 31, 2021 $ 4,502 $ 209 $ — $ 8,389
Change in unrealized gains/(losses) included in earnings related to securities still held at reporting date $ 2,983 $ (291) $ (57) $ —
RightsWritten Options Total
Beginning balance as of October 1, 2020 $ — $ (127) $ 7,337Change in unrealized appreciation/
depreciation) — — 2,635Realized Gain (Loss) — — (2,456)Purchases — — —Sales — 127 (1,594)Transfer into Level 3 — — 7,178Transfer out of Level 3 — — —
Ending balance as of March 31, 2021 $ — $ — $ 13,100Change in unrealized gains/(losses) included
in earnings related to securities still held at reporting date $ — $ 326 $ 2,635
The following table summarizes the quantitative inputs and assumptions used for items categorized as material Level 3 investments as of March 31, 2021. The following disclosures also include qualitative information on the sensitivity of the fair value measurements to changes in the significant unobservable inputs.
Assets
Fair Value at
March 31, 2021 (000)
Valuation Technique Unobservable Inputs Range
Common Stock
Appvion
$ 3,386 Multiples and Comparables
Methods
3.7x implied multiple on $25mm
in EBITDA (total enterprise value) less net debt of
$4mm on 7.92mm shares outstanding.
8.9x-34.3x multiple (average
multiple being 17.2x) of EBITDA on comparable
public companies together with
$31mm-$201mm in EBITDA and
$179mm-$859mm of net debt for
the companies.
Common Stock
RA Parent
1,116 Transactions Method,
Comparable and
Multiples
One would arrive at an implied price of $21,300 if they were to use the
estimated current run rate of $41.2mm in EBITDA together with a multiple of
5.0x (total enterprise value) less net debt
of $99.5mm on 5,000 shares outstanding.
There were also a few private
transactions during the quarter-ended
December 31, 2020 at lower prices of
$19,000 and another transaction during the quarter-ended March 31, 2021 at a price of $20,000, which was the fair
value price used on March 31, 2021.
7.5x-13.8x multiples of
EBITDA, with an average
EBITDA of 10.0x, on comparable
public companies together with
$102mm-$157,210mm
in EBITDA and $168mm-
$592,820mm of net debt for the
companies.
Trade Claims
Pacific Gas & Electric
209 Transactions Method and Liquidation
Value of Claims
A bona-fide quote of 103.00 from an
independent broker was used to support
this valuation.
These claims have been paying off at an all-in value between $103.8
and $105.9.
Warrants
McDermott International
— Black-Scholes Model
The Black-Scholes Model was employed using the underlying equity closing price of $0.80 per share,
its expiry date of 6/30/27 and a volatility of 40%.
—
17The accompanying notes are an integral part of the financial statements.
Assets
Fair Value at
March 31, 2021 (000)
Valuation Technique Unobservable Inputs Range
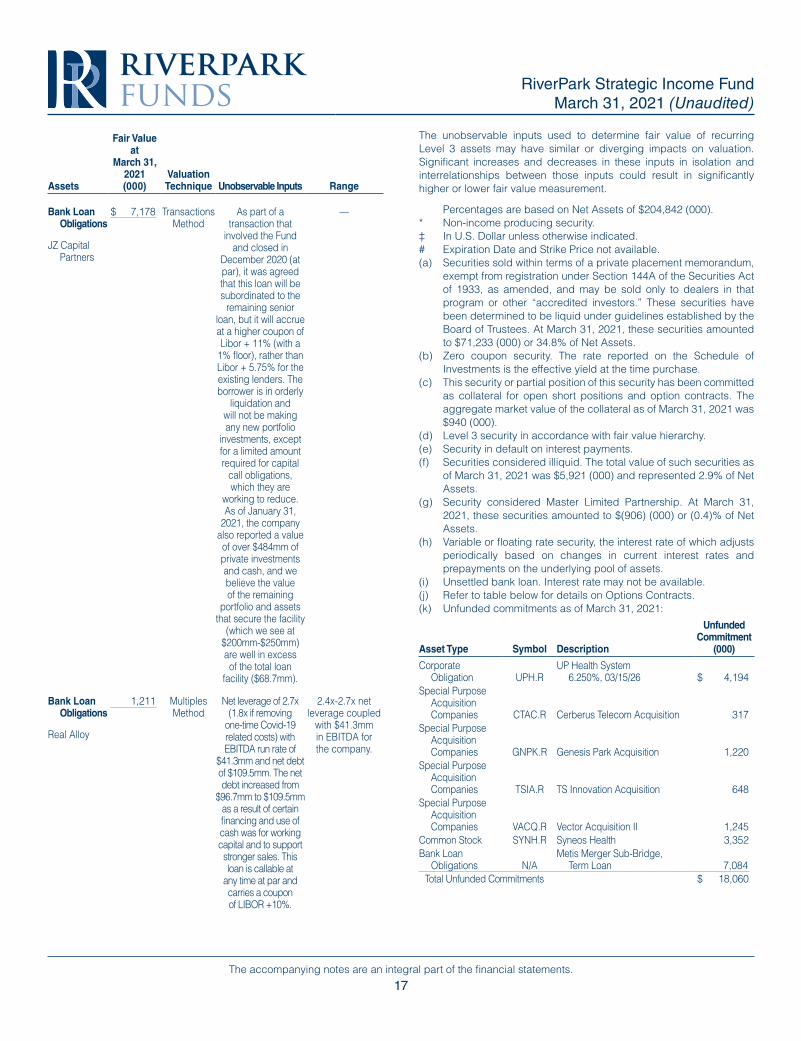
Bank Loan Obligations
JZ Capital Partners
$ 7,178 Transactions Method
As part of a transaction that
involved the Fund and closed in
December 2020 (at par), it was agreed that this loan will be subordinated to the
remaining senior loan, but it will accrue at a higher coupon of Libor + 11% (with a
1% floor), rather than Libor + 5.75% for the existing lenders. The borrower is in orderly
liquidation and will not be making any new portfolio
investments, except for a limited amount required for capital
call obligations, which they are
working to reduce. As of January 31,
2021, the company also reported a value of over $484mm of private investments and cash, and we believe the value of the remaining
portfolio and assets that secure the facility
(which we see at $200mm-$250mm) are well in excess of the total loan
facility ($68.7mm).
—
Bank Loan Obligations
Real Alloy
1,211 Multiples Method
Net leverage of 2.7x (1.8x if removing
one-time Covid-19 related costs) with EBITDA run rate of
$41.3mm and net debt of $109.5mm. The net debt increased from
$96.7mm to $109.5mm as a result of certain financing and use of cash was for working capital and to support stronger sales. This loan is callable at
any time at par and carries a coupon of LIBOR +10%.
2.4x-2.7x net leverage coupled
with $41.3mm in EBITDA for the company.
The unobservable inputs used to determine fair value of recurring Level 3 assets may have similar or diverging impacts on valuation. Significant increases and decreases in these inputs in isolation and interrelationships between those inputs could result in significantly higher or lower fair value measurement.
Percentages are based on Net Assets of $204,842 (000).* Non-income producing security.‡ In U.S. Dollar unless otherwise indicated.# Expiration Date and Strike Price not available.(a) Securities sold within terms of a private placement memorandum,
exempt from registration under Section 144A of the Securities Act of 1933, as amended, and may be sold only to dealers in that program or other “accredited investors.” These securities have been determined to be liquid under guidelines established by the Board of Trustees. At March 31, 2021, these securities amounted to $71,233 (000) or 34.8% of Net Assets.
(b) Zero coupon security. The rate reported on the Schedule of Investments is the effective yield at the time purchase.
(c) This security or partial position of this security has been committed as collateral for open short positions and option contracts. The aggregate market value of the collateral as of March 31, 2021 was $940 (000).
(d) Level 3 security in accordance with fair value hierarchy.(e) Security in default on interest payments.(f) Securities considered illiquid. The total value of such securities as
of March 31, 2021 was $5,921 (000) and represented 2.9% of Net Assets.
(g) Security considered Master Limited Partnership. At March 31, 2021, these securities amounted to $(906) (000) or (0.4)% of Net Assets.
(h) Variable or floating rate security, the interest rate of which adjusts periodically based on changes in current interest rates and prepayments on the underlying pool of assets.
(i) Unsettled bank loan. Interest rate may not be available. (j) Refer to table below for details on Options Contracts.(k) Unfunded commitments as of March 31, 2021:
Asset Type Symbol Description
Unfunded Commitment
(000)
Corporate Obligation UPH.R
UP Health System 6.250%, 03/15/26 $ 4,194
Special Purpose Acquisition Companies CTAC.R Cerberus Telecom Acquisition 317
Special Purpose Acquisition Companies GNPK.R Genesis Park Acquisition 1,220
Special Purpose Acquisition Companies TSIA.R TS Innovation Acquisition 648
Special Purpose Acquisition Companies VACQ.R Vector Acquisition II 1,245
Common Stock SYNH.R Syneos Health 3,352Bank Loan
Obligations N/AMetis Merger Sub-Bridge,
Term Loan 7,084Total Unfunded Commitments $ 18,060
RiverPark Strategic Income Fund March 31, 2021 (Unaudited)
18The accompanying notes are an integral part of the financial statements.
Cl — ClassCV — ConvertibleETF — Exchange Traded FundEUR — EuroEURIBOR— Euro London Interbank Offered RateICE— Intercontinental ExchangeLIBOR— London Interbank Offered RateLLC — Limited Liability CompanyLP — Limited PartnershipNIBOR — Norwegian Interbank Offered RateNOK — NorwayPIK — Paid-in-KindREIT — Real Estate Investment TrustSEK — Swedish KronaSer — SeriesUSD — U.S. DollarVAR — Variable Rate
Amounts designated as “—” are either $0 or have been rounded to $0.
RiverPark Strategic Income Fund March 31, 2021 (Unaudited)
19The accompanying notes are an integral part of the financial statements.
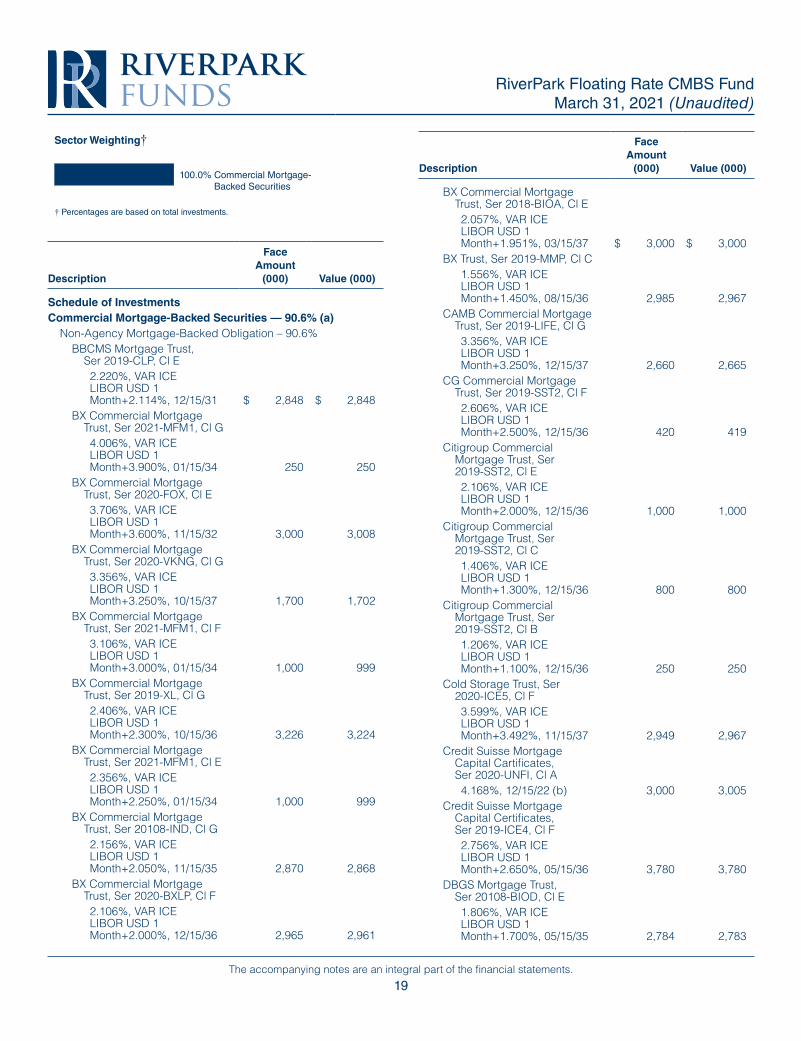
0 100
100.0% Commercial Mortgage- Backed Securities
Sector Weighting†
† Percentages are based on total investments.
Description
Face Amount
(000) Value (000)
Schedule of InvestmentsCommercial Mortgage-Backed Securities — 90.6% (a)
Non-Agency Mortgage-Backed Obligation – 90.6%BBCMS Mortgage Trust,
Ser 2019-CLP, Cl E 2.220%, VAR ICE LIBOR USD 1 Month+2.114%, 12/15/31 $ 2,848 $ 2,848
BX Commercial Mortgage Trust, Ser 2021-MFM1, Cl G4.006%, VAR ICE LIBOR USD 1 Month+3.900%, 01/15/34 250 250
BX Commercial Mortgage Trust, Ser 2020-FOX, Cl E3.706%, VAR ICE LIBOR USD 1 Month+3.600%, 11/15/32 3,000 3,008
BX Commercial Mortgage Trust, Ser 2020-VKNG, Cl G3.356%, VAR ICE LIBOR USD 1 Month+3.250%, 10/15/37 1,700 1,702
BX Commercial Mortgage Trust, Ser 2021-MFM1, Cl F3.106%, VAR ICE LIBOR USD 1 Month+3.000%, 01/15/34 1,000 999
BX Commercial Mortgage Trust, Ser 2019-XL, Cl G2.406%, VAR ICE LIBOR USD 1 Month+2.300%, 10/15/36 3,226 3,224
BX Commercial Mortgage Trust, Ser 2021-MFM1, Cl E2.356%, VAR ICE LIBOR USD 1 Month+2.250%, 01/15/34 1,000 999
BX Commercial Mortgage Trust, Ser 20108-IND, Cl G2.156%, VAR ICE LIBOR USD 1 Month+2.050%, 11/15/35 2,870 2,868
BX Commercial Mortgage Trust, Ser 2020-BXLP, Cl F2.106%, VAR ICE LIBOR USD 1 Month+2.000%, 12/15/36 2,965 2,961
Description
Face Amount
(000) Value (000)
BX Commercial Mortgage Trust, Ser 2018-BIOA, Cl E2.057%, VAR ICE LIBOR USD 1 Month+1.951%, 03/15/37 $ 3,000 $ 3,000
BX Trust, Ser 2019-MMP, Cl C1.556%, VAR ICE LIBOR USD 1 Month+1.450%, 08/15/36 2,985 2,967
CAMB Commercial Mortgage Trust, Ser 2019-LIFE, Cl G3.356%, VAR ICE LIBOR USD 1 Month+3.250%, 12/15/37 2,660 2,665
CG Commercial Mortgage Trust, Ser 2019-SST2, Cl F2.606%, VAR ICE LIBOR USD 1 Month+2.500%, 12/15/36 420 419
Citigroup Commercial Mortgage Trust, Ser 2019-SST2, Cl E2.106%, VAR ICE LIBOR USD 1 Month+2.000%, 12/15/36 1,000 1,000
Citigroup Commercial Mortgage Trust, Ser 2019-SST2, Cl C1.406%, VAR ICE LIBOR USD 1 Month+1.300%, 12/15/36 800 800
Citigroup Commercial Mortgage Trust, Ser 2019-SST2, Cl B1.206%, VAR ICE LIBOR USD 1 Month+1.100%, 12/15/36 250 250
Cold Storage Trust, Ser 2020-ICE5, Cl F3.599%, VAR ICE LIBOR USD 1 Month+3.492%, 11/15/37 2,949 2,967
Credit Suisse Mortgage Capital Cartificates, Ser 2020-UNFI, Cl A4.168%, 12/15/22 (b) 3,000 3,005
Credit Suisse Mortgage Capital Certificates, Ser 2019-ICE4, Cl F2.756%, VAR ICE LIBOR USD 1 Month+2.650%, 05/15/36 3,780 3,780
DBGS Mortgage Trust, Ser 20108-BIOD, Cl E1.806%, VAR ICE LIBOR USD 1 Month+1.700%, 05/15/35 2,784 2,783
RiverPark Floating Rate CMBS FundMarch 31, 2021 (Unaudited)
20The accompanying notes are an integral part of the financial statements.
Description
Face Amount
(000) Value (000)
KKR Industrial Portfolio Trust, Ser 2020-AIP, Cl E2.732%, VAR ICE LIBOR USD 1 Month+2.626%, 03/15/37 $ 2,411 $ 2,414
KKR Industrial Portfolio Trust, Ser 2021-KDIP, Cl F2.156%, VAR ICE LIBOR USD 1 Month+2.050%, 12/15/37 2,500 2,501
Morgan Stanley Capital I Trust, Ser 2017-CLS, Cl F2.706%, VAR ICE LIBOR USD 1 Month+2.600%, 11/15/34 1,764 1,762
Morgan Stanley Capital I Trust, Ser 2017-CLS, Cl C1.106%, VAR ICE LIBOR USD 1 Month+1.000%, 11/15/34 200 200
Morgan Stanley Capital I Trust, Ser 2017-CLS, Cl B0.956%, VAR ICE LIBOR USD 1 Month+0.850%, 11/15/34 275 275
Morgan Stanley Capital I Trust, Ser 2017-CLS, Cl A0.806%, VAR ICE LIBOR USD 1 Month+0.700%, 11/15/34 150 150
MSCG Trust, Ser 2018-SELF, Cl F3.156%, VAR ICE LIBOR USD 1 Month+3.050%, 10/15/37 295 297
MSCG Trust, Ser 2018-SELF, Cl D1.756%, VAR ICE LIBOR USD 1 Month+1.650%, 10/15/37 2,000 1,995
Total Commercial Mortgage-Backed Securities(Cost $51,265) (000) 52,089
Total Investments — 90.6%(Cost $51,265) (000) $ 52,089
As of March 31, 2021, all of the Fund’s investments were considered Level 2 in accordance with the authoritative guidance on fair value measurements and disclosure under U.S. GAAP.
For the period ended March 31, 2020, there were no transfers in or out of Level 3.
Percentages are based on Net Assets of $57,498 (000).
(a) Securities sold within terms of a private placement memorandum, exempt from registration under Section 144A of the Securities Act of 1933, as amended, and may be sold only to dealers in that program or other “accredited investors.” These securities have been determined to be liquid under guidelines established by the Board of Trustees. At March 31, 2021, these securities amounted to $52,089 (000) or 90.6% of Net Assets.
(b) This position is a one-month LIBOR floating rate commercial mortgage-backed security that is subject to a floor of 0.50%.
Cl — ClassICE — Intercontinental ExchangeLIBOR — London Interbank Offered RateSer — SeriesUSD — United States DollarVAR — Variable Rate
RiverPark Floating Rate CMBS Fund March 31, 2021 (Unaudited)
21The accompanying notes are an integral part of the financial statements.
RiverPark Large Growth Fund Wedgewood Fund
RiverPark Short Term High Yield Fund
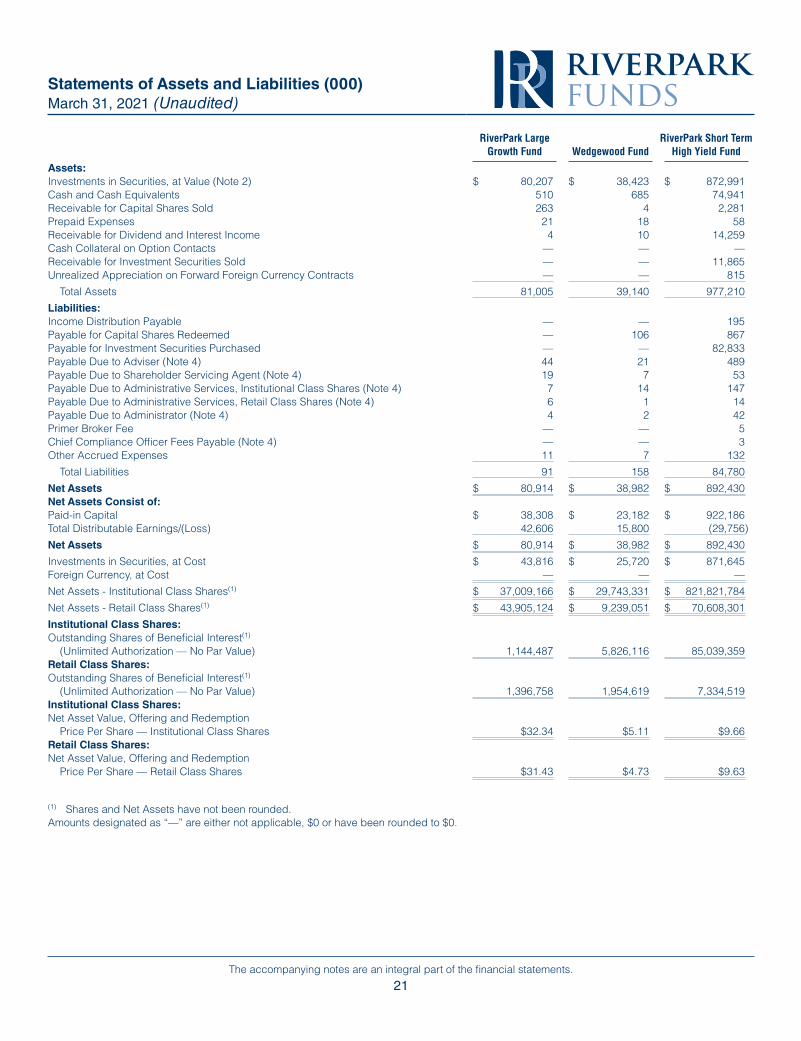
Assets:Investments in Securities, at Value (Note 2) $ 80,207 $ 38,423 $ 872,991Cash and Cash Equivalents 510 685 74,941Receivable for Capital Shares Sold 263 4 2,281Prepaid Expenses 21 18 58Receivable for Dividend and Interest Income 4 10 14,259Cash Collateral on Option Contacts — — —Receivable for Investment Securities Sold — — 11,865Unrealized Appreciation on Forward Foreign Currency Contracts — — 815
Total Assets 81,005 39,140 977,210
Liabilities:Income Distribution Payable — — 195Payable for Capital Shares Redeemed — 106 867Payable for Investment Securities Purchased — — 82,833Payable Due to Adviser (Note 4) 44 21 489Payable Due to Shareholder Servicing Agent (Note 4) 19 7 53Payable Due to Administrative Services, Institutional Class Shares (Note 4) 7 14 147Payable Due to Administrative Services, Retail Class Shares (Note 4) 6 1 14Payable Due to Administrator (Note 4) 4 2 42Primer Broker Fee — — 5Chief Compliance Officer Fees Payable (Note 4) — — 3Other Accrued Expenses 11 7 132
Total Liabilities 91 158 84,780
Net Assets $ 80,914 $ 38,982 $ 892,430Net Assets Consist of:Paid-in Capital $ 38,308 $ 23,182 $ 922,186Total Distributable Earnings/(Loss) 42,606 15,800 (29,756)
Net Assets $ 80,914 $ 38,982 $ 892,430
Investments in Securities, at Cost $ 43,816 $ 25,720 $ 871,645Foreign Currency, at Cost — — —
Net Assets - Institutional Class Shares(1) $ 37,009,166 $ 29,743,331 $ 821,821,784
Net Assets - Retail Class Shares(1) $ 43,905,124 $ 9,239,051 $ 70,608,301
Institutional Class Shares:Outstanding Shares of Beneficial Interest(1)
(Unlimited Authorization — No Par Value) 1,144,487 5,826,116 85,039,359Retail Class Shares:Outstanding Shares of Beneficial Interest(1)
(Unlimited Authorization — No Par Value) 1,396,758 1,954,619 7,334,519Institutional Class Shares:Net Asset Value, Offering and Redemption
Price Per Share — Institutional Class Shares $32.34 $5.11 $9.66Retail Class Shares:Net Asset Value, Offering and Redemption
Price Per Share — Retail Class Shares $31.43 $4.73 $9.63
(1) Shares and Net Assets have not been rounded.Amounts designated as “—” are either not applicable, $0 or have been rounded to $0.
Statements of Assets and Liabilities (000)March 31, 2021 (Unaudited)
22The accompanying notes are an integral part of the financial statements.
RiverPark Long/Short Opportunity Fund
RiverPark Strategic Income Fund
RiverPark Floating Rate CMBS Fund
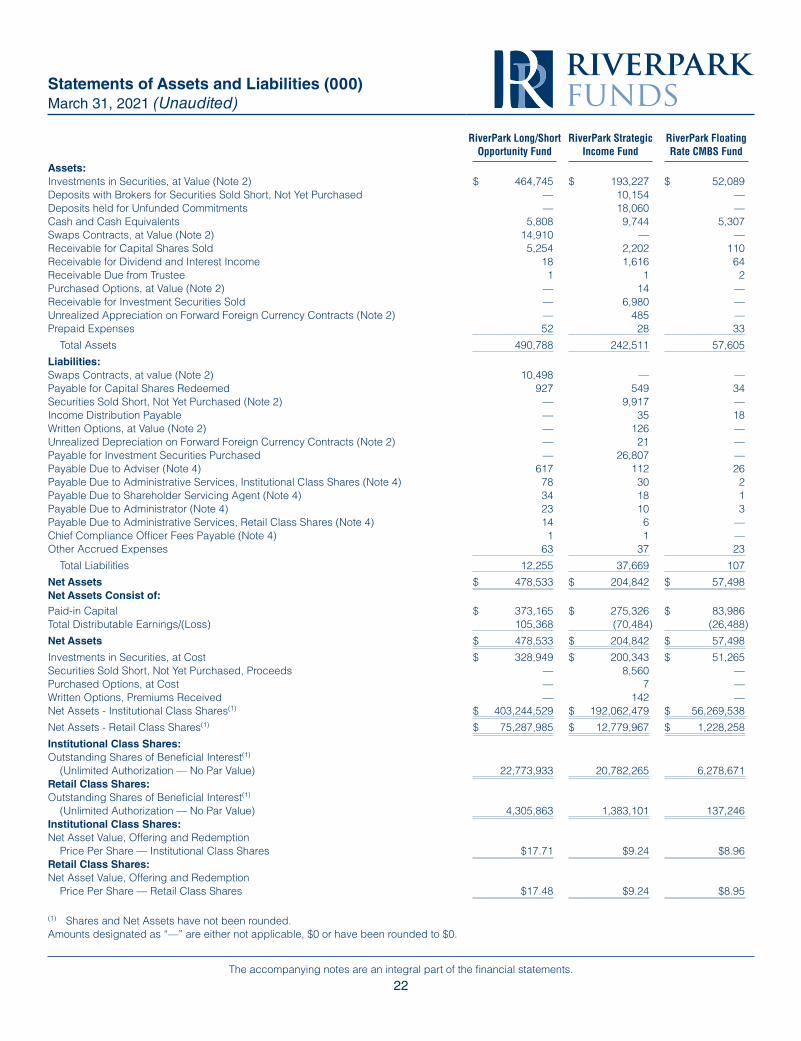
Assets:Investments in Securities, at Value (Note 2) $ 464,745 $ 193,227 $ 52,089Deposits with Brokers for Securities Sold Short, Not Yet Purchased — 10,154 —Deposits held for Unfunded Commitments — 18,060 —Cash and Cash Equivalents 5,808 9,744 5,307Swaps Contracts, at Value (Note 2) 14,910 — —Receivable for Capital Shares Sold 5,254 2,202 110Receivable for Dividend and Interest Income 18 1,616 64Receivable Due from Trustee 1 1 2Purchased Options, at Value (Note 2) — 14 —Receivable for Investment Securities Sold — 6,980 —Unrealized Appreciation on Forward Foreign Currency Contracts (Note 2) — 485 —Prepaid Expenses 52 28 33
Total Assets 490,788 242,511 57,605
Liabilities:Swaps Contracts, at value (Note 2) 10,498 — —Payable for Capital Shares Redeemed 927 549 34Securities Sold Short, Not Yet Purchased (Note 2) — 9,917 —Income Distribution Payable — 35 18Written Options, at Value (Note 2) — 126 —Unrealized Depreciation on Forward Foreign Currency Contracts (Note 2) — 21 —Payable for Investment Securities Purchased — 26,807 —Payable Due to Adviser (Note 4) 617 112 26Payable Due to Administrative Services, Institutional Class Shares (Note 4) 78 30 2Payable Due to Shareholder Servicing Agent (Note 4) 34 18 1Payable Due to Administrator (Note 4) 23 10 3Payable Due to Administrative Services, Retail Class Shares (Note 4) 14 6 —Chief Compliance Officer Fees Payable (Note 4) 1 1 —Other Accrued Expenses 63 37 23
Total Liabilities 12,255 37,669 107
Net Assets $ 478,533 $ 204,842 $ 57,498Net Assets Consist of:Paid-in Capital $ 373,165 $ 275,326 $ 83,986Total Distributable Earnings/(Loss) 105,368 (70,484) (26,488)
Net Assets $ 478,533 $ 204,842 $ 57,498
Investments in Securities, at Cost $ 328,949 $ 200,343 $ 51,265Securities Sold Short, Not Yet Purchased, Proceeds — 8,560 —Purchased Options, at Cost — 7 —Written Options, Premiums Received — 142 —Net Assets - Institutional Class Shares(1) $ 403,244,529 $ 192,062,479 $ 56,269,538
Net Assets - Retail Class Shares(1) $ 75,287,985 $ 12,779,967 $ 1,228,258
Institutional Class Shares:Outstanding Shares of Beneficial Interest(1)
(Unlimited Authorization — No Par Value) 22,773,933 20,782,265 6,278,671Retail Class Shares:Outstanding Shares of Beneficial Interest(1)
(Unlimited Authorization — No Par Value) 4,305,863 1,383,101 137,246Institutional Class Shares:Net Asset Value, Offering and Redemption
Price Per Share — Institutional Class Shares $17.71 $9.24 $8.96Retail Class Shares:Net Asset Value, Offering and Redemption
Price Per Share — Retail Class Shares $17.48 $9.24 $8.95
(1) Shares and Net Assets have not been rounded.Amounts designated as “—” are either not applicable, $0 or have been rounded to $0.
Statements of Assets and Liabilities (000)March 31, 2021 (Unaudited)
23The accompanying notes are an integral part of the financial statements.
RiverPark Large Growth Fund Wedgewood Fund
RiverPark Short Term High Yield Fund
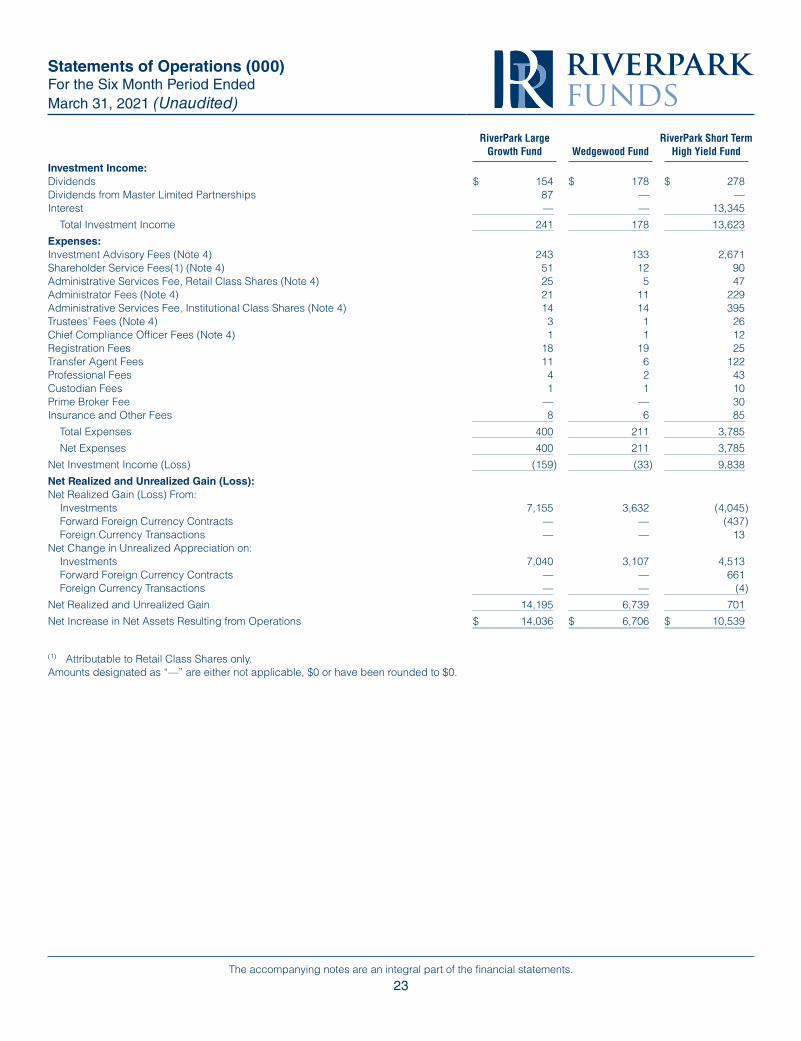
Investment Income:Dividends $ 154 $ 178 $ 278Dividends from Master Limited Partnerships 87 — —Interest — — 13,345
Total Investment Income 241 178 13,623
Expenses:Investment Advisory Fees (Note 4) 243 133 2,671Shareholder Service Fees(1) (Note 4) 51 12 90Administrative Services Fee, Retail Class Shares (Note 4) 25 5 47Administrator Fees (Note 4) 21 11 229Administrative Services Fee, Institutional Class Shares (Note 4) 14 14 395Trustees’ Fees (Note 4) 3 1 26Chief Compliance Officer Fees (Note 4) 1 1 12Registration Fees 18 19 25Transfer Agent Fees 11 6 122Professional Fees 4 2 43Custodian Fees 1 1 10Prime Broker Fee — — 30Insurance and Other Fees 8 6 85
Total Expenses 400 211 3,785
Net Expenses 400 211 3,785
Net Investment Income (Loss) (159) (33) 9,838
Net Realized and Unrealized Gain (Loss):Net Realized Gain (Loss) From:
Investments 7,155 3,632 (4,045)Forward Foreign Currency Contracts — — (437)Foreign Currency Transactions — — 13
Net Change in Unrealized Appreciation on:Investments 7,040 3,107 4,513Forward Foreign Currency Contracts — — 661Foreign Currency Transactions — — (4)
Net Realized and Unrealized Gain 14,195 6,739 701
Net Increase in Net Assets Resulting from Operations $ 14,036 $ 6,706 $ 10,539
(1) Attributable to Retail Class Shares only.Amounts designated as “—” are either not applicable, $0 or have been rounded to $0.
Statements of Operations (000) For the Six Month Period Ended March 31, 2021 (Unaudited)
24The accompanying notes are an integral part of the financial statements.
RiverPark Long/Short Opportunity Fund
RiverPark Strategic Income Fund
RiverPark Floating Rate CMBS Fund
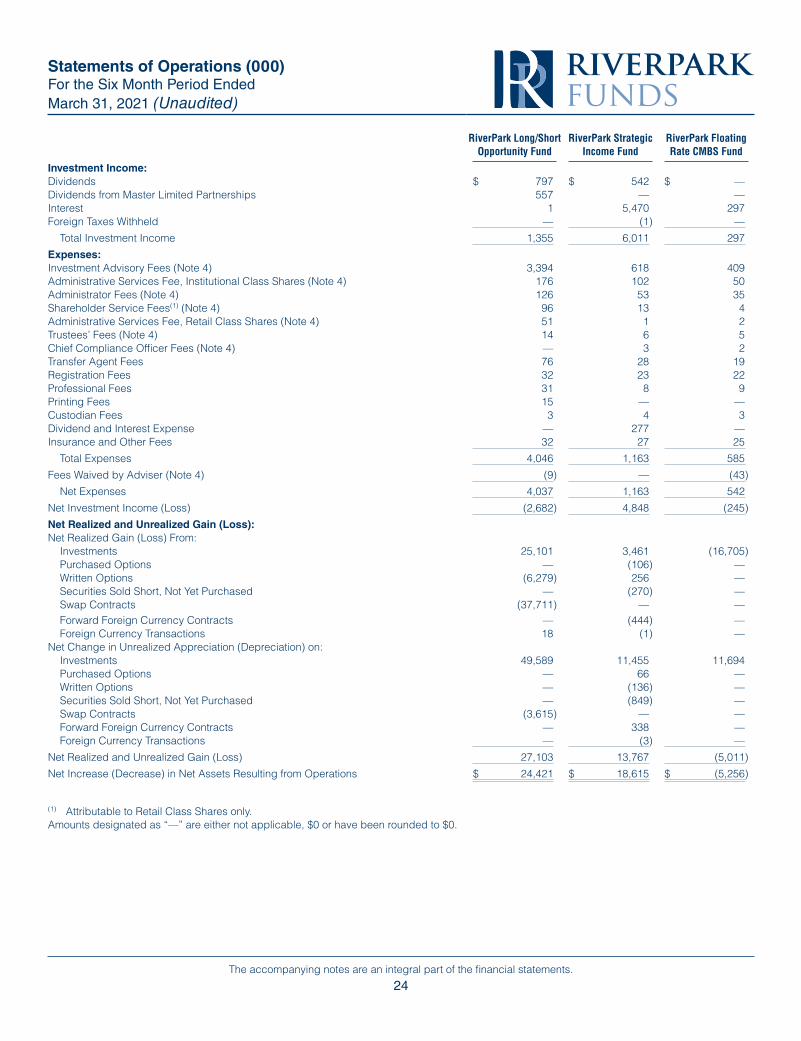
Investment Income:Dividends $ 797 $ 542 $ —Dividends from Master Limited Partnerships 557 — —Interest 1 5,470 297Foreign Taxes Withheld — (1) —
Total Investment Income 1,355 6,011 297
Expenses:Investment Advisory Fees (Note 4) 3,394 618 409Administrative Services Fee, Institutional Class Shares (Note 4) 176 102 50Administrator Fees (Note 4) 126 53 35Shareholder Service Fees(1) (Note 4) 96 13 4Administrative Services Fee, Retail Class Shares (Note 4) 51 1 2Trustees’ Fees (Note 4) 14 6 5Chief Compliance Officer Fees (Note 4) — 3 2Transfer Agent Fees 76 28 19Registration Fees 32 23 22Professional Fees 31 8 9Printing Fees 15 — —Custodian Fees 3 4 3Dividend and Interest Expense — 277 —Insurance and Other Fees 32 27 25
Total Expenses 4,046 1,163 585
Fees Waived by Adviser (Note 4) (9) — (43)
Net Expenses 4,037 1,163 542
Net Investment Income (Loss) (2,682) 4,848 (245)
Net Realized and Unrealized Gain (Loss):Net Realized Gain (Loss) From:
Investments 25,101 3,461 (16,705)Purchased Options — (106) —Written Options (6,279) 256 —Securities Sold Short, Not Yet Purchased — (270) —Swap Contracts (37,711) — —Forward Foreign Currency Contracts — (444) —Foreign Currency Transactions 18 (1) —
Net Change in Unrealized Appreciation (Depreciation) on:Investments 49,589 11,455 11,694Purchased Options — 66 —Written Options — (136) —Securities Sold Short, Not Yet Purchased — (849) —Swap Contracts (3,615) — —Forward Foreign Currency Contracts — 338 —Foreign Currency Transactions — (3) —
Net Realized and Unrealized Gain (Loss) 27,103 13,767 (5,011)
Net Increase (Decrease) in Net Assets Resulting from Operations $ 24,421 $ 18,615 $ (5,256)
(1) Attributable to Retail Class Shares only.Amounts designated as “—” are either not applicable, $0 or have been rounded to $0.
Statements of Operations (000) For the Six Month Period Ended March 31, 2021 (Unaudited)
25The accompanying notes are an integral part of the financial statements.
RiverPark Large Growth Fund Wedgewood Fund
Six Month Period Ended March 31, 2021 (Unaudited)
Year Ended September 30,
2020
Six Month Period Ended March 31, 2021 (Unaudited)
Year Ended September 30,
2020
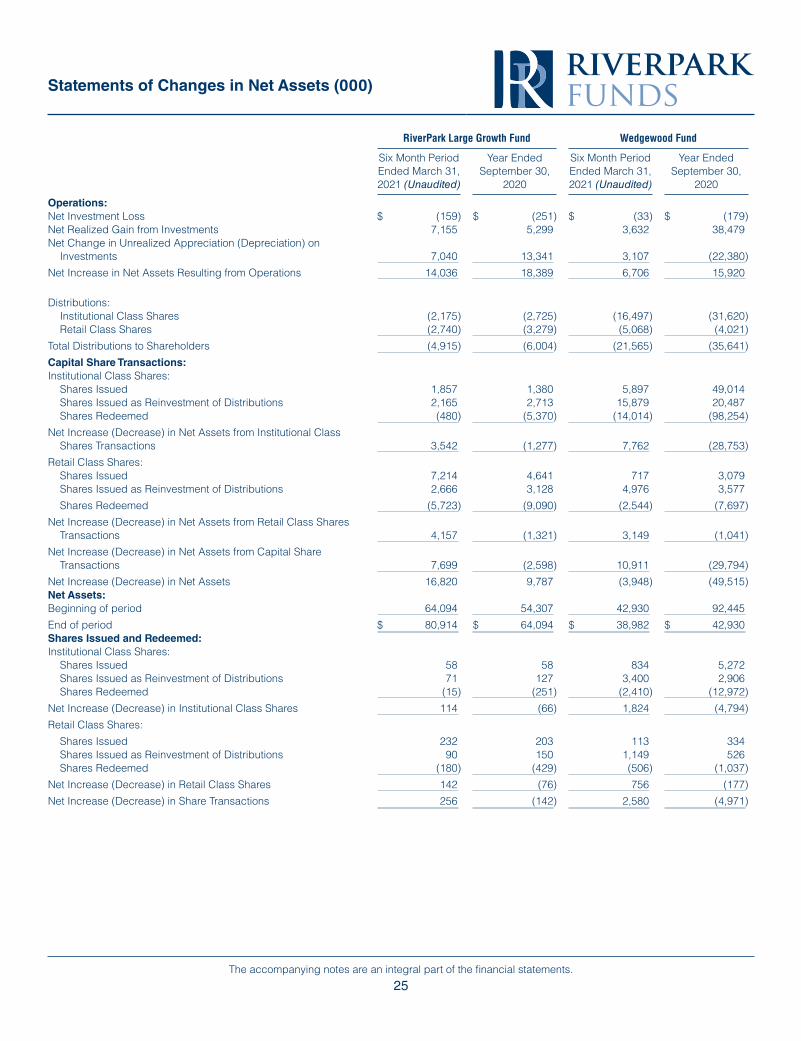
Operations:Net Investment Loss $ (159) $ (251) $ (33) $ (179)Net Realized Gain from Investments 7,155 5,299 3,632 38,479Net Change in Unrealized Appreciation (Depreciation) on
Investments 7,040 13,341 3,107 (22,380)
Net Increase in Net Assets Resulting from Operations 14,036 18,389 6,706 15,920
Distributions:Institutional Class Shares (2,175) (2,725) (16,497) (31,620)Retail Class Shares (2,740) (3,279) (5,068) (4,021)
Total Distributions to Shareholders (4,915) (6,004) (21,565) (35,641)
Capital Share Transactions:Institutional Class Shares:
Shares Issued 1,857 1,380 5,897 49,014Shares Issued as Reinvestment of Distributions 2,165 2,713 15,879 20,487Shares Redeemed (480) (5,370) (14,014) (98,254)
Net Increase (Decrease) in Net Assets from Institutional Class Shares Transactions 3,542 (1,277) 7,762 (28,753)
Retail Class Shares:Shares Issued 7,214 4,641 717 3,079Shares Issued as Reinvestment of Distributions 2,666 3,128 4,976 3,577
Shares Redeemed (5,723) (9,090) (2,544) (7,697)
Net Increase (Decrease) in Net Assets from Retail Class Shares Transactions 4,157 (1,321) 3,149 (1,041)
Net Increase (Decrease) in Net Assets from Capital Share Transactions 7,699 (2,598) 10,911 (29,794)
Net Increase (Decrease) in Net Assets 16,820 9,787 (3,948) (49,515)Net Assets:Beginning of period 64,094 54,307 42,930 92,445
End of period $ 80,914 $ 64,094 $ 38,982 $ 42,930Shares Issued and Redeemed:Institutional Class Shares:
Shares Issued 58 58 834 5,272Shares Issued as Reinvestment of Distributions 71 127 3,400 2,906Shares Redeemed (15) (251) (2,410) (12,972)
Net Increase (Decrease) in Institutional Class Shares 114 (66) 1,824 (4,794)
Retail Class Shares:
Shares Issued 232 203 113 334Shares Issued as Reinvestment of Distributions 90 150 1,149 526Shares Redeemed (180) (429) (506) (1,037)
Net Increase (Decrease) in Retail Class Shares 142 (76) 756 (177)
Net Increase (Decrease) in Share Transactions 256 (142) 2,580 (4,971)
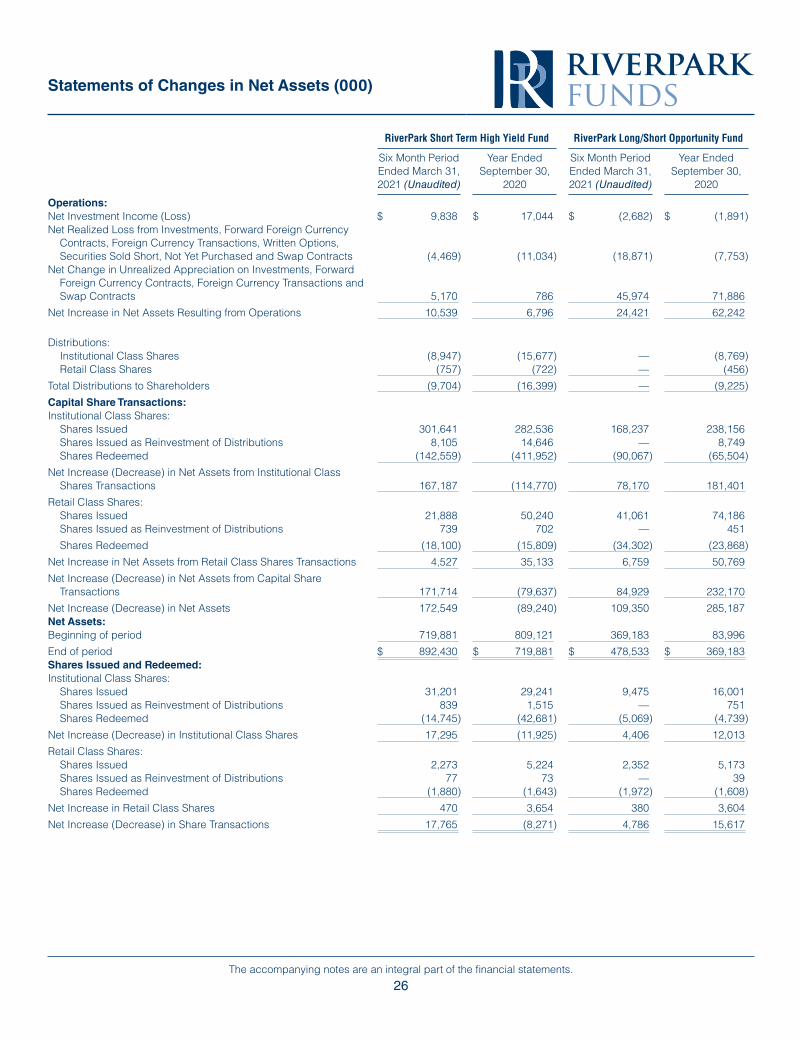
Statements of Changes in Net Assets (000)
26The accompanying notes are an integral part of the financial statements.
RiverPark Short Term High Yield Fund RiverPark Long/Short Opportunity Fund
Six Month Period Ended March 31, 2021 (Unaudited)
Year Ended September 30,
2020
Six Month Period Ended March 31, 2021 (Unaudited)
Year Ended September 30,
2020
Operations:Net Investment Income (Loss) $ 9,838 $ 17,044 $ (2,682) $ (1,891)Net Realized Loss from Investments, Forward Foreign Currency
Contracts, Foreign Currency Transactions, Written Options, Securities Sold Short, Not Yet Purchased and Swap Contracts (4,469) (11,034) (18,871) (7,753)
Net Change in Unrealized Appreciation on Investments, Forward Foreign Currency Contracts, Foreign Currency Transactions and Swap Contracts 5,170 786 45,974 71,886
Net Increase in Net Assets Resulting from Operations 10,539 6,796 24,421 62,242
Distributions:Institutional Class Shares (8,947) (15,677) — (8,769)Retail Class Shares (757) (722) — (456)
Total Distributions to Shareholders (9,704) (16,399) — (9,225)
Capital Share Transactions:Institutional Class Shares:
Shares Issued 301,641 282,536 168,237 238,156Shares Issued as Reinvestment of Distributions 8,105 14,646 — 8,749Shares Redeemed (142,559) (411,952) (90,067) (65,504)
Net Increase (Decrease) in Net Assets from Institutional Class Shares Transactions 167,187 (114,770) 78,170 181,401
Retail Class Shares:Shares Issued 21,888 50,240 41,061 74,186Shares Issued as Reinvestment of Distributions 739 702 — 451
Shares Redeemed (18,100) (15,809) (34,302) (23,868)
Net Increase in Net Assets from Retail Class Shares Transactions 4,527 35,133 6,759 50,769
Net Increase (Decrease) in Net Assets from Capital Share Transactions 171,714 (79,637) 84,929 232,170
Net Increase (Decrease) in Net Assets 172,549 (89,240) 109,350 285,187Net Assets:Beginning of period 719,881 809,121 369,183 83,996
End of period $ 892,430 $ 719,881 $ 478,533 $ 369,183Shares Issued and Redeemed:Institutional Class Shares:
Shares Issued 31,201 29,241 9,475 16,001Shares Issued as Reinvestment of Distributions 839 1,515 — 751Shares Redeemed (14,745) (42,681) (5,069) (4,739)
Net Increase (Decrease) in Institutional Class Shares 17,295 (11,925) 4,406 12,013
Retail Class Shares:Shares Issued 2,273 5,224 2,352 5,173Shares Issued as Reinvestment of Distributions 77 73 — 39Shares Redeemed (1,880) (1,643) (1,972) (1,608)
Net Increase in Retail Class Shares 470 3,654 380 3,604
Net Increase (Decrease) in Share Transactions 17,765 (8,271) 4,786 15,617
Statements of Changes in Net Assets (000)
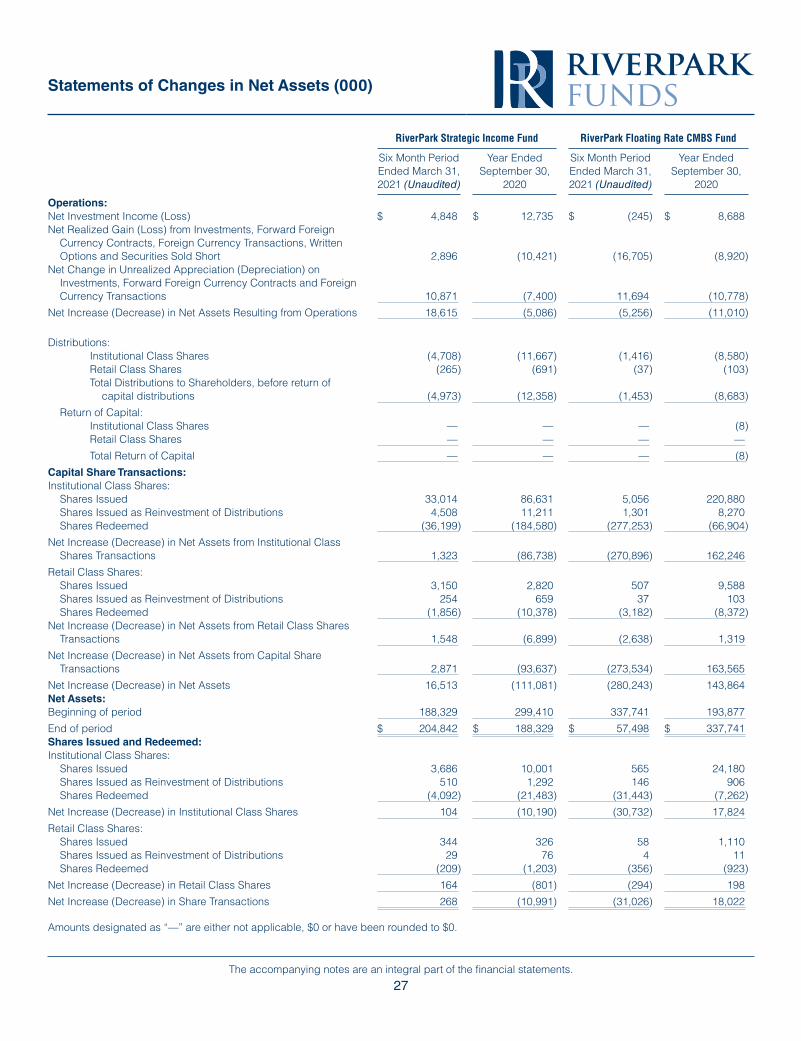
27The accompanying notes are an integral part of the financial statements.
RiverPark Strategic Income Fund RiverPark Floating Rate CMBS Fund
Six Month Period Ended March 31, 2021 (Unaudited)
Year Ended September 30,
2020
Six Month Period Ended March 31, 2021 (Unaudited)
Year Ended September 30,
2020
Operations:Net Investment Income (Loss) $ 4,848 $ 12,735 $ (245) $ 8,688Net Realized Gain (Loss) from Investments, Forward Foreign
Currency Contracts, Foreign Currency Transactions, Written Options and Securities Sold Short 2,896 (10,421) (16,705) (8,920)
Net Change in Unrealized Appreciation (Depreciation) on Investments, Forward Foreign Currency Contracts and Foreign Currency Transactions 10,871 (7,400) 11,694 (10,778)
Net Increase (Decrease) in Net Assets Resulting from Operations 18,615 (5,086) (5,256) (11,010)
Distributions:Institutional Class Shares (4,708) (11,667) (1,416) (8,580)Retail Class Shares (265) (691) (37) (103)Total Distributions to Shareholders, before return of
capital distributions (4,973) (12,358) (1,453) (8,683)
Return of Capital:Institutional Class Shares — — — (8)Retail Class Shares — — — —
Total Return of Capital — — — (8)
Capital Share Transactions:Institutional Class Shares:
Shares Issued 33,014 86,631 5,056 220,880Shares Issued as Reinvestment of Distributions 4,508 11,211 1,301 8,270Shares Redeemed (36,199) (184,580) (277,253) (66,904)
Net Increase (Decrease) in Net Assets from Institutional Class Shares Transactions 1,323 (86,738) (270,896) 162,246
Retail Class Shares:Shares Issued 3,150 2,820 507 9,588Shares Issued as Reinvestment of Distributions 254 659 37 103Shares Redeemed (1,856) (10,378) (3,182) (8,372)
Net Increase (Decrease) in Net Assets from Retail Class Shares Transactions 1,548 (6,899) (2,638) 1,319
Net Increase (Decrease) in Net Assets from Capital Share Transactions 2,871 (93,637) (273,534) 163,565
Net Increase (Decrease) in Net Assets 16,513 (111,081) (280,243) 143,864Net Assets:Beginning of period 188,329 299,410 337,741 193,877
End of period $ 204,842 $ 188,329 $ 57,498 $ 337,741Shares Issued and Redeemed:Institutional Class Shares:
Shares Issued 3,686 10,001 565 24,180Shares Issued as Reinvestment of Distributions 510 1,292 146 906Shares Redeemed (4,092) (21,483) (31,443) (7,262)
Net Increase (Decrease) in Institutional Class Shares 104 (10,190) (30,732) 17,824
Retail Class Shares:Shares Issued 344 326 58 1,110Shares Issued as Reinvestment of Distributions 29 76 4 11Shares Redeemed (209) (1,203) (356) (923)
Net Increase (Decrease) in Retail Class Shares 164 (801) (294) 198
Net Increase (Decrease) in Share Transactions 268 (10,991) (31,026) 18,022
Amounts designated as “—” are either not applicable, $0 or have been rounded to $0.
Statements of Changes in Net Assets (000)
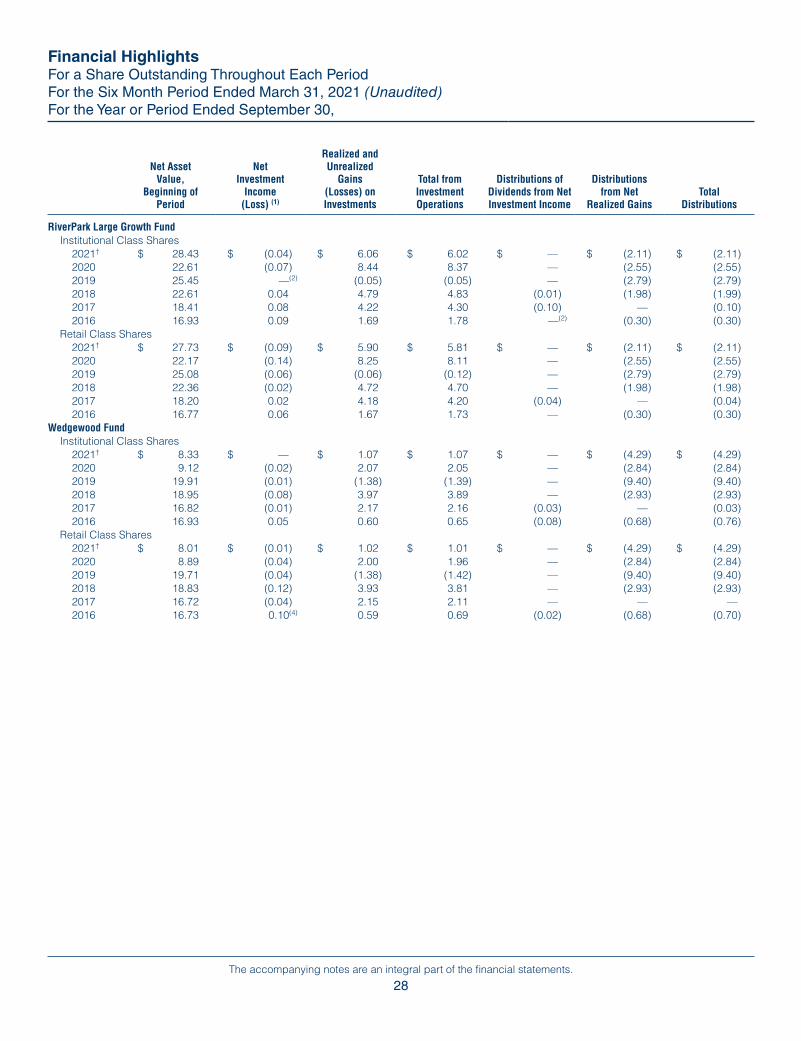
28The accompanying notes are an integral part of the financial statements.
Net Asset Value,
Beginning of Period
Net Investment
Income (Loss) (1)
Realized and Unrealized
Gains (Losses) on Investments
Total from Investment Operations
Distributions of Dividends from Net Investment Income
Distributions from Net
Realized GainsTotal
Distributions
Net Asset Value, End of
Period Total Return*Net Assets, End of Period (000)
Ratio of Net Expenses to
Average Net Assets
Ratio of Total Expenses to Average Net
Assets, Excluding Advisor Waiver
Recapture
Ratio of Net Investment Income (Loss) to Average
Net AssetsPortfolio
Turnover Rate
RiverPark Large Growth FundInstitutional Class Shares
2021† $ 28.43 $ (0.04) $ 6.06 $ 6.02 $ — $ (2.11) $ (2.11) $ 32.34 21.63%‡ $ 37,009 0.91% 0.91% (0.27)% 26%2020 22.61 (0.07) 8.44 8.37 — (2.55) (2.55) 28.43 40.78 29,296 0.93 0.93 (0.30) 532019 25.45 —(2) (0.05) (0.05) — (2.79) (2.79) 22.61 2.18 24,786 0.95 0.95 0.00 582018 22.61 0.04 4.79 4.83 (0.01) (1.98) (1.99) 25.45 22.68 24,197 0.95 0.95 0.16 352017 18.41 0.08 4.22 4.30 (0.10) — (0.10) 22.61 23.47 18,451 0.93 0.93 0.39 132016 16.93 0.09 1.69 1.78 —(2) (0.30) (0.30) 18.41 10.58 34,056 0.98(3) 0.90 0.54 33
Retail Class Shares2021† $ 27.73 $ (0.09) $ 5.90 $ 5.81 $ — $ (2.11) $ (2.11) $ 31.43 21.41%‡ $ 43,905 1.20% 1.20% (0.56)% 26%2020 22.17 (0.14) 8.25 8.11 — (2.55) (2.55) 27.73 40.38 34,798 1.23 1.23 (0.59) 532019 25.08 (0.06) (0.06) (0.12) — (2.79) (2.79) 22.17 1.91 29,521 1.23 1.23 (0.27) 582018 22.36 (0.02) 4.72 4.70 — (1.98) (1.98) 25.08 22.34 31,457 1.23 1.23 (0.11) 352017 18.20 0.02 4.18 4.20 (0.04) — (0.04) 22.36 23.15 28,823 1.22 1.22 0.08 132016 16.77 0.06 1.67 1.73 — (0.30) (0.30) 18.20 10.36 30,793 1.17(3) 1.11 0.37 33
Wedgewood FundInstitutional Class Shares
2021† $ 8.33 $ — $ 1.07 $ 1.07 $ — $ (4.29) $ (4.29) $ 5.11 17.66%‡ $ 29,743 0.97% 0.97% (0.10)% 9%2020 9.12 (0.02) 2.07 2.05 — (2.84) (2.84) 8.33 28.14 33,324 0.86 0.86 (0.23) 752019 19.91 (0.01) (1.38) (1.39) — (9.40) (9.40) 9.12 2.63 80,209 0.86 0.86 (0.07) 282018 18.95 (0.08) 3.97 3.89 — (2.93) (2.93) 19.91 22.69 232,068 0.92 0.92 (0.41) 212017 16.82 (0.01) 2.17 2.16 (0.03) — (0.03) 18.95 12.85 558,476 0.85 0.85 (0.03) 312016 16.93 0.05 0.60 0.65 (0.08) (0.68) (0.76) 16.82 3.88 1,489,036 0.82 0.82 0.28 24
Retail Class Shares2021† $ 8.01 $ (0.01) $ 1.02 $ 1.01 $ — $ (4.29) $ (4.29) $ 4.73 17.52%‡ $ 9,239 1.24% 1.24% (0.37)% 9%2020 8.89 (0.04) 2.00 1.96 — (2.84) (2.84) 8.01 27.74 9,606 1.13 1.13 (0.51) 752019 19.71 (0.04) (1.38) (1.42) — (9.40) (9.40) 8.89 2.34 12,236 1.13 1.13 (0.34) 282018 18.83 (0.12) 3.93 3.81 — (2.93) (2.93) 19.71 22.37 29,275 1.15 1.15 (0.65) 212017 16.72 (0.04) 2.15 2.11 — — — 18.83 12.62 42,956 1.08 1.08 (0.20) 312016 16.73 0.10(4) 0.59 0.69 (0.02) (0.68) (0.70) 16.72 4.13(5) 53,763 0.54(6) 0.54(6) 0.58(7) 24
Financial HighlightsFor a Share Outstanding Throughout Each Period For the Six Month Period Ended March 31, 2021 (Unaudited) For the Year or Period Ended September 30,
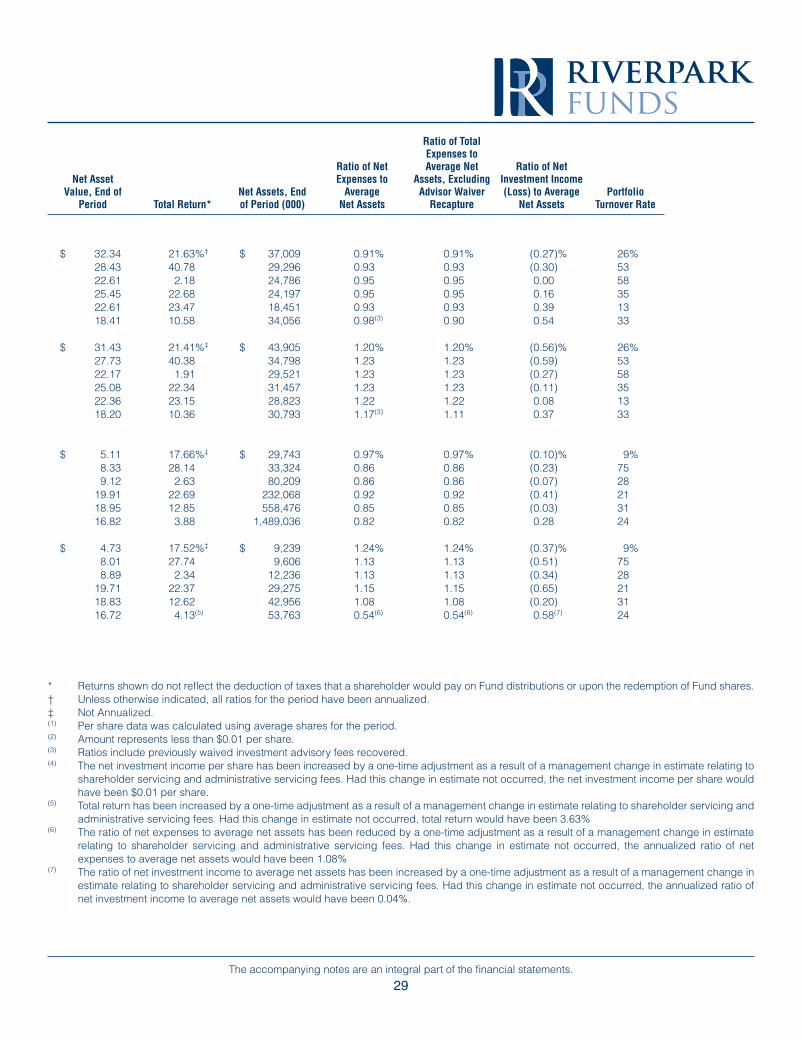
29The accompanying notes are an integral part of the financial statements.
Net Asset Value,
Beginning of Period
Net Investment
Income (Loss) (1)
Realized and Unrealized
Gains (Losses) on Investments
Total from Investment Operations
Distributions of Dividends from Net Investment Income
Distributions from Net
Realized GainsTotal
Distributions
Net Asset Value, End of
Period Total Return*Net Assets, End of Period (000)
Ratio of Net Expenses to
Average Net Assets
Ratio of Total Expenses to Average Net
Assets, Excluding Advisor Waiver
Recapture
Ratio of Net Investment Income (Loss) to Average
Net AssetsPortfolio
Turnover Rate
RiverPark Large Growth FundInstitutional Class Shares
2021† $ 28.43 $ (0.04) $ 6.06 $ 6.02 $ — $ (2.11) $ (2.11) $ 32.34 21.63%‡ $ 37,009 0.91% 0.91% (0.27)% 26%2020 22.61 (0.07) 8.44 8.37 — (2.55) (2.55) 28.43 40.78 29,296 0.93 0.93 (0.30) 532019 25.45 —(2) (0.05) (0.05) — (2.79) (2.79) 22.61 2.18 24,786 0.95 0.95 0.00 582018 22.61 0.04 4.79 4.83 (0.01) (1.98) (1.99) 25.45 22.68 24,197 0.95 0.95 0.16 352017 18.41 0.08 4.22 4.30 (0.10) — (0.10) 22.61 23.47 18,451 0.93 0.93 0.39 132016 16.93 0.09 1.69 1.78 —(2) (0.30) (0.30) 18.41 10.58 34,056 0.98(3) 0.90 0.54 33
Retail Class Shares2021† $ 27.73 $ (0.09) $ 5.90 $ 5.81 $ — $ (2.11) $ (2.11) $ 31.43 21.41%‡ $ 43,905 1.20% 1.20% (0.56)% 26%2020 22.17 (0.14) 8.25 8.11 — (2.55) (2.55) 27.73 40.38 34,798 1.23 1.23 (0.59) 532019 25.08 (0.06) (0.06) (0.12) — (2.79) (2.79) 22.17 1.91 29,521 1.23 1.23 (0.27) 582018 22.36 (0.02) 4.72 4.70 — (1.98) (1.98) 25.08 22.34 31,457 1.23 1.23 (0.11) 352017 18.20 0.02 4.18 4.20 (0.04) — (0.04) 22.36 23.15 28,823 1.22 1.22 0.08 132016 16.77 0.06 1.67 1.73 — (0.30) (0.30) 18.20 10.36 30,793 1.17(3) 1.11 0.37 33
Wedgewood FundInstitutional Class Shares
2021† $ 8.33 $ — $ 1.07 $ 1.07 $ — $ (4.29) $ (4.29) $ 5.11 17.66%‡ $ 29,743 0.97% 0.97% (0.10)% 9%2020 9.12 (0.02) 2.07 2.05 — (2.84) (2.84) 8.33 28.14 33,324 0.86 0.86 (0.23) 752019 19.91 (0.01) (1.38) (1.39) — (9.40) (9.40) 9.12 2.63 80,209 0.86 0.86 (0.07) 282018 18.95 (0.08) 3.97 3.89 — (2.93) (2.93) 19.91 22.69 232,068 0.92 0.92 (0.41) 212017 16.82 (0.01) 2.17 2.16 (0.03) — (0.03) 18.95 12.85 558,476 0.85 0.85 (0.03) 312016 16.93 0.05 0.60 0.65 (0.08) (0.68) (0.76) 16.82 3.88 1,489,036 0.82 0.82 0.28 24
Retail Class Shares2021† $ 8.01 $ (0.01) $ 1.02 $ 1.01 $ — $ (4.29) $ (4.29) $ 4.73 17.52%‡ $ 9,239 1.24% 1.24% (0.37)% 9%2020 8.89 (0.04) 2.00 1.96 — (2.84) (2.84) 8.01 27.74 9,606 1.13 1.13 (0.51) 752019 19.71 (0.04) (1.38) (1.42) — (9.40) (9.40) 8.89 2.34 12,236 1.13 1.13 (0.34) 282018 18.83 (0.12) 3.93 3.81 — (2.93) (2.93) 19.71 22.37 29,275 1.15 1.15 (0.65) 212017 16.72 (0.04) 2.15 2.11 — — — 18.83 12.62 42,956 1.08 1.08 (0.20) 312016 16.73 0.10(4) 0.59 0.69 (0.02) (0.68) (0.70) 16.72 4.13(5) 53,763 0.54(6) 0.54(6) 0.58(7) 24
* Returns shown do not reflect the deduction of taxes that a shareholder would pay on Fund distributions or upon the redemption of Fund shares.† Unless otherwise indicated, all ratios for the period have been annualized.‡ Not Annualized.(1) Per share data was calculated using average shares for the period.(2) Amount represents less than $0.01 per share.(3) Ratios include previously waived investment advisory fees recovered.(4) The net investment income per share has been increased by a one-time adjustment as a result of a management change in estimate relating to
shareholder servicing and administrative servicing fees. Had this change in estimate not occurred, the net investment income per share would have been $0.01 per share.
(5) Total return has been increased by a one-time adjustment as a result of a management change in estimate relating to shareholder servicing and administrative servicing fees. Had this change in estimate not occurred, total return would have been 3.63%
(6) The ratio of net expenses to average net assets has been reduced by a one-time adjustment as a result of a management change in estimate relating to shareholder servicing and administrative servicing fees. Had this change in estimate not occurred, the annualized ratio of net expenses to average net assets would have been 1.08%
(7) The ratio of net investment income to average net assets has been increased by a one-time adjustment as a result of a management change in estimate relating to shareholder servicing and administrative servicing fees. Had this change in estimate not occurred, the annualized ratio of net investment income to average net assets would have been 0.04%.
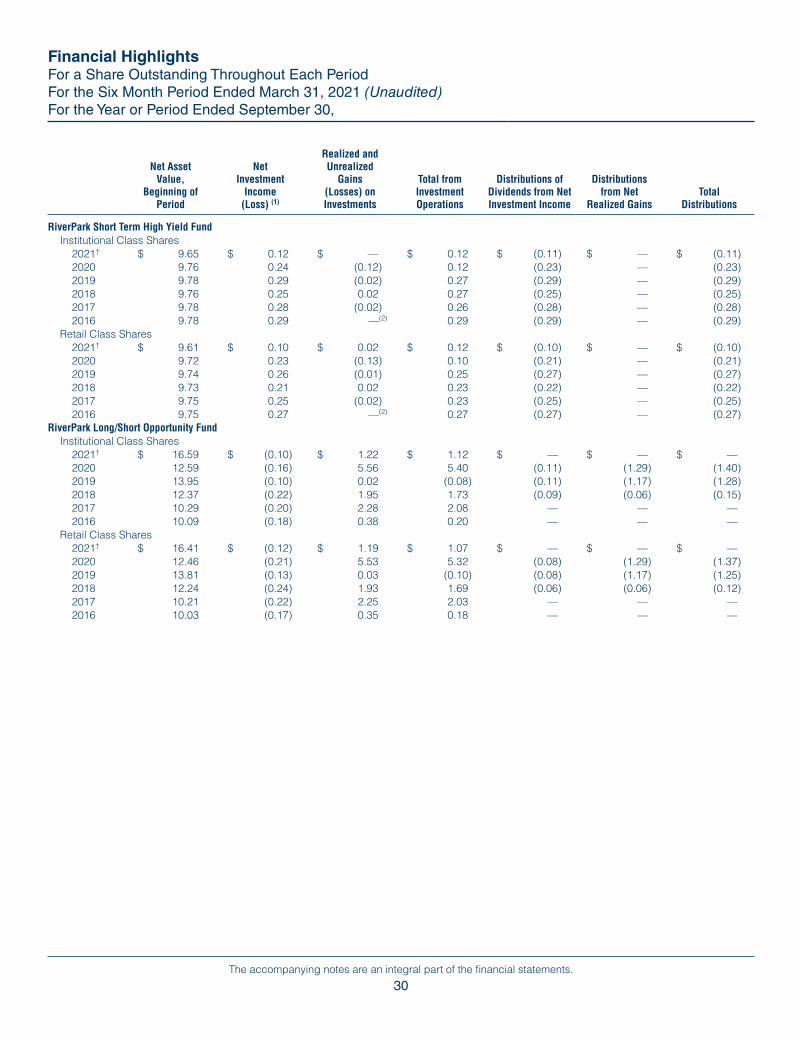
30The accompanying notes are an integral part of the financial statements.
Net Asset Value,
Beginning of Period
Net Investment
Income (Loss) (1)
Realized and Unrealized
Gains (Losses) on Investments
Total from Investment Operations
Distributions of Dividends from Net Investment Income
Distributions from Net
Realized GainsTotal
Distributions
Net Asset Value, End of
Period Total Return*Net Assets, End of Period (000)
Ratio of Net Expenses to
Average Net Assets
Ratio of Total Expenses to Average Net
Assets, Excluding Advisor Waiver
Recapture
Ratio of Net Investment Income (Loss) to Average
Net AssetsPortfolio
Turnover Rate
RiverPark Short Term High Yield FundInstitutional Class Shares
2021† $ 9.65 $ 0.12 $ — $ 0.12 $ (0.11) $ — $ (0.11) $ 9.66 1.28%‡ $ 821,822 0.90% 0.90% 2.42% 111%2020 9.76 0.24 (0.12) 0.12 (0.23) — (0.23) 9.65 1.26 653,883 0.90 0.90 2.45 2662019 9.78 0.29 (0.02) 0.27 (0.29) — (0.29) 9.76 2.81 777,925 0.88 0.88 2.96 1122018 9.76 0.25 0.02 0.27 (0.25) — (0.25) 9.78 2.79 863,978 0.89 0.89 2.57 1932017 9.78 0.28 (0.02) 0.26 (0.28) — (0.28) 9.76 2.67 749,232 0.87 0.87 2.89 1942016 9.78 0.29 —(2) 0.29 (0.29) — (0.29) 9.78 3.05 606,510 0.84 0.84 2.98 114
Retail Class Shares2021† $ 9.61 $ 0.10 $ 0.02 $ 0.12 $ (0.10) $ — $ (0.10) $ 9.63 1.27%‡ $ 70,608 1.17% 1.17% 2.13% 111%2020 9.72 0.23 (0.13) 0.10 (0.21) — (0.21) 9.61 1.01 65,998 1.05 1.05 2.35 2662019 9.74 0.26 (0.01) 0.25 (0.27) — (0.27) 9.72 2.56 31,196 1.18 1.18 2.68 1122018 9.73 0.21 0.02 0.23 (0.22) — (0.22) 9.74 2.53 49,619 1.18 1.18 2.16 1932017 9.75 0.25 (0.02) 0.23 (0.25) — (0.25) 9.73 2.42 115,916 1.16 1.16 2.53 1942016 9.75 0.27 —(2) 0.27 (0.27) — (0.27) 9.75 2.81 275,037 1.08 1.08 2.74 114
RiverPark Long/Short Opportunity FundInstitutional Class Shares
2021† $ 16.59 $ (0.10) $ 1.22 $ 1.12 $ — $ — $ — $ 17.71 6.75%‡ $ 403,245 1.74% 1.74% (1.14)% 23%2020 12.59 (0.16) 5.56 5.40 (0.11) (1.29) (1.40) 16.59 47.71 304,772 1.75 1.75 (1.12) 282019 13.95 (0.10) 0.02 (0.08) (0.11) (1.17) (1.28) 12.59 0.75 79,984 2.18(3) 2.18 (0.83) 632018 12.37 (0.22) 1.95 1.73 (0.09) (0.06) (0.15) 13.95 14.19(4) 102,042 3.28(5) 3.28 (1.67) 592017 10.29 (0.20) 2.28 2.08 — — — 12.37 20.21 85,001 3.17(6) 3.17 (1.81) 242016 10.09 (0.18) 0.38 0.20 — — — 10.29 1.98 104,030 3.13(7)(8) 3.12 (1.75) 40
Retail Class Shares2021† $ 16.41 $ (0.12) $ 1.19 $ 1.07 $ — $ — $ — $ 17.48 6.52%‡ $ 75,288 2.00% 2.03% (1.40)% 23%2020 12.46 (0.21) 5.53 5.32 (0.08) (1.29) (1.37) 16.41 47.47 64,411 2.00 2.03 (1.41) 282019 13.81 (0.13) 0.03 (0.10) (0.08) (1.17) (1.25) 12.46 0.50 4,012 2.38(3) 2.48 (1.04) 632018 12.24 (0.24) 1.93 1.69 (0.06) (0.06) (0.12) 13.81 14.06(4) 4,309 3.48(5) 3.58 (1.86) 592017 10.21 (0.22) 2.25 2.03 — — — 12.24 19.88 3,492 3.38(6) 3.49 (2.03) 242016 10.03 (0.17) 0.35 0.18 — — — 10.21 1.79 3,824 3.33(7)(8) 3.31 (1.70) 40
Financial HighlightsFor a Share Outstanding Throughout Each Period For the Six Month Period Ended March 31, 2021 (Unaudited) For the Year or Period Ended September 30,
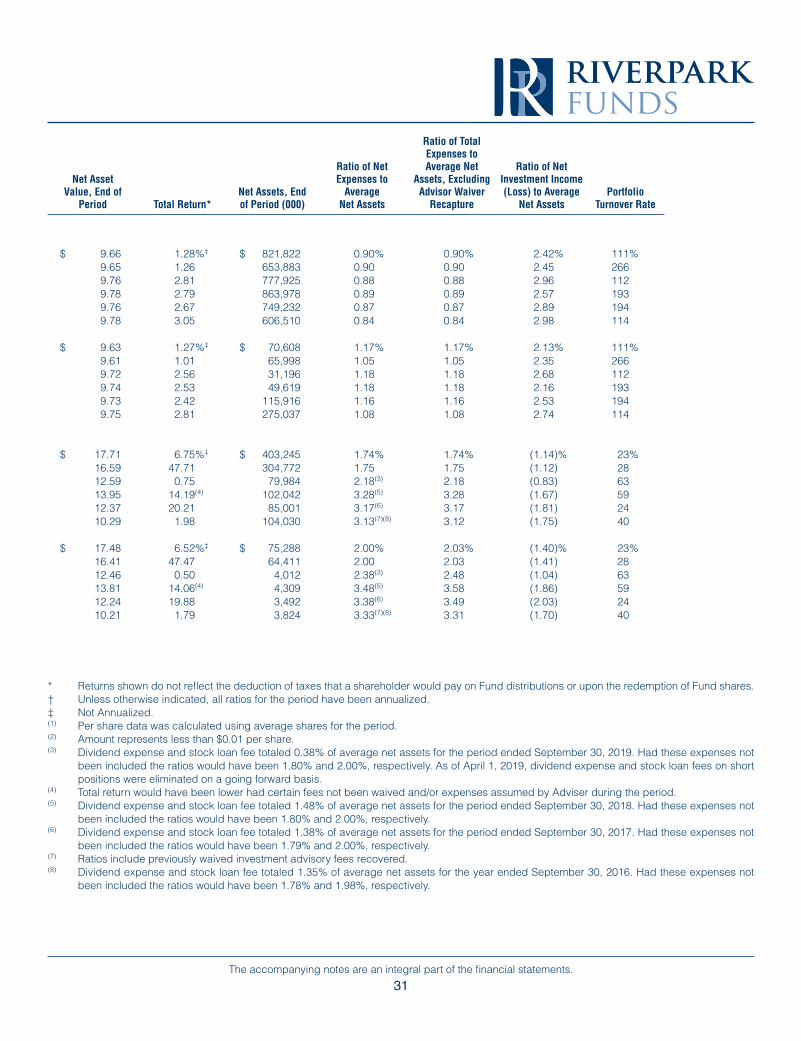
31The accompanying notes are an integral part of the financial statements.
Net Asset Value,
Beginning of Period
Net Investment
Income (Loss) (1)
Realized and Unrealized
Gains (Losses) on Investments
Total from Investment Operations
Distributions of Dividends from Net Investment Income
Distributions from Net
Realized GainsTotal
Distributions
Net Asset Value, End of
Period Total Return*Net Assets, End of Period (000)
Ratio of Net Expenses to
Average Net Assets
Ratio of Total Expenses to Average Net
Assets, Excluding Advisor Waiver
Recapture
Ratio of Net Investment Income (Loss) to Average
Net AssetsPortfolio
Turnover Rate
RiverPark Short Term High Yield FundInstitutional Class Shares
2021† $ 9.65 $ 0.12 $ — $ 0.12 $ (0.11) $ — $ (0.11) $ 9.66 1.28%‡ $ 821,822 0.90% 0.90% 2.42% 111%2020 9.76 0.24 (0.12) 0.12 (0.23) — (0.23) 9.65 1.26 653,883 0.90 0.90 2.45 2662019 9.78 0.29 (0.02) 0.27 (0.29) — (0.29) 9.76 2.81 777,925 0.88 0.88 2.96 1122018 9.76 0.25 0.02 0.27 (0.25) — (0.25) 9.78 2.79 863,978 0.89 0.89 2.57 1932017 9.78 0.28 (0.02) 0.26 (0.28) — (0.28) 9.76 2.67 749,232 0.87 0.87 2.89 1942016 9.78 0.29 —(2) 0.29 (0.29) — (0.29) 9.78 3.05 606,510 0.84 0.84 2.98 114
Retail Class Shares2021† $ 9.61 $ 0.10 $ 0.02 $ 0.12 $ (0.10) $ — $ (0.10) $ 9.63 1.27%‡ $ 70,608 1.17% 1.17% 2.13% 111%2020 9.72 0.23 (0.13) 0.10 (0.21) — (0.21) 9.61 1.01 65,998 1.05 1.05 2.35 2662019 9.74 0.26 (0.01) 0.25 (0.27) — (0.27) 9.72 2.56 31,196 1.18 1.18 2.68 1122018 9.73 0.21 0.02 0.23 (0.22) — (0.22) 9.74 2.53 49,619 1.18 1.18 2.16 1932017 9.75 0.25 (0.02) 0.23 (0.25) — (0.25) 9.73 2.42 115,916 1.16 1.16 2.53 1942016 9.75 0.27 —(2) 0.27 (0.27) — (0.27) 9.75 2.81 275,037 1.08 1.08 2.74 114
RiverPark Long/Short Opportunity FundInstitutional Class Shares
2021† $ 16.59 $ (0.10) $ 1.22 $ 1.12 $ — $ — $ — $ 17.71 6.75%‡ $ 403,245 1.74% 1.74% (1.14)% 23%2020 12.59 (0.16) 5.56 5.40 (0.11) (1.29) (1.40) 16.59 47.71 304,772 1.75 1.75 (1.12) 282019 13.95 (0.10) 0.02 (0.08) (0.11) (1.17) (1.28) 12.59 0.75 79,984 2.18(3) 2.18 (0.83) 632018 12.37 (0.22) 1.95 1.73 (0.09) (0.06) (0.15) 13.95 14.19(4) 102,042 3.28(5) 3.28 (1.67) 592017 10.29 (0.20) 2.28 2.08 — — — 12.37 20.21 85,001 3.17(6) 3.17 (1.81) 242016 10.09 (0.18) 0.38 0.20 — — — 10.29 1.98 104,030 3.13(7)(8) 3.12 (1.75) 40
Retail Class Shares2021† $ 16.41 $ (0.12) $ 1.19 $ 1.07 $ — $ — $ — $ 17.48 6.52%‡ $ 75,288 2.00% 2.03% (1.40)% 23%2020 12.46 (0.21) 5.53 5.32 (0.08) (1.29) (1.37) 16.41 47.47 64,411 2.00 2.03 (1.41) 282019 13.81 (0.13) 0.03 (0.10) (0.08) (1.17) (1.25) 12.46 0.50 4,012 2.38(3) 2.48 (1.04) 632018 12.24 (0.24) 1.93 1.69 (0.06) (0.06) (0.12) 13.81 14.06(4) 4,309 3.48(5) 3.58 (1.86) 592017 10.21 (0.22) 2.25 2.03 — — — 12.24 19.88 3,492 3.38(6) 3.49 (2.03) 242016 10.03 (0.17) 0.35 0.18 — — — 10.21 1.79 3,824 3.33(7)(8) 3.31 (1.70) 40
* Returns shown do not reflect the deduction of taxes that a shareholder would pay on Fund distributions or upon the redemption of Fund shares.† Unless otherwise indicated, all ratios for the period have been annualized.‡ Not Annualized.(1) Per share data was calculated using average shares for the period.(2) Amount represents less than $0.01 per share.(3) Dividend expense and stock loan fee totaled 0.38% of average net assets for the period ended September 30, 2019. Had these expenses not
been included the ratios would have been 1.80% and 2.00%, respectively. As of April 1, 2019, dividend expense and stock loan fees on short positions were eliminated on a going forward basis.
(4) Total return would have been lower had certain fees not been waived and/or expenses assumed by Adviser during the period.(5) Dividend expense and stock loan fee totaled 1.48% of average net assets for the period ended September 30, 2018. Had these expenses not
been included the ratios would have been 1.80% and 2.00%, respectively.(6) Dividend expense and stock loan fee totaled 1.38% of average net assets for the period ended September 30, 2017. Had these expenses not
been included the ratios would have been 1.79% and 2.00%, respectively.(7) Ratios include previously waived investment advisory fees recovered.(8) Dividend expense and stock loan fee totaled 1.35% of average net assets for the year ended September 30, 2016. Had these expenses not
been included the ratios would have been 1.78% and 1.98%, respectively.
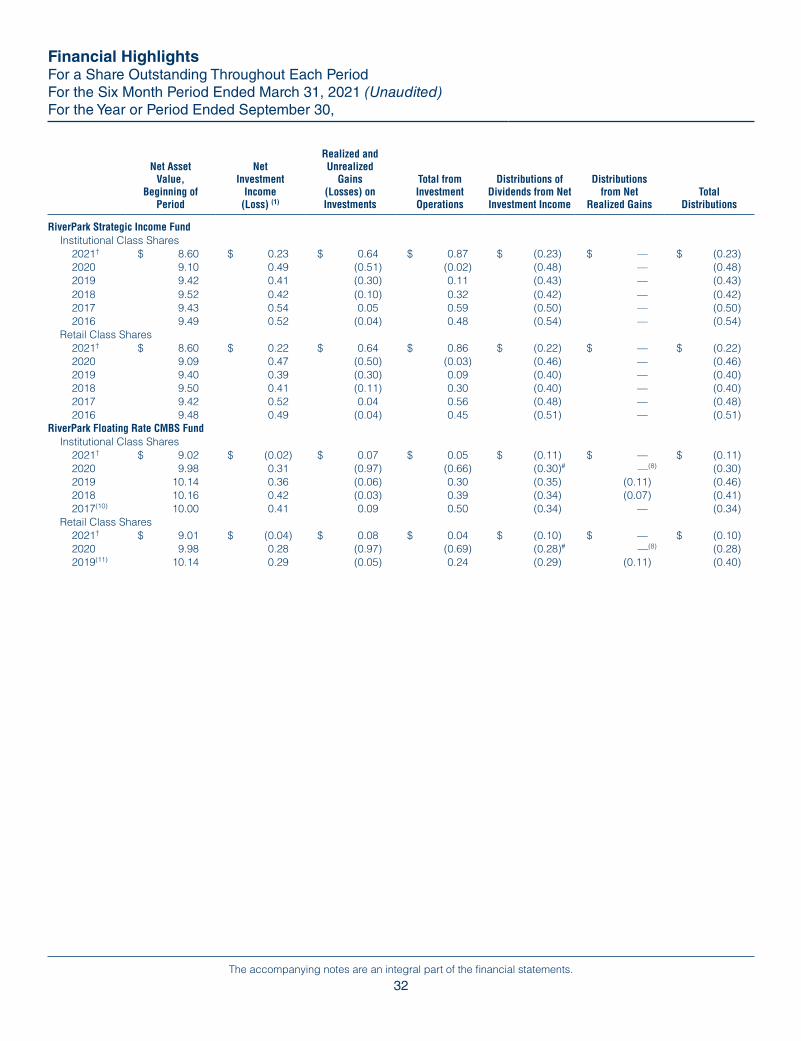
32The accompanying notes are an integral part of the financial statements.
Net Asset Value,
Beginning of Period
Net Investment
Income (Loss) (1)
Realized and Unrealized
Gains (Losses) on Investments
Total from Investment Operations
Distributions of Dividends from Net Investment Income
Distributions from Net
Realized GainsTotal
Distributions
Net Asset Value, End of
Period Total Return*Net Assets, End of Period (000)
Ratio of Net Expenses to
Average Net Assets
Ratio of Total Expenses to Average Net
Assets, Excluding Advisor Waiver
Recapture
Ratio of Net Investment Income (Loss) to Average
Net AssetsPortfolio
Turnover Rate
RiverPark Strategic Income FundInstitutional Class Shares
2021† $ 8.60 $ 0.23 $ 0.64 $ 0.87 $ (0.23) $ — $ (0.23) $ 9.24 10.32%‡ $ 192,062 1.21%(2) 1.21% 5.11% 109%2020 9.10 0.49 (0.51) (0.02) (0.48) — (0.48) 8.60 (0.10) 177,850 1.05(3) 1.05 5.58 1092019 9.42 0.41 (0.30) 0.11 (0.43) — (0.43) 9.10 1.17 281,043 1.12(4) 1.12 4.41 392018 9.52 0.42 (0.10) 0.32 (0.42) — (0.42) 9.42 3.46 348,726 1.17(5) 1.17 4.44 552017 9.43 0.54 0.05 0.59 (0.50) — (0.50) 9.52 6.39 311,573 1.00(6) 1.00 5.58 622016 9.49 0.52 (0.04) 0.48 (0.54) — (0.54) 9.43 5.34 246,474 0.93(7) 0.93 5.64 69
Retail Class Shares2021† $ 8.60 $ 0.22 $ 0.64 $ 0.86 $ (0.22) $ — $ (0.22) $ 9.24 10.32%‡ $ 12,780 1.39%(2) 1.39% 4.98% 109%2020 9.09 0.47 (0.50) (0.03) (0.46) — (0.46) 8.60 (0.36) 10,479 1.22(3) 1.22 5.40 1092019 9.40 0.39 (0.30) 0.09 (0.40) — (0.40) 9.09 1.02 18,367 1.33(4) 1.33 4.20 392018 9.50 0.41 (0.11) 0.30 (0.40) — (0.40) 9.40 3.19 38,974 1.43(5) 1.43 4.30 552017 9.42 0.52 0.04 0.56 (0.48) — (0.48) 9.50 6.01 101,579 1.29(6) 1.29 5.50 622016 9.48 0.49 (0.04) 0.45 (0.51) — (0.51) 9.42 5.08 361,203 1.24(7) 1.24 5.32 69
RiverPark Floating Rate CMBS FundInstitutional Class Shares
2021† $ 9.02 $ (0.02) $ 0.07 $ 0.05 $ (0.11) $ — $ (0.11) $ 8.96 0.56%‡ $ 56,270 0.85% 0.92% (0.38)% 21%2020 9.98 0.31 (0.97) (0.66) (0.30)# —(8) (0.30) 9.02 (6.63) 333,855 0.85 0.87 3.31 852019 10.14 0.36 (0.06) 0.30 (0.35) (0.11) (0.46) 9.98 3.15 191,548 0.90(9) 0.93 3.64 872018 10.16 0.42 (0.03) 0.39 (0.34) (0.07) (0.41) 10.14 3.79 48,130 1.00 1.00 4.12 842017(10) 10.00 0.41 0.09 0.50 (0.34) — (0.34) 10.16 5.07 58,301 1.00 1.39 4.07 10**
Retail Class Shares2021† $ 9.01 $ (0.04) $ 0.08 $ 0.04 $ (0.10) $ — $ (0.10) $ 8.95 0.43%‡ $ 1,228 1.25% 1.26% (0.81)% 21%2020 9.98 0.28 (0.97) (0.69) (0.28)# —(8) (0.28) 9.01 (6.96) 3,886 1.16 1.16 3.02 852019(11) 10.14 0.29 (0.05) 0.24 (0.29) (0.11) (0.40) 9.98 2.50 2,329 1.24 1.24 3.24 87
Financial HighlightsFor a Share Outstanding Throughout Each Period For the Six Month Period Ended March 31, 2021 (Unaudited) For the Year or Period Ended September 30,
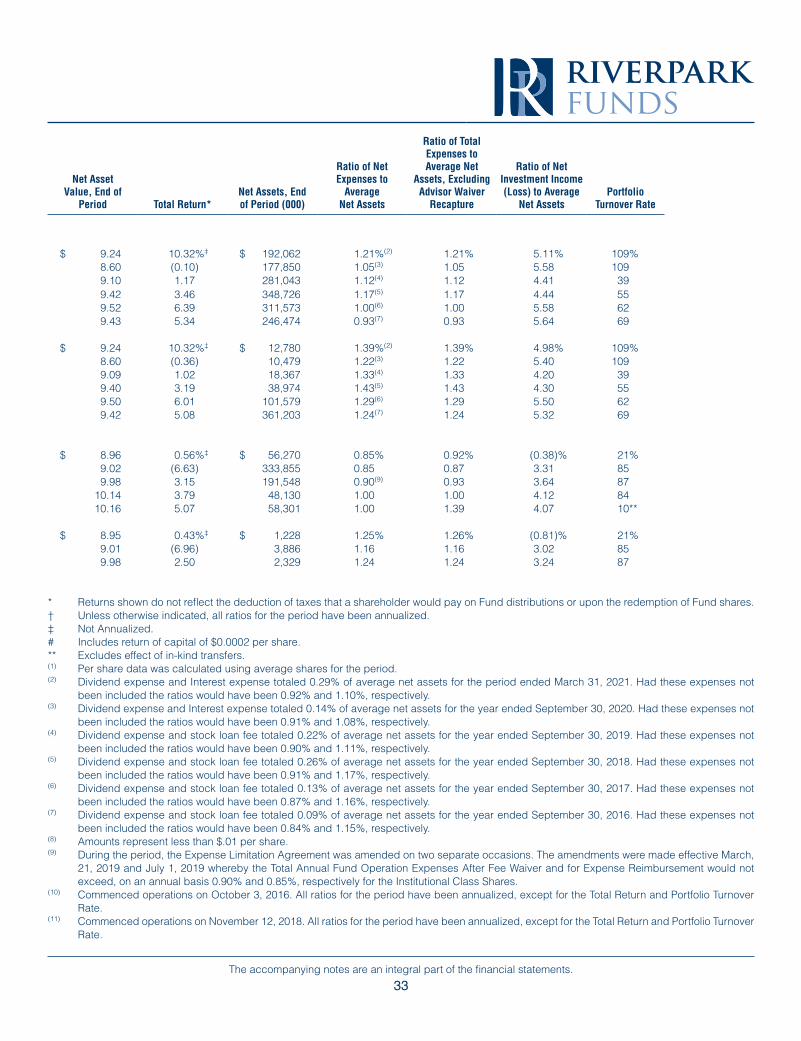
33The accompanying notes are an integral part of the financial statements.
Net Asset Value,
Beginning of Period
Net Investment
Income (Loss) (1)
Realized and Unrealized
Gains (Losses) on Investments
Total from Investment Operations
Distributions of Dividends from Net Investment Income
Distributions from Net
Realized GainsTotal
Distributions
Net Asset Value, End of
Period Total Return*Net Assets, End of Period (000)
Ratio of Net Expenses to
Average Net Assets
Ratio of Total Expenses to Average Net
Assets, Excluding Advisor Waiver
Recapture
Ratio of Net Investment Income (Loss) to Average
Net AssetsPortfolio
Turnover Rate
RiverPark Strategic Income FundInstitutional Class Shares
2021† $ 8.60 $ 0.23 $ 0.64 $ 0.87 $ (0.23) $ — $ (0.23) $ 9.24 10.32%‡ $ 192,062 1.21%(2) 1.21% 5.11% 109%2020 9.10 0.49 (0.51) (0.02) (0.48) — (0.48) 8.60 (0.10) 177,850 1.05(3) 1.05 5.58 1092019 9.42 0.41 (0.30) 0.11 (0.43) — (0.43) 9.10 1.17 281,043 1.12(4) 1.12 4.41 392018 9.52 0.42 (0.10) 0.32 (0.42) — (0.42) 9.42 3.46 348,726 1.17(5) 1.17 4.44 552017 9.43 0.54 0.05 0.59 (0.50) — (0.50) 9.52 6.39 311,573 1.00(6) 1.00 5.58 622016 9.49 0.52 (0.04) 0.48 (0.54) — (0.54) 9.43 5.34 246,474 0.93(7) 0.93 5.64 69
Retail Class Shares2021† $ 8.60 $ 0.22 $ 0.64 $ 0.86 $ (0.22) $ — $ (0.22) $ 9.24 10.32%‡ $ 12,780 1.39%(2) 1.39% 4.98% 109%2020 9.09 0.47 (0.50) (0.03) (0.46) — (0.46) 8.60 (0.36) 10,479 1.22(3) 1.22 5.40 1092019 9.40 0.39 (0.30) 0.09 (0.40) — (0.40) 9.09 1.02 18,367 1.33(4) 1.33 4.20 392018 9.50 0.41 (0.11) 0.30 (0.40) — (0.40) 9.40 3.19 38,974 1.43(5) 1.43 4.30 552017 9.42 0.52 0.04 0.56 (0.48) — (0.48) 9.50 6.01 101,579 1.29(6) 1.29 5.50 622016 9.48 0.49 (0.04) 0.45 (0.51) — (0.51) 9.42 5.08 361,203 1.24(7) 1.24 5.32 69
RiverPark Floating Rate CMBS FundInstitutional Class Shares
2021† $ 9.02 $ (0.02) $ 0.07 $ 0.05 $ (0.11) $ — $ (0.11) $ 8.96 0.56%‡ $ 56,270 0.85% 0.92% (0.38)% 21%2020 9.98 0.31 (0.97) (0.66) (0.30)# —(8) (0.30) 9.02 (6.63) 333,855 0.85 0.87 3.31 852019 10.14 0.36 (0.06) 0.30 (0.35) (0.11) (0.46) 9.98 3.15 191,548 0.90(9) 0.93 3.64 872018 10.16 0.42 (0.03) 0.39 (0.34) (0.07) (0.41) 10.14 3.79 48,130 1.00 1.00 4.12 842017(10) 10.00 0.41 0.09 0.50 (0.34) — (0.34) 10.16 5.07 58,301 1.00 1.39 4.07 10**
Retail Class Shares2021† $ 9.01 $ (0.04) $ 0.08 $ 0.04 $ (0.10) $ — $ (0.10) $ 8.95 0.43%‡ $ 1,228 1.25% 1.26% (0.81)% 21%2020 9.98 0.28 (0.97) (0.69) (0.28)# —(8) (0.28) 9.01 (6.96) 3,886 1.16 1.16 3.02 852019(11) 10.14 0.29 (0.05) 0.24 (0.29) (0.11) (0.40) 9.98 2.50 2,329 1.24 1.24 3.24 87
* Returns shown do not reflect the deduction of taxes that a shareholder would pay on Fund distributions or upon the redemption of Fund shares.† Unless otherwise indicated, all ratios for the period have been annualized.‡ Not Annualized.# Includes return of capital of $0.0002 per share.** Excludes effect of in-kind transfers.(1) Per share data was calculated using average shares for the period.(2) Dividend expense and Interest expense totaled 0.29% of average net assets for the period ended March 31, 2021. Had these expenses not
been included the ratios would have been 0.92% and 1.10%, respectively.(3) Dividend expense and Interest expense totaled 0.14% of average net assets for the year ended September 30, 2020. Had these expenses not
been included the ratios would have been 0.91% and 1.08%, respectively.(4) Dividend expense and stock loan fee totaled 0.22% of average net assets for the year ended September 30, 2019. Had these expenses not
been included the ratios would have been 0.90% and 1.11%, respectively.(5) Dividend expense and stock loan fee totaled 0.26% of average net assets for the year ended September 30, 2018. Had these expenses not
been included the ratios would have been 0.91% and 1.17%, respectively.(6) Dividend expense and stock loan fee totaled 0.13% of average net assets for the year ended September 30, 2017. Had these expenses not
been included the ratios would have been 0.87% and 1.16%, respectively.(7) Dividend expense and stock loan fee totaled 0.09% of average net assets for the year ended September 30, 2016. Had these expenses not
been included the ratios would have been 0.84% and 1.15%, respectively.(8) Amounts represent less than $.01 per share.(9) During the period, the Expense Limitation Agreement was amended on two separate occasions. The amendments were made effective March,
21, 2019 and July 1, 2019 whereby the Total Annual Fund Operation Expenses After Fee Waiver and for Expense Reimbursement would not exceed, on an annual basis 0.90% and 0.85%, respectively for the Institutional Class Shares.
(10) Commenced operations on October 3, 2016. All ratios for the period have been annualized, except for the Total Return and Portfolio Turnover Rate.
(11) Commenced operations on November 12, 2018. All ratios for the period have been annualized, except for the Total Return and Portfolio Turnover Rate.
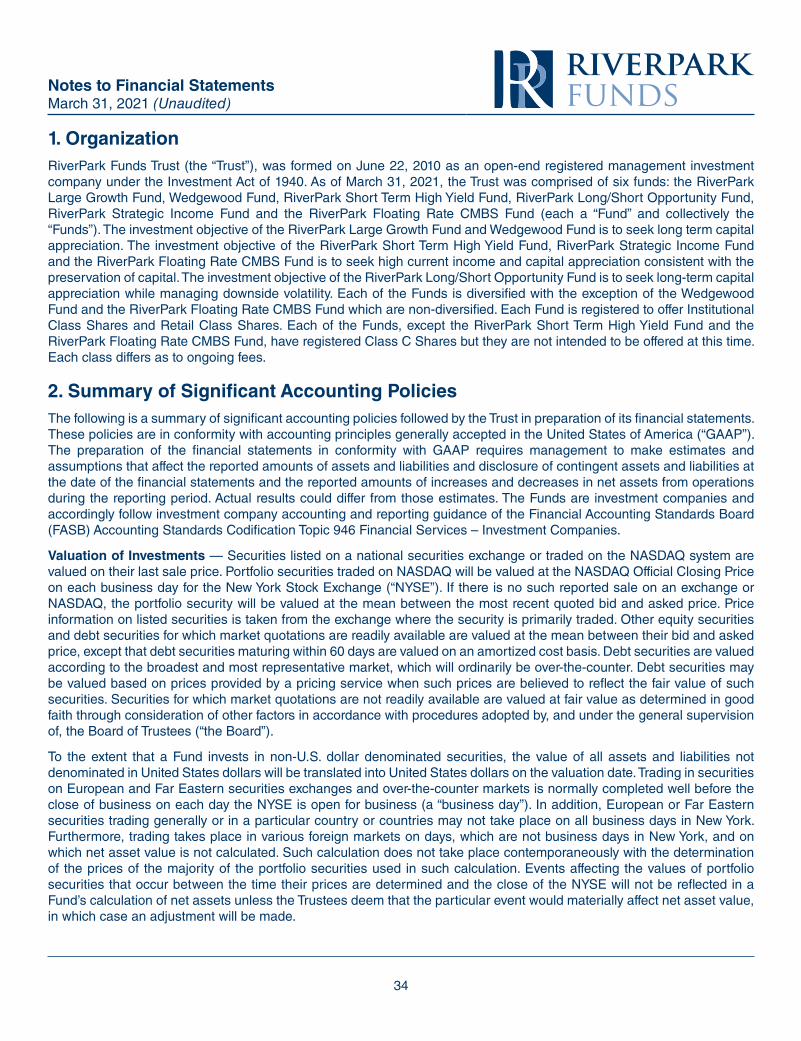
34
1. OrganizationRiverPark Funds Trust (the “Trust”), was formed on June 22, 2010 as an open-end registered management investment company under the Investment Act of 1940. As of March 31, 2021, the Trust was comprised of six funds: the RiverPark Large Growth Fund, Wedgewood Fund, RiverPark Short Term High Yield Fund, RiverPark Long/Short Opportunity Fund, RiverPark Strategic Income Fund and the RiverPark Floating Rate CMBS Fund (each a “Fund” and collectively the “Funds”). The investment objective of the RiverPark Large Growth Fund and Wedgewood Fund is to seek long term capital appreciation. The investment objective of the RiverPark Short Term High Yield Fund, RiverPark Strategic Income Fund and the RiverPark Floating Rate CMBS Fund is to seek high current income and capital appreciation consistent with the preservation of capital. The investment objective of the RiverPark Long/Short Opportunity Fund is to seek long-term capital appreciation while managing downside volatility. Each of the Funds is diversified with the exception of the Wedgewood Fund and the RiverPark Floating Rate CMBS Fund which are non-diversified. Each Fund is registered to offer Institutional Class Shares and Retail Class Shares. Each of the Funds, except the RiverPark Short Term High Yield Fund and the RiverPark Floating Rate CMBS Fund, have registered Class C Shares but they are not intended to be offered at this time. Each class differs as to ongoing fees.
2. Summary of Significant Accounting PoliciesThe following is a summary of significant accounting policies followed by the Trust in preparation of its financial statements. These policies are in conformity with accounting principles generally accepted in the United States of America (“GAAP”). The preparation of the financial statements in conformity with GAAP requires management to make estimates and assumptions that affect the reported amounts of assets and liabilities and disclosure of contingent assets and liabilities at the date of the financial statements and the reported amounts of increases and decreases in net assets from operations during the reporting period. Actual results could differ from those estimates. The Funds are investment companies and accordingly follow investment company accounting and reporting guidance of the Financial Accounting Standards Board (FASB) Accounting Standards Codification Topic 946 Financial Services – Investment Companies.
Valuation of Investments — Securities listed on a national securities exchange or traded on the NASDAQ system are valued on their last sale price. Portfolio securities traded on NASDAQ will be valued at the NASDAQ Official Closing Price on each business day for the New York Stock Exchange (“NYSE”). If there is no such reported sale on an exchange or NASDAQ, the portfolio security will be valued at the mean between the most recent quoted bid and asked price. Price information on listed securities is taken from the exchange where the security is primarily traded. Other equity securities and debt securities for which market quotations are readily available are valued at the mean between their bid and asked price, except that debt securities maturing within 60 days are valued on an amortized cost basis. Debt securities are valued according to the broadest and most representative market, which will ordinarily be over-the-counter. Debt securities may be valued based on prices provided by a pricing service when such prices are believed to reflect the fair value of such securities. Securities for which market quotations are not readily available are valued at fair value as determined in good faith through consideration of other factors in accordance with procedures adopted by, and under the general supervision of, the Board of Trustees (“the Board”).
To the extent that a Fund invests in non-U.S. dollar denominated securities, the value of all assets and liabilities not denominated in United States dollars will be translated into United States dollars on the valuation date. Trading in securities on European and Far Eastern securities exchanges and over-the-counter markets is normally completed well before the close of business on each day the NYSE is open for business (a “business day”). In addition, European or Far Eastern securities trading generally or in a particular country or countries may not take place on all business days in New York. Furthermore, trading takes place in various foreign markets on days, which are not business days in New York, and on which net asset value is not calculated. Such calculation does not take place contemporaneously with the determination of the prices of the majority of the portfolio securities used in such calculation. Events affecting the values of portfolio securities that occur between the time their prices are determined and the close of the NYSE will not be reflected in a Fund’s calculation of net assets unless the Trustees deem that the particular event would materially affect net asset value, in which case an adjustment will be made.
Notes to Financial StatementsMarch 31, 2021 (Unaudited)
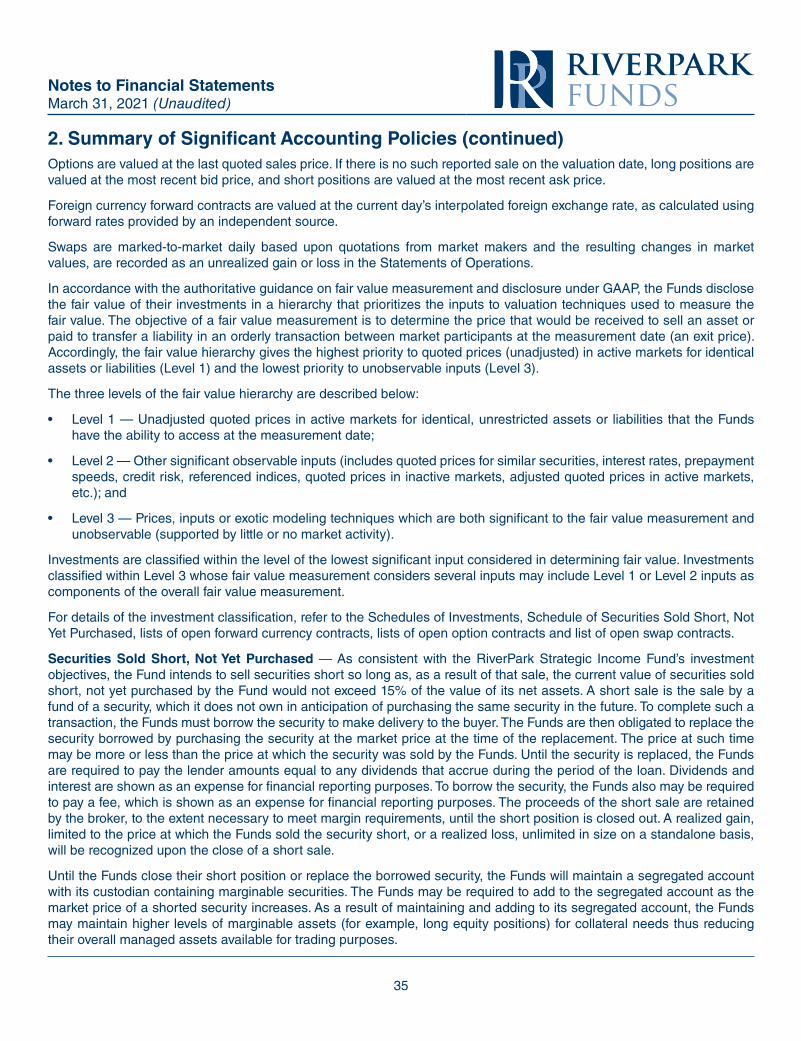
35
Options are valued at the last quoted sales price. If there is no such reported sale on the valuation date, long positions are valued at the most recent bid price, and short positions are valued at the most recent ask price.
Foreign currency forward contracts are valued at the current day’s interpolated foreign exchange rate, as calculated using forward rates provided by an independent source.
Swaps are marked-to-market daily based upon quotations from market makers and the resulting changes in market values, are recorded as an unrealized gain or loss in the Statements of Operations.
In accordance with the authoritative guidance on fair value measurement and disclosure under GAAP, the Funds disclose the fair value of their investments in a hierarchy that prioritizes the inputs to valuation techniques used to measure the fair value. The objective of a fair value measurement is to determine the price that would be received to sell an asset or paid to transfer a liability in an orderly transaction between market participants at the measurement date (an exit price). Accordingly, the fair value hierarchy gives the highest priority to quoted prices (unadjusted) in active markets for identical assets or liabilities (Level 1) and the lowest priority to unobservable inputs (Level 3).
The three levels of the fair value hierarchy are described below:
• Level 1 — Unadjusted quoted prices in active markets for identical, unrestricted assets or liabilities that the Funds have the ability to access at the measurement date;
• Level 2 — Other significant observable inputs (includes quoted prices for similar securities, interest rates, prepayment speeds, credit risk, referenced indices, quoted prices in inactive markets, adjusted quoted prices in active markets, etc.); and
• Level 3 — Prices, inputs or exotic modeling techniques which are both significant to the fair value measurement and unobservable (supported by little or no market activity).
Investments are classified within the level of the lowest significant input considered in determining fair value. Investments classified within Level 3 whose fair value measurement considers several inputs may include Level 1 or Level 2 inputs as components of the overall fair value measurement.
For details of the investment classification, refer to the Schedules of Investments, Schedule of Securities Sold Short, Not Yet Purchased, lists of open forward currency contracts, lists of open option contracts and list of open swap contracts.
Securities Sold Short, Not Yet Purchased — As consistent with the RiverPark Strategic Income Fund’s investment objectives, the Fund intends to sell securities short so long as, as a result of that sale, the current value of securities sold short, not yet purchased by the Fund would not exceed 15% of the value of its net assets. A short sale is the sale by a fund of a security, which it does not own in anticipation of purchasing the same security in the future. To complete such a transaction, the Funds must borrow the security to make delivery to the buyer. The Funds are then obligated to replace the security borrowed by purchasing the security at the market price at the time of the replacement. The price at such time may be more or less than the price at which the security was sold by the Funds. Until the security is replaced, the Funds are required to pay the lender amounts equal to any dividends that accrue during the period of the loan. Dividends and interest are shown as an expense for financial reporting purposes. To borrow the security, the Funds also may be required to pay a fee, which is shown as an expense for financial reporting purposes. The proceeds of the short sale are retained by the broker, to the extent necessary to meet margin requirements, until the short position is closed out. A realized gain, limited to the price at which the Funds sold the security short, or a realized loss, unlimited in size on a standalone basis, will be recognized upon the close of a short sale.
Until the Funds close their short position or replace the borrowed security, the Funds will maintain a segregated account with its custodian containing marginable securities. The Funds may be required to add to the segregated account as the market price of a shorted security increases. As a result of maintaining and adding to its segregated account, the Funds may maintain higher levels of marginable assets (for example, long equity positions) for collateral needs thus reducing their overall managed assets available for trading purposes.
Notes to Financial StatementsMarch 31, 2021 (Unaudited)
2. Summary of Significant Accounting Policies (continued)
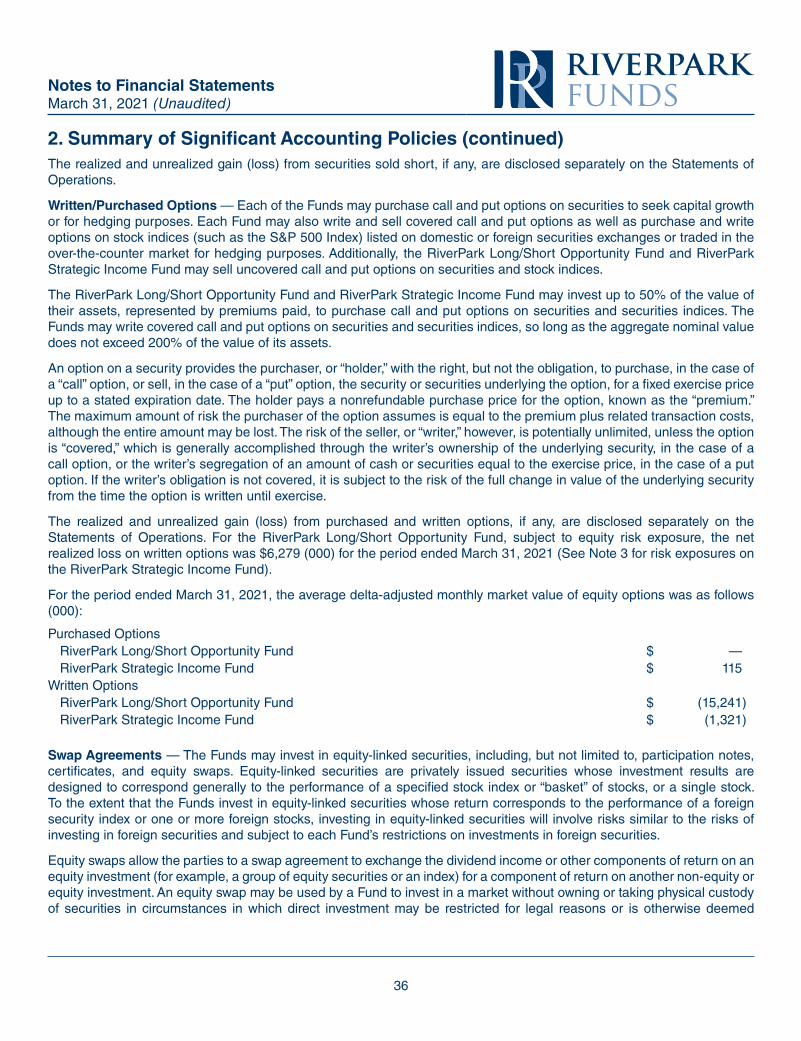
36
The realized and unrealized gain (loss) from securities sold short, if any, are disclosed separately on the Statements of Operations.
Written/Purchased Options — Each of the Funds may purchase call and put options on securities to seek capital growth or for hedging purposes. Each Fund may also write and sell covered call and put options as well as purchase and write options on stock indices (such as the S&P 500 Index) listed on domestic or foreign securities exchanges or traded in the over-the-counter market for hedging purposes. Additionally, the RiverPark Long/Short Opportunity Fund and RiverPark Strategic Income Fund may sell uncovered call and put options on securities and stock indices.
The RiverPark Long/Short Opportunity Fund and RiverPark Strategic Income Fund may invest up to 50% of the value of their assets, represented by premiums paid, to purchase call and put options on securities and securities indices. The Funds may write covered call and put options on securities and securities indices, so long as the aggregate nominal value does not exceed 200% of the value of its assets.
An option on a security provides the purchaser, or “holder,” with the right, but not the obligation, to purchase, in the case of a “call” option, or sell, in the case of a “put” option, the security or securities underlying the option, for a fixed exercise price up to a stated expiration date. The holder pays a nonrefundable purchase price for the option, known as the “premium.” The maximum amount of risk the purchaser of the option assumes is equal to the premium plus related transaction costs, although the entire amount may be lost. The risk of the seller, or “writer,” however, is potentially unlimited, unless the option is “covered,” which is generally accomplished through the writer’s ownership of the underlying security, in the case of a call option, or the writer’s segregation of an amount of cash or securities equal to the exercise price, in the case of a put option. If the writer’s obligation is not covered, it is subject to the risk of the full change in value of the underlying security from the time the option is written until exercise.
The realized and unrealized gain (loss) from purchased and written options, if any, are disclosed separately on the Statements of Operations. For the RiverPark Long/Short Opportunity Fund, subject to equity risk exposure, the net realized loss on written options was $6,279 (000) for the period ended March 31, 2021 (See Note 3 for risk exposures on the RiverPark Strategic Income Fund).
For the period ended March 31, 2021, the average delta-adjusted monthly market value of equity options was as follows (000):
Purchased Options RiverPark Long/Short Opportunity Fund $ —RiverPark Strategic Income Fund $ 115
Written OptionsRiverPark Long/Short Opportunity Fund $ (15,241)RiverPark Strategic Income Fund $ (1,321)
Swap Agreements — The Funds may invest in equity-linked securities, including, but not limited to, participation notes, certificates, and equity swaps. Equity-linked securities are privately issued securities whose investment results are designed to correspond generally to the performance of a specified stock index or “basket” of stocks, or a single stock. To the extent that the Funds invest in equity-linked securities whose return corresponds to the performance of a foreign security index or one or more foreign stocks, investing in equity-linked securities will involve risks similar to the risks of investing in foreign securities and subject to each Fund’s restrictions on investments in foreign securities.
Equity swaps allow the parties to a swap agreement to exchange the dividend income or other components of return on an equity investment (for example, a group of equity securities or an index) for a component of return on another non-equity or equity investment. An equity swap may be used by a Fund to invest in a market without owning or taking physical custody of securities in circumstances in which direct investment may be restricted for legal reasons or is otherwise deemed
Notes to Financial StatementsMarch 31, 2021 (Unaudited)
2. Summary of Significant Accounting Policies (continued)
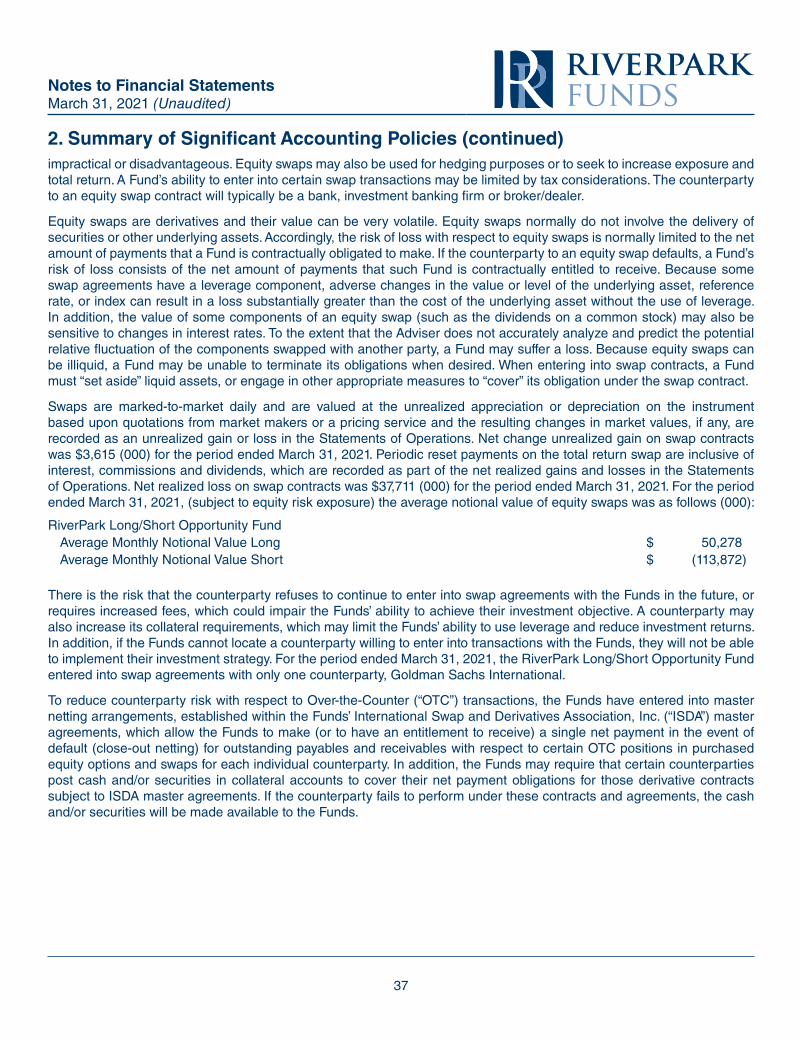
37
impractical or disadvantageous. Equity swaps may also be used for hedging purposes or to seek to increase exposure and total return. A Fund’s ability to enter into certain swap transactions may be limited by tax considerations. The counterparty to an equity swap contract will typically be a bank, investment banking firm or broker/dealer.
Equity swaps are derivatives and their value can be very volatile. Equity swaps normally do not involve the delivery of securities or other underlying assets. Accordingly, the risk of loss with respect to equity swaps is normally limited to the net amount of payments that a Fund is contractually obligated to make. If the counterparty to an equity swap defaults, a Fund’s risk of loss consists of the net amount of payments that such Fund is contractually entitled to receive. Because some swap agreements have a leverage component, adverse changes in the value or level of the underlying asset, reference rate, or index can result in a loss substantially greater than the cost of the underlying asset without the use of leverage. In addition, the value of some components of an equity swap (such as the dividends on a common stock) may also be sensitive to changes in interest rates. To the extent that the Adviser does not accurately analyze and predict the potential relative fluctuation of the components swapped with another party, a Fund may suffer a loss. Because equity swaps can be illiquid, a Fund may be unable to terminate its obligations when desired. When entering into swap contracts, a Fund must “set aside” liquid assets, or engage in other appropriate measures to “cover” its obligation under the swap contract.
Swaps are marked-to-market daily and are valued at the unrealized appreciation or depreciation on the instrument based upon quotations from market makers or a pricing service and the resulting changes in market values, if any, are recorded as an unrealized gain or loss in the Statements of Operations. Net change unrealized gain on swap contracts was $3,615 (000) for the period ended March 31, 2021. Periodic reset payments on the total return swap are inclusive of interest, commissions and dividends, which are recorded as part of the net realized gains and losses in the Statements of Operations. Net realized loss on swap contracts was $37,711 (000) for the period ended March 31, 2021. For the period ended March 31, 2021, (subject to equity risk exposure) the average notional value of equity swaps was as follows (000):
RiverPark Long/Short Opportunity FundAverage Monthly Notional Value Long $ 50,278Average Monthly Notional Value Short $ (113,872)
There is the risk that the counterparty refuses to continue to enter into swap agreements with the Funds in the future, or requires increased fees, which could impair the Funds’ ability to achieve their investment objective. A counterparty may also increase its collateral requirements, which may limit the Funds’ ability to use leverage and reduce investment returns. In addition, if the Funds cannot locate a counterparty willing to enter into transactions with the Funds, they will not be able to implement their investment strategy. For the period ended March 31, 2021, the RiverPark Long/Short Opportunity Fund entered into swap agreements with only one counterparty, Goldman Sachs International.
To reduce counterparty risk with respect to Over-the-Counter (“OTC”) transactions, the Funds have entered into master netting arrangements, established within the Funds’ International Swap and Derivatives Association, Inc. (“ISDA”) master agreements, which allow the Funds to make (or to have an entitlement to receive) a single net payment in the event of default (close-out netting) for outstanding payables and receivables with respect to certain OTC positions in purchased equity options and swaps for each individual counterparty. In addition, the Funds may require that certain counterparties post cash and/or securities in collateral accounts to cover their net payment obligations for those derivative contracts subject to ISDA master agreements. If the counterparty fails to perform under these contracts and agreements, the cash and/or securities will be made available to the Funds.
Notes to Financial StatementsMarch 31, 2021 (Unaudited)
2. Summary of Significant Accounting Policies (continued)
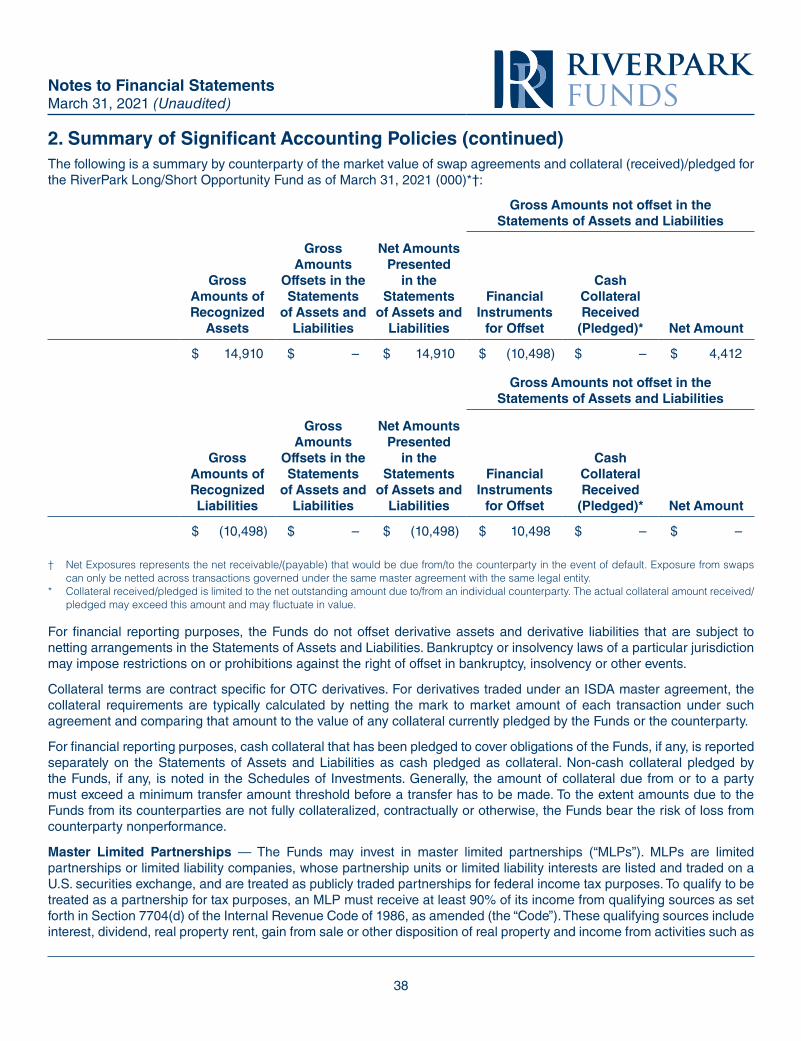
38
The following is a summary by counterparty of the market value of swap agreements and collateral (received)/pledged for the RiverPark Long/Short Opportunity Fund as of March 31, 2021 (000)*†:
Gross Amounts not offset in the Statements of Assets and Liabilities
Gross Amounts of Recognized
Assets
Gross Amounts
Offsets in the Statements
of Assets and Liabilities
Net Amounts Presented
in the Statements
of Assets and Liabilities
Financial Instruments
for Offset
Cash Collateral Received
(Pledged)* Net Amount
$ 14,910 $ – $ 14,910 $ (10,498) $ – $ 4,412
Gross Amounts not offset in the Statements of Assets and Liabilities
Gross Amounts of Recognized Liabilities
Gross Amounts
Offsets in the Statements
of Assets and Liabilities
Net Amounts Presented
in the Statements
of Assets and Liabilities
Financial Instruments
for Offset
Cash Collateral Received
(Pledged)* Net Amount
$ (10,498) $ – $ (10,498) $ 10,498 $ – $ –
† Net Exposures represents the net receivable/(payable) that would be due from/to the counterparty in the event of default. Exposure from swaps can only be netted across transactions governed under the same master agreement with the same legal entity.
* Collateral received/pledged is limited to the net outstanding amount due to/from an individual counterparty. The actual collateral amount received/pledged may exceed this amount and may fluctuate in value.
For financial reporting purposes, the Funds do not offset derivative assets and derivative liabilities that are subject to netting arrangements in the Statements of Assets and Liabilities. Bankruptcy or insolvency laws of a particular jurisdiction may impose restrictions on or prohibitions against the right of offset in bankruptcy, insolvency or other events.
Collateral terms are contract specific for OTC derivatives. For derivatives traded under an ISDA master agreement, the collateral requirements are typically calculated by netting the mark to market amount of each transaction under such agreement and comparing that amount to the value of any collateral currently pledged by the Funds or the counterparty.
For financial reporting purposes, cash collateral that has been pledged to cover obligations of the Funds, if any, is reported separately on the Statements of Assets and Liabilities as cash pledged as collateral. Non-cash collateral pledged by the Funds, if any, is noted in the Schedules of Investments. Generally, the amount of collateral due from or to a party must exceed a minimum transfer amount threshold before a transfer has to be made. To the extent amounts due to the Funds from its counterparties are not fully collateralized, contractually or otherwise, the Funds bear the risk of loss from counterparty nonperformance.
Master Limited Partnerships — The Funds may invest in master limited partnerships (“MLPs”). MLPs are limited partnerships or limited liability companies, whose partnership units or limited liability interests are listed and traded on a U.S. securities exchange, and are treated as publicly traded partnerships for federal income tax purposes. To qualify to be treated as a partnership for tax purposes, an MLP must receive at least 90% of its income from qualifying sources as set forth in Section 7704(d) of the Internal Revenue Code of 1986, as amended (the “Code”). These qualifying sources include interest, dividend, real property rent, gain from sale or other disposition of real property and income from activities such as
Notes to Financial StatementsMarch 31, 2021 (Unaudited)
2. Summary of Significant Accounting Policies (continued)
39
the exploration, development, mining, production, processing, refining, transportation, storage and marketing of mineral or natural resources. MLPs generally have two classes of owners, the general partner and limited partners. MLPs that are formed as limited liability companies generally have two analogous classes of owners, the managing member and the members. For purposes of this section, references to general partners also apply to managing members and references to limited partners also apply to members. The general partner is typically owned by a major energy company, an investment fund, the direct management of the MLP or is an entity owned by one or more of such parties. The general partner may be structured as a private or publicly traded corporation or other entity. The general partner typically controls the operations and management of the MLP through an equity interest of as much as 2% in the MLP plus, in many cases, ownership of common units and subordinated units. Limited partners own the remainder of the MLP through ownership of common units and have a limited role in the MLP’s operations and management.
An investment in MLP units involves certain risks which differ from an investment in the securities of a corporation. Holders of MLP units have limited control and voting rights on matters affecting the partnership. In addition, there are certain tax risks associated with an investment in MLP units and conflicts of interest exist between common unit holders and the general partner, including those arising from incentive distribution payments. As a partnership, an MLP has no tax liability at the entity level. If, as a result of a change in current law or a change in an MLP’s business, an MLP were treated as a corporation for federal income tax purposes, such MLP would be obligated to pay federal income tax on its income at the corporate tax rate. If an MLP were classified as a corporation for federal income tax purposes, the amount of cash available for distribution by the MLP would be reduced and distributions received by investors would be taxed under federal income tax laws applicable to corporate dividends (as dividend income, return of capital, or capital gain). Therefore, treatment of an MLP as a corporation for federal income tax purposes would result in a reduction in the after-tax return to investors, likely causing a reduction in the value of the Funds’ shares. Dividends from MLPs are recorded on the ex-dividend date.
Investment Transactions — Security transactions are accounted for on the trade date, the date the order to buy or sell is executed. Costs used in determining realized gains and losses on the sales of investment securities are those of the specific securities sold. Discounts or premiums are accreted or amortized to interest income using the effective interest method. Interest income is recognized on the accrual basis from settlement date. Dividend income and expenses and other distributions are recorded on the ex-dividend date, except certain dividends and distributions from foreign securities which are recorded as soon as a Fund is informed after the ex-dividend date. Withholding taxes on foreign dividends have been provided for in accordance with the Funds’ understanding of the applicable country’s tax rules and rates. The ability of issuers of debt securities held by the Funds to meet their obligations may be affected by economic and political developments in a specific country or region.
Defaulted Investments — Debt obligations may be placed on non-accrual status and related interest income may be reduced by ceasing current accruals and writing off interest receivable when the collection of all or a portion of interest has become doubtful based on consistently applied procedures. A debt obligation is removed from non-accrual status when the issuer resumes interest payments or when collectability of interest is reasonably assured.
Expenses — Expenses of the Trust that can be directly attributed to a particular Fund are borne by that Fund. Expenses which cannot be directly attributed to a Fund are apportioned among the Funds of the Trust based on the number of Funds and/or relative net assets.
Classes — Class specific expenses are borne by that class of shares. Income, realized and unrealized gains and losses and non-class specific expenses are allocated to the respective class on the basis of relative daily net assets.
Foreign Currency Translation — The books and records of the Funds are maintained in U.S. dollars. Investment securities and other assets and liabilities denominated in a foreign currency are translated into U.S. dollars on the date of valuation. The Funds do not isolate that portion of realized or unrealized gains and losses resulting from changes in the foreign exchange rate from fluctuations arising from changes in the market prices of the securities. These gains and losses are included in net realized and unrealized gains and losses on investments on the Statements of Operations. Net realized and unrealized gains and losses on foreign currency transactions represent net foreign exchange gains or losses from
Notes to Financial StatementsMarch 31, 2021 (Unaudited)
2. Summary of Significant Accounting Policies (continued)
40
foreign currency exchange contracts, disposition of foreign currencies, currency gains or losses realized between trade and settlement dates on securities transactions and the difference between the amount of the investment income and foreign withholding taxes recorded on the Fund’s books and the U.S. dollar equivalent amounts actually received or paid.
Forward Foreign Currency Exchange Contracts — Each Fund may, but is not obligated to, enter into forward foreign currency exchange contracts (“forward contracts”) in order to protect against uncertainty in the level of future foreign exchange rates in the purchases and sale of securities. A forward contract generally has no deposit requirement, and no commissions are charged at any stage for trades. Although foreign exchange dealers do not charge a fee for commissions, they do realize a profit based on the difference between the price at which they are buying and selling various currencies. Although forward contracts are intended to minimize currency risk — the risk of loss due to a decline in the value of the hedged currencies — at the same time, they tend to limit any potential gain which might result should the value of such currencies increase. As of March 31, 2021, the RiverPark Strategic Income Fund and the RiverPark Short Term High Yield Fund held forward contracts as currency hedges against foreign bonds. It is the Funds’ policy to present the gross unrealized appreciation and gross unrealized depreciation of the forward contracts separately on the Statements of Assets and Liabilities, as the Funds do not have a master netting agreement with the counterparty to the forward contracts. As of March 31, 2021, the RiverPark Short Term High Yield Fund and RiverPark Strategic Income Fund entered into one-month forward contracts with one counterparty, Brown Brothers Harriman. In accordance with this policy, the unrealized appreciation and depreciation as of March 31, 2021, is presented as unrealized appreciation or depreciation on forward foreign currency contracts on the Statements of Assets and Liabilities. Realized and change in unrealized gains (losses) on forward foreign currency contracts are disclosed separately on the Statements of Operations. For the period ended March 31, 2021, subject to currency risk exposure, the average balances of the forward contracts were as follows (000) (See Note 3 for risk exposures on the RiverPark Strategic Income Fund).
Average Monthly Notional Contracts: RiverPark Strategic Income Fund $ 16,671RiverPark Short Term High Yield Fund $ 26,710
Dividends and Distributions to Shareholders — Dividends from net investment income are declared and paid to shareholders annually for the RiverPark Large Growth Fund, Wedgewood Fund and RiverPark Long/Short Opportunity Fund, and declared and paid monthly for the RiverPark Short Term High Yield Fund, RiverPark Strategic Income Fund and the RiverPark Floating Rate CMBS Fund. Dividends and distributions are recorded on the ex-dividend date. Any net realized capital gains will be distributed at least annually by the Funds.
Income Taxes — Each Fund intends to qualify or continue to qualify as a “regulated investment company” under Sub-chapter M of the Internal Revenue Code of 1986, as amended. If so qualified, each Fund will not be subject to federal income tax to the extent it distributes substantially all of its net investment income and net capital gains to its shareholders.
The Funds evaluate tax positions taken or expected to be taken in the course of preparing the Funds’ tax returns to determine whether it is “more-likely-than not” (i.e., greater than 50-percent) that each tax position will be sustained upon examination by a taxing authority based on the technical merits of the position. Tax positions not deemed to meet the more-likely-than-not threshold are recorded as a tax benefit or expense in the current year. The Funds did not record any tax provision in the current period. However, management’s conclusions regarding tax positions taken may be subject to review and adjustment at a later date based on factors including, but not limited to, examination by tax authorities (i.e., the last 3 tax year ends, as applicable), on-going analysis of, and changes to, tax laws, regulations and interpretations thereof.
As of and during the six-month period ended March 31, 2021, the Funds did not have a tax liability for any unrecognized tax benefits. The Funds recognize interest and penalties, if any, related to unrecognized tax benefits as income tax expense in the Statements of Operations. During the period, the Funds did not incur any significant interest or penalties.
Notes to Financial StatementsMarch 31, 2021 (Unaudited)
2. Summary of Significant Accounting Policies (continued)
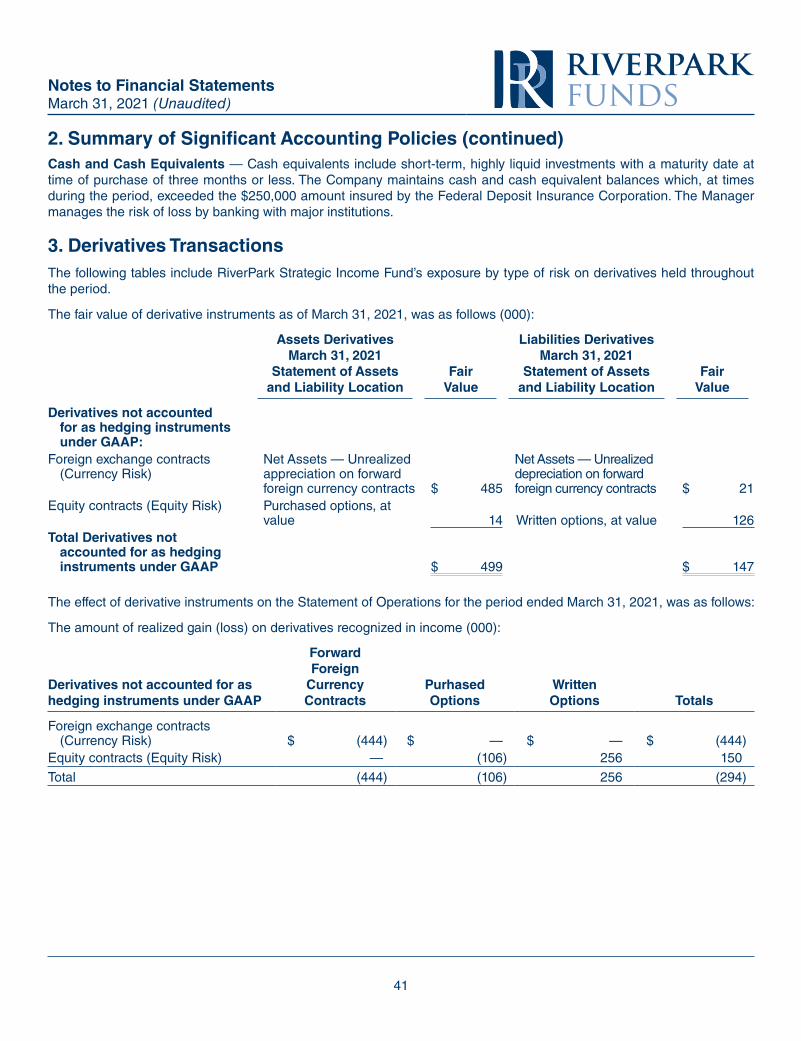
41
Cash and Cash Equivalents — Cash equivalents include short-term, highly liquid investments with a maturity date at time of purchase of three months or less. The Company maintains cash and cash equivalent balances which, at times during the period, exceeded the $250,000 amount insured by the Federal Deposit Insurance Corporation. The Manager manages the risk of loss by banking with major institutions.
3. Derivatives TransactionsThe following tables include RiverPark Strategic Income Fund’s exposure by type of risk on derivatives held throughout the period.
The fair value of derivative instruments as of March 31, 2021, was as follows (000):
Assets Derivatives March 31, 2021
Statement of Assets and Liability Location
Fair Value
Liabilities Derivatives March 31, 2021
Statement of Assets and Liability Location
Fair Value
Derivatives not accounted for as hedging instruments under GAAP:
Foreign exchange contracts (Currency Risk)
Net Assets — Unrealized appreciation on forward foreign currency contracts $ 485
Net Assets — Unrealized depreciation on forward foreign currency contracts $ 21
Equity contracts (Equity Risk) Purchased options, at value 14 Written options, at value 126
Total Derivatives not accounted for as hedging instruments under GAAP $ 499 $ 147
The effect of derivative instruments on the Statement of Operations for the period ended March 31, 2021, was as follows:
The amount of realized gain (loss) on derivatives recognized in income (000):
Derivatives not accounted for as hedging instruments under GAAP
Forward Foreign
Currency Contracts
Purhased Options
Written Options Totals
Foreign exchange contracts (Currency Risk) $ (444) $ — $ — $ (444)
Equity contracts (Equity Risk) — (106) 256 150
Total (444) (106) 256 (294)
Notes to Financial StatementsMarch 31, 2021 (Unaudited)
2. Summary of Significant Accounting Policies (continued)
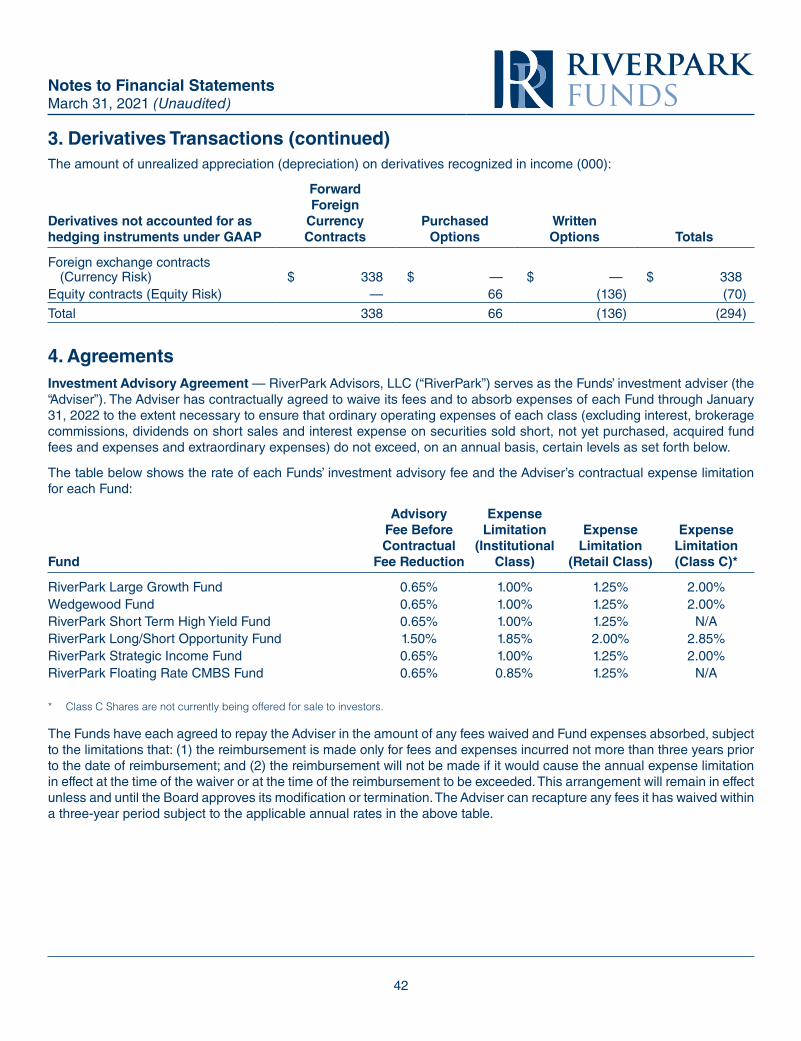
42
The amount of unrealized appreciation (depreciation) on derivatives recognized in income (000):
Derivatives not accounted for as hedging instruments under GAAP
Forward Foreign
Currency Contracts
Purchased Options
Written Options Totals
Foreign exchange contracts (Currency Risk) $ 338 $ — $ — $ 338
Equity contracts (Equity Risk) — 66 (136) (70)
Total 338 66 (136) (294)
4. AgreementsInvestment Advisory Agreement — RiverPark Advisors, LLC (“RiverPark”) serves as the Funds’ investment adviser (the “Adviser”). The Adviser has contractually agreed to waive its fees and to absorb expenses of each Fund through January 31, 2022 to the extent necessary to ensure that ordinary operating expenses of each class (excluding interest, brokerage commissions, dividends on short sales and interest expense on securities sold short, not yet purchased, acquired fund fees and expenses and extraordinary expenses) do not exceed, on an annual basis, certain levels as set forth below.
The table below shows the rate of each Funds’ investment advisory fee and the Adviser’s contractual expense limitation for each Fund:
Fund
Advisory Fee Before Contractual
Fee Reduction
Expense Limitation
(Institutional Class)
Expense Limitation
(Retail Class)
Expense Limitation (Class C)*
RiverPark Large Growth Fund 0.65% 1.00% 1.25% 2.00%Wedgewood Fund 0.65% 1.00% 1.25% 2.00%RiverPark Short Term High Yield Fund 0.65% 1.00% 1.25% N/ARiverPark Long/Short Opportunity Fund 1.50% 1.85% 2.00% 2.85%RiverPark Strategic Income Fund 0.65% 1.00% 1.25% 2.00%RiverPark Floating Rate CMBS Fund 0.65% 0.85% 1.25% N/A
* Class C Shares are not currently being offered for sale to investors.
The Funds have each agreed to repay the Adviser in the amount of any fees waived and Fund expenses absorbed, subject to the limitations that: (1) the reimbursement is made only for fees and expenses incurred not more than three years prior to the date of reimbursement; and (2) the reimbursement will not be made if it would cause the annual expense limitation in effect at the time of the waiver or at the time of the reimbursement to be exceeded. This arrangement will remain in effect unless and until the Board approves its modification or termination. The Adviser can recapture any fees it has waived within a three-year period subject to the applicable annual rates in the above table.
Notes to Financial StatementsMarch 31, 2021 (Unaudited)
3. Derivatives Transactions (continued)
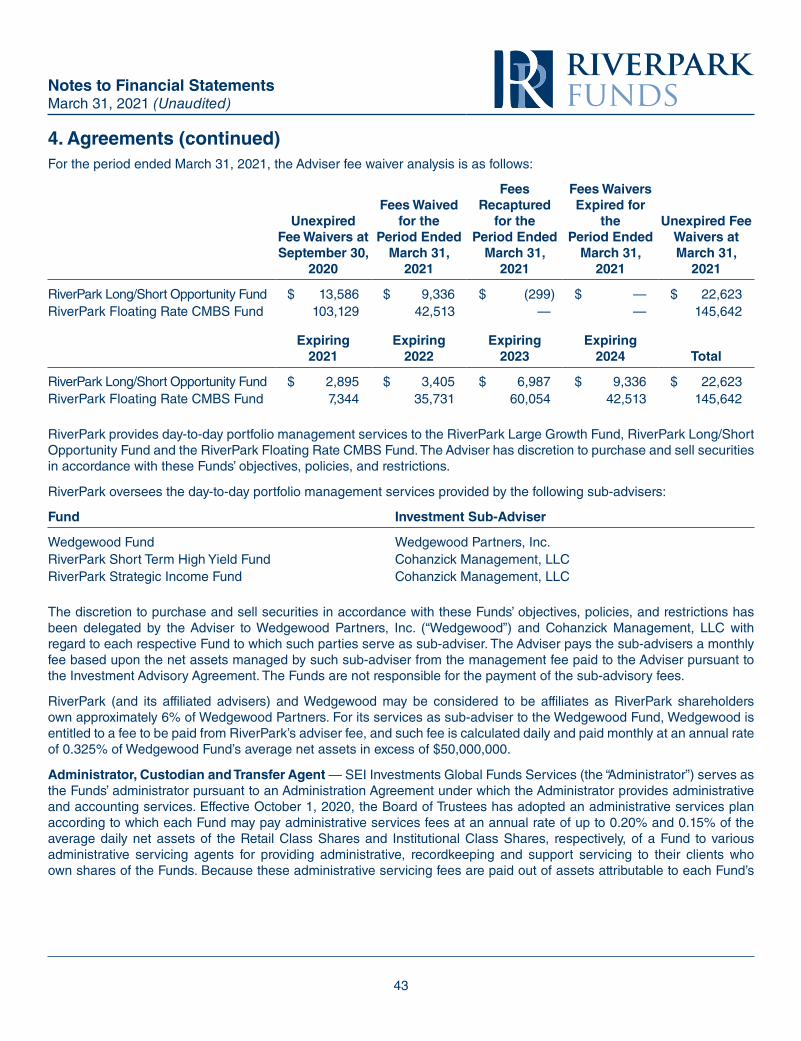
43
For the period ended March 31, 2021, the Adviser fee waiver analysis is as follows:
Unexpired Fee Waivers at September 30,
2020
Fees Waived for the
Period Ended March 31,
2021
Fees Recaptured
for the Period Ended
March 31, 2021
Fees Waivers Expired for
the Period Ended
March 31, 2021
Unexpired Fee Waivers at March 31,
2021
RiverPark Long/Short Opportunity Fund $ 13,586 $ 9,336 $ (299) $ — $ 22,623RiverPark Floating Rate CMBS Fund 103,129 42,513 — — 145,642
Expiring
2021Expiring
2022Expiring
2023Expiring
2024 Total
RiverPark Long/Short Opportunity Fund $ 2,895 $ 3,405 $ 6,987 $ 9,336 $ 22,623RiverPark Floating Rate CMBS Fund 7,344 35,731 60,054 42,513 145,642
RiverPark provides day-to-day portfolio management services to the RiverPark Large Growth Fund, RiverPark Long/Short Opportunity Fund and the RiverPark Floating Rate CMBS Fund. The Adviser has discretion to purchase and sell securities in accordance with these Funds’ objectives, policies, and restrictions.
RiverPark oversees the day-to-day portfolio management services provided by the following sub-advisers:
Fund Investment Sub-Adviser
Wedgewood Fund Wedgewood Partners, Inc. RiverPark Short Term High Yield Fund Cohanzick Management, LLC RiverPark Strategic Income Fund Cohanzick Management, LLC
The discretion to purchase and sell securities in accordance with these Funds’ objectives, policies, and restrictions has been delegated by the Adviser to Wedgewood Partners, Inc. (“Wedgewood”) and Cohanzick Management, LLC with regard to each respective Fund to which such parties serve as sub-adviser. The Adviser pays the sub-advisers a monthly fee based upon the net assets managed by such sub-adviser from the management fee paid to the Adviser pursuant to the Investment Advisory Agreement. The Funds are not responsible for the payment of the sub-advisory fees.
RiverPark (and its affiliated advisers) and Wedgewood may be considered to be affiliates as RiverPark shareholders own approximately 6% of Wedgewood Partners. For its services as sub-adviser to the Wedgewood Fund, Wedgewood is entitled to a fee to be paid from RiverPark’s adviser fee, and such fee is calculated daily and paid monthly at an annual rate of 0.325% of Wedgewood Fund’s average net assets in excess of $50,000,000.
Administrator, Custodian and Transfer Agent — SEI Investments Global Funds Services (the “Administrator”) serves as the Funds’ administrator pursuant to an Administration Agreement under which the Administrator provides administrative and accounting services. Effective October 1, 2020, the Board of Trustees has adopted an administrative services plan according to which each Fund may pay administrative services fees at an annual rate of up to 0.20% and 0.15% of the average daily net assets of the Retail Class Shares and Institutional Class Shares, respectively, of a Fund to various administrative servicing agents for providing administrative, recordkeeping and support servicing to their clients who own shares of the Funds. Because these administrative servicing fees are paid out of assets attributable to each Fund’s
Notes to Financial StatementsMarch 31, 2021 (Unaudited)
4. Agreements (continued)
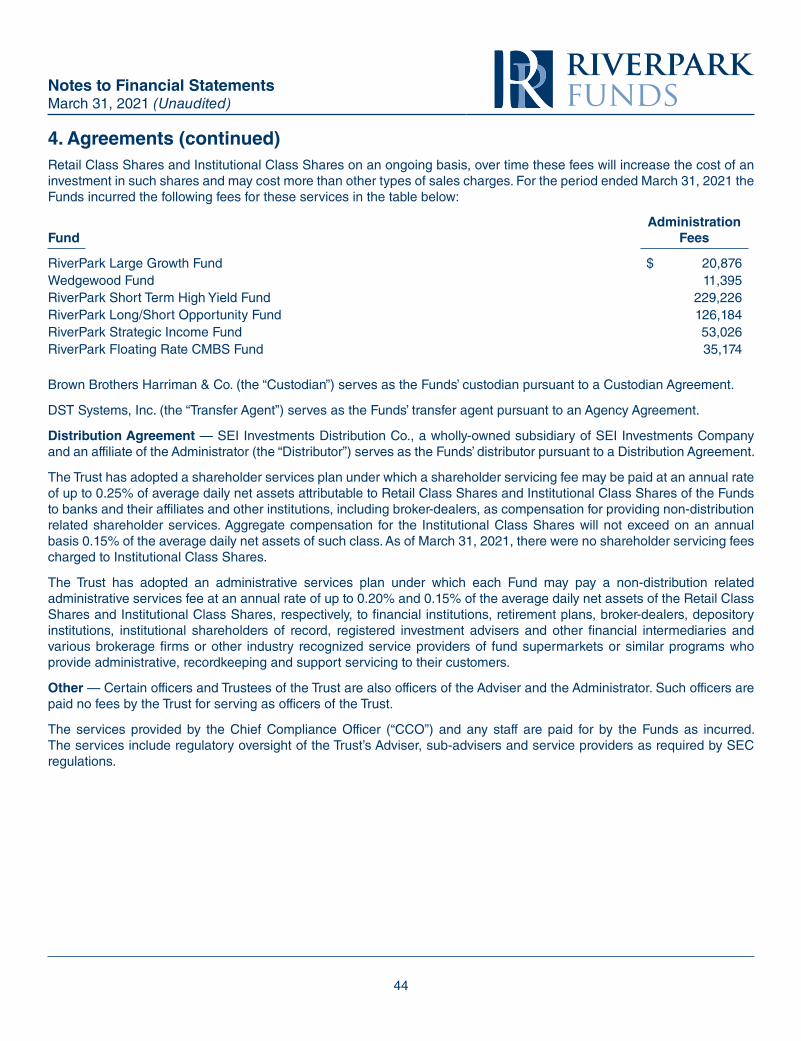
44
Retail Class Shares and Institutional Class Shares on an ongoing basis, over time these fees will increase the cost of an investment in such shares and may cost more than other types of sales charges. For the period ended March 31, 2021 the Funds incurred the following fees for these services in the table below:
FundAdministration
Fees
RiverPark Large Growth Fund $ 20,876Wedgewood Fund 11,395RiverPark Short Term High Yield Fund 229,226RiverPark Long/Short Opportunity Fund 126,184RiverPark Strategic Income Fund 53,026RiverPark Floating Rate CMBS Fund 35,174
Brown Brothers Harriman & Co. (the “Custodian”) serves as the Funds’ custodian pursuant to a Custodian Agreement.
DST Systems, Inc. (the “Transfer Agent”) serves as the Funds’ transfer agent pursuant to an Agency Agreement.
Distribution Agreement — SEI Investments Distribution Co., a wholly-owned subsidiary of SEI Investments Company and an affiliate of the Administrator (the “Distributor”) serves as the Funds’ distributor pursuant to a Distribution Agreement.
The Trust has adopted a shareholder services plan under which a shareholder servicing fee may be paid at an annual rate of up to 0.25% of average daily net assets attributable to Retail Class Shares and Institutional Class Shares of the Funds to banks and their affiliates and other institutions, including broker-dealers, as compensation for providing non-distribution related shareholder services. Aggregate compensation for the Institutional Class Shares will not exceed on an annual basis 0.15% of the average daily net assets of such class. As of March 31, 2021, there were no shareholder servicing fees charged to Institutional Class Shares.
The Trust has adopted an administrative services plan under which each Fund may pay a non-distribution related administrative services fee at an annual rate of up to 0.20% and 0.15% of the average daily net assets of the Retail Class Shares and Institutional Class Shares, respectively, to financial institutions, retirement plans, broker-dealers, depository institutions, institutional shareholders of record, registered investment advisers and other financial intermediaries and various brokerage firms or other industry recognized service providers of fund supermarkets or similar programs who provide administrative, recordkeeping and support servicing to their customers.
Other — Certain officers and Trustees of the Trust are also officers of the Adviser and the Administrator. Such officers are paid no fees by the Trust for serving as officers of the Trust.
The services provided by the Chief Compliance Officer (“CCO”) and any staff are paid for by the Funds as incurred. The services include regulatory oversight of the Trust’s Adviser, sub-advisers and service providers as required by SEC regulations.
Notes to Financial StatementsMarch 31, 2021 (Unaudited)
4. Agreements (continued)
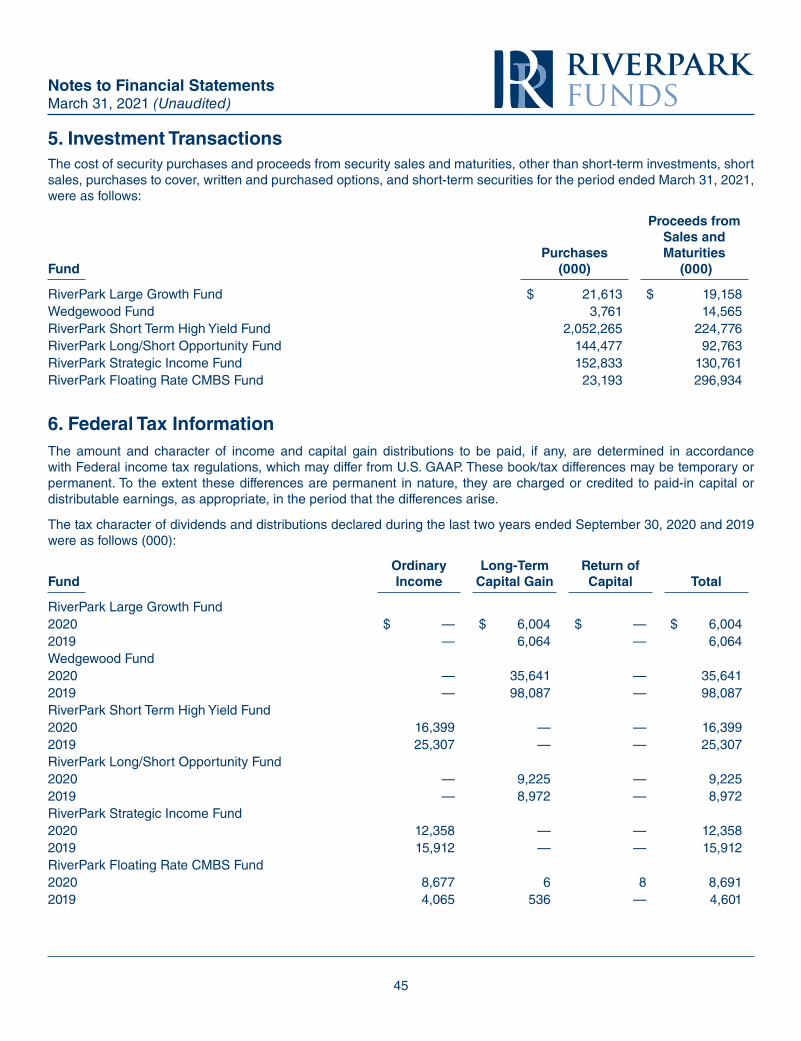
45
The cost of security purchases and proceeds from security sales and maturities, other than short-term investments, short sales, purchases to cover, written and purchased options, and short-term securities for the period ended March 31, 2021, were as follows:
FundPurchases
(000)
Proceeds from Sales and Maturities
(000)
RiverPark Large Growth Fund $ 21,613 $ 19,158Wedgewood Fund 3,761 14,565RiverPark Short Term High Yield Fund 2,052,265 224,776RiverPark Long/Short Opportunity Fund 144,477 92,763RiverPark Strategic Income Fund 152,833 130,761RiverPark Floating Rate CMBS Fund 23,193 296,934
6. Federal Tax InformationThe amount and character of income and capital gain distributions to be paid, if any, are determined in accordance with Federal income tax regulations, which may differ from U.S. GAAP. These book/tax differences may be temporary or permanent. To the extent these differences are permanent in nature, they are charged or credited to paid-in capital or distributable earnings, as appropriate, in the period that the differences arise.
The tax character of dividends and distributions declared during the last two years ended September 30, 2020 and 2019 were as follows (000):
FundOrdinary Income
Long-Term Capital Gain
Return of Capital Total
RiverPark Large Growth Fund 2020 $ — $ 6,004 $ — $ 6,0042019 — 6,064 — 6,064Wedgewood Fund 2020 — 35,641 — 35,6412019 — 98,087 — 98,087RiverPark Short Term High Yield Fund 2020 16,399 — — 16,3992019 25,307 — — 25,307RiverPark Long/Short Opportunity Fund 2020 — 9,225 — 9,2252019 — 8,972 — 8,972RiverPark Strategic Income Fund 2020 12,358 — — 12,3582019 15,912 — — 15,912RiverPark Floating Rate CMBS Fund 2020 8,677 6 8 8,6912019 4,065 536 — 4,601
Notes to Financial StatementsMarch 31, 2021 (Unaudited)
5. Investment Transactions
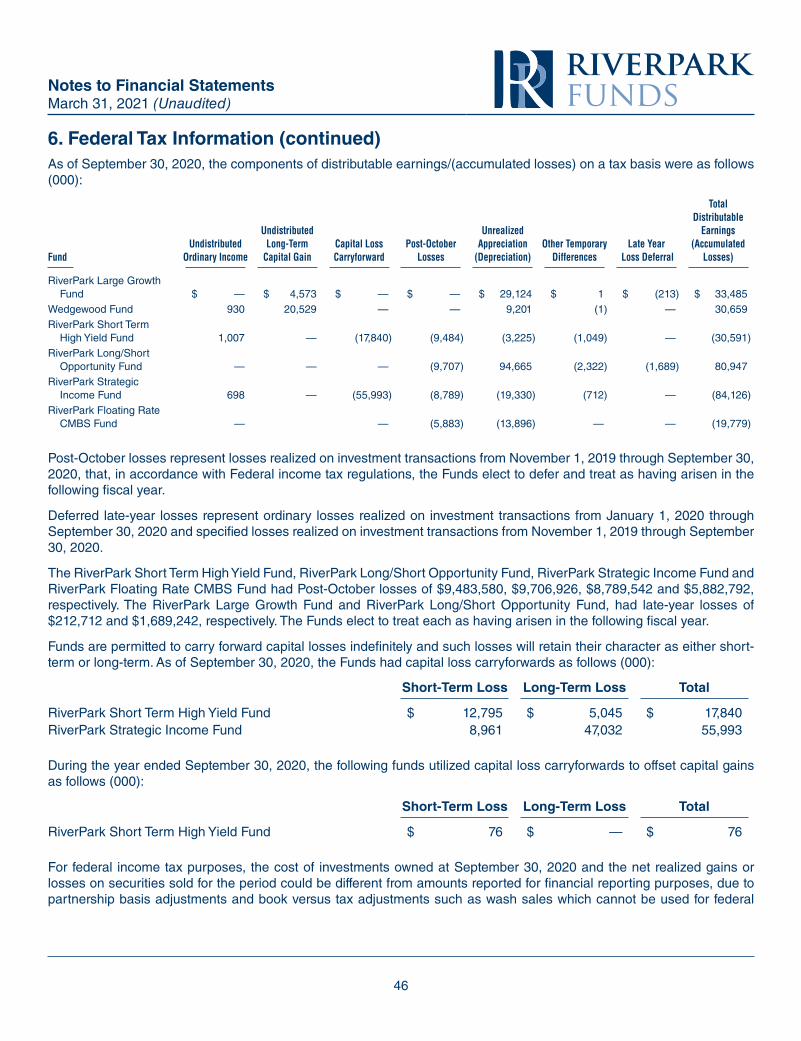
46
As of September 30, 2020, the components of distributable earnings/(accumulated losses) on a tax basis were as follows (000):
FundUndistributed
Ordinary Income
Undistributed Long-Term
Capital GainCapital Loss Carryforward
Post-October Losses
Unrealized Appreciation
(Depreciation)Other Temporary
DifferencesLate Year
Loss Deferral
Total Distributable
Earnings (Accumulated
Losses)
RiverPark Large Growth Fund $ — $ 4,573 $ — $ — $ 29,124 $ 1 $ (213) $ 33,485
Wedgewood Fund 930 20,529 — — 9,201 (1) — 30,659RiverPark Short Term
High Yield Fund 1,007 — (17,840) (9,484) (3,225) (1,049) — (30,591)RiverPark Long/Short
Opportunity Fund — — — (9,707) 94,665 (2,322) (1,689) 80,947RiverPark Strategic
Income Fund 698 — (55,993) (8,789) (19,330) (712) — (84,126)RiverPark Floating Rate
CMBS Fund — — (5,883) (13,896) — — (19,779)
Post-October losses represent losses realized on investment transactions from November 1, 2019 through September 30, 2020, that, in accordance with Federal income tax regulations, the Funds elect to defer and treat as having arisen in the following fiscal year.
Deferred late-year losses represent ordinary losses realized on investment transactions from January 1, 2020 through September 30, 2020 and specified losses realized on investment transactions from November 1, 2019 through September 30, 2020.
The RiverPark Short Term High Yield Fund, RiverPark Long/Short Opportunity Fund, RiverPark Strategic Income Fund and RiverPark Floating Rate CMBS Fund had Post-October losses of $9,483,580, $9,706,926, $8,789,542 and $5,882,792, respectively. The RiverPark Large Growth Fund and RiverPark Long/Short Opportunity Fund, had late-year losses of $212,712 and $1,689,242, respectively. The Funds elect to treat each as having arisen in the following fiscal year.
Funds are permitted to carry forward capital losses indefinitely and such losses will retain their character as either short-term or long-term. As of September 30, 2020, the Funds had capital loss carryforwards as follows (000):
Short-Term Loss Long-Term Loss Total
RiverPark Short Term High Yield Fund $ 12,795 $ 5,045 $ 17,840RiverPark Strategic Income Fund 8,961 47,032 55,993
During the year ended September 30, 2020, the following funds utilized capital loss carryforwards to offset capital gains as follows (000):
Short-Term Loss Long-Term Loss Total
RiverPark Short Term High Yield Fund $ 76 $ — $ 76
For federal income tax purposes, the cost of investments owned at September 30, 2020 and the net realized gains or losses on securities sold for the period could be different from amounts reported for financial reporting purposes, due to partnership basis adjustments and book versus tax adjustments such as wash sales which cannot be used for federal
Notes to Financial StatementsMarch 31, 2021 (Unaudited)
6. Federal Tax Information (continued)
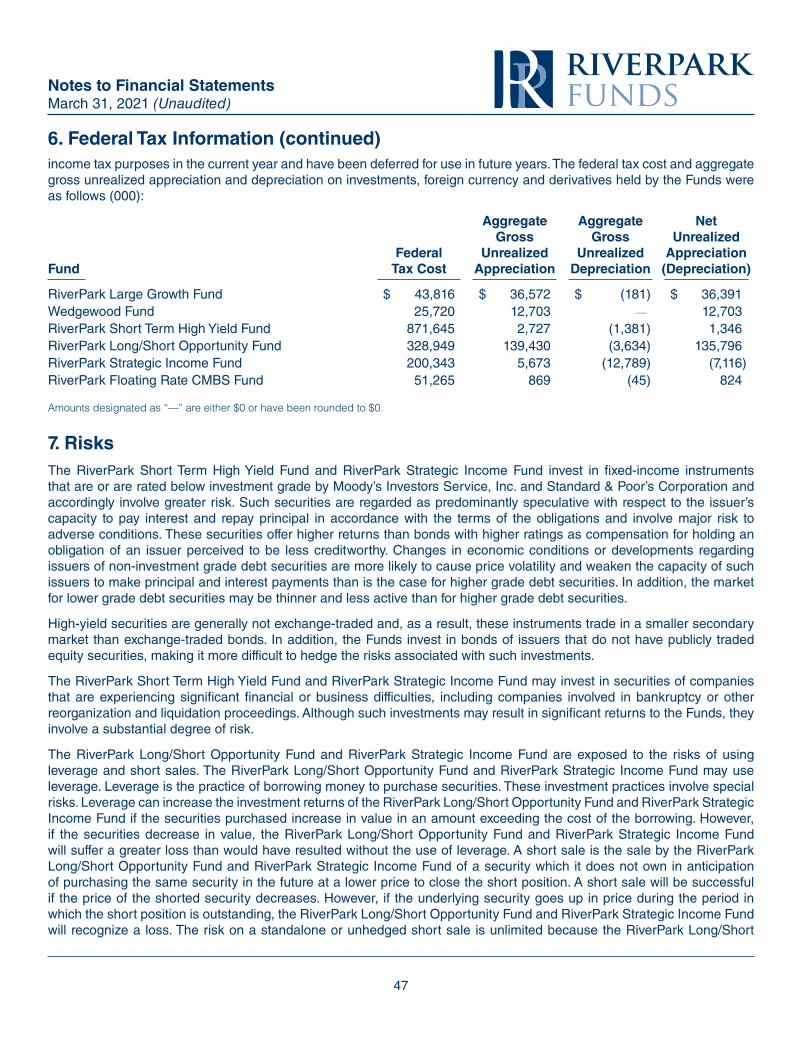
47
income tax purposes in the current year and have been deferred for use in future years. The federal tax cost and aggregate gross unrealized appreciation and depreciation on investments, foreign currency and derivatives held by the Funds were as follows (000):
FundFederal
Tax Cost
Aggregate Gross
Unrealized Appreciation
Aggregate Gross
Unrealized Depreciation
Net Unrealized
Appreciation (Depreciation)
RiverPark Large Growth Fund $ 43,816 $ 36,572 $ (181) $ 36,391Wedgewood Fund 25,720 12,703 — 12,703RiverPark Short Term High Yield Fund 871,645 2,727 (1,381) 1,346RiverPark Long/Short Opportunity Fund 328,949 139,430 (3,634) 135,796RiverPark Strategic Income Fund 200,343 5,673 (12,789) (7,116)RiverPark Floating Rate CMBS Fund 51,265 869 (45) 824
Amounts designated as “—” are either $0 or have been rounded to $0.
7. RisksThe RiverPark Short Term High Yield Fund and RiverPark Strategic Income Fund invest in fixed-income instruments that are or are rated below investment grade by Moody’s Investors Service, Inc. and Standard & Poor’s Corporation and accordingly involve greater risk. Such securities are regarded as predominantly speculative with respect to the issuer’s capacity to pay interest and repay principal in accordance with the terms of the obligations and involve major risk to adverse conditions. These securities offer higher returns than bonds with higher ratings as compensation for holding an obligation of an issuer perceived to be less creditworthy. Changes in economic conditions or developments regarding issuers of non-investment grade debt securities are more likely to cause price volatility and weaken the capacity of such issuers to make principal and interest payments than is the case for higher grade debt securities. In addition, the market for lower grade debt securities may be thinner and less active than for higher grade debt securities.
High-yield securities are generally not exchange-traded and, as a result, these instruments trade in a smaller secondary market than exchange-traded bonds. In addition, the Funds invest in bonds of issuers that do not have publicly traded equity securities, making it more difficult to hedge the risks associated with such investments.
The RiverPark Short Term High Yield Fund and RiverPark Strategic Income Fund may invest in securities of companies that are experiencing significant financial or business difficulties, including companies involved in bankruptcy or other reorganization and liquidation proceedings. Although such investments may result in significant returns to the Funds, they involve a substantial degree of risk.
The RiverPark Long/Short Opportunity Fund and RiverPark Strategic Income Fund are exposed to the risks of using leverage and short sales. The RiverPark Long/Short Opportunity Fund and RiverPark Strategic Income Fund may use leverage. Leverage is the practice of borrowing money to purchase securities. These investment practices involve special risks. Leverage can increase the investment returns of the RiverPark Long/Short Opportunity Fund and RiverPark Strategic Income Fund if the securities purchased increase in value in an amount exceeding the cost of the borrowing. However, if the securities decrease in value, the RiverPark Long/Short Opportunity Fund and RiverPark Strategic Income Fund will suffer a greater loss than would have resulted without the use of leverage. A short sale is the sale by the RiverPark Long/Short Opportunity Fund and RiverPark Strategic Income Fund of a security which it does not own in anticipation of purchasing the same security in the future at a lower price to close the short position. A short sale will be successful if the price of the shorted security decreases. However, if the underlying security goes up in price during the period in which the short position is outstanding, the RiverPark Long/Short Opportunity Fund and RiverPark Strategic Income Fund will recognize a loss. The risk on a standalone or unhedged short sale is unlimited because the RiverPark Long/Short
Notes to Financial StatementsMarch 31, 2021 (Unaudited)
6. Federal Tax Information (continued)
48
Opportunity Fund and RiverPark Strategic Income Fund must buy the shorted security at the higher price to complete the transaction. Therefore, short sales may be subject to greater risks than investments in long positions. With a long position, the maximum sustainable loss is limited to the amount paid for the security plus the transaction costs, whereas there is no maximum attainable price of the shorted security.
The RiverPark Long/Short Opportunity Fund and RiverPark Strategic Income Fund are able to invest in options which expose investors to the risks inherent in trading options. These risks include, but are not limited to, volatile movements in the price of the underlying instrument and misjudgments as to the future prices of the options and/or the underlying instrument. Increased option volatility can increase both the profit potential and the risk associated with a fund’s trading. While volatility can be monitored and reacted to, there is no cost-effective means of hedging against market volatility.
Selling options creates additional risks. The seller of a “naked” call option (or the seller of a put option who has a short position in the underlying instrument) is subject to the risk of a rise in the price in the underlying instrument above the strike price, which risk is reduced only by the premium received for selling the option. In exchange for the proceeds received from selling the call option (in lieu of an outright short position), the option seller gives up (or will not participate in) all of the potential gain resulting from a decrease in the price of the underlying instrument below the strike price prior to expiration of the option.
The seller of a “naked” put option (or the seller of a call option who has a long position in the underlying instrument) is subject to the risk of a decline in price of the underlying instrument below the strike price, which risk is reduced only by the proceeds received from selling the option. In exchange for the premium received for selling the put option (in lieu of an outright long position), the option seller gives up (or will not participate in) all of the potential gain resulting from an increase in the price of the underlying instrument above the strike price prior to the expiration of the option. Due to the inherent leveraged nature of options, a relatively small adverse move in the price of the underlying instrument may result in immediate and substantial losses to a Fund.
The RiverPark Long/Short Opportunity Fund invests in swaps. The use of swaps is a highly specialized activity that involves investment techniques, risk analyses and tax planning different from those associated with ordinary portfolio securities transactions. These transactions can result in sizeable realized and unrealized capital gains and losses relative to the gains and losses from the Fund’s direct investments in the reference assets and short sales. Transactions in swaps can involve greater risks than if the RiverPark Long/Short Opportunity Fund had invested directly in the reference asset because, in addition to general market risks, swaps are also subject to illiquidity risk, counterparty risk, credit risk and valuation risk. Because they are two-party contracts and because they may have terms of greater than seven days, swap transactions may be considered to be illiquid. Moreover, the Fund bears the risk of loss of the amount expected to be received under a swap in the event of the default or bankruptcy of the swap counterparty. Swaps may also be subject to pricing or “basis” risk, which exists when a particular swap becomes extraordinarily expensive relative to historical prices or the price of corresponding cash market instruments. Under certain market conditions it may not be economically feasible to initiate a transaction or liquidate a position in time to avoid a loss or take advantage of an opportunity. As a registered investment company, the Fund must “set aside” liquid assets (often referred to as “asset segregation”), or engage in other approved measures to “cover” open positions with respect to certain kinds of derivatives instruments. The Fund reserves the right to modify its asset segregation policies in the future to comply with any changes in the SEC’s positions regarding asset segregation.
The RiverPark Long/Short Opportunity Fund is exposed to counterparty credit risk through its investment in swap contracts. The RiverPark Long/Short Opportunity Fund bears the risk of loss of the amount expected to be received under a swap agreement in the event of default or bankruptcy of the counterparty, or if the counterparty fails to honor its obligations. The RiverPark Long/Short Opportunity Fund has entered into swap agreements with a single counterparty (Goldman Sachs International), focusing its exposure to the counterparty credit risk of that single counterparty. Furthermore, the swap counterparty’s obligation to the RiverPark Long/Short Opportunity Fund likely will not be collateralized. The RiverPark Long/Short Opportunity Fund typically settles swap agreements on a rolling 13-month basis.
Notes to Financial StatementsMarch 31, 2021 (Unaudited)
7. Risks (continued)
49
7. Risks (continued)The RiverPark Short Term High Yield Fund and RiverPark Strategic Income Fund may invest in bank loan obligations. The secondary market for loans is a private, unregulated inter-dealer or inter-bank resale market. Purchases and sales of loans are generally subject to contractual restrictions that must be satisfied before a loan can be bought or sold. These restrictions may impede the Fund’s ability to buy or sell loans and may negatively impact the transaction price. It may take longer than seven days for transactions in loans to settle.
The Funds may hold cash, sell investments or temporarily borrow from banks or other lenders to meet short-term liquidity needs due to the extended loan settlement process, such as to satisfy redemption requests from Fund shareholders.
The Wedgewood Fund and RiverPark Floating Rate CMBS Fund are non-diversified, which means that it may hold larger positions in a smaller number of individual securities than if it were diversified. This means that increases or decreases in the value of any of the individual securities owned by the Funds may have a greater impact on the Fund’s net asset value and total return than would be the case in a diversified fund which would likely hold more securities. Therefore, the Fund’s value may fluctuate more, and it could incur greater losses as a result of decreases in the value of any one of its holdings, than if it had invested in a larger number of stocks.
The Information Technology sector is an important sector for growth oriented strategies and thus may represent a large percentage of the investments of RiverPark Large Growth, RiverPark Long/Short and Wedgewood. The sector includes a number of important industries such as software & services, hardware & equipment, and semiconductors. Investments in Information Technology are potentially riskier than investments in more mature industries because the nature of technology is that it is rapidly changing. Therefore, products or services that may initially look promising may subsequently fail or become obsolete and barriers to entry are difficult to determine. Additionally, valuations are often higher, and price movements may be more volatile.
The RiverPark Floating Rate CMBS Fund will invest in commercial real estate debt securities (“CRE Debt”). CRE Debt securities are not backed by the full faith and credit of the U.S. government and are subject to risk of default on the underlying mortgages. CRE Debt may react differently to changes in interest rates than other bonds and the prices of CRE Debt may reflect adverse economic and market conditions. Small movements in interest rates may significantly reduce the value of CRE Debt.
The CRE Debt securities in which the Fund is expected to invest are subject to the risks of the underlying mortgage loans. Commercial mortgage loans are secured by commercial property and are subject to risks of delinquency and foreclosure, and risks of loss. The ability of a borrower to repay a loan secured by an income-producing property typically is dependent primarily upon the successful operation of such property rather than upon the existence of independent income or assets of the borrower. If the net operating income of the property is reduced, the borrower’s ability to repay the loan may be impaired. Net operating income of an income-producing property can be affected by, among other things, tenant mix, success of tenant businesses, property management decisions, property location and condition, competition from comparable types of properties, changes in laws that increase operating expense or limit rents that may be charged, any need to address environmental contamination at the property, the occurrence of any uninsured casualty at the property, changes in national, regional or local economic conditions and/or specific industry segments, declines in regional or local real estate values, declines in regional or local rental or occupancy rates, increases in interest rates, real estate tax rates and other operating expenses, changes in governmental rules, regulations and fiscal policies, including environmental legislation, acts of God, terrorism, social unrest and civil disturbances.
Difficult conditions in the markets for CRE Debt securities and mortgage-related assets as well as the broader financial markets have in the past resulted in a temporary but significant contraction in liquidity for CRE Debt securities. Liquidity relates to the ability of the Fund to sell its investments in a timely manner at a price approximately equal to its value on the Fund’s books. To the extent that the market for CRE Debt securities suffers such a contraction, securities that were considered liquid at the time of investment could become temporarily illiquid, and the Sub-Adviser may experience delays or difficulty in selling assets at the prices at which the Fund carries such assets, which may result in a loss to the Fund. There is no way to predict reliably when such market conditions could re-occur or how long such conditions could persist.
Notes to Financial StatementsMarch 31, 2021 (Unaudited)
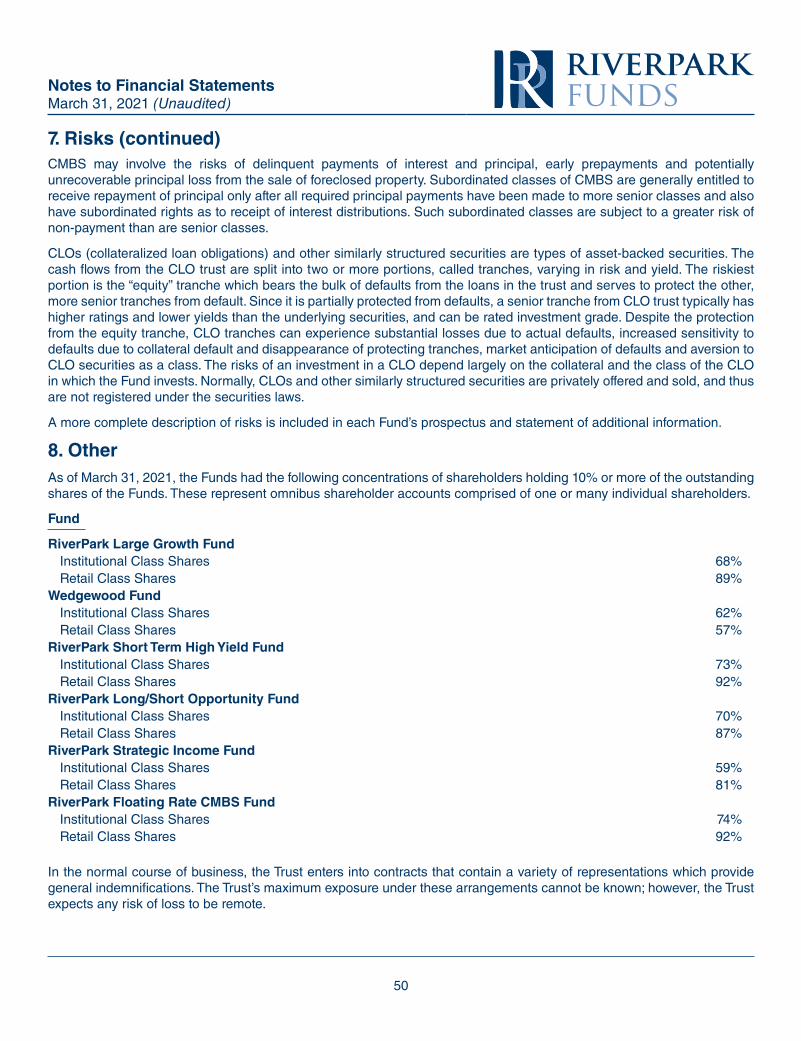
50
CMBS may involve the risks of delinquent payments of interest and principal, early prepayments and potentially unrecoverable principal loss from the sale of foreclosed property. Subordinated classes of CMBS are generally entitled to receive repayment of principal only after all required principal payments have been made to more senior classes and also have subordinated rights as to receipt of interest distributions. Such subordinated classes are subject to a greater risk of non-payment than are senior classes.
CLOs (collateralized loan obligations) and other similarly structured securities are types of asset-backed securities. The cash flows from the CLO trust are split into two or more portions, called tranches, varying in risk and yield. The riskiest portion is the “equity” tranche which bears the bulk of defaults from the loans in the trust and serves to protect the other, more senior tranches from default. Since it is partially protected from defaults, a senior tranche from CLO trust typically has higher ratings and lower yields than the underlying securities, and can be rated investment grade. Despite the protection from the equity tranche, CLO tranches can experience substantial losses due to actual defaults, increased sensitivity to defaults due to collateral default and disappearance of protecting tranches, market anticipation of defaults and aversion to CLO securities as a class. The risks of an investment in a CLO depend largely on the collateral and the class of the CLO in which the Fund invests. Normally, CLOs and other similarly structured securities are privately offered and sold, and thus are not registered under the securities laws.
A more complete description of risks is included in each Fund’s prospectus and statement of additional information.
8. OtherAs of March 31, 2021, the Funds had the following concentrations of shareholders holding 10% or more of the outstanding shares of the Funds. These represent omnibus shareholder accounts comprised of one or many individual shareholders.
Fund
RiverPark Large Growth FundInstitutional Class Shares 68%Retail Class Shares 89%
Wedgewood FundInstitutional Class Shares 62%Retail Class Shares 57%
RiverPark Short Term High Yield FundInstitutional Class Shares 73%Retail Class Shares 92%
RiverPark Long/Short Opportunity FundInstitutional Class Shares 70%Retail Class Shares 87%
RiverPark Strategic Income FundInstitutional Class Shares 59%Retail Class Shares 81%
RiverPark Floating Rate CMBS FundInstitutional Class Shares 74%Retail Class Shares 92%
In the normal course of business, the Trust enters into contracts that contain a variety of representations which provide general indemnifications. The Trust’s maximum exposure under these arrangements cannot be known; however, the Trust expects any risk of loss to be remote.
Notes to Financial StatementsMarch 31, 2021 (Unaudited)
7. Risks (continued)
51
9. New Accounting Pronouncements In March 2020, FASB issued ASU 2020-04, Reference Rate Reform: Facilitation of the Effects of Reference Rate Reform on Financial Reporting. The main objective of the new guidance is to provide relief to companies that will be impacted by the expected change in benchmark interest rates at the end of 2021, when participating banks will no longer be required to submit LIBOR quotes by the FCA. The new guidance allows companies to, provided the only change to existing contracts are a change to an approved benchmark interest rate, account for modifications as a continuance of the existing contract without additional analysis. For new and existing contracts, the Funds may elect to apply the amendments as of March 12, 2020 through December 31, 2022. Management is currently assessing the impact of the ASU’s adoption to the Funds’ financial statements and various filings.
10. Subsequent EventsThe Funds have evaluated the need for additional disclosures and/or adjustments resulting from subsequent events through the date the financial statements were issued. Based on this evaluation, no adjustments were required to the financial statements.
Notes to Financial StatementsMarch 31, 2021 (Unaudited)
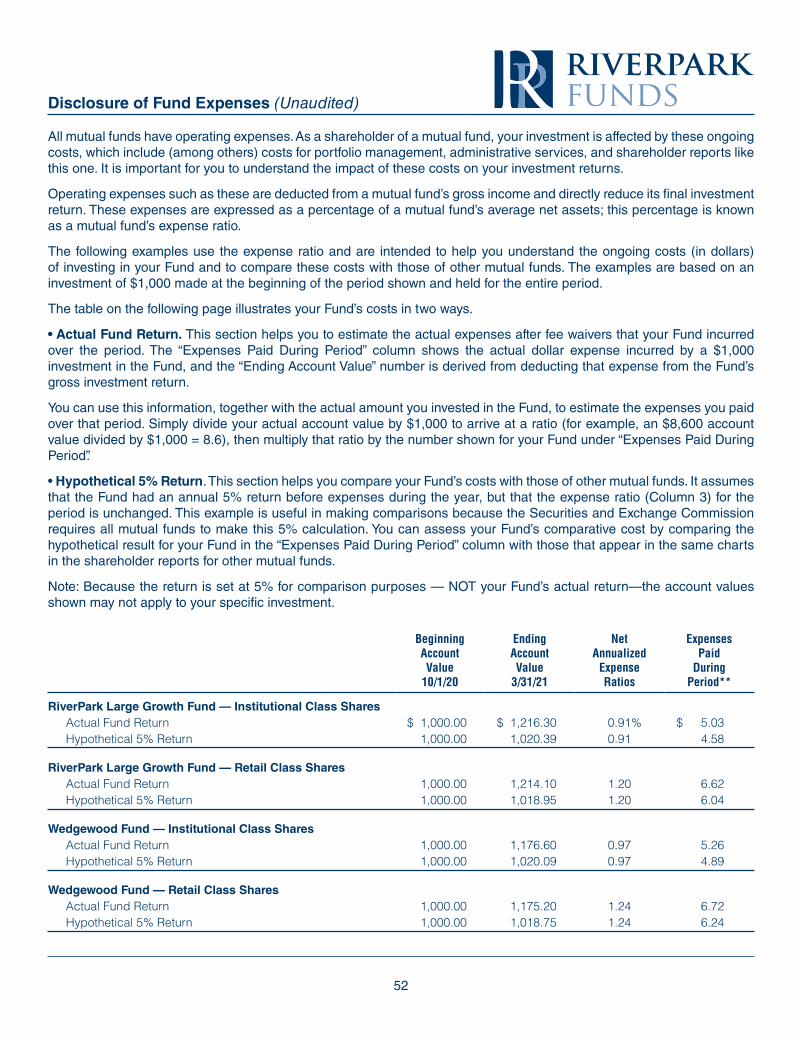
52
Disclosure of Fund Expenses (Unaudited)
All mutual funds have operating expenses. As a shareholder of a mutual fund, your investment is affected by these ongoing costs, which include (among others) costs for portfolio management, administrative services, and shareholder reports like this one. It is important for you to understand the impact of these costs on your investment returns.
Operating expenses such as these are deducted from a mutual fund’s gross income and directly reduce its final investment return. These expenses are expressed as a percentage of a mutual fund’s average net assets; this percentage is known as a mutual fund’s expense ratio.
The following examples use the expense ratio and are intended to help you understand the ongoing costs (in dollars) of investing in your Fund and to compare these costs with those of other mutual funds. The examples are based on an investment of $1,000 made at the beginning of the period shown and held for the entire period.
The table on the following page illustrates your Fund’s costs in two ways.
• Actual Fund Return. This section helps you to estimate the actual expenses after fee waivers that your Fund incurred over the period. The “Expenses Paid During Period” column shows the actual dollar expense incurred by a $1,000 investment in the Fund, and the “Ending Account Value” number is derived from deducting that expense from the Fund’s gross investment return.
You can use this information, together with the actual amount you invested in the Fund, to estimate the expenses you paid over that period. Simply divide your actual account value by $1,000 to arrive at a ratio (for example, an $8,600 account value divided by $1,000 = 8.6), then multiply that ratio by the number shown for your Fund under “Expenses Paid During Period”.
• Hypothetical 5% Return. This section helps you compare your Fund’s costs with those of other mutual funds. It assumes that the Fund had an annual 5% return before expenses during the year, but that the expense ratio (Column 3) for the period is unchanged. This example is useful in making comparisons because the Securities and Exchange Commission requires all mutual funds to make this 5% calculation. You can assess your Fund’s comparative cost by comparing the hypothetical result for your Fund in the “Expenses Paid During Period” column with those that appear in the same charts in the shareholder reports for other mutual funds.
Note: Because the return is set at 5% for comparison purposes — NOT your Fund’s actual return—the account values shown may not apply to your specific investment.
Beginning Account Value
10/1/20
Ending Account Value
3/31/21
Net Annualized
Expense Ratios
Expenses Paid
During Period**
RiverPark Large Growth Fund — Institutional Class SharesActual Fund Return $ 1,000.00 $ 1,216.30 0.91% $ 5.03Hypothetical 5% Return 1,000.00 1,020.39 0.91 4.58
RiverPark Large Growth Fund — Retail Class Shares
Actual Fund Return 1,000.00 1,214.10 1.20 6.62Hypothetical 5% Return 1,000.00 1,018.95 1.20 6.04
Wedgewood Fund — Institutional Class Shares
Actual Fund Return 1,000.00 1,176.60 0.97 5.26Hypothetical 5% Return 1,000.00 1,020.09 0.97 4.89
Wedgewood Fund — Retail Class Shares
Actual Fund Return 1,000.00 1,175.20 1.24 6.72Hypothetical 5% Return 1,000.00 1,018.75 1.24 6.24
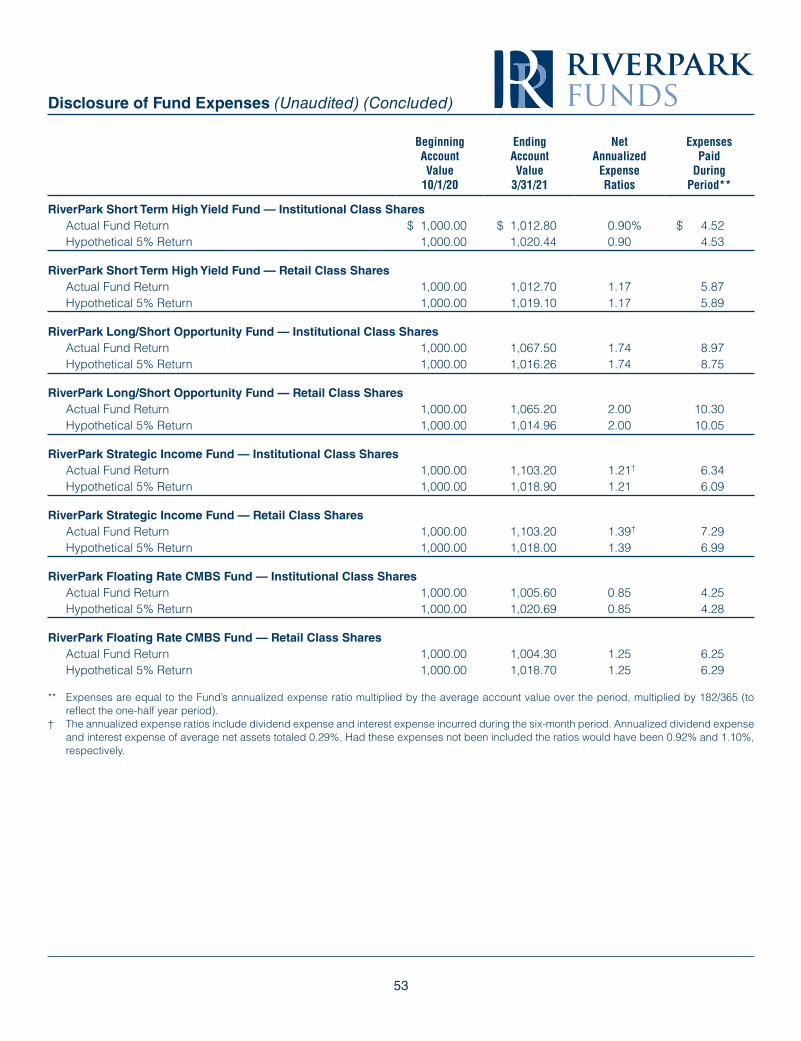
53
Disclosure of Fund Expenses (Unaudited) (Concluded)
Beginning Account Value
10/1/20
Ending Account Value
3/31/21
Net Annualized
Expense Ratios
Expenses Paid
During Period**
RiverPark Short Term High Yield Fund — Institutional Class SharesActual Fund Return $ 1,000.00 $ 1,012.80 0.90% $ 4.52Hypothetical 5% Return 1,000.00 1,020.44 0.90 4.53
RiverPark Short Term High Yield Fund — Retail Class Shares
Actual Fund Return 1,000.00 1,012.70 1.17 5.87Hypothetical 5% Return 1,000.00 1,019.10 1.17 5.89
RiverPark Long/Short Opportunity Fund — Institutional Class Shares
Actual Fund Return 1,000.00 1,067.50 1.74 8.97Hypothetical 5% Return 1,000.00 1,016.26 1.74 8.75
RiverPark Long/Short Opportunity Fund — Retail Class Shares
Actual Fund Return 1,000.00 1,065.20 2.00 10.30Hypothetical 5% Return 1,000.00 1,014.96 2.00 10.05
RiverPark Strategic Income Fund — Institutional Class Shares
Actual Fund Return 1,000.00 1,103.20 1.21† 6.34Hypothetical 5% Return 1,000.00 1,018.90 1.21 6.09
RiverPark Strategic Income Fund — Retail Class Shares
Actual Fund Return 1,000.00 1,103.20 1.39† 7.29Hypothetical 5% Return 1,000.00 1,018.00 1.39 6.99
RiverPark Floating Rate CMBS Fund — Institutional Class Shares
Actual Fund Return 1,000.00 1,005.60 0.85 4.25Hypothetical 5% Return 1,000.00 1,020.69 0.85 4.28
RiverPark Floating Rate CMBS Fund — Retail Class Shares
Actual Fund Return 1,000.00 1,004.30 1.25 6.25Hypothetical 5% Return 1,000.00 1,018.70 1.25 6.29
** Expenses are equal to the Fund’s annualized expense ratio multiplied by the average account value over the period, multiplied by 182/365 (to reflect the one-half year period).
† The annualized expense ratios include dividend expense and interest expense incurred during the six-month period. Annualized dividend expense and interest expense of average net assets totaled 0.29%. Had these expenses not been included the ratios would have been 0.92% and 1.10%, respectively.
INVESTMENT ADVISERRiverPark Advisors, LLC
156 West 56th Street, 17th FloorNew York, New York 10019
CUSTODIANBrown Brothers Harriman & Co.
40 Water StreetBoston, Massachusetts 02109
PRIME BROKERGoldman Sachs & Co.
200 West Street, 3rd FloorNew York, New York 10282
TRANSFER AGENTDST Systems, Inc.
333 West 11th Street, 5th FloorKansas City, Missouri 64105
ADMINISTRATORSEI Investments Global Funds Services
One Freedom Valley DriveOaks, Pennsylvania 19456
INDEPENDENT REGISTERED PUBLIC ACCOUNTING FIRMCohen & Company, Ltd.
1350 Euclid Avenue, Suite 800Cleveland, Ohio 44115
DISTRIBUTORSEI Investments Distribution Co.
One Freedom Valley DriveOaks, Pennsylvania 19456
FUND COUNSELBlank Rome LLP
1271 Sixth AvenueNew York, NY 10020
This information must be preceded or accompanied by a current prospectus for the Trust.
RPF-SA-001-1100