Semantic Image Search and Subset Selection for Classifier...
12
Semantic Image Search and Subset Selection for Classifier Training in Object Recognition Rui Pereira 1 , Lu´ ıs Seabra Lopes 1,2 and Augusto Silva 1,2 1 IEETA, Universidade de Aveiro, 2 DepartamentodeElectr´onica,Telecomunica¸c˜oeseInform´atica, Universidade de Aveiro, {ruipereira,lsl,augusto.silva}@ua.pt Abstract. Robots need to ground their external vocabulary and inter- nal symbols in observations of the world. In recent works, this prob- lem has been approached through combinations of open-ended category learning and interaction with other agents acting as teachers. In this paper, a complementary path is explored, in which robots also resort to semantic searches in digital collections of text and images, or more generally in the Internet, to ground vocabulary about objects. Drawing on a distinction between broad and narrow (or general and specific) cat- egories, different methods are applied, namely global shape contexts to represent broad categories, and SIFT local features to represent narrow categories. An unsupervised image clustering and ranking method is pro- posed that, starting from a set of images automatically fetched on the web for a given category name, selects a subset of images suitable for building a model of the category. In the case of broad categories, im- age segmentation and object extraction enhance the chances of finding suitable training objects. We demonstrate that the proposed approach indeed improves the quality of the training object collections. 1 Introduction In robotics, as in human cognition, reasoning and communication are activities that involve the manipulation of symbols. Symbols must ultimately be grounded in categories learned through observation, sensorimotor experience and interac- tion with other agents [1][6][13]. This paper focuses on category learning and symbol grounding through vi- sual perception. This is relevant for grounding the names of (or internal symbols used to refer to) physical objects. In the computer vision literature, this problem has been normally addressed through approaches based on gathering training ex- amples for a pre-defined set of categories, running an algorithm to induce some knowledge about the categories and, finally, testing the induced knowledge on a set of unseen cases [5]. A recent exception is the approach of [18], in which an incremental version of Support Vector Machines is used to acquire visual cate- gories. In the context of human-robot interaction, some recent approaches also explore the combination of incremental learning and interaction with teachers to ground vocabulary about physical objects [11][12][13][14].
Transcript of Semantic Image Search and Subset Selection for Classifier...
Semantic Image Search and Subset Selection for
Classifier Training in Object Recognition
Rui Pereira1, Luıs Seabra Lopes1,2 and Augusto Silva1,2
1 IEETA, Universidade de Aveiro,2 Departamento de Electronica, Telecomunicacoes e Informatica,
Universidade de Aveiro,{ruipereira,lsl,augusto.silva}@ua.pt
Abstract. Robots need to ground their external vocabulary and inter-nal symbols in observations of the world. In recent works, this prob-lem has been approached through combinations of open-ended categorylearning and interaction with other agents acting as teachers. In thispaper, a complementary path is explored, in which robots also resortto semantic searches in digital collections of text and images, or moregenerally in the Internet, to ground vocabulary about objects. Drawingon a distinction between broad and narrow (or general and specific) cat-egories, different methods are applied, namely global shape contexts torepresent broad categories, and SIFT local features to represent narrowcategories. An unsupervised image clustering and ranking method is pro-posed that, starting from a set of images automatically fetched on theweb for a given category name, selects a subset of images suitable forbuilding a model of the category. In the case of broad categories, im-age segmentation and object extraction enhance the chances of findingsuitable training objects. We demonstrate that the proposed approachindeed improves the quality of the training object collections.
1 Introduction
In robotics, as in human cognition, reasoning and communication are activitiesthat involve the manipulation of symbols. Symbols must ultimately be groundedin categories learned through observation, sensorimotor experience and interac-tion with other agents [1][6][13].
This paper focuses on category learning and symbol grounding through vi-sual perception. This is relevant for grounding the names of (or internal symbolsused to refer to) physical objects. In the computer vision literature, this problemhas been normally addressed through approaches based on gathering training ex-amples for a pre-defined set of categories, running an algorithm to induce someknowledge about the categories and, finally, testing the induced knowledge on aset of unseen cases [5]. A recent exception is the approach of [18], in which anincremental version of Support Vector Machines is used to acquire visual cate-gories. In the context of human-robot interaction, some recent approaches alsoexplore the combination of incremental learning and interaction with teachersto ground vocabulary about physical objects [11][12][13][14].

In a technological world with endless information resources easily accessible,the dynamic combination of direct perception of the environment and human-robot interaction can be complemented by unsupervised semantic searches e.g.on the Internet. The present paper explores this complementary path. Specifi-cally, the paper focuses on semantic retrieval of images (from the Internet) andunsupervised image subset selection for visual category learning.
This work was carried out in the context of the development of UA@SRVC,a software agent that participated in the Semantic Robot Vision Challenge (2ndedition, Anchorage, Alaska, July 2008, sponsored by NSF and Google). In thischallenge, the competing agents are initially given a list of names of categories(e.g. ’coffee cup’ or ’Coca Cola can’). Spelling of these names follows some con-ventions: proper names have their first letter capitalized; common names aregiven in lower case; titles of books, films, etc., are given between quotes. In alearning phase, agents can search for information about the categories on the In-ternet. In the performance phase, they will have to search for specific instancesof the categories in an environment prepared by the SRVC organizers (or, inthe case of software agents, in images of that environment). Other aspects ofUA@SRVC are presented in a separate paper[10].
The work presented in this paper is concerned with the Internet search phase.The basic problem addressed here is the following: given the name of a categoryof objects, gather a set of representative instances of that category and build amodel that can be used later to recognize other, previously unseen, instances.
This is a case of unsupervised learning from uncategorized images [5][4] (asopposed to learning from labeled training data[19]): we cluster the images to-gether according to their visual similarities. Several approaches for automatedsubset selection (or ranking) of uncategorized images exist. In [17], a methodto filter Internet image search results based exclusively on visual content is in-troduced. Inconsistent or strange images are iteratively removed until the k -Nearest-Neighbor strangeness measure drops below a threshold for any of theremaining images. In each iteration, the same measure is used to choose theimage that should be removed. A visual model learning method, applied to im-ages obtained via Google, was proposed by [2]. Firstly, the query is translated tomultiple languages. Then, using multiple-topic pLSA methods, image categorymodels are learned. The same authors [3] had previously developed a methodfor visual category filtering on Google images, by identifying visual consistenciesin the images and using that information to rank them.
The sparse multiple-instance learning (sMIL) approach [16] divides trainingimages into positive and negative bags. Positive bags are those that contain atleast one positive instance, while negative bags contain only negative instances.The classifier can discriminate the positive from the negative instances, evenif their sparsity in the positive training bags is high. To discriminate betweenpositive and negative bags, an objective function is used to determine a decisionboundary, taking into account that the positive bags can be randomly sparse.It’s assumed that images retrieved from the Web contain at least one categoryinstance, thus forming a positive bag. In [7], the authors use the first 15 images
returned by a search engine as the seed of a category, to learn a HierarchicalDirichlet Process category model. This model is then used to classify additionalimages. When these are positively classified they are also incorporated in themodel.
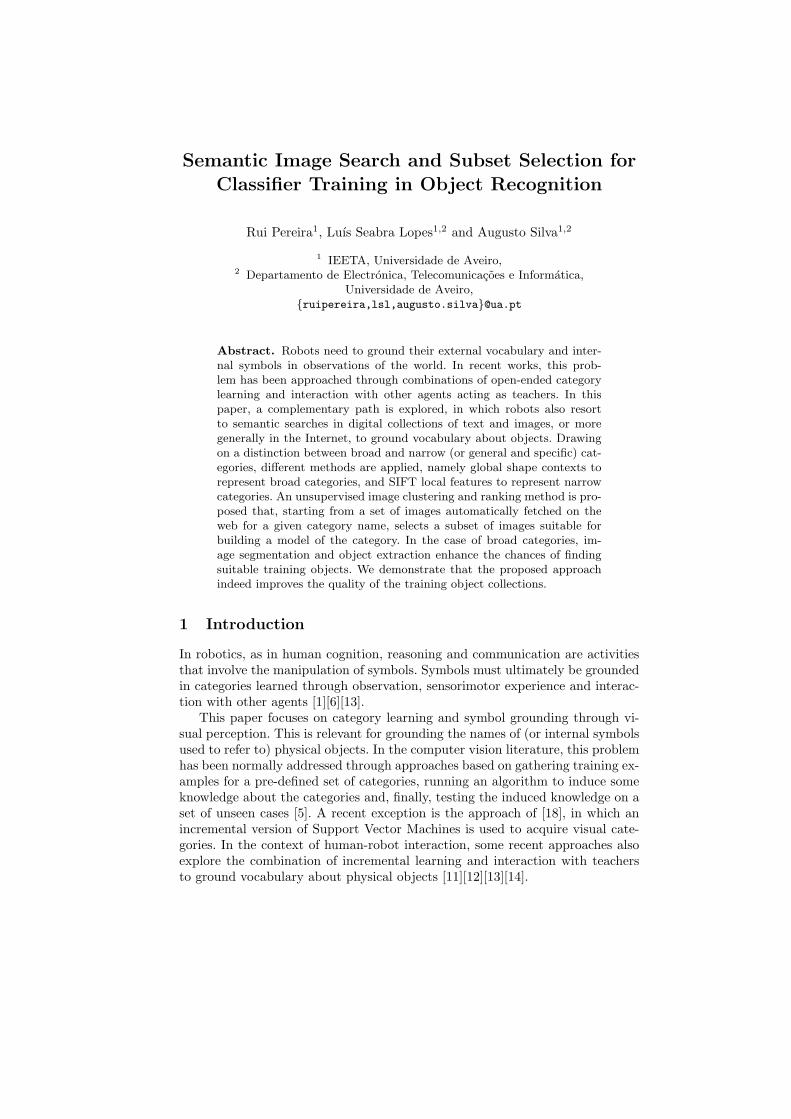
Figure 1 illustrates the flow of information in the category learning mod-ule that was developed for the UA@SRVC agent. The agent takes as input acategory name (or a list of category names) and starts by searching and retriev-ing images from the Web, using queries containing that category. In the caseof broad categories, these images suffer a process of object extraction, in whichimages that contain more than one object are segmented into sub-images andnoise is discarded as much as possible. Ideally, each sub-image should contain asingle object. After this initial pre-processing step, we select a subset of imagesfor training. The goal is to discard as many unrepresentative images as possible,while keeping a good set of category instances. The learning phase is concludedby building models for the categories that are invariant to scale, rotation and,to some extent, deformation.
!"#$%"$#
&$#'($% )$#%*$+$,-!./0$1
234$'#-$5#%/'#*6"
7831$#-7$9$'#*6"
:*1'/%,$,-*./0$-1831$#
7$9$'#$,-*./0$-1831$#
;6,$9-38*9,*"0
</#$06%=.6,$91
</#$06%=-"/.$
Fig. 1. System overview.
The paper is organized as follows: Section 2 describes image retrieval andpre-processing. Section 3 describes the used representations. Section 4 describesthe unsupervised subset selection approach that is proposed. Section 5 describesthe experiments that were carried out to evaluate subset selection performanceand the results obtained. Finally, section 6 concludes the paper.
2 Image retrieval and pre-processing
Images are initially searched and retrieved using Google. Since many of theseimages may contain several (possibly irrelevant) objects, these objects are ex-tracted and separately considered.
Image search and retrieval. A Perl script, developed based on the WWW::Google::Images module, was used to retrieve a set of images from the Internetusing the Google search engine. Only JPG images with a maximum width of1200 pixels are retrieved. The maximum number of downloaded images is 20for specific categories and 40 for general categories. If more images than themaximum are found, only the best images, according to the Google ranking, areused.

General categories are searched with a query beginning in allinurl:, meaningall query words must be found in the image URL. Since, for the most part, generalcategories don’t have many words in their name, we maximize the chances ofretrieving good images if we force the name to be in the URL. If a search for aspecific category doesn’t retrieve the maximum number of images and the querycontains quotes, then a new search is conducted, removing the quotes from thequery. Since we don’t use color information, when a search for a general categorydoesn’t return the maximum number of images and the category name has a colorin it (e.g. “red apple”), a new search is conducted, removing the color informationfrom the query. When searching for a general category, if the maximum numberof images is not reached, a new search is conducted, removing allinurl: from thebeginning of the query. Note that this can happen after the removal of the colorinformation from the query.
Object Segmentation and Extraction. When processing a retrieved image,the agent must check if the image contains objects other than the intended. Animage with several objects, for example, will produce a shape representationthat can’t be used for anything useful, unless the goal is to detect those objectsin the same relative positions in other scenes. These problems are solved byobject segmentation and extraction. Due to space limitations, only a very coarsedescription of the used method will be provided here.
The image is first smoothed by using a Gaussian filter to reduce noise. ACanny edge detector is used to find the edges. The result is a set of whitepixels over a black background. Next, the detected edge pixels are followed,trying to isolate individual objects. After detecting a pixel at the boundary ofan object, region growing is used to extract its shape. The neighboring pixels ofthe detected pixel are scrutinized to determine if they should be added to theobject being segmented, i.e., if it’s also part of the contour. If a bifurcation isreached, its localization is saved and one of the branches is followed. When thispath terminates, the process backtracks to the last found bifurcation and takesthe unexplored branch.
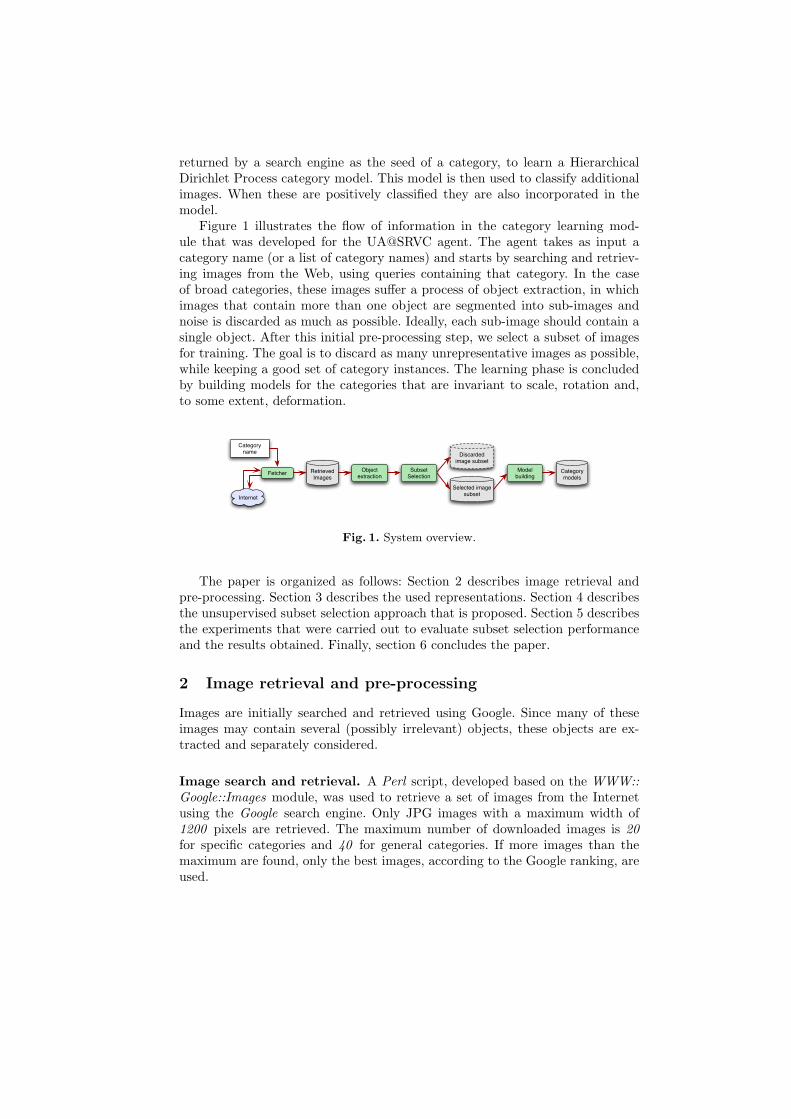
After the contour is established, its extreme coordinates (bottom, top, leftand right) are determined. In a first scan, if a pixel is determined to be inside thecontour window and it has white pixels below, above and at both sides, then it’salso marked as white. In a second scan, pixels that are inside the same windowbut are black are also added to the shape if the majority of their 8 neighbors iswhite. This is useful because a shape is not always defined by connected edges.In fact, there are several possibilities for a contour to be a candidate object orobject part, as seen in Figure 2.
If we start in a point and end up in the vicinity of the same point (Figure2(a)), or if the edge leads to the image boundary (Figure 2(b)) or if it is notcontinuous but defines an area (Figure 2(c)) then it’s possible that this edgedefines an object or a component of one.
The next step is the aggregation of edges potentially belonging to the sameobject. Since an edge doesn’t necessarily define an object, edges are grouped
!"# !$# !%#
Fig. 2. Extraction cases. These are the basic cases we might encounter while extractingthe objects. (a) The object has a defined an continuous contours. (b) The object con-tours touch the image edges and are continuous. (c) The contours are not continuous.
together according to the average distance of their pixels to their geometriccenters, GC, and the distance between geometric centers. If the distance betweenthe GCs of the edges is smaller than the sum of the average distances of theirrespective pixels to their GCs multiplied by a constant factor k3, then the edgesare aggregated and count as a single object. This is an iterative process, whichstops when no more edges can be aggregated.
Finally, two filtering operations are carried out. The first will identify andremove small objects, which are likely to be noise. The other filtering step consistsof removing the objects with a number of edge pixels clearly above average, whichmost likely are cluttered images.
3 Representations and similarity measures
Broad and narrow categories. The UA@SRVC agent divides categories intotwo main groups: broad (general) categories, whose instances can exist in awide variety of forms and narrow (specific) categories, whose characteristics areregular and well defined, therefore resulting in high intra-category similarity.Broad categories are identified by common nouns in natural language (e.g.: chair,table, etc.). Narrow categories are identified by proper nouns (frequently brandnames) or quoted expressions.
The need for this distinction between broad and narrow categories arises fromthe fact that some methods are more suited to broad categories while others aremore suited to specific categories[10]. For instance, SIFT [9] local features arehighly distinctive and are, therefore, very useful for modeling narrow categories,that are rich in descriptive features and with low intra-category variation. How-ever, they fail on more general categories, low in descriptive features and withhigh intra-category variation. In contrast, shape representations are good forrepresenting the common features of objects in broad categories, but may fail to
3 In the current version, the multiplicative factor k has the value of 1.0.

capture the distinctive details in narrow categories. In this work, we use a globalshape representation for broad categories and a SIFT-based representation fornarrow categories.
Global shape context. The used shape representation is a polar histogramof edge pixels[10]. A frame of reference is located at the geometric center of theobject. Then, the space around the centre up to the most excentric pixel of theobject is divided into a slices (angle bins) and d layers (distance bins) 4. Theintersection of slices and layers results in a polar matrix (Figure 3) that willbe mapped to a 2D histogram counting the number of pixels in each cell. Thishistogram is finally normalized by dividing the counts for each cell by the totalcount. The histogram is built in O(n) time, where n is the number of edge pixels.
Fig. 3. Shape Context as a global descriptor.
The proposed representation is translation invariant since it’s computed in aframe of reference centered in the object. It is also scale invariant because thehistogram is normalized by the radius of the minimal circle enclosing the objectand centered in its geometric center. The histogram itself is not invariant torotation. To make a rotation invariant matching possible, we rotate one of thehistograms a times while comparing the two shapes. The lowest distance is theone used to calculate the similarity between the two shapes.
The χ2 distance is used to represent the distance between the histograms.For further details, including comparative performance evaluation, see [10].
SIFT local features. As mentioned above, the UA@SRVC agent representsobjects in ”narrow” categories through sets of local features extracted by SIFT(Scale Invariant Feature Transform) [9]. SIFT produces highly distinctive imagefeatures that can be used for matching objects with different scales, positionsand orientations, as well as with some variations in illumination. These featuresare computed in reference frames aligned with image gradients.
4 a=40 and d=10 were used.

When matching two objects, the features in each of them are paired accordingto a nearest-neighbor criterion. Then, instead of using a global threshold todiscard matches, the distance to the nearest neighbor and to the second nearestis compared. If the ratio between the former and the latter is greater than 0.35,the pair of features is rejected. Finally, similarity between two objects is givenby the number of accepted pairs of features.
As similarity computation does not depend on object segmentation and ex-traction, such pre-processing is not used in categories processed by SIFT.
Category representations. Broad (or general) categories are represented bythe sets of objects that were selected, where each object is represented by itsglobal shape context. Narrow categories are represented by the concatenation ofthe SIFT features of each individual object selected for that category.
4 Unsupervised subset selection
Image sets retrieved from the Web for a category will always have an amountof noise. This section presents an unsupervised method for selecting a subsetof representative images, discarding those irrelevant or noisy. The approach isbased on repeating a basic clustering algorithm a number of times and rankingimages based on how often they were included in the largest cluster.
Object clustering algorithm. An unsupervised clustering process is con-ducted over the images obtained through the Internet search and pre-processingsteps. Clustering the images according to their similarity usually results in: alarge cluster with most of the good representatives of the target category (i.e.images containing true instances of the category and with little noise); severalother (usually smaller) clusters with various outliers. The larger the percentageof good images in the initial set, the higher is the probability that the largestcluster actually contains good representatives of the target category.
Clustering is done using the k-means[15] algorithm with Lloyd’s iterative re-finement heuristic [8] and some additional modifications designed to solve ourproblem. Lloyd’s heuristic starts with seeding a number k of clusters by ran-domly selecting k images from the initial set of N images, where k < N . Then,the remaining N−k images will be added to the closest clusters. Since the objectrepresentations described above are not organized in vector spaces (the numberof extracted SIFT features varies from object to object and the matching ofshape contexts requires rotation), the used clustering algorithm does not com-pute centroids. Instead, the proximity of an object to a cluster is evaluated byaverage similarity to the members of the cluster (the similarity measures wereidentified in the previous section).
After setting up this initial group of clusters, the iterative refinement processstarts. In each iteration, for each object, the average similarity to the remainingmembers of its current cluster and the average similarities to the members of the
remaining clusters are computed. If the minimum value is obtained for a clusterthat is different from the current cluster of the object, the object is moved tothat cluster. The process terminates when a complete iteration is run withouttransferring objects between clusters. A post-processing step makes sure thereis only one cluster with the largest number of objects. If there is a tie betweentwo or more clusters, the cluster having the closest non-member will receive thisextra object, therefore becoming the single largest cluster.
Object ranking and selection. The basic clustering algorithm just describedis run for different values of the number of clusters, k. It starts with N/4 andincrementally gets to N/2−1. Since randomness leads to variations in the clustersproduced in each run, the whole process described until now is repeated a certainnumber of times, K, to provide a reliable sampling5. The total number of runsis then K × (N/2 − N/4).
The number of times, Xi, each object i was included in the main clusterin these runs is updated after every run. At the end, the images are rankedaccording to Xi. The final selection is determined by going through the imagesin descending order of Xi and adding them to the selection while the followingcondition holds:
S∑
s=1
Xi(s) < η ×
N∑
i=1
Xi (1)
where S is the number of images included in the selection, s is a rank position,i(s) identifies the image in rank position s, and η ∈ [0, 1] is the reject threshold 6.When the selection process terminates, the remaining N−S images are assumedas noisy/irrelevant and therefore discarded.
5 Performance evaluation
Images retrieved from the Web are matched among themselves and clustered,using the modified K-means algorithm described above, to select a subset thatcorrectly represents the target category. Before this selection, we perform a man-ual, visual analysis of the retrieved images and count how many of them con-stitute suitable training images to build a correct model of the category. In thecase of shape-based subset selection, images containing several instances of thetarget category, or with highly stylized objects, or with high background noisearound the contours, or not containing any instance of the category are not goodtraining images.
Building a good SIFT model for an object doesn’t require such a strict se-lection as is necessary for a good shape model. First, since SIFT is used for
5 K = 100 was used in the implementation6 η = 0.85 was used in the implementation.

specific categories, it will already start with some advantage. Furthermore, be-cause SIFT is tolerant to occlusion, noise, etc., an image can have a partiallyhidden, deformed or not alone object and still be useful for building a model.
We compare the percentage of good images in the original set with the per-centage of good images in the selected subset to determine if improvement exists.
Shape-based subset selection without object extraction. A total of 31categories (some of which were used in SRVC’2007 and ’2008) were selectedto benchmark the subset selection based on shape analysis. For each of thesecategories, 37 images, on average, were retrieved from the Internet. Only 40% ofthe retrieved images could be considered good for training.
After selecting the good images in the initial set, we check to see which oneswere selected. Figure 4(a) plots the percentage of good images in the selectionversus the percentage of good images in the initial set. The categories are iden-tified by numbers in Figure 4 and their names are listed on the right. The linearregression line is given by the function f(x) = 1.33x − 0.04. For x > 0.15, theregression line has the property of f(x) > x, meaning there’s improvement. Itcan be concluded that subset selection improves the quality of the training set.
!"# !$#
%&'()*+,-".*,/+
%0'.*1*2345*/+
%6')"1*57"8/+
%9'3"::*8/+
;<')14.3*,+3"5=*8/+
;%'*1*).8()+(845/+
;;'=8**5+"221*/+
;>'8*7+$*11+2*22*8/+
;?'8411(5=+,@(.)",*/+
;A'8*7+21",.()+)@2/+
;&'$1@*+78B+*8",*8/+
;0'."2*+7(,2*5,*8/+
;6')4:2@.*8+:4@,*/+
;9')3"(8/+
><'54-("+)*112345*/+
>%'$",*$"11+3".C
%'$()B)1*+3*1:*./+
;',2445/+
>'.8",3)"5/+
?'2*"8/+
A'48"5=*/+
&',)(*5.(!)+)"1)@1".48/+
0'D48-/+
6'$"5"5"/+
9'7*,-/+
%<'."$1*/+
%%'*B*=1",,*,/+
%;',."21*/+
%>')4DD**+)@2/+
%?'E3(.*$4"87/+
%A')4:2").+7(,)/+! !"# !"$ !"% !"& !"' !"( !") !"* !"+ #
!
!"#
!"$
!"%
!"&
!"'
!"(
!")
!"*
!"+
#
#
$
%
&
'
)
*
+
#!##
#$
#%
#&
#'
#(
#)
#*
#+
$!
$#
$$
$%
$&
$'
$(
$)
$*
$+
%!
%#
%$
! !"# !"$ !"% !"& !"' !"( !") !"* !"+ #
!
!"#
!"$
!"%
!"&
!"'
!"(
!")
!"*
!"+
#
!
"
#$
%
&
' (!)
!!
!"
!#
!$
!%
!*
!&
!'
!(
")
"!
""
"#
"$
"%
"*
"&"'
"(
#)
#!
#"
Fig. 4. Percentages of good images after shape-based subset selection (yy axis) versusthe respective percentages of good images in the initial set (xx axis): (a) without objectextraction. (b) with object extraction. Also shown are the linear regression lines forthe plotted points.
Shape-based subset selection with object extraction. In this case, werun object extraction on the initial set, obtaining a larger set of smaller images.Figure 4(b) plots the percentage of good images after the subset selection as afunction of the percentage of good images in the initial set. The linear regressionline equation is f(x) = 1.24x + 0.08. It can be seen that for all values of x, theregression line has the property of f(x) > x, i.e. the values of the percentages ofgood images in the selected subset are superior to the initial percentages. This

line, compared to the one in Figure 4(a), for the same values of x, always hashigher f(x) values, which means object extraction improves the final result.
SIFT-based subset selection. We selected 25 categories for this test. Thecategories are identified by numbers in Figure 5 and their names are listed to theright of this figure. For each category, 19 images were obtained through Internetsearch, on average. In the initial sets, the percentage of good images was 53%on average.
The performance of subset selection with SIFT for narrow categories is verygood. After subset selection, this percentage increases to 79%. Figure 5 plots thepercentage of good images in the subset (yy axis) as a function of the percentageof good images in the initial set (xx axis). The figure also shows a linear regressionline f(x) = 1.29x+0.1, where from the beginning (x = 0) the values of f(x) arealways higher than x, meaning there is a significant improvement of the subsetwith respect to the initial group. The slope is inferior to the ones of Figure4 (shape-based subset selection), even though we have a significantly betterimprovement in narrow categories using SIFT-based subset selection. This factcan be explained by the number of categories located in the lower values of x,i.e., categories with poor percentages of good images. In the case of Figure 5,this quantity is smaller, a basis that also accounts for the better performance.
! !"# !"$ !"% !"& !"' !"( !") !"* !"+ #
!
!"#
!"$
!"%
!"&
!"'
!"(
!")
!"*
!"+
#
#
$
%
& ' (
)
*
+
#!#$
#%
#&
#'#(#)#*
#+
$!
$#
$$
$%
$&$'
!"#$%&"#$'&(%&)*(+",--'.(/01$).*(2"3455.6!)7.6(%&)89(:&6*(;"<=8(>2??@*(A"#<(BC/)&'(D56&EB(:9(D)$E(0&56$'*(F"#&8:469(#&6&G/'H*(I"JE/)/)7K(L&6'(M6.9(J.&*(N"O/)5.)8$(P//(:$Q*(R"#<(BS$$H",'/H.K(T6UB(:9(T$&)(D5./).6*(!?"V/55.6(D-$65(<&6H(#1$%$'&5.*(!!",.6/4K(,''.679*(!+"#<(BW)56$84%/)7(T$KK(D5$).B*(!2"<X<(BY&8&7&K%&6B*(
!;"#$'7&5.(J$5&'*(!A"<&K&)/(E&5.6*(!F":$$H(B,65/!%/&'(W)5.''/7.)%.Z(,(Y$8.6)(,--6$&%1B*(!I"J1.(L%$)$G/K5(G&7&[/).*(!N"%8(B\.9(L47.).B*(!R"].''$77^K(#$6)(C'&H.K*(+?"06/)7'.K(#&)*(+!"C&)5&(_6&)7.(#&)*(++"D$)9(,W3_*(+2"V9$:/(86/''*(+;":$$H(B06$:&:/'/K5/%(V$:$5/%KB*(+A"#6&9$'&(#6&9$)K(:$Q
Fig. 5. Subset selection with SIFT: percentages of good images after the subset selec-tion (yy axis) versus the respective percentages of good images in the initial set (xxaxis). Also shown is the linear regression line for the plotted points.
These images, which are rich in features, provide a solid basis for the cluster-ing algorithm to filter out the noise. Only one category - Aerius Allergy (categorynumber 11) - gave worse results in the selected subset than in the initial set ofimages. It’s also worth noting that, apart from category number 9 (CD “LookAlikes Jr.” by Joan Steiner), which had 0 good images in the initial set, hencebeing impossible to improve, the category Aerius Allergy is the one with the low-est percentage of good images in the initial group. Searching for Aerius Allergyreturns images with two different brand designs. In other words, this category
is heterogeneous and the two retrieved sub-categories don’t share enough SIFTfeatures to build the category model. Due to this heterogeneity and to the lownumber of good training images, the clustering and subset selection don’t per-form so well. On the positive end, we can also see that many categories originateda subset where 100% of the images are good training images.
6 Conclusions and future work
This paper explored semantic web searches and unsupervised subset selectionfor gathering images that can be used for building models of visual categories.Although there may be other applications, the described functionalities appearrelevant in the context of robotics as a complementary means for enabling robotsto ground the symbols they use in reasoning and communication. English ex-pressions refering to physical objects are mapped to visual categories. SIFTlocal features are used for representing narrow categories while shape contextsare used as global descriptors for broad categories. The use of shape contextsas global descriptors for broad categories provides a faster and simpler methodthan the method in which shape contexts were originally used.
Retrieving images from the Web using only keyword-based searches resultsin sets of images that cannot be directly used for category representations. Infact, it was observed that between 47% and 60% of the retrieved images areirrelevant or noisy. To solve this problem, a new unsupervised image clustering,ranking and selection method was proposed that, starting from a set of imagesautomatically fetched on the web for a given category name, selects a subsetof images suitable for building a model of the category. In the case of broadcategories, image segmentation and object extraction enhance the chances offinding suitable training objects. We demonstrate that the proposed approachindeed improves the quality of the training object collections. For initial setswith 50% of good images, the final percentage of good images in the selectedsubset varies between 63% and 75%.
Improvements on the segmentation algorithm and inquiries on the possibilityof a better method to discriminate two different shapes while extracting objects,as well as a better way to remove noise, should be studied in future work. Also,since our work ignores color information, categories such as “green apple” or “redpepper” do not benefit from this distinguishing feature, a limitation that shouldbe tackled in future iterations. The integration of the system in a hardwareplatform would be an interesting step in its development.
7 Acknowledgements
The first author is currently with a research grant funded by Aveiro University.The participation of the UA@SRVC team in SRVC’2008 was partially funded byGoogle. The implementation of SIFT used in our work was developed by RobHess and is publicly available. The implementation also used OpenCV exten-sively.

References
1. Belpaeme, T., and Cowley, S. Extended symbol grounding. Interaction Stud-ies,8(1) (2007), 1–6.
2. Fergus, R., Fei-Fei, L., Perona, P., and Zisserman, A. Learning object cate-gories from google’s image search. In ICCV ’05: Proceedings of the Tenth IEEE In-ternational Conference on Computer Vision (Washington, DC, USA, 2005), IEEEComputer Society, pp. 1816–1823.
3. Fergus, R., Perona, P., Zisserman, A., and Science, D. E. A visual categoryfilter for google images. In In Proc. ECCV (2004), pp. 242–256.
4. Fritz, M., and Schiele, B. Towards unsupervised discovery of visual categories.In DAGM06 (2006).
5. Grauman, K., and Darrell, T. Unsupervised learning of categories from setsof partially matching image features. Computer Vision and Pattern Recognition,2006 IEEE Computer Society Conference on (2006), 19–25.
6. Harnad, S. The symbol grounding problem. Physica D, 42 (1990), 335–346.7. Li, L.-J., Wang, G., and Fei-Fei, L. Optimol: automatic online picture collection
via incremental model learning. In Computer Vision and Pattern Recognition,2007. CVPR ’07. IEEE Conference on (2007), pp. 1–8.
8. Lloyd, S. Least squares quantization in pcm. In Information Theory, IEEETransactions on (1982), vol. 28, pp. 129–137.
9. Lowe, D. G. Distinctive image features from scale-invariant keypoints. Interna-tional Journal of Computer Vision 60 (2004), 91–110.
10. Pereira, R., and Seabra Lopes, L. Learning visual object categories with globaldescriptors and local features. Progress in Artificial Intelligence: 14th PortugueseConference on Artificial Intelligence - EPIA’2009, LNCS/LNAI, Springer (2009),In Press.
11. Roy, D., and Pentland, A. Learning words from sights and sounds: a compu-tational model. Cognitive Science, 26 (2002), 113–146.
12. Seabra Lopes, L., and Chauhan, A. How many words can my robot learn?an approach and experiments with one-class learning. Interaction Studies, 8(1)(2007), 53–81.
13. Seabra Lopes, L., and Chauhan, A. Open-ended category learning for languageacquisition. Connection Science, 8(4) (2008), 277–298.
14. Steels, L., and Kaplan, F. Aibo’s first words: the social learning of languageand meaning. Evolution of Communication,4(1) (2002), 3–32.
15. Steinhaus, H. Sur la division des corp materiels en parties. Bulletin L’AcadmiePolonaise des Science IV, C1. III (1956), 801–804.
16. Vijayanarasimhan, S., and Grauman, K. Keywords to visual categories:Multiple-instance learning for weakly supervised object categorization. In Pro-ceedings of the IEEE Conference on Computer Vision and Pattern Recognition(2008).
17. Wnuk, K., and Soatto, S. Filtering internet image search results towards key-word based category recognition. Computer Vision and Pattern Recognition, 2008.CVPR 2008. IEEE Conference on (June 2008), 1–8.
18. Yeh, T., and Darrell, T. Dynamic visual category learning. Computer Visionand Pattern Recognition, 2008. CVPR 2008. IEEE Conference on (June 2008),1–8.
19. Zhou, X. S., and Huang, T. S. Relevance feedback in image retrieval: A com-prehensive review. Multimedia Systems, vol.8, no.6, (2003), 536–544.