
Semantic Algorithm for Industrial Symbiosis Network … · Semantic Algorithm for Industrial...
31
Semantic Algorithm for Industrial Symbiosis Network Synthesis Franjo Cecelja (corresponding author – email: [email protected], tel/fax: +44 1483 686 585), Nikolaos Trokanas, Tara Raafat, Mingyen Yu Centre for Process & Information Systems Engineering, Faculty of Engineering & Physical Sciences, University of Surrey, Guildford, GU2 7XH, United Kingdom Abstract The paper introduces a semantic algorithm for building Industrial Symbiosis networks. Built around ontology modelling of knowledge in the domain of Industrial Symbiosis, the algorithm enables the acquisition of the explicit knowledge from the user through ontology instantiation and input/output matching based on semantic relevance between the participants. Formation of innovative Industrial Symbiosis networks is enabled by decomposition of properties characterising respective resources and solutions, the process optimised for set environmental criteria. The proposed algorithm is implemented as a web service. The potential of the algorithm is demonstrated by several case studies using real‐life data. Keywords Industrial symbiosis, Ontology, Semantic matching, Optimisation, Network Synthesis 1 Introduction Based on the principle of industrial ecology to reduce the use of virgin materials and energy by reusing water, recovering energy and utilising by‐products, the items commonly called waste, Industrial Symbiosis (IS) describes the industrial networks set on an ad‐hoc principle. Such networks focus on trading material, energy and water to gain economic, environmental and social benefits (Lehtoranta et al. 2011). Ad‐hoc principle refers to collaboration between companies which normally do not have established consumer/supplier relationship and which occurs within strict geographical and environmental boundaries (Chertow 2004). Economic benefits are generated by the cost efficiency coming from the off‐market prices of waste material and energy generation and they are driving force for private industry to participate. Tighter integration enables further economic savings through cascading of water and energy and sharing utilities and services and hence yielding collective benefits greater than the sum of individual benefits (Jae‐ Yeon et al. 2006). Tighter integration is also justified by environmental and social grounds. By focusing on reuse of waste, energy and water, environmental benefits are integral part of IS, which include landfill and pollutant savings, reduction in greenhouse gas generations (Mirata and Emtairah 2005), improved resource use efficiency (Chertow 2007) and reduced use of non‐renewable resources (Trokanas et al. 2013). These benefits are further amplified by geographical boundaries and localised operation. Some authors claim that localised operation of IS provides measurable outputs in revitalising urban and rural sites, promotes job growth and retention and encourages more sustainable development (Chertow and Ehrenfeld 2012). It has been proven that environmental and social benefits are driving force behind the interest of city planners (Chertow 2004), economic development experts and real estate developers and agencies to take proactive role and to participate and promote (Alberta and Kevin 2008). In practice, IS occurs locally or regionally as spontaneous process or promoted and otherwise supported by states or regions. Key to establishing symbiosis is the matching of inputs and outputs to make links across industries (Chertow 2004). In contrast to virgin materials, waste materials and waste energy are typically
-
Upload
nguyendang -
Category
Documents
-
view
223 -
download
0
Transcript of Semantic Algorithm for Industrial Symbiosis Network … · Semantic Algorithm for Industrial...
SemanticAlgorithmforIndustrialSymbiosisNetworkSynthesis
FranjoCecelja(correspondingauthor–email:[email protected],tel/fax:+441483686585),NikolaosTrokanas,TaraRaafat,MingyenYu
Centre for Process & Information Systems Engineering, Faculty of Engineering & Physical Sciences, University of
Surrey, Guildford, GU2 7XH, United Kingdom
Abstract
The paper introduces a semantic algorithm for building Industrial Symbiosis networks. Built around
ontology modelling of knowledge in the domain of Industrial Symbiosis, the algorithm enables the
acquisition of the explicit knowledge from the user through ontology instantiation and input/output
matching based on semantic relevance between the participants. Formation of innovative Industrial
Symbiosis networks is enabled by decomposition of properties characterising respective resources and
solutions, the process optimised for set environmental criteria. The proposed algorithm is implemented as
a web service. The potential of the algorithm is demonstrated by several case studies using real‐life data.
Keywords
Industrial symbiosis, Ontology, Semantic matching, Optimisation, Network Synthesis
1 Introduction
Based on the principle of industrial ecology to reduce the use of virgin materials and energy by reusing
water, recovering energy and utilising by‐products, the items commonly called waste, Industrial Symbiosis
(IS) describes the industrial networks set on an ad‐hoc principle. Such networks focus on trading material,
energy and water to gain economic, environmental and social benefits (Lehtoranta et al. 2011). Ad‐hoc
principle refers to collaboration between companies which normally do not have established
consumer/supplier relationship and which occurs within strict geographical and environmental boundaries
(Chertow 2004). Economic benefits are generated by the cost efficiency coming from the off‐market prices
of waste material and energy generation and they are driving force for private industry to participate.
Tighter integration enables further economic savings through cascading of water and energy and sharing
utilities and services and hence yielding collective benefits greater than the sum of individual benefits (Jae‐
Yeon et al. 2006). Tighter integration is also justified by environmental and social grounds. By focusing on
reuse of waste, energy and water, environmental benefits are integral part of IS, which include landfill and
pollutant savings, reduction in greenhouse gas generations (Mirata and Emtairah 2005), improved resource
use efficiency (Chertow 2007) and reduced use of non‐renewable resources (Trokanas et al. 2013). These
benefits are further amplified by geographical boundaries and localised operation. Some authors claim that
localised operation of IS provides measurable outputs in revitalising urban and rural sites, promotes job
growth and retention and encourages more sustainable development (Chertow and Ehrenfeld 2012). It has
been proven that environmental and social benefits are driving force behind the interest of city planners
(Chertow 2004), economic development experts and real estate developers and agencies to take proactive
role and to participate and promote (Alberta and Kevin 2008).
In practice, IS occurs locally or regionally as spontaneous process or promoted and otherwise supported by
states or regions. Key to establishing symbiosis is the matching of inputs and outputs to make links across
industries (Chertow 2004). In contrast to virgin materials, waste materials and waste energy are typically

nonstandard and off‐spec, not originally designed for reuse and highly variable in composition and pattern
of availability. This heterogeneity is difficult to define distinctively and inputs and outputs are characterised
more by tacit knowledge based on associations, know‐how expertise and engineering intuition (Cecelja, F.
et al. 2014b). Although rarely measured explicitly in practice, environmental and social benefits are
presumed in the process of establishing links which inevitably increases number of options to consider,
especially at the early stage of symbiosis. Nonstandard and nonmarket transactions between symbiotic
partners also add to the complexity. It is for these reasons that, as at present, the IS is usually initiated and
the whole process coordinated manually by trained IS practitioners which normally take active part in the
process of decision making; the process which tends to be slow, expensive and coloured by practitioner’s
experience and expertise.
Realising the complexity of the task and cognitive limitations of practitioners in perplexing situations,
purpose built information systems have been introduced to support and facilitate the process. Existing IS
support systems are thoroughly reviewed by (Grant et al. 2010). They typically involve opportunity
identification by mimicking input‐output matching based on explicit data arranged in proprietary
databases, with some exceptions which address collaborative projects and workflow management. These
support systems are dominantly helpful in the second phase of symbiosis, the phase of operation and
monitoring. Such an approach is justifiable by the fact that, with explicit knowledge available, opportunity
identification appears to be a logical starting point. Input/output (I/O) matching appears as a simple
optimisation routine until more tacit knowledge is needed. According to our knowledge, which is confirmed
by Grant et al. (Grant et al. 2010), the only known system attempting to address challenges associated with
the use of tacit knowledge is DIET system introduced by U.S. Environmental Protection Agency (Euzenat
and Shvaiko 2013). DIET is built around production rules as expert system. Although the operation
efficiencies of DIET are not known, the limitations of production rules when dealing with higher level of
tacit knowledge or attempting to share are well known and have been proven in practice (Turban and
Aronson 2001).
Following on previous development and use of ontology to model both explicit and tacit knowledge in the
domain of IS and hence to support the process of IS (Trokanas et al. 2014), this paper proposes a new
framework to synthesise IS networks optimised to improve environmental performance. The proposed
framework is built around the ontology used to i) model tacit knowledge in the domain of IS including to‐
date advances in resource (waste) and solution (technology) classifications, and ii) model explicit
knowledge which includes expanded set of environmental and physical properties of waste and known and
potential technological solutions, as well as the set of respective and commonly used environmental
metrics. Tacit knowledge is built in the structure of ontology, i.e. subsumption and object properties with
respective restrictions (Raafat et al. 2013). From explicit knowledge perspective, ontology is used for
collecting and storing data on IS entities (participants) presented as the ontology instances. In addition, the
proposed ontology enables instance matching, expanding knowledge base, generating new knowledge in
the process of IS operation and knowledge sharing. Designed ontology is prepared to grow. The matching
algorithm developed to match IS entities and to identify IS opportunities based on their I/O characteristics
and the set of operational characteristic (Trokanas et al. 2014) is further expanded to account for
environmental properties and to allow for autonomous and recursive operation towards synthesis of
innovative and more complex IS networks with more than two participants. Innovative solutions are also
generated by decomposition of properties characterising resources and solutions, the process optimised for
environmental savings beyond inherent benefits associated with IS. This paper focuses on the theoretical
concept of knowledge model and design of matching algorithm, as well as optimisation of property
decomposition for given environmental conditions used in the process of synthesising IS networks. Practical
implementa
proposed. T
2 Theo
2.1 ISC
Industrial Sy
to trade m
Unpredictab
principle w
have a long
network is
(Trokanas e
conditions a
between pa
matches (Ch
instead it re
one but diff
I/O matchin
providers
describing t
The propert
numerical (
date). Still, t
a measure
merely by d
The curren
involving m
benefits are
become res
matching in
of the last s
Figure 2 (Tr
cumulative
match betw
options incr
ation for IS
The usefulne
oreticalF
oncept
ymbiosis (IS)
material, en
bility of was
hich operate
g life‐time, b
the discove
et al. 2014),
and perhaps
articipants i
hertow 2000
efers to the
ferent resou
ng between
, is establis
the input of
ties , use
(i.e. quantity
the level of m
of IS proce
decision supp
nt matching
more than tw
e possible w
source (input
n Figure 1 to
solution prov
rokanas et a
measure of
ween only tw
reases expon
which supp
ess and opera
Formulat
) is a networ
nergy and/
ste availabili
e within con
ut then it wo
ery of matc
which fully
s local or oth
s rare and
0). Here the
resource or
rce or solutio
participants,
shed by mat
the solution
d for match
y or availabil
match is exp
ss and whic
port agents.
F
practice is
wo partners
with more co
t) to anothe
a chained ne
vider in the
l. 2014). The
match, the
wo participan
nentially with
F
ports IS netw
ation of prop
tionofIn
rk of compa
or water t
ity sets IS in
nfined geogr
ould normal
hing particip
or partially
herwise spec
in majority
term partici
solution the
on and then
, the resourc
tching the p
n, as shown
ing are eithe
lity period),
pected to be
ch is easier
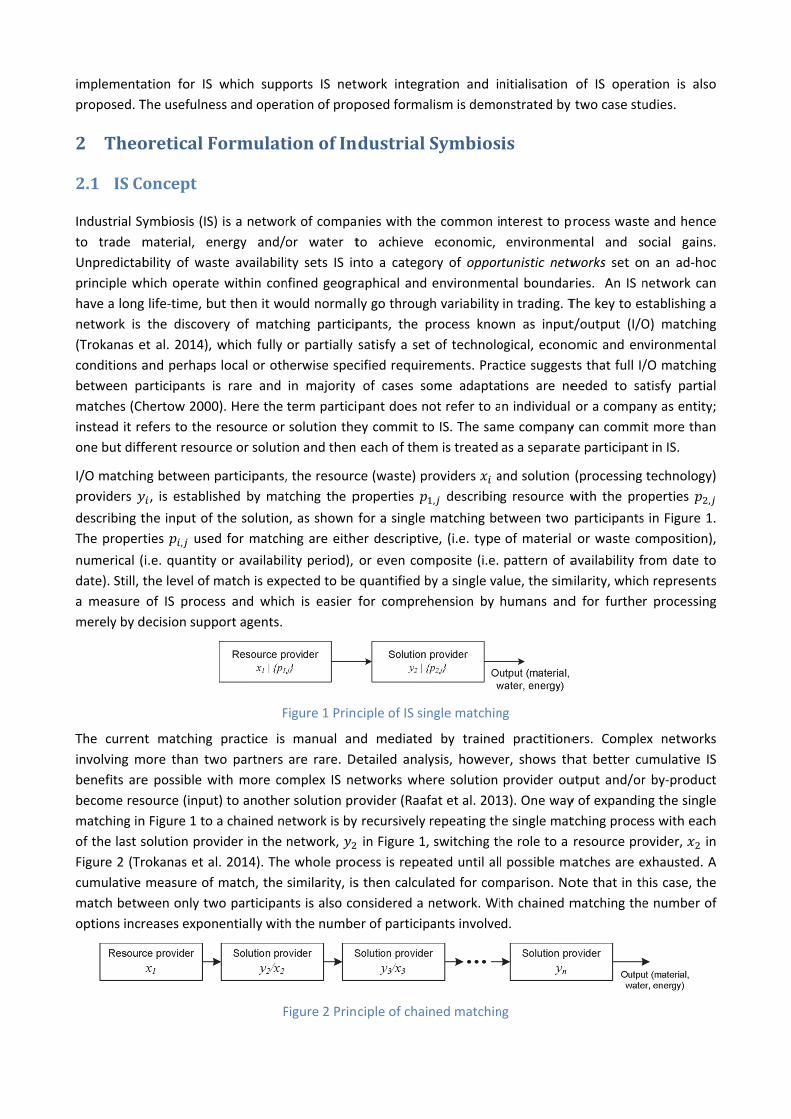
Figure 1 Princ
manual an
are rare. De
omplex IS ne
r solution pr
etwork is by
network,
e whole proc
similarity, is
nts is also co
h the numbe
Figure 2 Prin
work integr
posed forma
dustrial
nies with th
to achieve
nto a catego
aphical and
ly go throug
pants, the p
satisfy a set
cified require
of cases so
pant does n
ey commit to
each of them
ce (waste) pr
properties
for a single
er descriptiv
or even com
quantified b
for compreh
ciple of IS sin
nd mediated
etailed analy
etworks whe
rovider (Raaf
recursively
in Figure 1,
cess is repea
s then calcul
onsidered a n
er of particip
ciple of chai
ation and in
lism is demo
Symbios
e common i
economic,
ory of oppor
environmen
h variability
process know
t of technolo
ements. Prac
ome adapta
ot refer to a
o IS. The sam
m is treated
roviders a
, describin
matching be
ve, (i.e. type
mposite (i.e.
by a single va
hension by
ngle matchin
d by trained
ysis, howeve
ere solution
fat et al. 201
repeating th
switching th
ated until all
ated for com
network. Wi
pants involve
ned matchin
nitialisation
onstrated by
is
nterest to p
environmen
rtunistic netw
ntal boundar
in trading. T
wn as input
ogical, econo
ctice suggest
tions are ne
n individual
me company
as a separat
and solution
g resource w
etween two
of material
pattern of a
alue, the sim
humans and
ng
d practitione
er, shows th
provider ou
13). One way
e single mat
he role to a
l possible ma
mparison. No
th chained m
d.
ng
of IS opera
two case stu
rocess waste
ntal and s
works set o
ries. An IS n
The key to es
t/output (I/O
omic and en
ts that full I/
eeded to sa
or a compa
y can commi
te participan
(processing
with the pro
participants
or waste co
availability f
milarity, which
d for furthe
ers. Comple
hat better cu
utput and/or
y of expandin
tching proce
resource pro
atches are e
ote that in th
matching the
ation is also
udies.
e and hence
ocial gains.
n an ad‐hoc
network can
stablishing a
O) matching
vironmental
/O matching
atisfy partial
ny as entity;
t more than
t in IS.
technology)
operties ,
s in Figure 1.
omposition),
rom date to
h represents
r processing
ex networks
umulative IS
r by‐product
ng the single
ss with each
ovider, in
exhausted. A
his case, the
e number of
o
e
.
c
n
a
g
l
g
l
;
n
)
.
,
o
s
g
s
S
t
e
h
n
A
e
f
More comp
decomposit
than one fo
period of av
shown in Fig
offered by
smaller por
resource pr
, , ⋯ ,of property
Figure 4 wh
resource co
provider ca
Several crit
decompose
committed
specified co
performanc
based on m
of the pro
programmin
plex networ
tion of (som
ollow‐on sol
vailability of
gure 3 for th
the resourc
rtions ,rovider and c
which do
y decomposit
here typicall
onsumer. Rev
n be served
teria for dec
ed property
to IS; ii) to s
ost function,
ce of the wh
maximising th
ocess of IS
ng to optimi
rks and hen
e) propertie
ution provid
resources a
he first stage
ce provider a
, ⋯ , such
characterise
not overlap
tion, the con
y each reso
versibly, it co
by more tha
Figu
composing p
to the highe
satisfy the ne
, i.e. to maxi
ole network
he environm
to orchestr
se property
Figure 4
ce more ex
s. More pre
der or resou
nd solutions
of matching
and characte
h that ∑d by the pro
p each other
ncomitant n
urce provide
ould be obse
n one resou
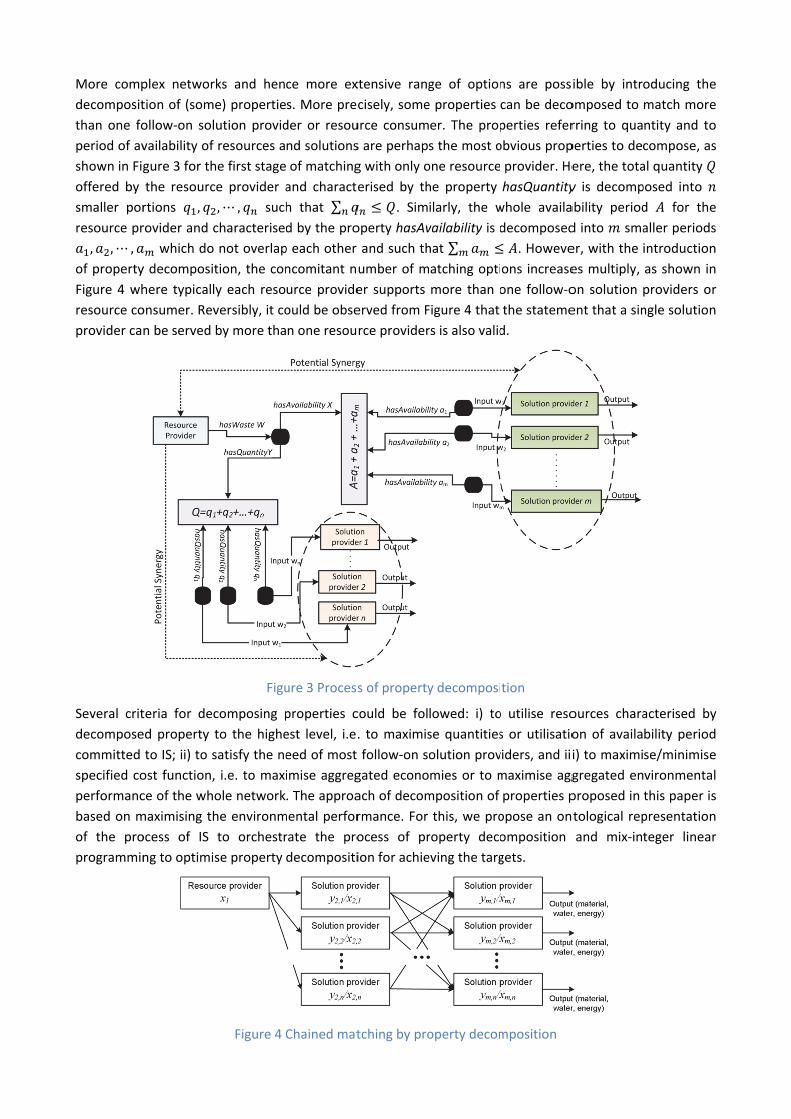
ure 3 Process
properties c
est level, i.e.
eed of most
imise aggreg
. The approa
mental perfor
rate the pro
decompositi
Chained mat
xtensive rang
cisely, some
urce consum
s are perhap
g with only o
erised by th
. Sim
operty hasAv
and such th
umber of m
er supports
erved from F
rce provider
s of property
could be fol
. to maximis
follow‐on s
gated econo
ach of decom
rmance. For
ocess of pr
ion for achie
tching by pro
ge of option
e properties
er. The prop
s the most o
one resource
he property
ilarly, the w
vailability is d
hat ∑atching opti
more than o
Figure 4 that
rs is also valid
y decomposi
lowed: i) to
se quantities
olution prov
mies or to m
mposition of
this, we pro
roperty deco
eving the targ
operty decom
ns are poss
can be deco
perties refer
obvious prop
provider. He
hasQuantity
whole availa
decomposed
. Howeve
ons increase
one follow‐o
the stateme
d.
tion
o utilise reso
s or utilisatio
viders, and iii
maximise agg
properties p
opose an on
omposition
gets.
mposition
ible by intr
omposed to
rring to qua
perties to dec
ere, the tota
y is decomp
ability period
d into sma
er, with the
es multiply,
on solution
ent that a sin
ources chara
on of availa
i) to maximi
gregated en
proposed in
ntological rep
and mix‐int
oducing the
match more
ntity and to
compose, as
al quantity
posed into
d for the
aller periods
introduction
as shown in
providers or
ngle solution
acterised by
bility period
se/minimise
vironmental
this paper is
presentation
teger linear
e
e
o
s
e
s
n
n
r
n
y
d
e
l
s
n
r
2.2 TheISDomainOntology
The process of matching, hence the formation of IS networks is orchestrated by an ontology representing
the IS domain (Raafat et al. 2013), e.g. resource (waste) and solution classifications, as well as the operation
of IS (Trokanas et al. 2014). More precisely, the participants, namely resource providers
, , ⋯ , and solution providers , , ⋯ , are instances of the IS domain ontology,
which takes format of a 6‐tuple ⟨ , , , , , ⟩ consisting of:
i) instances characterised by a set of properties, , 1, ⋯ , , , , each
representing an IS participant (resource provider or solution provider) and organised into classes as
, , ∶ , ∧ ∀ , 0, (1)
where is the total number of instances sharing common properties, that is instances with
intensionally equal1 properties , ∶ , . For 0, is an empty class and still having properties , ;
ii) A set of classes with each class having a distinct name hence representing a
concept with respective semantic. As all instances of a class share the common properties (see eq.
(1)), then the set of properties semantically describes the class . Consequently, the intension of
the class is defined as 3‐tuple (Junli et al. 2006);
∶ ⟨ , , ⟩ (2)
iii) A graph , forming a subsumption hierarchy in ontology sense, called the subsumption,
were indicates the edge between the nodes of the graph representing the classes (or concepts).
As such, the edge represents class ( ) ‐ subclass ( ) participation which assumes property
inheritance (from a subclass to a class), such that
⊆ , ∀ ⊆ ∧ (3)
In other words, instances of a subclass are also instances of the class, and also all the properties of a
class are inherited by the subclass . The two non‐empty subclasses and are disjoint classes, if
they do not share any instance, that is if ∩ 0, ∀ ;
iv) The class relationship which is a set of bijective relationships , between all elements of domain
class and range class other than class‐subclass participation ( relationship) and which is
defined as:
, , ∀ , ∈ , (4)
where the term , , refers to a predicate calculus form and hence further enhances the semantic
of the ontology and forms the base for (tacit) knowledge representation;
v) ‐dimensional subsumption of properties defined as
. , ∀,
(5)
Note here that although the inclusion mapping in eq. (4) and (5) is generally possible, we exclude
such a reflexive relationship for the purpose of simplifying the process without limiting practical aspect
1 Two instances are intensionally equal, if they have the same structure of the properties, not necessarily the same property values.
of the application in mind. For , being inverse instant relationship of , , then
( , , ∀ , ∈ , ) is the inverse class relationship of ;
vi) Extension of a class which is defined by the relationship which profiles the structural
properties of the class by its relations with other classes (Junli et al. 2006). For being a subset of
relationship domain and being a subset of relationship range , then the restriction of
dom to is the partial function dom | providing inclusion mapping as
: (6)
and the restriction of rang to is the partial function rang | providing inclusion
map as
: (7)
In consequence, (and ) establishes the binary relationship between:
1. Domain class and range class based on universal and existential quantifiers over
properties of ,
2. Doman class and , ∈ , based on cardinality quantifiers over properties of , and
3. Domain class and , ∈ ∨ , based on equality quantifiers over properties of .
For being the extensions of classes and , respectively, then and are equivalent
classes, if and if ∩ ∪ .
2.3 Matching
Matching between participants, which are in the ontology represented by respective instances, is
performed on the request of one of them, the requester, and based on i) metrics defined over properties
, 1,⋯ , characterising them (only numerical properties will be considered for this type
of matching) and representing explicit IS knowledge, and ii) metric defined over mutual position (distance)
of respective classes in the ontology and representing tacit IS knowledge. In general, for a h‐metric
defined over set of (only) numerical properties , , ∈ , 1,⋯ , ⊆ as
: → (8)
the object , forms a metric space. By observing the set of numerical properties as an ‐
dimensional vector , , , , ⋯ , , , objects , form the vector space2 of vectors. To
this end, every pair of classes , and/or pair of vectors , can be mapped as → :
: → , ≡ , ∈ (9)
For matching the properties, we define a h‐metric over the vector space as mapping from →
so that
: → , (10)
2 In linear algebra, a vector space is a set of vectors together with the operations of addition and scalar multiplication (and also with some natural constraints such as closure, associativity, and so on).
Then, the similarity measure of the object , , is
⋅
‖ ‖,
, 1,2,⋯ , 2 (11)
For matching the position of respective classes and in the ontology, we define a h‐metric over the
set of classes as mapping from → so that
: → , (12)
Then, the similarity measure of the object , , is
min ∈ , , (13)
where , ( , ) is the distance between classes ( ) and another class within the set
measured in number of intermediate edges3 in graph sense along subsumption and along selected
relationships. The process of selecting which relationship to use is application dependent (not all
relationships are necessarily used) and in this work we use properties defined in Table 4.
For an unambiguous quantification of a match between two instances representing IS participants we
aggregate similarity measures and as
(14)
where and are weighting factors deepening the semantics of the ontology similarity and their values
are dictated by the application. More specifically, equation (14) indicates aggregation of tacit similarity
expressed by eq. (13) and explicit similarity expressed by eq. (11) into a single similarity measure
characterising the match between two instances.
2.4 ModellingofEnvironmentalEffects
In the IS domain ontology, three major groups of properties are used to characterise both resources
(waste) and solutions (technologies) and hence to enable assessment of economic ( properties
, , ∈ , 1,⋯ , ⊆ ), environmental ( properties
, , ∈ , 1,⋯ , ⊆ ) and operational ( properties
, , ∈ , 1,⋯ , ⊆ ) benefits, as shown in Table 1. In Table 1 the semantic of the
properties is self‐explanatory by their names (a full description is provided in Appendix C) and the
superscript (N) indicates numerical properties.
Table 1 Properties , used in the IS domain ontology
Property name Operational features
Environmental features
Economic features
Characterising
Resources Solutions IS
operation
hasQuantity(N) √ √ √ √
hasProcessingPrice(N) √ √ √ √
hasAnnualCost(N) √ √ √
isValidFrom(N) √ √ √
3 The term edge represents the links or relationships between the two classes in the graph .
isValidTo(N) √ √ √
hasName √ √ √
isBiodegradable √ √ √
isHazardous √ √ √ √
embodiedCarbon(N) √ √
hasCO2emission(N) √ √ √
hasByProduct √ √ √
needsEnergy(N) √ √ √
needsWater(N) √ √ √
hasConversionRate(N) √ √ √
geo:Lat(N) √ √ √
geo:Long(N) √ √ √
belongToIndustry √ √ √
hasStorageCapacity(N) √ √
hasStorageMethod √ √
hasDeliveryMethod √ √ √
(N) ‐ numerical properties
The environmental performance of IS networks is evaluated by five metrics calculated from environmental
properties in Table 1 and they include: i) landfill diversion savings , ii) embodied carbon impact , iii)
transportation impact TI, and iv) virgin materials saved VMS. Calculation of all five metrics is in detail
explained in reference (Trokanas et al. 2015) and summarised in Table 2.
Table 2 Calculation of environmental metrics
Metric Calculation Variables
Landfill diversion savings
,
,
∗ , , ‐ quantity of exchanged resources, the
ontology property hasQuantity,
, ‐ the disposal cost of the resource (waste),
‐ the landfill tax,
, ‐ resource embodied carbon value, the
ontology property embodiedCarbon,
‐ the carbon dioxide credit price,
, – the factor characterising the emission of
particular mode of transportation, the ontology property hasDeliveryMethod,
, ‐ the distance between IS participants and
calculated from geographical longitude and latitude of participants (the ontology properties geo:Lat and geo:Long),
, ‐ committed resource capacities between the
participants and ,
, – price of the resource as a raw material,
, ‐ price of the resource as a recyclate.
Embodied carbon impact
, ∗ , ∗
,
Transportation impact , ∗ , ∗ , ∗
,
Virgin materials saved
,
,
∗ , ,
2.5 OptimisationofPropertyDecomposition
In the process of property decomposition we have adopted the following principles which assure
generation of technologically logical and operationally viable IS network options:
i) Only numerical properties are used for decomposition. In this paper we propose decomposition of
resource quantity (the ontology property hasQuantity) and resource availability (the ontology properties
isValidFrom and isValidTo). The property decomposition only involves matches which have semantic
similarity
ii) Each po
smaller t
depends
where t
transitio
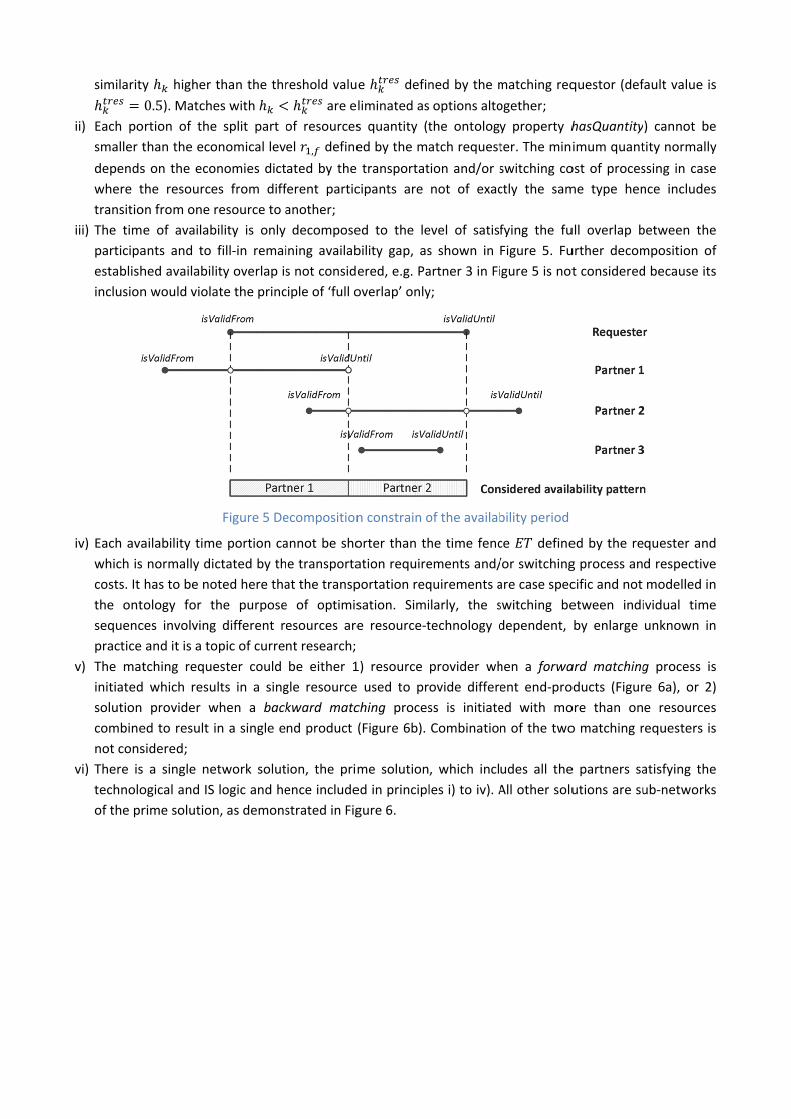
iii) The tim
participa
establish
inclusion
iv) Each ava
which is
costs. It
the ont
sequenc
practice
v) The mat
initiated
solution
combine
not cons
vi) There is
technolo
of the pr
y higher
0.5). Matche
ortion of the
than the eco
s on the eco
the resource
on from one r
e of availab
ants and to
hed availabil
n would viola
ailability tim
normally di
has to be no
ology for t
ces involving
and it is a to
tching reque
which resu
provider w
ed to result i
sidered;
a single ne
ogical and IS
rime solution
than the thr
es with
e split part o
onomical lev
onomies dict
es from diff
resource to a
bility is only
fill‐in remai
ity overlap is
ate the princ
Figure 5 De
e portion ca
ctated by th
oted here tha
the purpose
g different r
opic of curre
ester could
ults in a sing
when a back
in a single e
etwork solut
logic and he
n, as demons
reshold valu
are e
of resources
el , define
ated by the
ferent partic
another;
decompose
ining availab
s not conside
ciple of ‘full o
ecomposition
annot be sho
e transporta
at the transp
e of optimis
esources are
nt research;
be either 1
gle resource
kward matc
nd product
ion, the prim
ence include
strated in Fig
e defin
liminated as
s quantity (t
ed by the ma
transportat
cipants are
ed to the le
bility gap, as
ered, e.g. Pa
overlap’ only
n constrain o
orter than th
ation require
portation req
sation. Simi
e resource‐t
1) resource
used to pr
ching proces
(Figure 6b).
me solution
ed in principl
gure 6.
ned by the m
options alto
the ontology
atch request
tion and/or s
not of exac
evel of satisf
s shown in
artner 3 in Fi
y;
of the availab
he time fenc
ements and/
quirements a
ilarly, the s
technology d
provider wh
ovide differe
ss is initiate
Combination
, which incl
les i) to iv). A
matching req
ogether;
y property h
ter. The min
switching co
ctly the sam
fying the fu
Figure 5. Fu
gure 5 is not
bility period
ce define
/or switching
are case spec
switching be
dependent,
hen a forwa
ent end‐pro
ed with mo
n of the two
udes all the
All other solu
questor (def
hasQuantity
imum quant
ost of proces
me type hen
ull overlap b
urther decom
t considered
ed by the re
g process an
cific and not
etween indi
by enlarge
ard matching
oducts (Figur
ore than on
o matching r
e partners sa
utions are su
fault value is
y) cannot be
tity normally
ssing in case
nce includes
between the
mposition of
d because its
quester and
d respective
modelled in
ividual time
unknown in
g process is
re 6a), or 2)
e resources
requesters is
atisfying the
ub‐networks
s
e
y
e
s
e
f
s
d
e
n
e
n
s
)
s
s
e
s
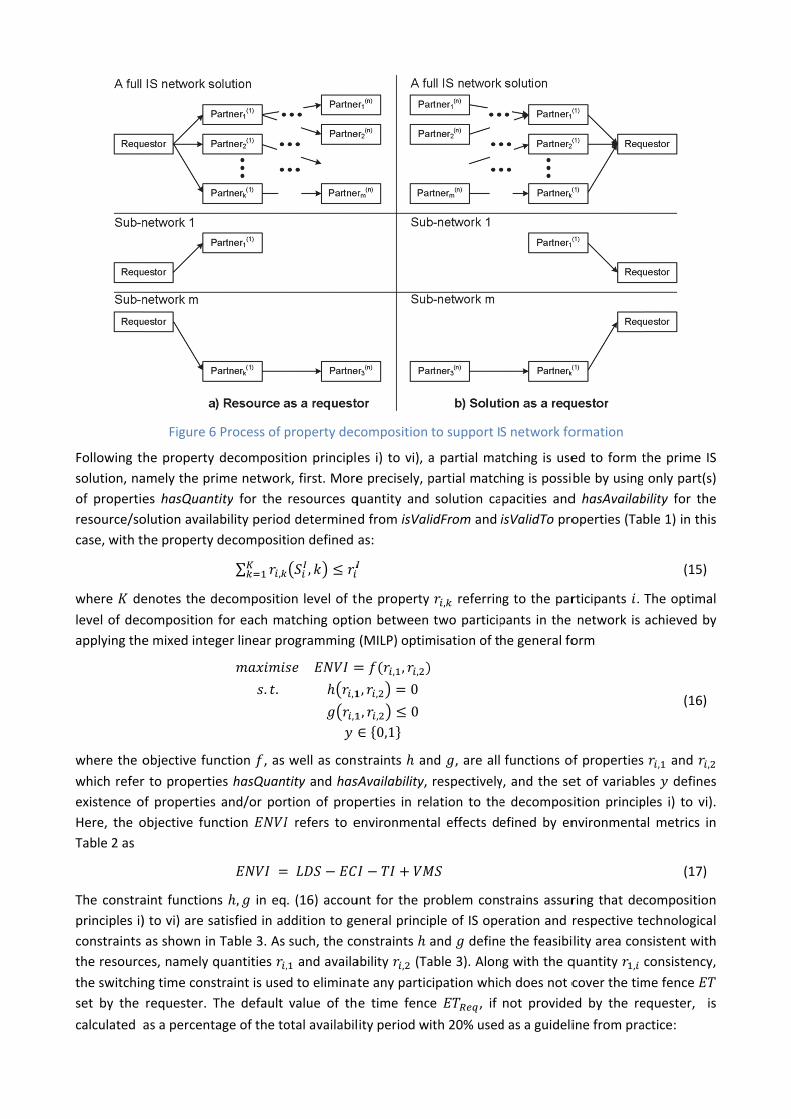
Following t
solution, na
of propertie
resource/so
case, with t
where de
level of dec
applying the
where the o
which refer
existence o
Here, the o
Table 2 as
The constra
principles i)
constraints
the resourc
the switchin
set by the
calculated
Figure 6
he property
amely the pr
es hasQuan
olution availa
he property
enotes the d
composition
e mixed inte
objective fun
r to properti
of properties
objective fun
aint function
) to vi) are sa
as shown in
ces, namely q
ng time cons
requester. T
as a percent
6 Process of p
decomposit
rime network
tity for the
ability period
decomposit
∑ ,
decompositio
for each ma
ger linear pr
. .
nction , as
es hasQuan
s and/or por
nction
ns , in eq
atisfied in ad
n Table 3. As
quantities ,
straint is use
The default
tage of the to
property dec
tion principle
k, first. More
resources q
d determined
ion defined
,
on level of t
atching optio
rogramming
,
,
well as cons
tity and hasA
rtion of prop
refers to e
. (16) accou
ddition to ge
such, the co
, and availa
d to eliminat
value of th
otal availabil
composition
es i) to vi), a
e precisely, p
quantity and
d from isVal
as:
he property
on between
(MILP) optim
, , ,
, , 0
, , 0∈ 0,1
straints an
sAvailability,
perties in re
environment
unt for the p
eneral princi
onstraints
ability , (Ta
te any partic
e time fenc
ity period w
to support I
a partial ma
partial match
solution ca
lidFrom and
, referrin
two particip
misation of t
nd , are all
respectively
lation to the
tal effects de
problem cons
ple of IS ope
and define
able 3). Alon
cipation whic
ce , if
ith 20% used
S network fo
tching is use
hing is possi
pacities and
isValidTo pro
ng to the par
pants in the
he general fo
functions o
y, and the se
e decompos
efined by en
strains assur
eration and r
e the feasibi
ng with the q
ch does not c
not provide
d as a guideli
ormation
ed to form t
ble by using
d hasAvailab
operties (Ta
rticipants .
network is
orm
of properties
et of variable
sition princip
nvironmenta
ring that de
respective te
ility area con
quantity ,
cover the tim
ed by the re
ine from pra
the prime IS
only part(s)
bility for the
ble 1) in this
(15)
The optimal
achieved by
(16)
, and ,
es defines
ples i) to vi).
al metrics in
(17)
composition
echnological
nsistent with
consistency,
me fence
equester, is
actice:
S
)
e
s
l
y
s
.
n
n
l
h
,
s
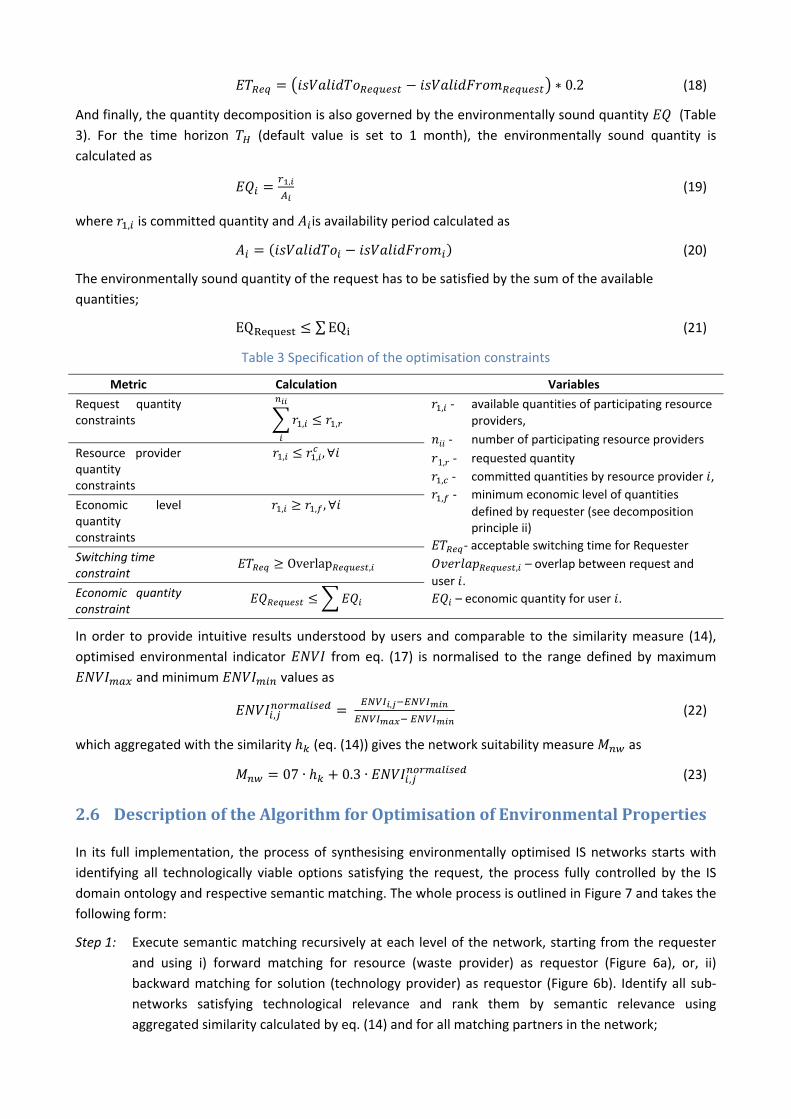
∗ 0.2 (18)
And finally, the quantity decomposition is also governed by the environmentally sound quantity (Table
3). For the time horizon (default value is set to 1 month), the environmentally sound quantity is
calculated as
, (19)
where , is committed quantity and is availability period calculated as
(20)
The environmentally sound quantity of the request has to be satisfied by the sum of the available
quantities;
EQ ∑EQ (21)
Table 3 Specification of the optimisation constraints
Metric Calculation Variables
Request quantity constraints , ,
, ‐ available quantities of participating resource providers,
‐ number of participating resource providers
1, ‐ requested quantity
, ‐ committed quantities by resource provider ,
, ‐ minimum economic level of quantities
defined by requester (see decomposition principle ii)
‐ acceptable switching time for Requester
, – overlap between request and
user .
– economic quantity for user .
Resource provider quantity constraints
, , , ∀
Economic level quantity constraints
, , , ∀
Switching time constraint
Overlap ,
Economic quantity constraint
In order to provide intuitive results understood by users and comparable to the similarity measure (14),
optimised environmental indicator from eq. (17) is normalised to the range defined by maximum
and minimum values as
, ,
(22)
which aggregated with the similarity (eq. (14)) gives the network suitability measure as
07 ∙ 0.3 ∙ , (23)
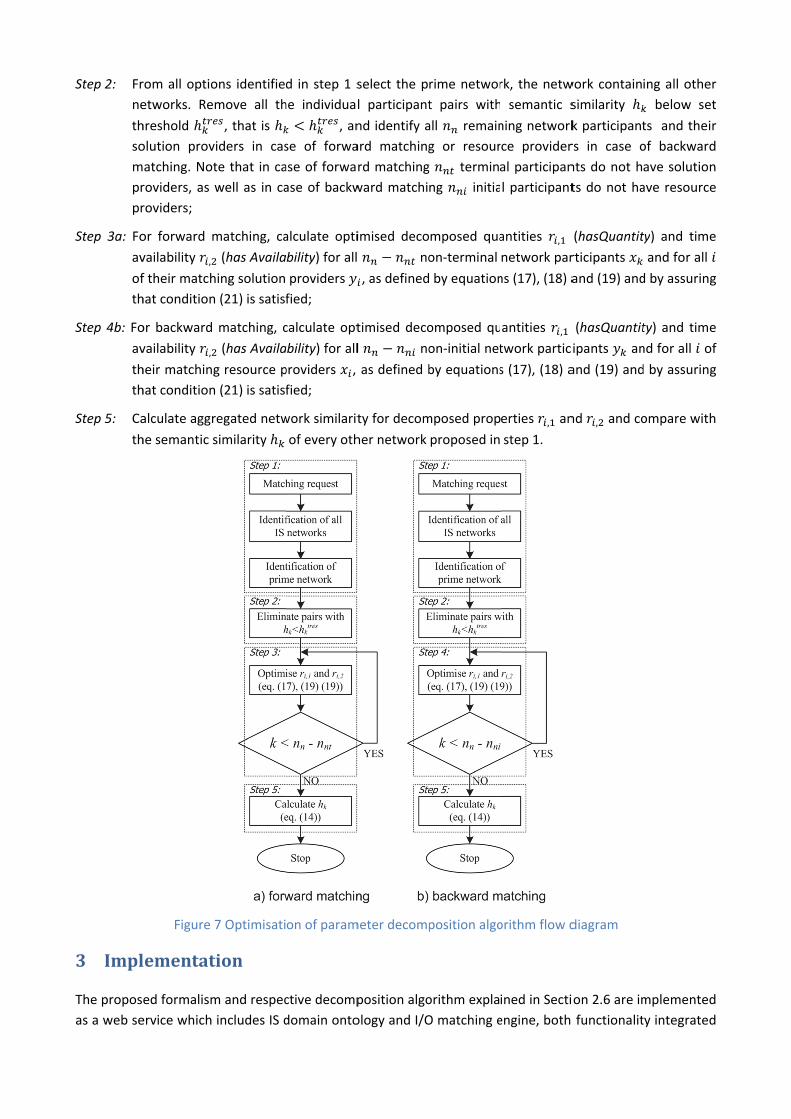
2.6 DescriptionoftheAlgorithmforOptimisationofEnvironmentalProperties
In its full implementation, the process of synthesising environmentally optimised IS networks starts with
identifying all technologically viable options satisfying the request, the process fully controlled by the IS
domain ontology and respective semantic matching. The whole process is outlined in Figure 7 and takes the
following form:
Step 1: Execute semantic matching recursively at each level of the network, starting from the requester
and using i) forward matching for resource (waste provider) as requestor (Figure 6a), or, ii)
backward matching for solution (technology provider) as requestor (Figure 6b). Identify all sub‐
networks satisfying technological relevance and rank them by semantic relevance using
aggregated similarity calculated by eq. (14) and for all matching partners in the network;
Step 2: Fr
ne
th
so
m
pr
pr
Step 3a: Fo
av
of
th
Step 4b: Fo
av
th
th
Step 5: Ca
th
3 Impl
The propos
as a web se
rom all optio
etworks. Re
hreshold
olution prov
atching. Not
roviders, as
roviders;
or forward m
vailability ,
f their match
hat condition
or backward
vailability ,
heir matching
hat condition
alculate aggr
he semantic s
Figure
lementat
ed formalism
ervice which
ons identifie
move all th
, that is
viders in cas
te that in ca
well as in ca
matching, ca
(has Availa
hing solution
n (21) is satisf
matching, c
(has Availa
g resource p
n (21) is satisf
regated netw
similarity
7 Optimisati
tion
m and respec
includes IS d
d in step 1 s
he individual
, an
se of forwa
ase of forwa
ase of backw
alculate opti
bility) for all
providers
fied;
calculate opt
ability) for all
providers ,
fied;
work similarit
of every oth
on of param
ctive decomp
domain onto
select the p
l participant
nd identify a
ard matching
rd matching
ward matchi
imised deco
no
, as defined
timised deco
l no
as defined b
ty for decom
her network
meter decomp
position algo
ology and I/O
rime networ
t pairs with
all remain
g or resour
g termin
ng initia
mposed qua
on‐terminal
by equation
omposed qu
on‐initial net
by equations
mposed prop
proposed in
position algo
orithm expla
O matching e
rk, the netw
semantic s
ning network
rce provider
al participan
l participant
antities ,
network par
ns (17), (18) a
antities ,
twork partic
s (17), (18) a
erties , an
step 1.
orithm flow d
ined in Secti
engine, both
work contain
similarity
k participant
rs in case o
nts do not h
ts do not ha
(hasQuantit
rticipants
and (19) and
(hasQuantit
ipants an
and (19) and
nd , and co
diagram
ion 2.6 are im
functionalit
ing all other
below set
ts and their
of backward
ave solution
ave resource
ty) and time
and for all
d by assuring
ty) and time
nd for all of
d by assuring
ompare with
mplemented
ty integrated
r
t
r
d
n
e
e
g
e
f
g
h
d
d
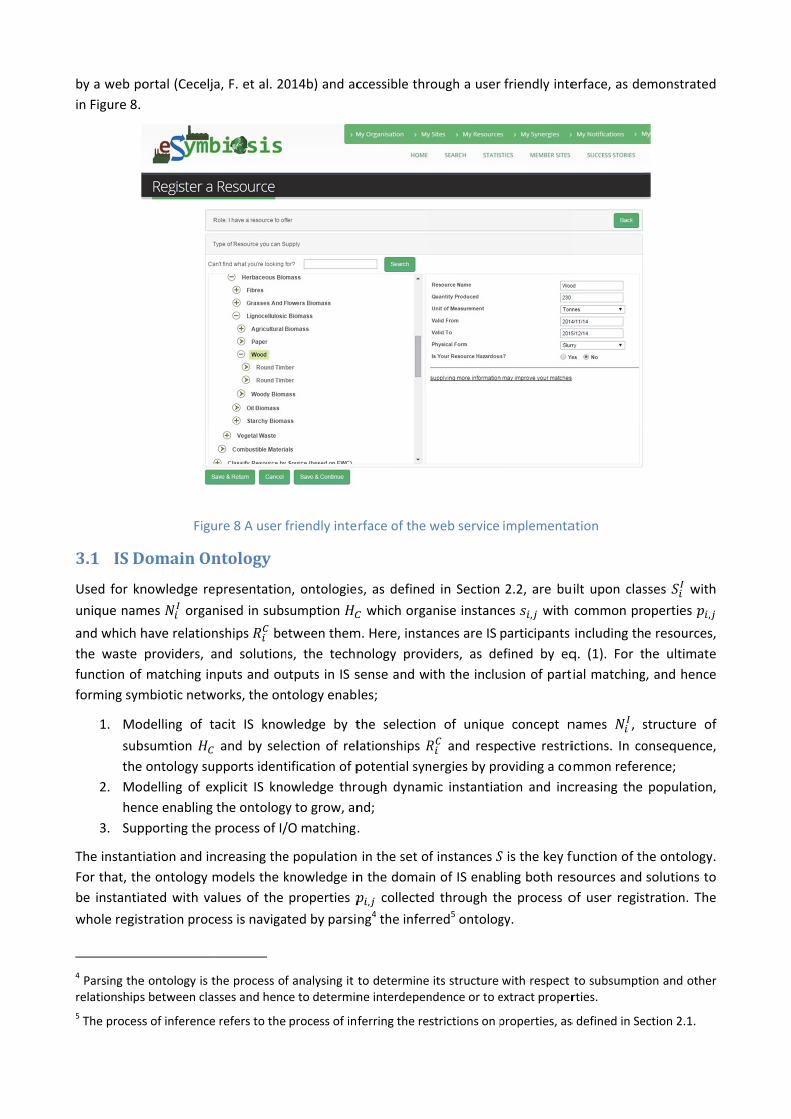
by a web po
in Figure 8.
3.1 ISD
Used for kn
unique nam
and which h
the waste
function of
forming sym
1. Mo
sub
the
2. Mo
hen
3. Sup
The instant
For that, th
be instantia
whole regis
4 Parsing therelationships
5 The process
ortal (Cecelja
Figu
DomainOn
nowledge re
mes organ
have relation
providers, a
matching in
mbiotic netw
delling of t
bsumtion
ontology su
delling of ex
nce enabling
pporting the
iation and in
e ontology m
ated with va
tration proc
e ontology is ts between cla
s of inference
a, F. et al. 20
ure 8 A user f
ntology
epresentation
nised in subs
nships be
and solution
nputs and ou
works, the on
acit IS know
and by sele
pports ident
xplicit IS kno
the ontology
process of I/
ncreasing the
models the k
alues of the
ess is naviga
the process ofsses and henc
e refers to the
014b) and ac
friendly inte
n, ontologie
sumption
etween them
ns, the techn
utputs in IS s
tology enab
wledge by t
ection of rel
tification of p
owledge thr
y to grow, an
/O matching.
e population
knowledge in
properties
ted by parsi
f analysing it tce to determin
process of inf
ccessible thr
rface of the
s, as defined
which orga
m. Here, insta
nology prov
sense and w
les;
the selectio
lationships
potential syn
ough dynam
nd;
.
in the set o
n the domai
, collected
ng4 the infer
to determinene interdepen
ferring the re
rough a user
web service
d in Section
anise instanc
ances are IS
viders, as de
with the inclu
n of unique
and resp
nergies by pr
mic instantiat
f instances
n of IS enab
d through th
rred5 ontolog
its structure ndence or to e
strictions on p
friendly inte
implementa
2.2, are bu
ces , with
participants
efined by eq
usion of part
e concept n
ective restri
roviding a co
tion and inc
is the key f
ling both res
he process o
gy.
with respect extract proper
properties, as
erface, as de
ation
ilt upon clas
common pr
including th
q. (1). For t
tial matching
names , s
ictions. In co
ommon refer
creasing the
function of th
sources and
of user regis
to subsumptirties.
s defined in Se
emonstrated
sses with
operties ,
e resources,
the ultimate
g, and hence
structure of
onsequence,
ence;
population,
he ontology.
solutions to
stration. The
ion and other
ection 2.1.
d
h
,
e
e
f
,
,
.
o
e
r

Common re
The commo
include res
solutions, i.
of the IS ter
process of I
by Europea
can enhanc
classificatio
The develop
meta‐level
have no dep
as the top‐l
iv) instantia
Figure 9.
The domain
classes w
four levels
hierarchical
approximat
Along with
given in Ta
registration
indentation
introduced
eferencing is
on vocabula
sources, i.e.
.e. regions, u
rminology es
I/O matching
n Commissio
ce the proc
ons including
ped ontolog
which defin
pendence on
evel relation
ation level w
n level of ont
which form m
detailed in
l class – s
tely 2000 cla
the properti
able 4. They
n), to model
n in the colum
to further g
s established
ry, represen
materials,
units of mea
stablishes a s
g. In the curr
on in the for
cess such a
EWC STAT (
gy has four le
es general p
n the specific
nships betwe
which is app
tology furthe
modules def
Appendix A
subclass (
sses (Cecelja
ies used
y are introd
l knowledge
mn Relation
granulate th
d by formalis
nting the se
products, t
asurement an
standardized
rent implem
rm of the Eu
as material
EC 2010).
evels of abst
purpose con
c domain, ii)
een these co
plication spe
Figure
er details co
fined at the t
. The indent
) parti
a, F et al. 201
to character
duced to fac
e and to en
R in Table 4
he knowledg
sing tacit kno
mantic by s
technologies
nd measure
d vocabulary
entation (Ra
uropean Wa
type, proc
traction (Tro
ncepts of the
) top level pr
oncepts, iii) d
ecific level w
e 9 Ontology
oncepts at th
top level are
tation in the
icipation. T
14a).
rise classes (
cilitate and
nable calcula
4 indicates p
ge represent
owledge of I
election of
, and perip
qualification
for IS and el
aafat et al. 20
ste Catalogu
essing tech
okanas et al.
e ontology t
roviding abst
domain level
with the use
design
he top level s
e organised i
e leftmost c
The complet
Table 1), the
to enhance
ation of sem
property ‐ su
tation. Table
S in the form
concept nam
heral inform
ns, among o
iminates syn
013), we use
ue (EWC) (EC
nologies an
2014) cove
that can be
tract concep
which detai
r profile ins
split into the
n the subsum
olumn of th
te ontology
e set of impl
e instantiatio
mantic simila
bproperty su
e 4 also illu
m of ontolog
mes , is i
mation need
others. The id
ntactic differ
e vocabulary
C 2002), and
nd other wa
ring the dom
applied uni
pts of the dom
ils the doma
stances, as i
e ontology m
mption w
he Appendix
y at prese
lemented re
on process
arity (eq
ubsumption
ustrates dom
gy structure.
dentified to
ded for the
dentification
rences in the
y established
others that
aste stream
main of IS: i)
versally and
main as well
ain of IS, and
llustrated in
modules. The
with the first
A indicates
nt contains
lations is
(participant
q. (14)). The
relationship
main and
.
o
e
n
e
d
t
m
)
d
l
d
n
e
t
s
s
s
t
e
p
d
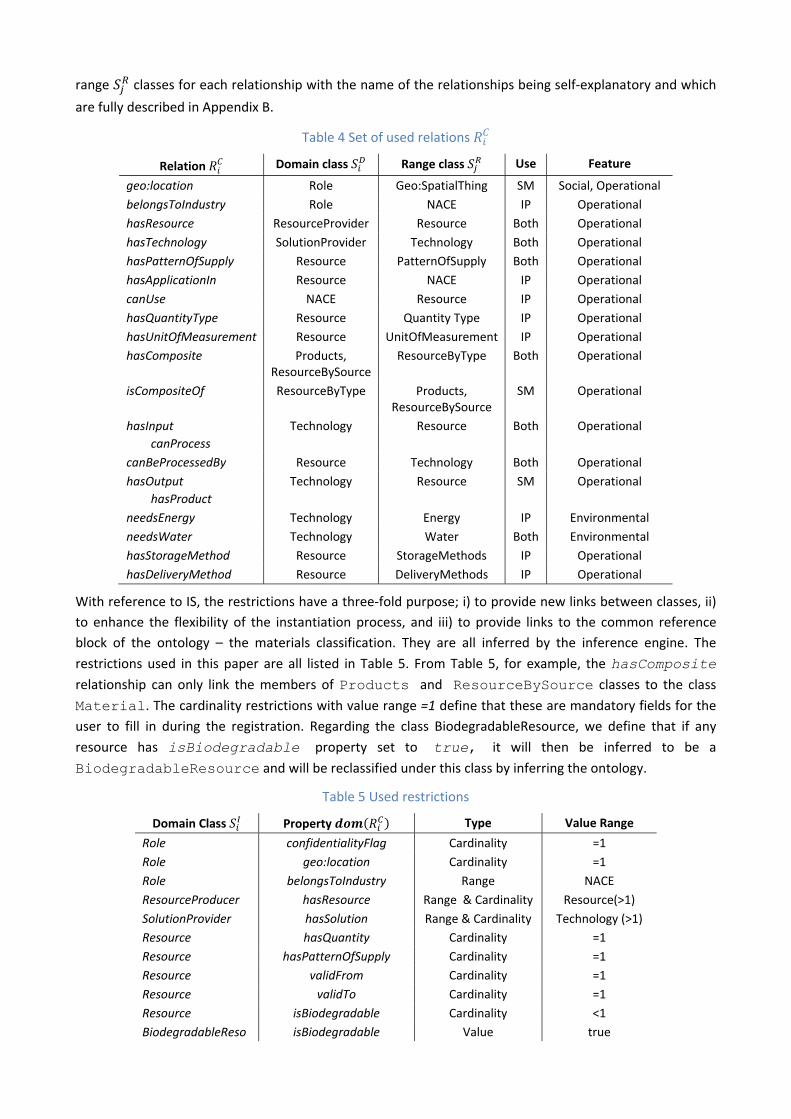
range classes for each relationship with the name of the relationships being self‐explanatory and which
are fully described in Appendix B.
Table 4 Set of used relations
Relation Domain class Range class Use Feature
geo:location Role Geo:SpatialThing SM Social, Operational
belongsToIndustry Role NACE IP Operational
hasResource ResourceProvider Resource Both Operational
hasTechnology SolutionProvider Technology Both Operational
hasPatternOfSupply Resource PatternOfSupply Both Operational
hasApplicationIn Resource NACE IP Operational
canUse NACE Resource IP Operational
hasQuantityType Resource Quantity Type IP Operational
hasUnitOfMeasurement Resource UnitOfMeasurement IP Operational
hasComposite Products, ResourceBySource
ResourceByType Both Operational
isCompositeOf ResourceByType Products, ResourceBySource
SM Operational
hasInput
canProcess
Technology Resource Both Operational
canBeProcessedBy Resource Technology Both Operational
hasOutput
hasProduct
Technology Resource SM Operational
needsEnergy Technology Energy IP Environmental
needsWater Technology Water Both Environmental
hasStorageMethod Resource StorageMethods IP Operational
hasDeliveryMethod Resource DeliveryMethods IP Operational
With reference to IS, the restrictions have a three‐fold purpose; i) to provide new links between classes, ii)
to enhance the flexibility of the instantiation process, and iii) to provide links to the common reference
block of the ontology – the materials classification. They are all inferred by the inference engine. The
restrictions used in this paper are all listed in Table 5. From Table 5, for example, the hasComposite
relationship can only link the members of Products and ResourceBySource classes to the class
Material. The cardinality restrictions with value range =1 define that these are mandatory fields for the
user to fill in during the registration. Regarding the class BiodegradableResource, we define that if any
resource has isBiodegradable property set to true, it will then be inferred to be a
BiodegradableResource and will be reclassified under this class by inferring the ontology.
Table 5 Used restrictions
Domain Class Property Type Value Range
Role confidentialityFlag Cardinality =1
Role geo:location Cardinality =1
Role belongsToIndustry Range NACE
ResourceProducer hasResource Range & Cardinality Resource(>1)
SolutionProvider hasSolution Range & Cardinality Technology (>1)
Resource hasQuantity Cardinality =1
Resource hasPatternOfSupply Cardinality =1
Resource validFrom Cardinality =1
Resource validTo Cardinality =1
Resource isBiodegradable Cardinality <1
BiodegradableReso isBiodegradable Value true
u
PR
M
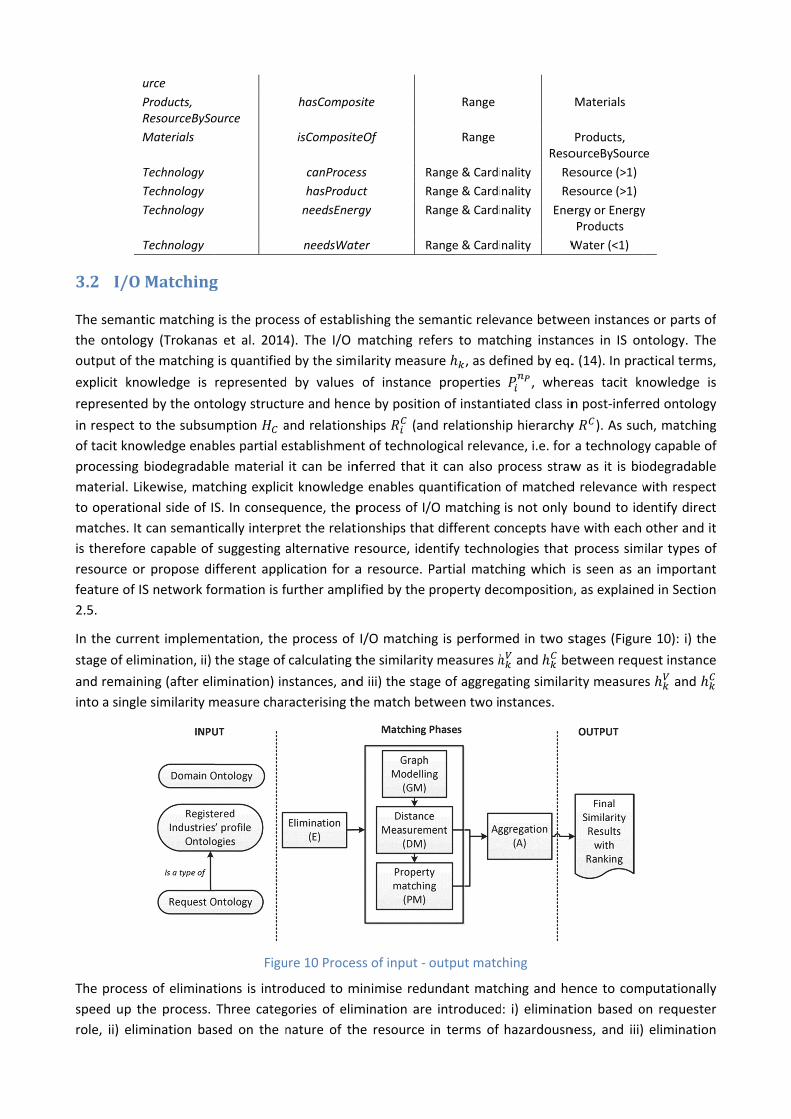
3.2 I/O
The semant
the ontolog
output of th
explicit kno
represented
in respect t
of tacit kno
processing
material. Li
to operatio
matches. It
is therefore
resource or
feature of IS
2.5.
In the curre
stage of elim
and remain
into a single
The process
speed up th
role, ii) elim
urce
Products, ResourceBySo
Materials
Technology
Technology
Technology
Technology
Matching
tic matching
gy (Trokanas
he matching
owledge is
d by the ont
to the subsu
wledge enab
biodegradab
kewise, mat
nal side of I
can semant
e capable of
r propose di
S network fo
ent impleme
mination, ii)
ing (after eli
e similarity m
s of eliminat
he process.
mination bas
ource
g
is the proce
s et al. 2014
is quantified
represented
ology structu
mption a
bles partial e
ble material
tching explic
S. In conseq
ically interpr
suggesting a
fferent appl
ormation is f
entation, the
the stage of
imination) in
measure char
Figu
tions is intro
Three categ
sed on the n
hasCompos
isComposite
canProces
hasProduc
needsEner
needsWat
ess of establi
4). The I/O
d by the sim
d by values
ure and henc
and relations
establishmen
it can be in
it knowledge
uence, the p
ret the relati
alternative r
ication for a
further ampl
e process of
calculating t
nstances, and
racterising th
ure 10 Proces
oduced to m
gories of elim
nature of th
site
eOf
ss R
ct R
rgy R
ter R
ishing the se
matching re
ilarity measu
of instance
ce by positio
ships (an
nt of technol
nferred that
e enables qu
process of I/
ionships tha
resource, ide
a resource.
ified by the
I/O matchin
the similarity
d iii) the stag
he match be
ss of input ‐
minimise redu
mination are
he resource
Range
Range
Range & Cardi
Range & Cardi
Range & Cardi
Range & Cardi
emantic relev
efers to mat
ure , as de
e properties
on of instant
nd relationsh
ogical releva
it can also p
uantification
/O matching
t different c
entify techno
Partial matc
property dec
ng is perform
y measures
ge of aggreg
tween two i
output matc
undant matc
e introduced
in terms of
Reso
nality Re
nality Re
nality Ene
nality W
vance betwe
ching instan
efined by eq.
, wher
iated class in
hip hierarchy
ance, i.e. for
process straw
of matched
is not only
oncepts hav
ologies that
hing which
composition
med in two s
and be
ating similar
nstances.
ching
ching and he
d: i) eliminat
hazardousn
Materials
Products, ourceBySourc
esource (>1)
esource (>1)
ergy or EnergyProducts
Water (<1)
een instance
nces in IS on
. (14). In pra
reas tacit kn
n post‐inferr
y ). As suc
a technolog
w as it is bio
d relevance w
bound to id
ve with each
process sim
is seen as a
n, as explaine
stages (Figur
etween requ
rity measure
ence to com
tion based o
ness, and iii)
e
y
s or parts of
ntology. The
ctical terms,
nowledge is
red ontology
ch, matching
gy capable of
odegradable
with respect
entify direct
other and it
ilar types of
n important
ed in Section
re 10): i) the
uest instance
es and
mputationally
on requester
elimination
f
e
,
s
y
g
f
e
t
t
t
f
t
n
e
e
y
r
n
based on availability of resources. Requester role is defined by belonging to either the group of resource
providers or to the group of solution providers . All instances belonging to the requester’s group and
classes not disjoint by the requester are eliminated from matching. In the current ontology design disjoint
classes indicate that their instances do not have technological relevance with each other. Considering the
fact that different user roles are also defined by disjoint classes in the ontology, every industry which is
capable of both providing and processing a resource will have to define two separate profiles under each
role. Additionally, if the requester provides or askes for a hazardous material, all instances which are not
categorised as hazardous are eliminated. Availability, which is characterised by properties isValidFrom
and isValidTo, is also used in the elimination process as participants the availability of which do not
overlap are eliminated. More precisely, availability is measured by the time overlap between the requester
and matched instances, as demonstrated in Figure 5. For the availability period of the requester defined
by the property , , , , , , ∈ and the availability period of matched instances
defined by properties , , , , , , ∈ , the overlap period is calculated as
, ∩ , , , , , , , (24)
The elimination is then based on the rule
0 eliminatethematch0 match (25)
To account for both tacit and explicit knowledge in the process of matching, the tacit part of semantic
similarity is quantified by the distance measurement between respective concepts along subsumption and
relevant relationships (equation (13)), whereas explicit part of semantic similarity is quantified through the
vector similarity calculation (equation (11)) of respective properties. Graph representation of the ontology
is a prerequisite for both of them.
Various methods exist for determining graph model of the ontology such as those based on bipartite graphs
accounting for the subsumption (Melnik et al. 2002) or combination of subsumption (Hu et al. 2005)
and relationships hierarchy (Tous and Delgado 2006). We propose ontology graph models which are
extension of bipartite graphs accounting for both relationships hierarchy and respective restrictions .
With this approach the ontology graphs are represented as a 3‐tuple ⟨ , , ⟩:
thesetofvertices , , thesetofedges
| ∈ theweightassignedtoeachedge (26)
We use only the relationships with a strong relevance to the domain of IS needed to infer tacit knowledge
from the ontology:
, , ,
, , | ⊆ (27)
as, along with is‐a subsumption relationship, presented in Table 6. The equation (27) is modelled as an edge
between domain class and . For example, considering restrictions and presenting
someValuesFrom on relationship between two concepts EWC120103 (waste produced by non‐ferrous metal turning and filing process) and Aluminium, this restriction
establishes semantic relevance and hence is modelled as edge between the two concepts, as shown in
Figure 11.
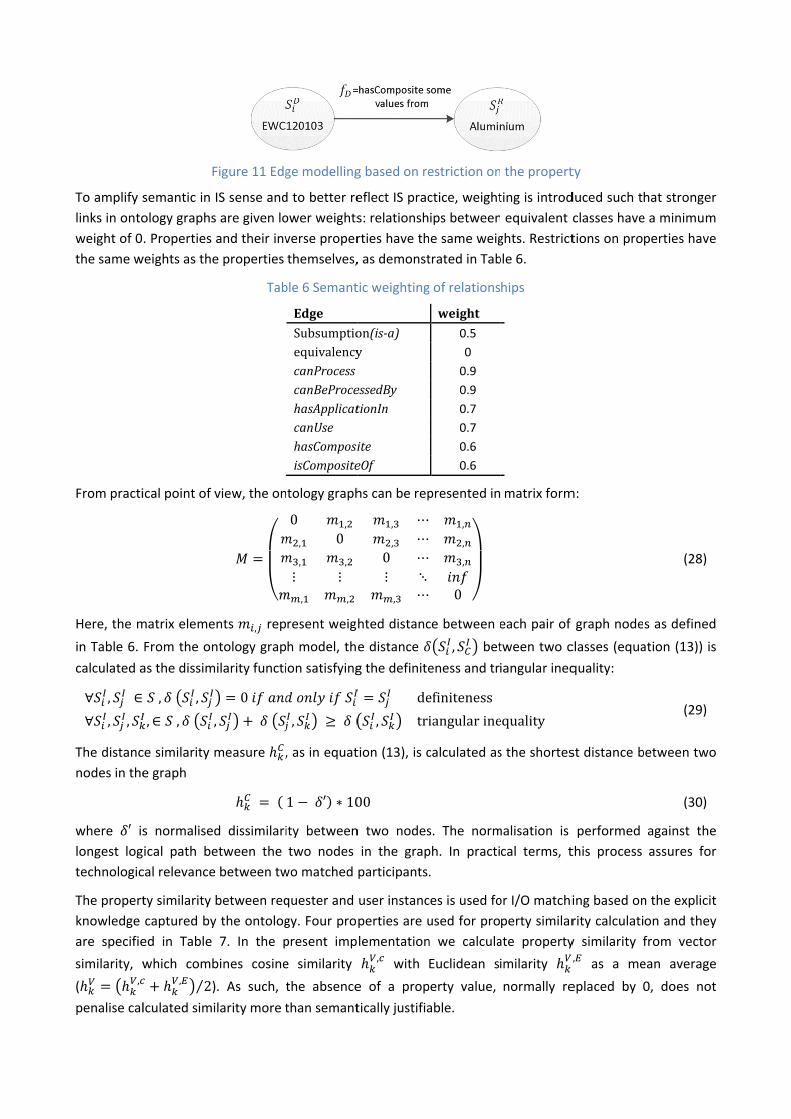
To amplify s
links in onto
weight of 0
the same w
From practi
Here, the m
in Table 6.
calculated a
∀ , ∈
∀ , ,
The distanc
nodes in the
where ′ islongest log
technologic
The propert
knowledge
are specifie
similarity, w
( ,
penalise cal
F
semantic in
ology graphs
. Properties
weights as the
ical point of v
matrix eleme
From the on
as the dissim
, ,
, ∈ , ,
ce similarity
e graph
s normalised
ical path be
cal relevance
ty similarity
captured by
ed in Table
which comb, 2⁄ )
lculated simi
Figure 11 Edg
IS sense and
s are given lo
and their inv
e properties
Tab
view, the on
ents , rep
ntology grap
milarity functi
0
,
measure ,
d dissimilari
etween the
e between tw
between req
y the ontolog
7. In the p
bines cosine
). As such,
ilarity more t
ge modelling
d to better re
ower weights
verse proper
themselves,
ble 6 Semant
Edge
SubsumptioequivalencycanProcesscanBeProcehasApplicatcanUsehasComposiisComposite
ntology graph
0 ,
, 0
, ,
⋮ ⋮, ,
resent weig
h model, th
ion satisfying
,
, as in equat
1 ′ ∗ 10
ity between
two nodes
wo matched
quester and
gy. Four pro
present imp
e similarity
the absence
than semant
g based on re
eflect IS prac
s: relationsh
rties have th
, as demonst
tic weighting
on(is‐a)y
essedBytionIn
iteeOf
hs can be rep
, ⋯
, ⋯0 ⋯⋮ ⋱, ⋯
hted distanc
e distance
g the definite
de
, tri
tion (13), is c
00
n two nodes
in the grap
participants
user instanc
perties are u
lementation, with
e of a prop
tically justifia
estriction on
ctice, weight
ips between
he same weig
trated in Tab
g of relations
weight
0.5
0
0.9
0.9
0.7
0.7
0.6
0.6
presented in
,
,
,
0
ce between e
, bet
eness and tr
efiniteness
iangularine
calculated as
s. The norm
ph. In practi
.
ces is used fo
used for pro
n we calcula
Euclidean s
perty value,
able.
the propert
ting is introd
equivalent
ghts. Restrict
ble 6.
hips
matrix form
each pair of
tween two c
iangular ineq
equality
s the shortes
malisation is
cal terms, t
or I/O matchi
perty similar
ate property
imilarity ,
normally re
ty
duced such t
classes have
tions on pro
m:
graph node
classes (equa
quality:
st distance b
performed
this process
ing based on
rity calculati
y similarity f, as a me
eplaced by
hat stronger
e a minimum
perties have
(28)
s as defined
ation (13)) is
(29)
between two
(30)
against the
assures for
n the explicit
on and they
from vector
ean average
0, does not
r
m
e
d
s
o
e
r
t
y
r
e
t
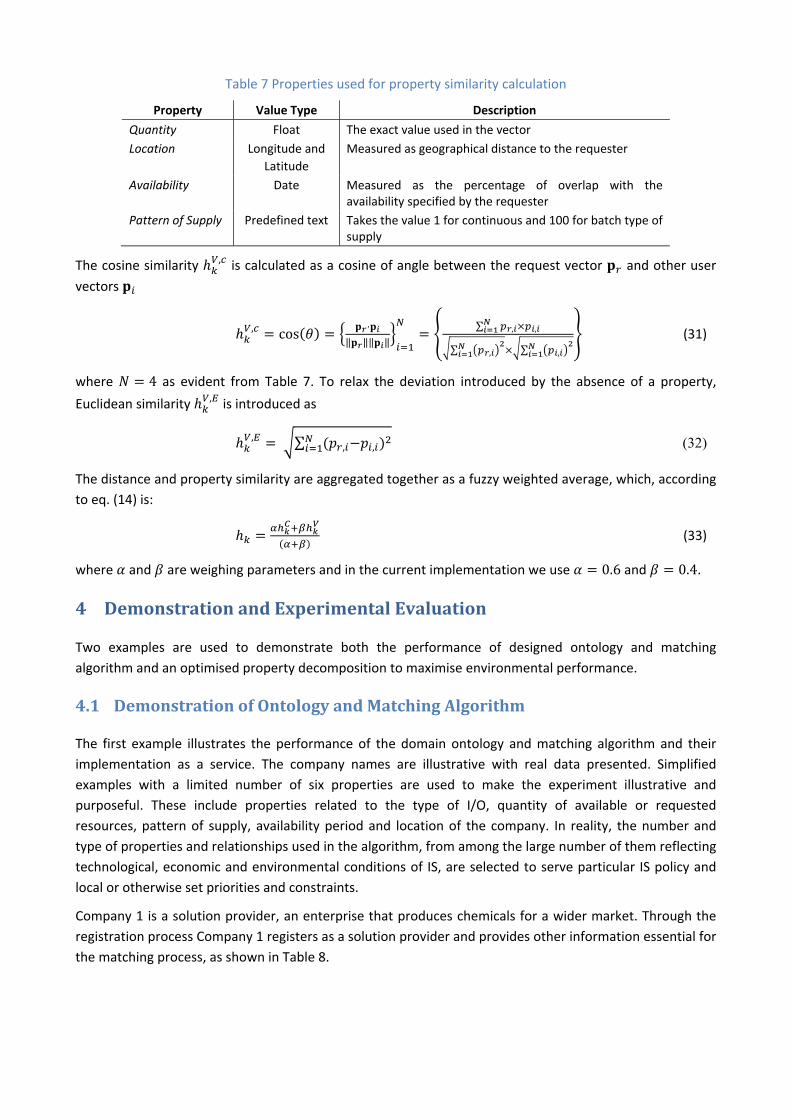
Table 7 Properties used for property similarity calculation
Property Value Type Description
Quantity Float The exact value used in the vector
Location Longitude and
Latitude
Measured as geographical distance to the requester
Availability Date Measured as the percentage of overlap with the availability specified by the requester
Pattern of Supply Predefined text Takes the value 1 for continuous and 100 for batch type of supply
The cosine similarity , is calculated as a cosine of angle between the request vector and other user
vectors
, cos⋅
‖ ‖‖ ‖
∑ , ,
∑ , ∑ ,
(31)
where 4 as evident from Table 7. To relax the deviation introduced by the absence of a property,
Euclidean similarity , is introduced as
, ∑ , , (32)
The distance and property similarity are aggregated together as a fuzzy weighted average, which, according
to eq. (14) is:
(33)
where and are weighing parameters and in the current implementation we use 0.6 and 0.4.
4 DemonstrationandExperimentalEvaluation
Two examples are used to demonstrate both the performance of designed ontology and matching
algorithm and an optimised property decomposition to maximise environmental performance.
4.1 DemonstrationofOntologyandMatchingAlgorithm
The first example illustrates the performance of the domain ontology and matching algorithm and their
implementation as a service. The company names are illustrative with real data presented. Simplified
examples with a limited number of six properties are used to make the experiment illustrative and
purposeful. These include properties related to the type of I/O, quantity of available or requested
resources, pattern of supply, availability period and location of the company. In reality, the number and
type of properties and relationships used in the algorithm, from among the large number of them reflecting
technological, economic and environmental conditions of IS, are selected to serve particular IS policy and
local or otherwise set priorities and constraints.
Company 1 is a solution provider, an enterprise that produces chemicals for a wider market. Through the
registration process Company 1 registers as a solution provider and provides other information essential for
the matching process, as shown in Table 8.
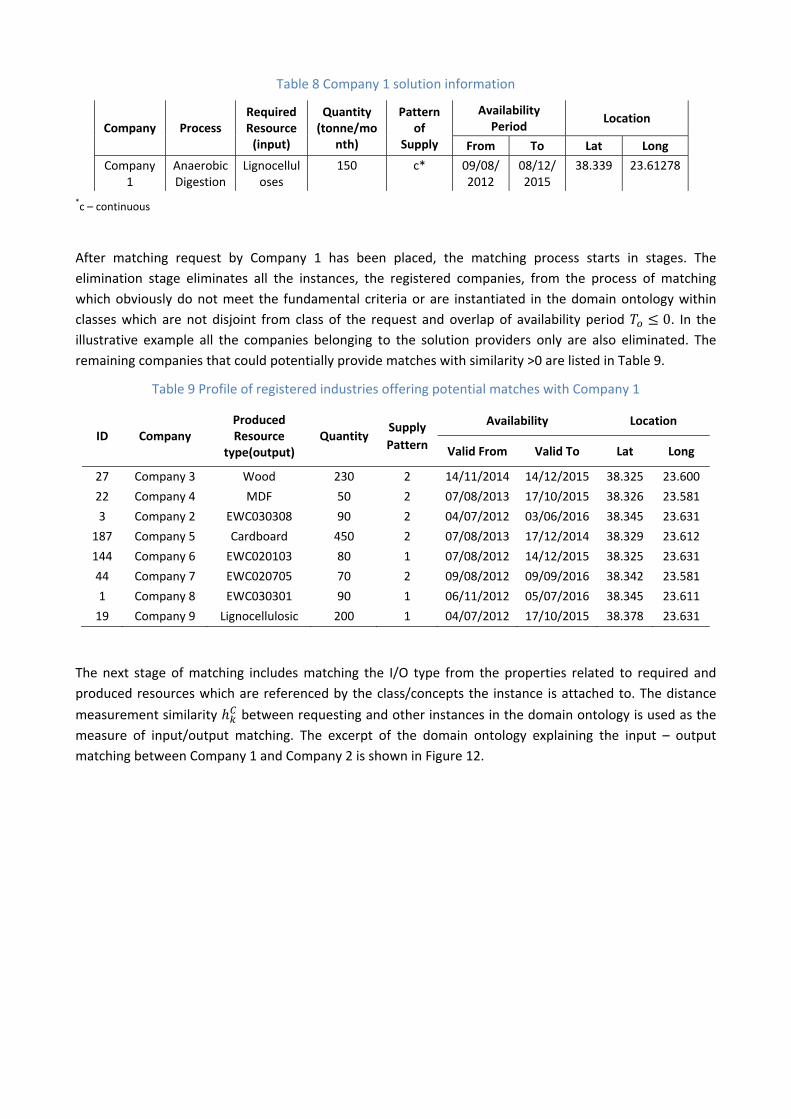
Table 8 Company 1 solution information
Company Process Required Resource (input)
Quantity (tonne/mo
nth)
Pattern of
Supply
Availability Period
Location
From To Lat Long
Company 1
Anaerobic Digestion
Lignocelluloses
150 c* 09/08/2012
08/12/2015
38.339 23.61278
*c – continuous
After matching request by Company 1 has been placed, the matching process starts in stages. The
elimination stage eliminates all the instances, the registered companies, from the process of matching
which obviously do not meet the fundamental criteria or are instantiated in the domain ontology within
classes which are not disjoint from class of the request and overlap of availability period 0. In the illustrative example all the companies belonging to the solution providers only are also eliminated. The
remaining companies that could potentially provide matches with similarity >0 are listed in Table 9.
Table 9 Profile of registered industries offering potential matches with Company 1
ID Company Produced Resource
type(output) Quantity
Supply
Pattern
Availability Location
Valid From Valid To Lat Long
27 Company 3 Wood 230 2 14/11/2014 14/12/2015 38.325 23.600
22 Company 4 MDF 50 2 07/08/2013 17/10/2015 38.326 23.581
3 Company 2 EWC030308 90 2 04/07/2012 03/06/2016 38.345 23.631
187 Company 5 Cardboard 450 2 07/08/2013 17/12/2014 38.329 23.612
144 Company 6 EWC020103 80 1 07/08/2012 14/12/2015 38.325 23.631
44 Company 7 EWC020705 70 2 09/08/2012 09/09/2016 38.342 23.581
1 Company 8 EWC030301 90 1 06/11/2012 05/07/2016 38.345 23.611
19 Company 9 Lignocellulosic 200 1 04/07/2012 17/10/2015 38.378 23.631
The next stage of matching includes matching the I/O type from the properties related to required and
produced resources which are referenced by the class/concepts the instance is attached to. The distance
measurement similarity between requesting and other instances in the domain ontology is used as the
measure of input/output matching. The excerpt of the domain ontology explaining the input – output
matching between Company 1 and Company 2 is shown in Figure 12.
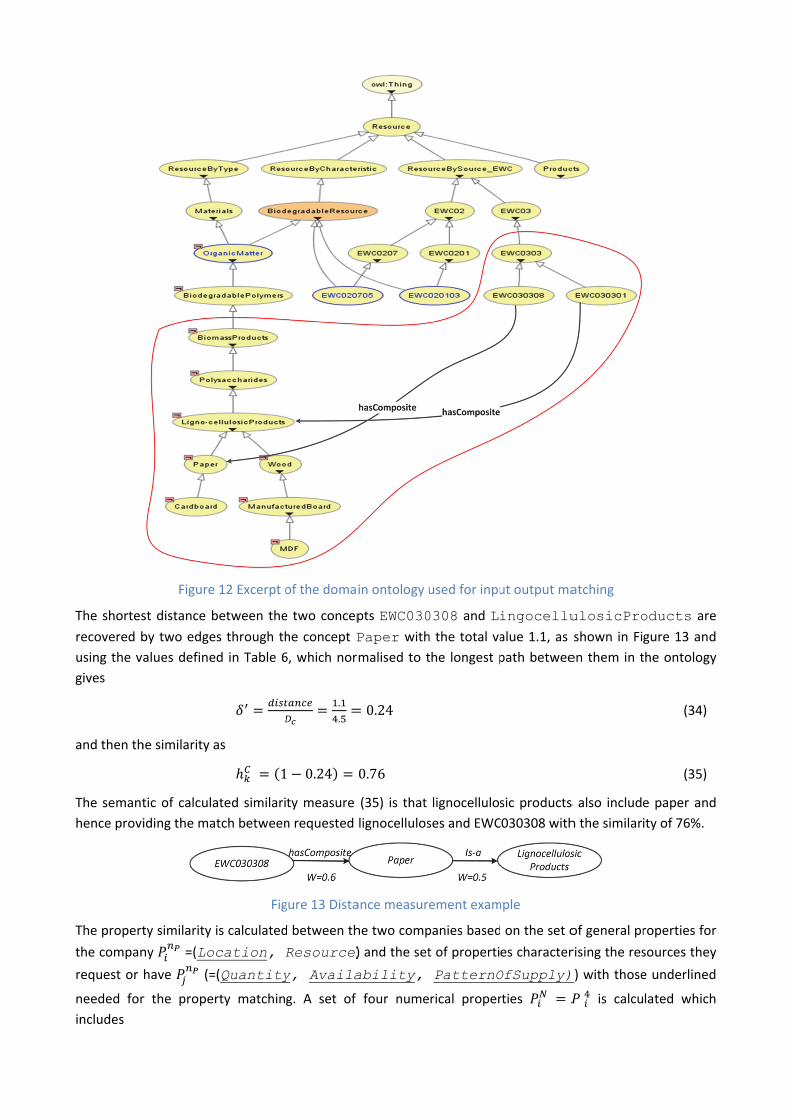
The shortes
recovered b
using the v
gives
and then th
The semant
hence provi
The propert
the compan
request or
needed for
includes
Figure
st distance b
by two edge
alues define
he similarity a
tic of calcula
iding the ma
ty similarity
ny =(Loc
have (=
r the prope
12 Excerpt o
between the
es through th
ed in Table 6
as
1
ated similari
atch between
Fig
is calculated
cation, R
=(Quantity
rty matchin
of the doma
e two concep
he concept P6, which nor
.
.
1 0.24
ty measure
n requested
gure 13 Dista
d between th
Resource)
y, Availa
g. A set of
in ontology u
pts EWC030
Paper withmalised to t
0.24
0.76
(35) is that
lignocellulos
ance measur
he two comp
) and the set
ability,
four nume
used for inpu
0308 and Li
h the total va
the longest p
lignocellulos
ses and EWC
ement exam
panies based
t of properti
PatternO
rical proper
ut output ma
ingocellu
alue 1.1, as
path betwee
sic products
C030308 with
mple
on the set o
es character
OfSupply)
rties
atching
ulosicPro
shown in Fi
en them in t
s also include
h the similari
of general pr
rising the res
) with those
is calcu
oducts are
gure 13 and
the ontology
(34)
(35)
e paper and
ity of 76%.
roperties for
sources they
e underlined
lated which
e
d
y
d
r
y
d
h
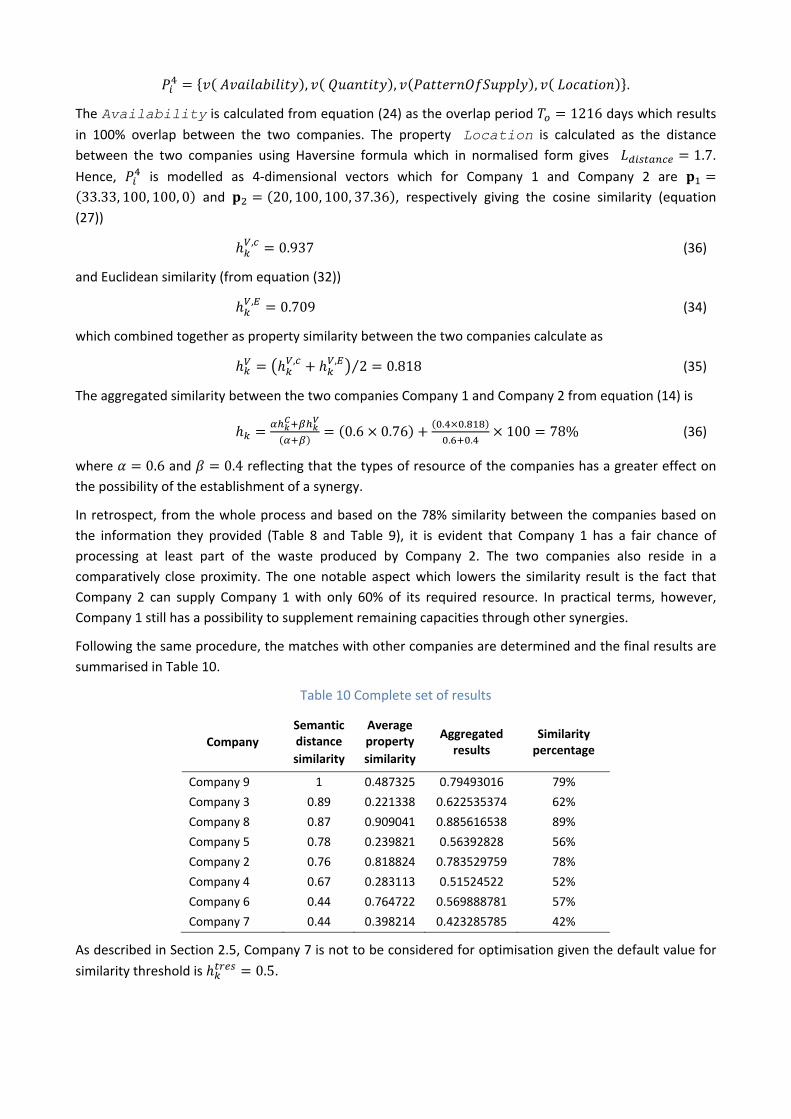
, , , .
The Availability is calculated from equation (24) as the overlap period 1216 days which results in 100% overlap between the two companies. The property Location is calculated as the distance between the two companies using Haversine formula which in normalised form gives 1.7. Hence, is modelled as 4‐dimensional vectors which for Company 1 and Company 2 are
33.33, 100, 100, 0 and 20, 100, 100, 37.36 , respectively giving the cosine similarity (equation
(27))
, 0.937 (36)
and Euclidean similarity (from equation (32))
, 0.709 (34)
which combined together as property similarity between the two companies calculate as
, , 2⁄ 0.818 (35)
The aggregated similarity between the two companies Company 1 and Company 2 from equation (14) is
0.6 0.76. .
. .100 78% (36)
where 0.6 and 0.4 reflecting that the types of resource of the companies has a greater effect on
the possibility of the establishment of a synergy.
In retrospect, from the whole process and based on the 78% similarity between the companies based on
the information they provided (Table 8 and Table 9), it is evident that Company 1 has a fair chance of
processing at least part of the waste produced by Company 2. The two companies also reside in a
comparatively close proximity. The one notable aspect which lowers the similarity result is the fact that
Company 2 can supply Company 1 with only 60% of its required resource. In practical terms, however,
Company 1 still has a possibility to supplement remaining capacities through other synergies.
Following the same procedure, the matches with other companies are determined and the final results are
summarised in Table 10.
Table 10 Complete set of results
Company
Semantic distance
similarity
Average property
similarity
Aggregated results
Similarity percentage
Company 9 1 0.487325 0.79493016 79%
Company 3 0.89 0.221338 0.622535374 62%
Company 8 0.87 0.909041 0.885616538 89%
Company 5 0.78 0.239821 0.56392828 56%
Company 2 0.76 0.818824 0.783529759 78%
Company 4 0.67 0.283113 0.51524522 52%
Company 6 0.44 0.764722 0.569888781 57%
Company 7 0.44 0.398214 0.423285785 42%
As described in Section 2.5, Company 7 is not to be considered for optimisation given the default value for
similarity threshold is 0.5.
4.2 DemonstrationofEnvironmentalOptimisation
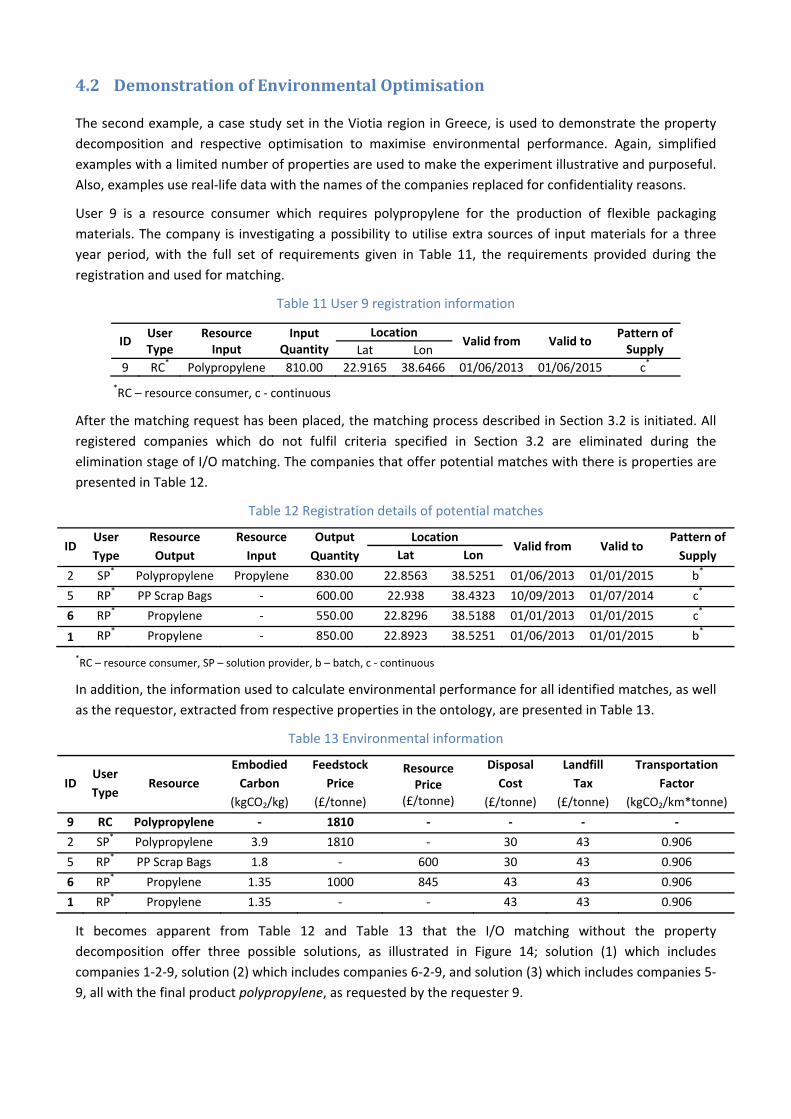
The second example, a case study set in the Viotia region in Greece, is used to demonstrate the property
decomposition and respective optimisation to maximise environmental performance. Again, simplified
examples with a limited number of properties are used to make the experiment illustrative and purposeful.
Also, examples use real‐life data with the names of the companies replaced for confidentiality reasons.
User 9 is a resource consumer which requires polypropylene for the production of flexible packaging
materials. The company is investigating a possibility to utilise extra sources of input materials for a three
year period, with the full set of requirements given in Table 11, the requirements provided during the
registration and used for matching.
Table 11 User 9 registration information
ID User Type
Resource Input
Input Quantity
LocationValid from Valid to
Pattern of Supply Lat Lon
9 RC* Polypropylene 810.00 22.9165 38.6466 01/06/2013 01/06/2015 c*
*RC – resource consumer, c ‐ continuous
After the matching request has been placed, the matching process described in Section 3.2 is initiated. All
registered companies which do not fulfil criteria specified in Section 3.2 are eliminated during the
elimination stage of I/O matching. The companies that offer potential matches with there is properties are
presented in Table 12.
Table 12 Registration details of potential matches
ID User
Type
Resource
Output
Resource
Input
Output
Quantity
LocationValid from Valid to
Pattern of
Supply Lat Lon
2 SP* Polypropylene Propylene 830.00 22.8563 38.5251 01/06/2013 01/01/2015 b*
5 RP* PP Scrap Bags ‐ 600.00 22.938 38.4323 10/09/2013 01/07/2014 c*
6 RP* Propylene ‐ 550.00 22.8296 38.5188 01/01/2013 01/01/2015 c*
1 RP* Propylene ‐ 850.00 22.8923 38.5251 01/06/2013 01/01/2015 b*
*RC – resource consumer, SP – solution provider, b – batch, c ‐ continuous
In addition, the information used to calculate environmental performance for all identified matches, as well
as the requestor, extracted from respective properties in the ontology, are presented in Table 13.
Table 13 Environmental information
ID User
Type Resource
Embodied
Carbon
(kgCO2/kg)
Feedstock
Price
(£/tonne)
Resource Price
(£/tonne)
Disposal
Cost
(£/tonne)
Landfill
Tax
(£/tonne)
Transportation
Factor
(kgCO2/km*tonne)
9 RC Polypropylene ‐ 1810 ‐ ‐ ‐ ‐
2 SP* Polypropylene 3.9 1810 ‐ 30 43 0.906
5 RP* PP Scrap Bags 1.8 ‐ 600 30 43 0.906
6 RP* Propylene 1.35 1000 845 43 43 0.906
1 RP* Propylene 1.35 ‐ ‐ 43 43 0.906
It becomes apparent from Table 12 and Table 13 that the I/O matching without the property
decomposition offer three possible solutions, as illustrated in Figure 14; solution (1) which includes
companies 1‐2‐9, solution (2) which includes companies 6‐2‐9, and solution (3) which includes companies 5‐
9, all with the final product polypropylene, as requested by the requester 9.
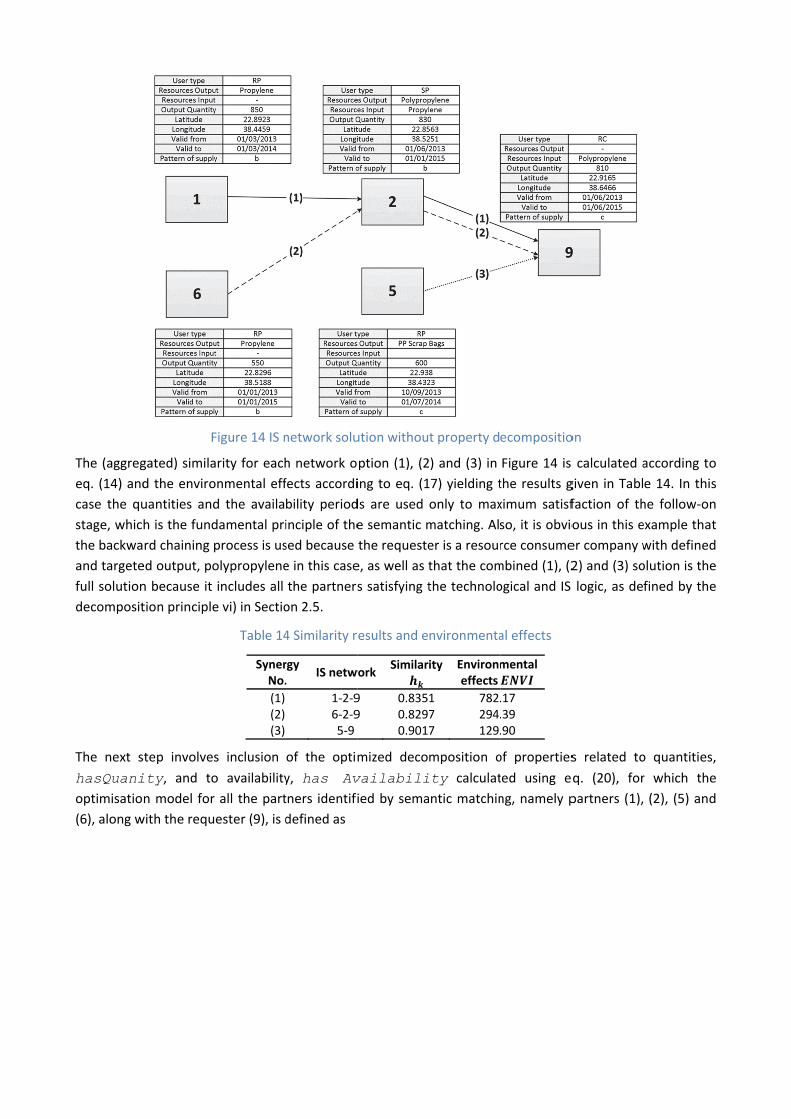
The (aggreg
eq. (14) and
case the qu
stage, whic
the backwa
and targete
full solution
decomposit
The next s
hasQuanioptimisatio
(6), along w
F
gated) simila
d the enviro
uantities and
h is the fund
rd chaining p
ed output, po
n because it
tion principle
step involves
ity, and ton model for
with the requ
Figure 14 IS n
arity for each
onmental eff
d the availa
damental pri
process is us
olypropylene
includes all
e vi) in Sectio
Table 14
SynerNo.
(1) (2) (3)
s inclusion
o availability
r all the part
ester (9), is d
network solu
h network o
fects accordi
bility period
inciple of the
sed because
e in this case
the partners
on 2.5.
4 Similarity r
rgy .
IS netw
1‐2‐96‐2‐95‐9
of the optim
y, has Avtners identifi
defined as
ution withou
ption (1), (2
ing to eq. (1
ds are used
e semantic m
the requeste
e, as well as t
s satisfying t
esults and e
work Similar
9 0.8359 0.8297
0.9017
mized deco
vailabiliied by sema
t property d
) and (3) in
17) yielding t
only to max
matching. Als
er is a resour
that the com
the technolo
nvironmenta
ity Environmeffects
1 782.7 294.7 129.
mposition o
ity calculatntic matchin
ecompositio
Figure 14 is
the results g
ximum satisf
so, it is obvio
rce consume
mbined (1), (2
ogical and IS
al effects
mental
.17
.39
.90
of properties
ted using e
ng, namely p
on
calculated a
given in Tabl
faction of th
ous in this e
er company w
2) and (3) so
logic, as de
s related to
q. (20), for
partners (1),
according to
e 14. In this
he follow‐on
example that
with defined
olution is the
fined by the
o quantities,
r which the
(2), (5) and
o
s
n
t
d
e
e
,
e
d
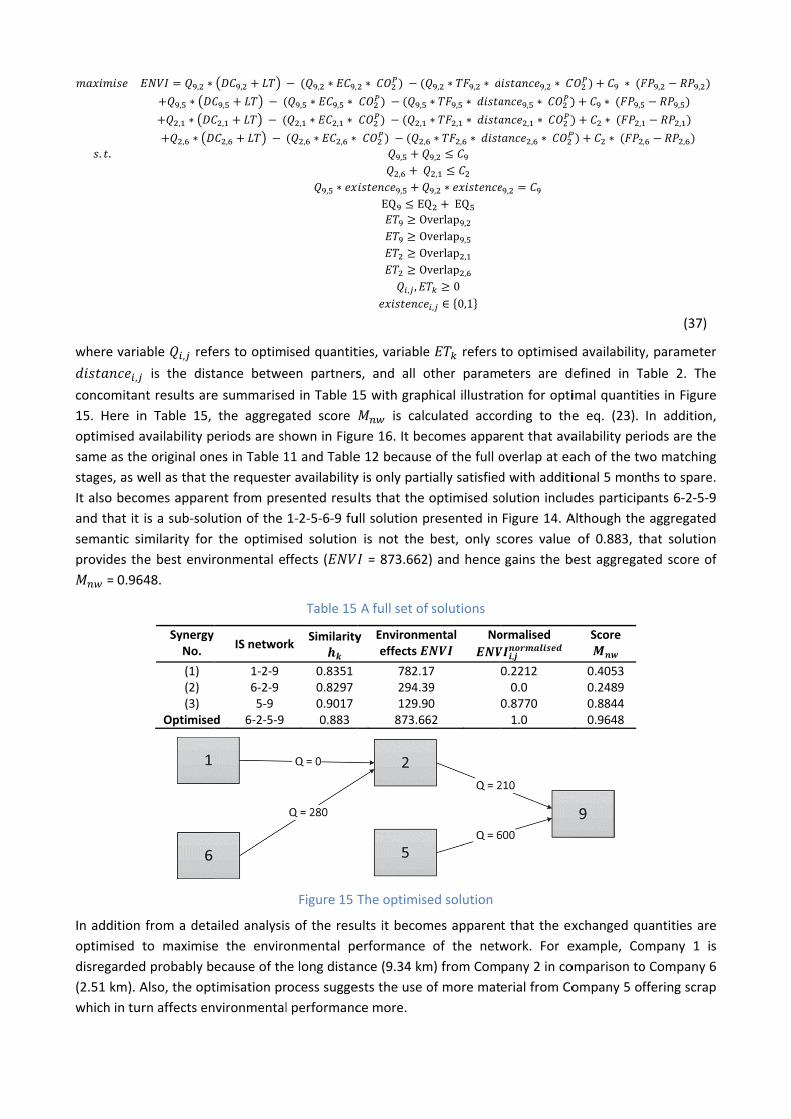
. .
where varia
,
concomitan
15. Here in
optimised a
same as the
stages, as w
It also beco
and that it
semantic si
provides th
= 0.96
In addition
optimised t
disregarded
(2.51 km). A
which in tur
, ∗
, ∗
, ∗
, ∗
able , refe
is the dist
nt results are
n Table 15,
availability p
e original on
well as that t
omes appare
is a sub‐solu
imilarity for
e best envir
48.
Synergy No.
(1) (2) (3)
Optimised
from a deta
to maximise
d probably b
Also, the opt
rn affects en
,
,
,
,
ers to optim
tance betwe
e summarise
the aggrega
eriods are sh
es in Table 1
he requeste
ent from pre
ution of the
the optimis
ronmental e
IS networ
1‐2‐9 6‐2‐9 5‐9
d 6‐2‐5‐9
ailed analysis
e the enviro
ecause of th
timisation pr
vironmental
, ∗ ,
, ∗ , ∗
, ∗ , ∗
, ∗ , ∗
, ∗
ised quantit
een partners
ed in Table 1
ated score
hown in Figu
11 and Table
r availability
sented resu
1‐2‐5‐6‐9 fu
sed solution
ffects (
Table 15
rk Similarity
0.83510.82970.90170.883
Figure 15 T
s of the resu
onmental pe
e long distan
rocess sugge
l performanc
∗
,
,
,
,
,
,
EQ EQOvOvOvOv
, ,
ties, variable
s, and all o
15 with grap
is calc
ure 16. It bec
e 12 because
y is only part
lts that the
ull solution p
is not the
= 873.662
A full set of
y Environmeffects
782.17294.39129.90873.66
The optimise
ults it becom
erformance
nce (9.34 km
ests the use o
ce more.
, ∗ , ∗
∗ , ∗
∗ , ∗
∗ , ∗
,
,
, ∗Q EQverlap ,
verlap ,
verlap ,
verlap ,
0
, ∈ 0,1
e refers
other param
hical illustra
culated acco
comes appa
e of the full o
ially satisfied
optimised so
presented in
best, only s
) and hence
solutions
ental
No
79062
ed solution
mes apparen
of the netw
m) from Com
of more mat
, ∗
, ∗
, ∗
, ∗
,
to optimised
eters are d
tion for opti
ording to the
rent that ava
overlap at ea
d with additi
olution inclu
Figure 14. A
scores value
gains the b
ormalised
,
0.22120.0
0.87701.0
t that the ex
work. For e
pany 2 in co
erial from Co
∗
∗ ,
∗ ,
∗ ,
d availability
defined in T
imal quantit
e eq. (23).
ailability per
ach of the tw
ional 5 mont
udes particip
Although the
of 0.883, t
best aggregat
Score
0.4053 0.2489 0.8844 0.9648
xchanged qu
example, Co
omparison to
ompany 5 of
, ,
,
,
, ,
(37)
y, parameter
able 2. The
ies in Figure
In addition,
riods are the
wo matching
ths to spare.
ants 6‐2‐5‐9
e aggregated
hat solution
ted score of
uantities are
ompany 1 is
o Company 6
ffering scrap
r
e
e
,
e
g
.
9
d
n
f
e
s
6
p
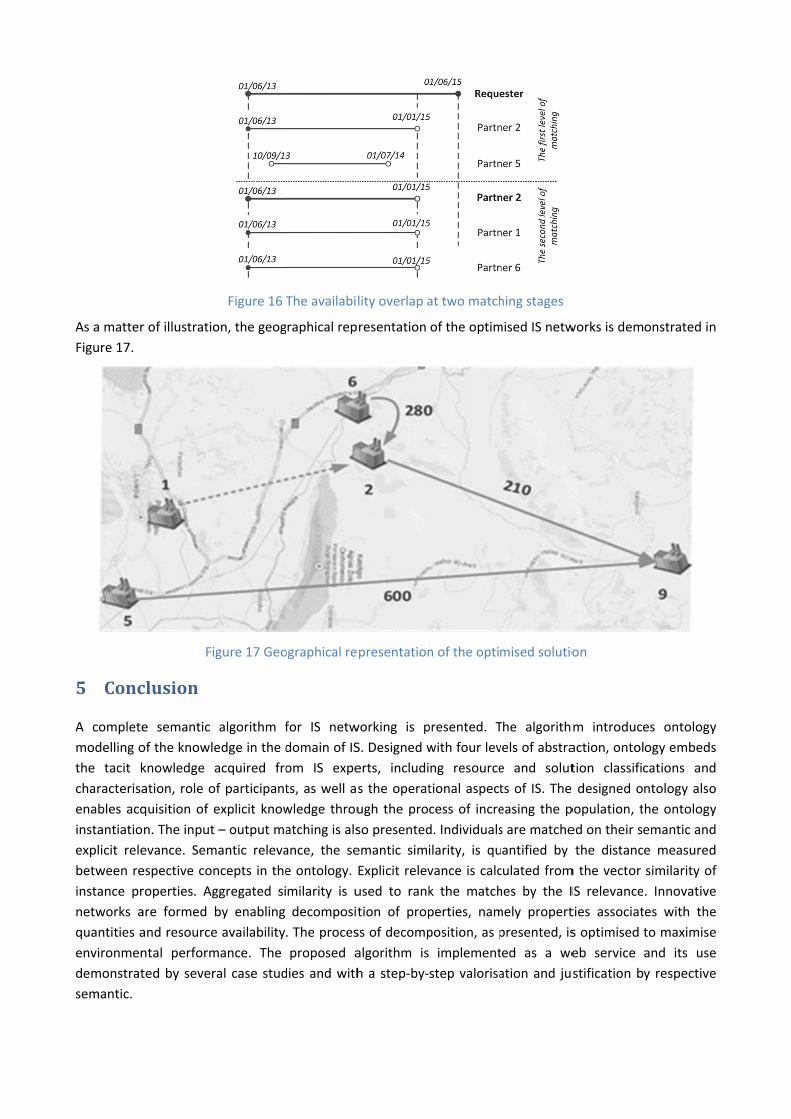
As a matter
Figure 17.
5 Conc
A complete
modelling o
the tacit k
characterisa
enables acq
instantiatio
explicit rele
between re
instance pr
networks a
quantities a
environmen
demonstrat
semantic.
r of illustratio
Fi
clusion
e semantic
of the knowle
knowledge
ation, role o
quisition of e
n. The input
evance. Sem
espective con
roperties. Ag
are formed
and resource
ntal perform
ted by sever
Figure 16
on, the geog
gure 17 Geo
algorithm f
edge in the d
acquired fro
of participant
explicit know
– output ma
mantic releva
ncepts in the
ggregated si
by enabling
e availability
mance. The
ral case stud
The availabi
graphical rep
ographical re
for IS netw
domain of IS
om IS expe
ts, as well a
wledge throu
atching is als
ance, the se
e ontology.
milarity is u
decomposit
. The proces
proposed a
dies and with
lity overlap a
resentation
presentation
working is p
S. Designed w
erts, includi
s the operat
ugh the pro
so presented
emantic simi
Explicit relev
used to rank
tion of prop
ss of decomp
algorithm is
h a step‐by‐
at two match
of the optim
n of the opti
presented. T
with four lev
ng resource
tional aspect
cess of incre
d. Individuals
ilarity, is qu
vance is calc
k the match
perties, nam
position, as p
implement
step valorisa
hing stages
mised IS netw
mised solutio
The algorith
vels of abstra
e and solut
ts of IS. The
easing the p
s are matche
uantified by
culated from
hes by the I
mely propert
presented, is
ted as a we
ation and ju
works is dem
on
m introduce
action, ontol
tion classific
e designed o
population, t
ed on their s
the distanc
m the vector
IS relevance
ties associat
s optimised
eb service
stification b
onstrated in
es ontology
ogy embeds
cations and
ntology also
he ontology
emantic and
e measured
similarity of
. Innovative
tes with the
to maximise
and its use
y respective
n
y
s
d
o
y
d
d
f
e
e
e
e
e
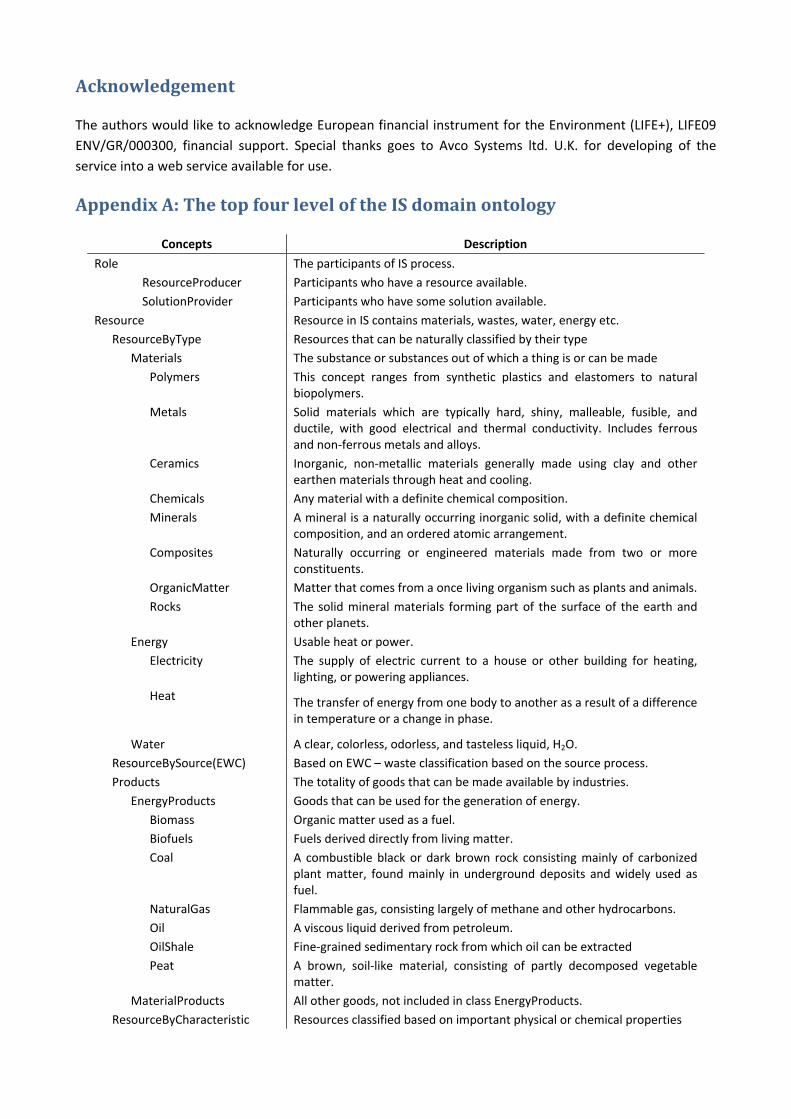
Acknowledgement
The authors would like to acknowledge European financial instrument for the Environment (LIFE+), LIFE09
ENV/GR/000300, financial support. Special thanks goes to Avco Systems ltd. U.K. for developing of the
service into a web service available for use.
AppendixA:ThetopfourleveloftheISdomainontology
Concepts Description
Role The participants of IS process.
ResourceProducer Participants who have a resource available.
SolutionProvider Participants who have some solution available.
Resource Resource in IS contains materials, wastes, water, energy etc.
ResourceByType Resources that can be naturally classified by their type
Materials The substance or substances out of which a thing is or can be made
Polymers This concept ranges from synthetic plastics and elastomers to natural biopolymers.
Metals Solid materials which are typically hard, shiny, malleable, fusible, and ductile, with good electrical and thermal conductivity. Includes ferrous and non‐ferrous metals and alloys.
Ceramics Inorganic, non‐metallic materials generally made using clay and other earthen materials through heat and cooling.
Chemicals Any material with a definite chemical composition.
Minerals A mineral is a naturally occurring inorganic solid, with a definite chemical composition, and an ordered atomic arrangement.
Composites Naturally occurring or engineered materials made from two or more constituents.
OrganicMatter Matter that comes from a once living organism such as plants and animals.
Rocks The solid mineral materials forming part of the surface of the earth and other planets.
Energy Usable heat or power.
Electricity The supply of electric current to a house or other building for heating, lighting, or powering appliances.
Heat The transfer of energy from one body to another as a result of a difference in temperature or a change in phase.
Water A clear, colorless, odorless, and tasteless liquid, H2O.
ResourceBySource(EWC) Based on EWC – waste classification based on the source process.
Products The totality of goods that can be made available by industries.
EnergyProducts Goods that can be used for the generation of energy.
Biomass Organic matter used as a fuel.
Biofuels Fuels derived directly from living matter.
Coal A combustible black or dark brown rock consisting mainly of carbonized plant matter, found mainly in underground deposits and widely used as fuel.
NaturalGas Flammable gas, consisting largely of methane and other hydrocarbons.
Oil A viscous liquid derived from petroleum.
OilShale Fine‐grained sedimentary rock from which oil can be extracted
Peat A brown, soil‐like material, consisting of partly decomposed vegetable matter.
MaterialProducts All other goods, not included in class EnergyProducts.
ResourceByCharacteristic Resources classified based on important physical or chemical properties
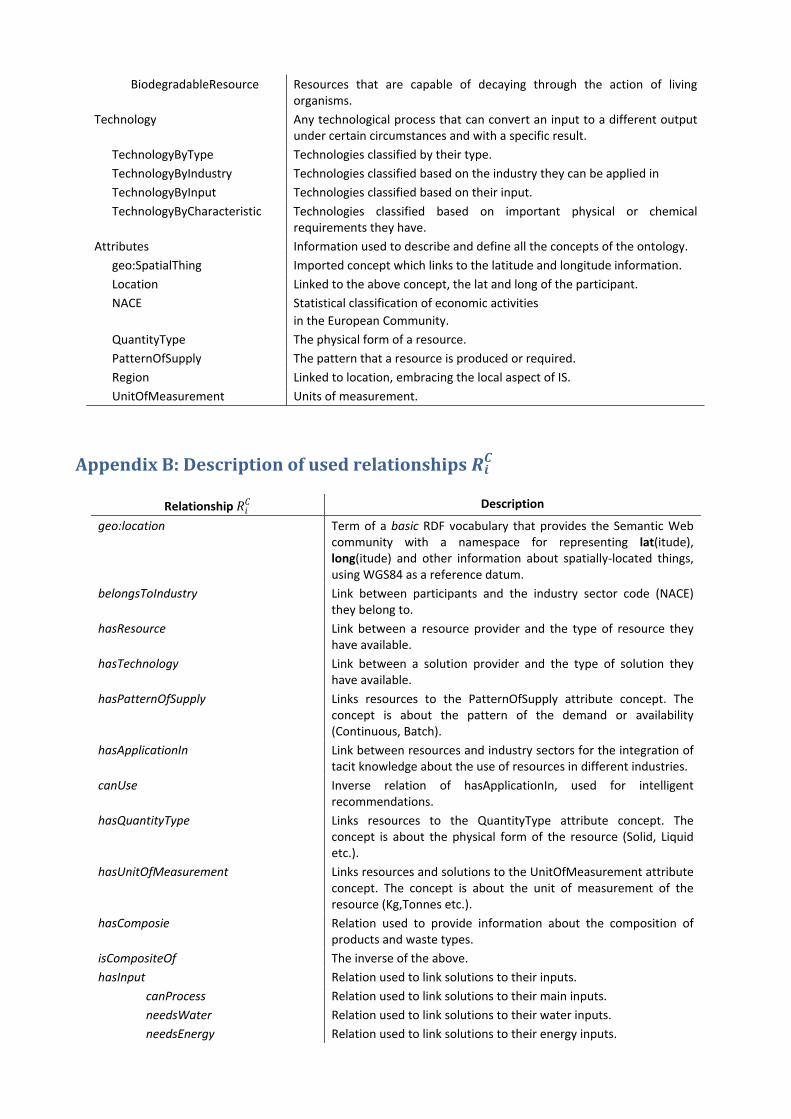
BiodegradableResource Resources that are capable of decaying through the action of living organisms.
Technology Any technological process that can convert an input to a different output under certain circumstances and with a specific result.
TechnologyByType Technologies classified by their type.
TechnologyByIndustry Technologies classified based on the industry they can be applied in
TechnologyByInput Technologies classified based on their input.
TechnologyByCharacteristic Technologies classified based on important physical or chemical requirements they have.
Attributes Information used to describe and define all the concepts of the ontology.
geo:SpatialThing Imported concept which links to the latitude and longitude information.
Location Linked to the above concept, the lat and long of the participant.
NACE Statistical classification of economic activities
in the European Community.
QuantityType The physical form of a resource.
PatternOfSupply The pattern that a resource is produced or required.
Region Linked to location, embracing the local aspect of IS.
UnitOfMeasurement Units of measurement.
AppendixB:Descriptionofusedrelationships
Relationship Description
geo:location Term of a basic RDF vocabulary that provides the Semantic Web community with a namespace for representing lat(itude), long(itude) and other information about spatially‐located things, using WGS84 as a reference datum.
belongsToIndustry Link between participants and the industry sector code (NACE) they belong to.
hasResource Link between a resource provider and the type of resource they have available.
hasTechnology Link between a solution provider and the type of solution they have available.
hasPatternOfSupply Links resources to the PatternOfSupply attribute concept. The concept is about the pattern of the demand or availability (Continuous, Batch).
hasApplicationIn Link between resources and industry sectors for the integration of tacit knowledge about the use of resources in different industries.
canUse Inverse relation of hasApplicationIn, used for intelligent recommendations.
hasQuantityType Links resources to the QuantityType attribute concept. The concept is about the physical form of the resource (Solid, Liquid etc.).
hasUnitOfMeasurement Links resources and solutions to the UnitOfMeasurement attribute concept. The concept is about the unit of measurement of the resource (Kg,Tonnes etc.).
hasComposie Relation used to provide information about the composition of products and waste types.
isCompositeOf The inverse of the above.
hasInput Relation used to link solutions to their inputs.
canProcess Relation used to link solutions to their main inputs.
needsWater Relation used to link solutions to their water inputs.
needsEnergy Relation used to link solutions to their energy inputs.
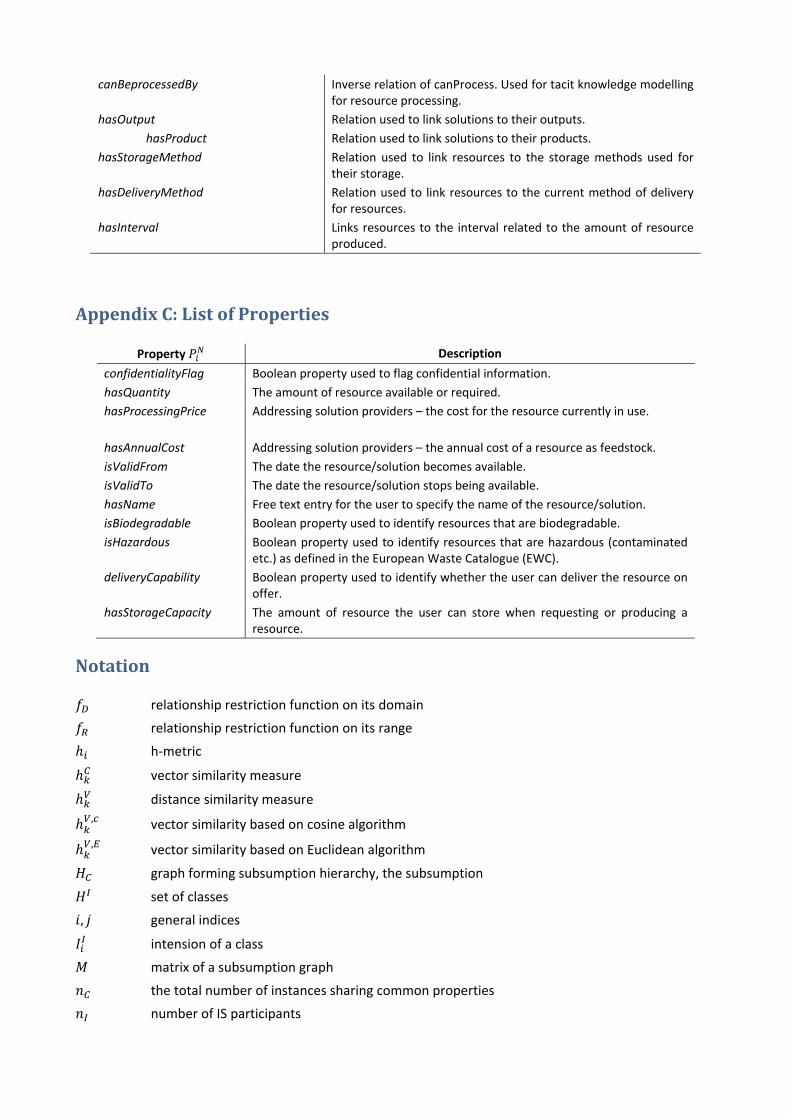
canBeprocessedBy Inverse relation of canProcess. Used for tacit knowledge modelling for resource processing.
hasOutput Relation used to link solutions to their outputs.
hasProduct Relation used to link solutions to their products.
hasStorageMethod Relation used to link resources to the storage methods used for their storage.
hasDeliveryMethod Relation used to link resources to the current method of delivery for resources.
hasInterval Links resources to the interval related to the amount of resource produced.
AppendixC:ListofProperties
Property Description
confidentialityFlag Boolean property used to flag confidential information.
hasQuantity The amount of resource available or required.
hasProcessingPrice
Addressing solution providers – the cost for the resource currently in use.
hasAnnualCost Addressing solution providers – the annual cost of a resource as feedstock.
isValidFrom The date the resource/solution becomes available.
isValidTo The date the resource/solution stops being available.
hasName Free text entry for the user to specify the name of the resource/solution.
isBiodegradable Boolean property used to identify resources that are biodegradable.
isHazardous Boolean property used to identify resources that are hazardous (contaminated etc.) as defined in the European Waste Catalogue (EWC).
deliveryCapability Boolean property used to identify whether the user can deliver the resource on offer.
hasStorageCapacity The amount of resource the user can store when requesting or producing a resource.
Notation
relationship restriction function on its domain
relationship restriction function on its range
h‐metric
vector similarity measure
distance similarity measure , vector similarity based on cosine algorithm
, vector similarity based on Euclidean algorithm
graph forming subsumption hierarchy, the subsumption
set of classes
, general indices
intension of a class
matrix of a subsumption graph
the total number of instances sharing common properties
number of IS participants
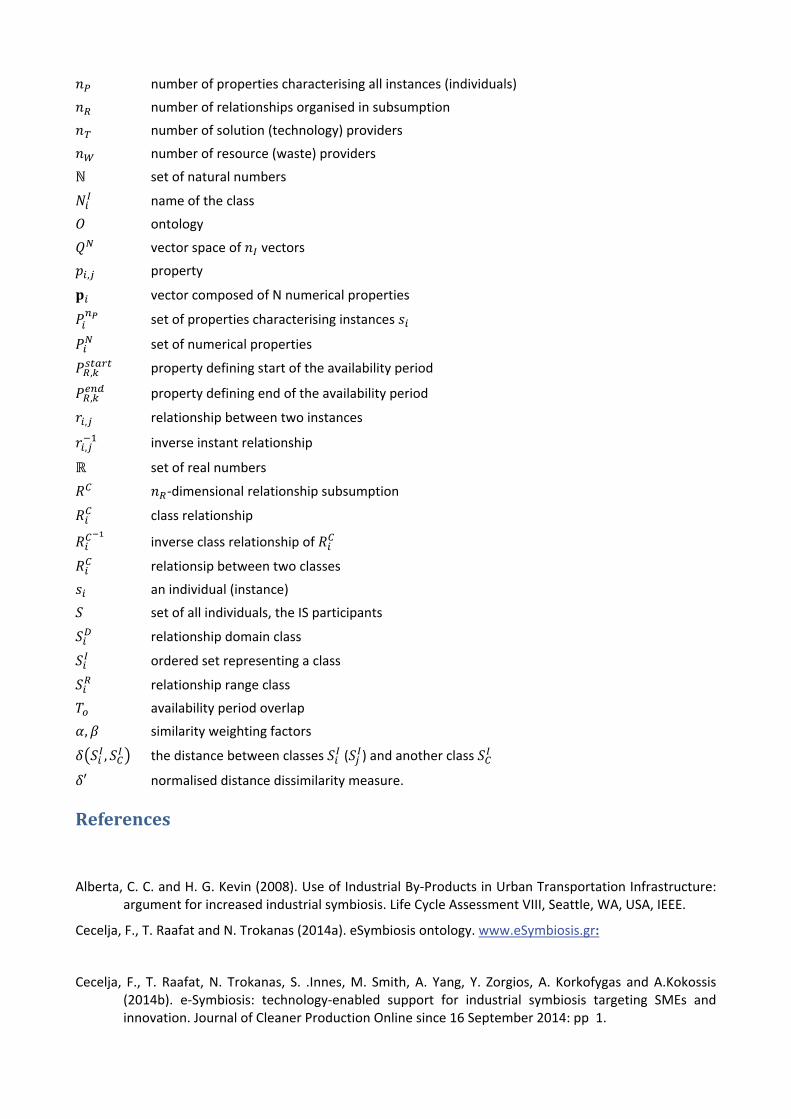
number of properties characterising all instances (individuals)
number of relationships organised in subsumption
number of solution (technology) providers
number of resource (waste) providers
set of natural numbers
name of the class
ontology
vector space of vectors
, property
vector composed of N numerical properties
set of properties characterising instances
set of numerical properties
, property defining start of the availability period
, property defining end of the availability period
, relationship between two instances
, inverse instant relationship
set of real numbers
‐dimensional relationship subsumption
class relationship
inverse class relationship of
relationsip between two classes
an individual (instance)
set of all individuals, the IS participants
relationship domain class
ordered set representing a class
relationship range class
availability period overlap
, similarity weighting factors
, the distance between classes ( ) and another class
′ normalised distance dissimilarity measure.
References
Alberta, C. C. and H. G. Kevin (2008). Use of Industrial By‐Products in Urban Transportation Infrastructure: argument for increased industrial symbiosis. Life Cycle Assessment VIII, Seattle, WA, USA, IEEE.
Cecelja, F., T. Raafat and N. Trokanas (2014a). eSymbiosis ontology. www.eSymbiosis.gr:
Cecelja, F., T. Raafat, N. Trokanas, S. .Innes, M. Smith, A. Yang, Y. Zorgios, A. Korkofygas and A.Kokossis (2014b). e‐Symbiosis: technology‐enabled support for industrial symbiosis targeting SMEs and innovation. Journal of Cleaner Production Online since 16 September 2014: pp 1.
Chertow, M. (2000). Industrial Symbiosis: Literature and Taxonomy. Annu. Rev. Energy Environ. 25(1): pp 313‐337.
Chertow, M. (2004). Industrial Symbiosis. Encyclopedia of Energy: pp 407‐415.
Chertow, M. (2007). Uncovering Industrial Symbiosis. Journal of Industrial Ecology 11(1): pp 11‐29.
Chertow, M. and J. Ehrenfeld (2012). Organizing Self‐Organizing Systems ‐ Toward a Theory of Industrial Symbiosis. Journal of Industrial Ecology 16(1): pp 13‐27.
EC. (2002). "European Waste Catalogue: Commission Decision (EC) 2000/532 " Retrieved 14/06/2013, from http://ec.europa.eu/environment/waste/framework/list.htm.
EC (2010). Comission Regulation (EU) No 849/2010: Generation of Waste. Official Journal of the European Union 28.9.2010: pp 2‐40.
Euzenat, J. and P. Shvaiko (2013). Ontology Matching, Springer.
Grant, G., T. Seager, G. Massard and L. Nies (2010). Information and Communication Technology for Industrial Symbiosis. Journal of Industrial Ecology 14(5): pp 740‐753.
Hu, W., N. Jian, Y. Qu and Y. Wang (2005). A Graph Matching for Ontologies. K‐Cap 2005 Workshop on Integrating Ontologies. Alberta, Canada: pp 43‐50.
Jae‐Yeon, W., K. Jung‐Hoon, L. Sang‐yoon and P. Hung‐Suck (2006). Industrial Symbiosis as an Integrated Business/Environment Management Process: The Case of Ulsan Industrial Complex. The 1st International Forum on Strategic Technology, Ulsan, South Corea, IEEE.
Junli, W., D. Zhijun and J. Changjun (2006). GAOM: Genetic Algorithm based Ontology Matching. IEEE Asia‐Pacific Conference on Services Computing (APSCC'06), Guangzhou, Guangdong, China
Lehtoranta, S., A. Nissinen, T. Mattila and M. Melanen (2011). Industrial symbiosis and the policy instruments of sustainable consumption and production. Journal of Cleaner Production 19(1): pp 1865e1875.
Melnik, S., H. Garcia‐Molina and E. Rahm (2002). Similarity flooding ‐ a versatile graph matching algorithm. 18th International Conference on Data Engineering. San Jose, CA, USA: pp 182‐200.
Mirata, M. and T. Emtairah (2005). Industrial symbiosis networks and the contribution to environmental innovation: The case of the Landskrona industrial symbiosis programme Journal of Cleaner Production 13(10‐11): pp 993‐1002.
Raafat, T., F. Cecelja, N. Trokanas and B. Xrisha (2013). An Ontological Approach Towards Enabling Processing Technologies Participation in Industrial Symbiosis. Computers & Chemical Engineering 59(1): pp 33‐46.
Tous, R. and J. Delgado (2006). A vector space model for semantic similarity calculation and OWL ontology alignment. 17th International Conference on Database and Expert Systems Applications, DEXA 2006. Kraków, Poland,: pp 307‐316.
Trokanas, N., F. Cecelja and T. Raafat (2014). Semantic Input/Output Matching for Waste Processing in Industrial Symbiosis. Computers & Chemical Engineering 66(1): pp 259 ‐ 268.
Trokanas, N., F. Cecelja and T. Raafat (2015). Semantic Approach for Pre‐assessment of Environmental Indicators in Industrial Symbiosis. Journal of Cleaner Production 96(1): pp 349‐361.
Trokanas, N., F. Cecelja, T. Raafat and P. Innes (2013). An Ontological Approach Enabling “a Priori” Quantitative Assessment of Is Networks. 2013 AIChE Annual Meeting, San Francisco, USA.
Turban, E. and J. Aronson (2001). Decision Support Systems and Intelligent Systems. New Jersey, Prentince‐Hall, Inc.


