
Sell-Side School Ties - University of Technology Sydney · THE JOURNAL OF FINANCE •VOL. LXV, NO....
29
THE JOURNAL OF FINANCE • VOL. LXV, NO. 4 • AUGUST 2010 Sell-Side School Ties LAUREN COHEN, ANDREA FRAZZINI, and CHRISTOPHER MALLOY ∗ ABSTRACT We study the impact of social networks on agents’ ability to gather superior infor- mation about firms. Exploiting novel data on the educational background of sell-side analysts and senior corporate officers, we find that analysts outperform by up to 6.60% per year on their stock recommendations when they have an educational link to the company. Pre-Reg FD, this school-tie return premium is 9.36% per year, while post- Reg FD it is nearly zero. In contrast, in an environment that did not change selective disclosure regulation (the U.K.), the school-tie premium is large and significant over the entire sample period. CERTAIN AGENTS PLAY A KEY ROLE in revealing information to securities mar- kets. In the equities market, security analysts are among the most important. A large part of an analyst’s job is to research, produce, and disclose reports fore- casting companies’ future prospects, and to translate their forecasts into stock recommendations. Therefore, isolating how, or from whom, analysts obtain the information they use to produce their recommendations is critical. In this paper we investigate ties between sell-side analysts and management of public firms, and the subsequent performance of analysts’ stock recommen- dations. We exploit common past experiences, namely, attendance at the same educational institution, to identify firms where analysts are more likely to gain direct access to senior management. An advantageous aspect of our network ties is that they are formed long before the information likely being transferred across them, and thus the underlying tie (alumni link) is not directly related to the type of information likely being transmitted years later (company-related information). Our main goal is to test the hypothesis that analysts gain a comparative information advantage through their social networks; specifically, through ∗ Cohen is at the Harvard Business School and NBER; Frazzini is at the University of Chicago Graduate School of Business and NBER; Malloy is at the Harvard Business School. We would like to thank Joseph Chen, Josh Coval, Eugene Fama, Cam Harvey (Editor), Owen Lamont, an anonymous referee, an associate editor, and seminar participants at the Harvard Business School, Stanford University, Northwestern University, Ohio State University, University of Chicago, University of Maryland, University of Florida, London Business School, London School of Economics, SIFR, Bentley College, Barclays Global Investors, the Society of Quantitative Analysts, and the AFA Meetings in Chicago for helpful comments. We also thank Nick Kennedy, Stephen Wilson, Laura Dutson, Matthew Healey, Meng Ning, Courtney Stone, and Bennett Surajat for excellent research assistance. In addition, we are grateful to BoardEx and Linda Cechova for providing firm board data, and to Devin Shanthikumar and Alexander Ljungqvist for sharing data with us. We gratefully acknowledge funding from the National Science Foundation. 1409
-
Upload
phungkhuong -
Category
Documents
-
view
217 -
download
1
Transcript of Sell-Side School Ties - University of Technology Sydney · THE JOURNAL OF FINANCE •VOL. LXV, NO....

THE JOURNAL OF FINANCE • VOL. LXV, NO. 4 • AUGUST 2010
Sell-Side School Ties
LAUREN COHEN, ANDREA FRAZZINI, and CHRISTOPHER MALLOY∗
ABSTRACT
We study the impact of social networks on agents’ ability to gather superior infor-mation about firms. Exploiting novel data on the educational background of sell-sideanalysts and senior corporate officers, we find that analysts outperform by up to 6.60%per year on their stock recommendations when they have an educational link to thecompany. Pre-Reg FD, this school-tie return premium is 9.36% per year, while post-Reg FD it is nearly zero. In contrast, in an environment that did not change selectivedisclosure regulation (the U.K.), the school-tie premium is large and significant overthe entire sample period.
CERTAIN AGENTS PLAY A KEY ROLE in revealing information to securities mar-kets. In the equities market, security analysts are among the most important.A large part of an analyst’s job is to research, produce, and disclose reports fore-casting companies’ future prospects, and to translate their forecasts into stockrecommendations. Therefore, isolating how, or from whom, analysts obtain theinformation they use to produce their recommendations is critical.
In this paper we investigate ties between sell-side analysts and managementof public firms, and the subsequent performance of analysts’ stock recommen-dations. We exploit common past experiences, namely, attendance at the sameeducational institution, to identify firms where analysts are more likely to gaindirect access to senior management. An advantageous aspect of our networkties is that they are formed long before the information likely being transferredacross them, and thus the underlying tie (alumni link) is not directly related tothe type of information likely being transmitted years later (company-relatedinformation).
Our main goal is to test the hypothesis that analysts gain a comparativeinformation advantage through their social networks; specifically, through
∗Cohen is at the Harvard Business School and NBER; Frazzini is at the University of ChicagoGraduate School of Business and NBER; Malloy is at the Harvard Business School. We would like tothank Joseph Chen, Josh Coval, Eugene Fama, Cam Harvey (Editor), Owen Lamont, an anonymousreferee, an associate editor, and seminar participants at the Harvard Business School, StanfordUniversity, Northwestern University, Ohio State University, University of Chicago, University ofMaryland, University of Florida, London Business School, London School of Economics, SIFR,Bentley College, Barclays Global Investors, the Society of Quantitative Analysts, and the AFAMeetings in Chicago for helpful comments. We also thank Nick Kennedy, Stephen Wilson, LauraDutson, Matthew Healey, Meng Ning, Courtney Stone, and Bennett Surajat for excellent researchassistance. In addition, we are grateful to BoardEx and Linda Cechova for providing firm boarddata, and to Devin Shanthikumar and Alexander Ljungqvist for sharing data with us. We gratefullyacknowledge funding from the National Science Foundation.
1409
1410 The Journal of Finance R©
educational ties with senior officers and board members of the firms that theycover.1 We test this hypothesis by building portfolios that replicate sell-sideanalysts’ recommendations and by comparing how analysts perform on firmsto which they have ties, relative to firms to which they do not. Our analysisfocuses on the universe of sell-side analysts and publicly traded domestic firmsfor which we are able to collect data on the educational background of both theanalyst and the senior officers of the firm she covers.
To better understand our approach, consider the following example. In 1992,two sell-side analysts cover XYZ Corp.2 One analyst, Mr. Smith, shares a con-nection with the firm, defined as having attended the same academic institutionas a senior officer or a member of the board of directors. Among the other stockshe covers, Mr. Smith is also linked to CFM Corp., another large cap stock inthe same industry. The second analyst, Mr. Jones, shares no educational linkto either firm. As of December 1992, both analysts’ rating on the stock (and theI/B/E/S consensus (median) rating) is a “HOLD.”3
On February 10, 1993, prior to the market opening, Mr. Smith deviatesfrom the consensus and upgrades XYZ to a BUY rating. He holds the BUYrating until the stock delists in December 1993. Mr. Jones maintains (and laterreiterates) a HOLD rating, reflecting the consensus recommendation. Mr. Joneseventually drops the stock from coverage, while the consensus recommendationremains a HOLD until the delisting date.
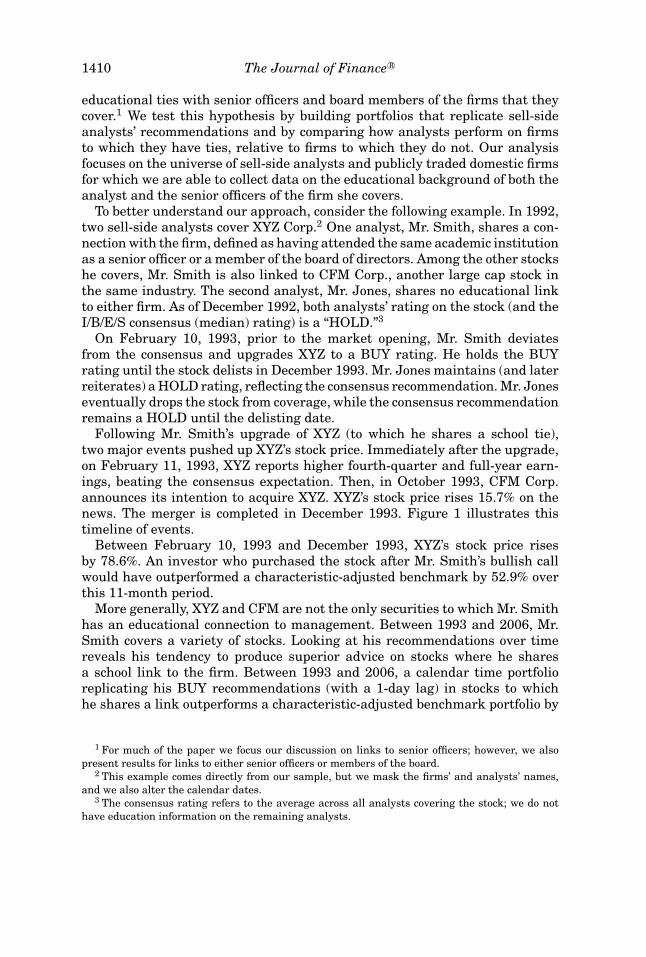
Following Mr. Smith’s upgrade of XYZ (to which he shares a school tie),two major events pushed up XYZ’s stock price. Immediately after the upgrade,on February 11, 1993, XYZ reports higher fourth-quarter and full-year earn-ings, beating the consensus expectation. Then, in October 1993, CFM Corp.announces its intention to acquire XYZ. XYZ’s stock price rises 15.7% on thenews. The merger is completed in December 1993. Figure 1 illustrates thistimeline of events.
Between February 10, 1993 and December 1993, XYZ’s stock price risesby 78.6%. An investor who purchased the stock after Mr. Smith’s bullish callwould have outperformed a characteristic-adjusted benchmark by 52.9% overthis 11-month period.
More generally, XYZ and CFM are not the only securities to which Mr. Smithhas an educational connection to management. Between 1993 and 2006, Mr.Smith covers a variety of stocks. Looking at his recommendations over timereveals his tendency to produce superior advice on stocks where he sharesa school link to the firm. Between 1993 and 2006, a calendar time portfolioreplicating his BUY recommendations (with a 1-day lag) in stocks to whichhe shares a link outperforms a characteristic-adjusted benchmark portfolio by
1 For much of the paper we focus our discussion on links to senior officers; however, we alsopresent results for links to either senior officers or members of the board.
2 This example comes directly from our sample, but we mask the firms’ and analysts’ names,and we also alter the calendar dates.
3 The consensus rating refers to the average across all analysts covering the stock; we do nothave education information on the remaining analysts.

Sell-Side School Ties 1411
0.8
1
1.2
1.4
1.6
1.8
Feb-93 Mar-93 Apr-93 May-93 Jun-93 Jul-93 Aug-93 Sep-93 Oct-93 Nov-93 Dec-93
Tot
al R
etur
n
XYZ Corp. Benchmark portfolio
CFM announces its intention to acquire XYZ
Rumors of a possible acquisition
XYZ Upgraded to BUY
Earnings announcement
Merger completed
Figure 1. XYZ Corp. This figure shows actual total returns of XYZ Corp. (anonymized nameand dates) around the upgrade by a linked analyst, as well as the return on its correspondingrisk-adjusted benchmark.
1.17% per month; the corresponding abnormal return on his nonlinked calls isonly 0.01%.
The results in this example represent a much more systematic pattern acrossthe universe of sell-side equity analysts. Consistent with the hypothesis thateducational ties facilitate the transmission of private information, we find thatanalysts produce significantly better recommendations on firms to which theyhave an educational tie relative to firms to which they do not.
Analysts’ buy recommendations on school-tied stocks outperform buy rec-ommendations on nontied stocks by an average of 45 to 55 basis points permonth, using 12-month calendar time portfolios following the recommenda-tions. Therefore, a calendar time portfolio strategy exploiting only this school-tie informational advantage on buys translates into average outperformanceof 5.40% to 6.60% per year. This return differential is largely unaffected aftercontrolling for other determinants of returns such as size, book-to-market, andmomentum. Importantly, our results are not simply an artifact of a selectedsample of “smart” or skilled analysts: the school-tie premium is large even af-ter removing analysts from the most connected schools and the highest qualityschools (e.g., Ivy League) from our sample, and even after including analystfixed effects in our regressions.

1412 The Journal of Finance R©
We do not find a similar return differential on analysts’ sell recommenda-tions. Analysts’ school-tied sells perform roughly the same as their nontied sellrecommendation stocks following the recommendations. One explanation con-sistent with this finding is that managers are willing to reveal positive (but notnegative) information about their firms. Alternatively, this would be consistentwith analysts obtaining both good and bad news from their school-tied firms,but perhaps as part of a tacit agreement, acting only on the positive news.
Information may be transferred along the networks via a number of mech-anisms. It may be the case that alumni networks provide analysts cheaperaccess to firm-level material information, which then allows them to form su-perior recommendations. For example, the analyst may have access to explicitlyprivate conference calls with firm officials, or the network may reduce the costto the analyst of obtaining or analyzing information about the firm (e.g., theanalyst can obtain information about upcoming earnings with fewer calls tothe firm). Alternatively, education networks may simply allow analysts to bet-ter assess managerial quality. Under this mechanism, there is not a constantflow of information in the network from the firm to the analyst, but insteadsome inherent information within the network about managerial quality (e.g.,all members of the Dartmouth network know that the Dartmouth CEO of firmABC is quite good, while the Dartmouth CEO of XYZ is not).
In order to distinguish between the mechanisms above, we exploit the in-troduction of Regulation FD during the sample period. Instated by the SECin October 2000, this regulation’s explicit aim was to block the former mech-anism, that is, to end the selective disclosure by firms to a subset of marketparticipants. For instance, the SEC release on Regulation FD stated that theaim was to stop: “a privileged few” from gaining “an informational edge—andthe ability to use that edge to profit—from their superior access to corporateinsiders, rather than from their skill, acumen, or diligence.” The SEC went onto argue that it was these selective disclosure relationships that allowed agentsto “exploit ‘unerodable informational advantages’ derived not from hard workor insights, but from their access to corporate insiders.”4 Our education net-works may represent exactly this type of unerodable informational advantagethat the SEC targeted with Regulation FD. Specifically, if the channel thatallows analysts to produce superior recommendations on school-tied stocks isselective disclosure, we may expect this superior ability to be attenuated post-Regulation FD. However, if the education network simply measures analysts’increased ability to assess managerial quality for CEOs they attended schoolwith, it is not clear this superior ability would be affected at all by RegulationFD (Reg FD hereafter).
We test this hypothesis by splitting our sample to observe analysts’ abilityon school-tied stocks pre- and post-Reg FD. All of our evidence points to se-lective disclosure being the main mechanism of information transfer along thenetwork. All of our effects are positive, large, and significant pre-Reg FD, but
4 Selective Disclosure and Insider Trading, SEC Release Nos. 33–7881, 34–43154, IC-24599, 65Fed. Reg. 51716 (Aug. 24, 2000).

Sell-Side School Ties 1413
small and insignificant post-Reg FD. Specifically, when we run panel regres-sions of returns on buy recommendations on a school-tie dummy variable, apost-Reg FD dummy variable, an interaction term (linked∗post-Reg FD), and ahost of firm, brokerage, and analyst-level control variables, we find that the co-efficient on the interaction term is strongly negative, while the combined effect(interaction term + linked) is small (9bp) and insignificant (F-statistic of 1.18),indicating that the school-tie premium is largely absent in the post-Reg FDperiod. Similarly, the monthly returns of a long–short calendar time portfolioon the differences between school-tied and non–school-tied stocks pre-Reg FDranges between 68 to 78 basis points per month, or 8.16% (t = 4.35) to 9.36%(t = 3.50) per year, while post-Reg FD this difference is only 14 to 26 basispoints per month, and is statistically indistinguishable from zero.
Next, we construct an out-of-sample test of the impact of Reg FD by replicat-ing our results in the United Kingdom, where no such law was enacted over oursample period.5 We again find a large school-tie return premium on buy recom-mendations for U.K.-listed stocks: a long–short portfolio that purchases linkedbuy recommendations and shorts nonlinked buy recommendations earns 187basis points per month (t = 2.79) in raw returns, and 167 basis points permonth (t = 2.20) in abnormal returns. However, unlike in the United States,we see no significant difference in this premium between the pre- and post-RegFD time periods.
We also show that the number of school ties that an analyst possesses amongher covered stocks strongly increases the likelihood that she will become an“All-Star” analyst (a one–standard deviation increase in connections increasesthe probability by nearly 50%, from 9.2% to 13.6%), but only in the pre-Reg FDperiod. This result further highlights the value of social networks in preciselythose times when selective disclosure is least inhibited.
Last, we perform a number of robustness checks. In particular, we find thatthe school-tie outperformance is present in both large and small cap stocks,and for stocks with both high and low analyst coverage. In addition, the effectis robust to splitting our school-link universe across different dimensions: IvyLeague versus non-Ivy League, Top 40 (as defined by U.S. News and WorldReport ranking) versus non-Top 40, and most linked versus non-most-linkedschools. The results are also robust to controlling for school-level returns at thestock level. Finally, we show that other measures of social networks (namelysame school conference) also form important information networks for analysts.
The remainder of the paper is organized as follows. Section I of the paperprovides a brief background and literature review, and Section II describesthe data on both firms and analysts. Section III provides the main results on
5 Regulations prohibiting the selective disclosure of material information by U.K.-listed firmshave been a part of U.K. law for decades since rules on insider dealing came into force in the 1980s.Conversations with practitioners in the United Kingdom indicate that, although clarifications andenhancements to these norms were put into effect in 2001 (through the Financial Services andMarkets Act) and 2005 (via the Market Abuse Directive), these acts were generally not viewed asstructural shifts in the disclosure environment in the same way that Regulation FD in the UnitedStates was designed to be.
1414 The Journal of Finance R©
analyst ability and sell-side school ties. Section IV explores the mechanism forinformation transfer across education networks. Finally, Section V concludes.
I. The Setting
The opinions of sell-side equity analysts are among the most widely solicited,anticipated, and dissected news items in the stock market each day. Becauseanalyst data are available in large quantities and in relatively standardizedformats, the sell-side analyst industry offers an ideal testing ground for a num-ber of theories of economic behavior. In this paper we use this testing groundto investigate the idea that agents’ educational ties facilitate the transmissionof private information into security markets.
A large literature on analyst performance supports the view that analystsbring valuable information to the market, and have incentives to do so. Nu-merous studies document the potential profitability of trading on analyst rec-ommendations (see, for example, Womack (1996), Barber et al. (2001, 2003),Jegadeesh et al. (2004)) and earnings forecast revisions (see Stickel (1991) andGleason and Lee (2003), among others).6 Of course, sell-side analysts havean incentive to produce unbiased forecasts and recommendations for investorsonly if they are compensated for doing so. Due to a lack of data on direct com-pensation, the literature generally tests this idea by linking analyst behaviorto measures of implicit incentives or career concerns. Stickel (1992) finds thathighly rated “All-American” analysts (who are typically better compensatedthan other analysts) are more accurate earnings forecasters than other ana-lysts, suggesting that accuracy is rewarded. Similarly, Mikhail, Walther, andWillis (1999) document that poor relative performance leads to job turnover.
An important strand of the literature, however, suggests that analysts’ ca-reer concerns and the conflicts of interest inherent in equity research createan agency problem, potentially at the expense of investors who trust analystresearch to be unbiased. Hong, Kubik, and Solomon (2000) find that youngeranalysts deviate less from the consensus than their older counterparts, consis-tent with the predictions of reputation-based herding models.7 Hong and Kubik(2003) report that, controlling for accuracy, analysts who are optimistic relativeto the consensus are more likely to experience favorable job separations. Theyalso find that analysts are judged less on accuracy than optimism when it comesto stocks underwritten by their employers, supporting allegations that analystssuffer from a conflict of interest when covering stocks affiliated with their bro-kerage houses.8 Since we can control for investment banking affiliations, we
6 See also Michaely and Womack (2007), who combine information from recommendations andearnings forecasts data and show that the subset of upgraded/downgraded recommendations “sup-ported” by an earnings forecast revision in the same direction are the most profitable recommen-dations.
7 Chevalier and Ellison (1999) and Lamont (2002) find similar results for mutual fund managersand macroeconomic forecasters, respectively. Also see Holmstrom (1999) and Scharfstein and Stein(1990) for related work on career concerns.
8 Lin and McNichols (1998), Michaely and Womack (1999), and Lin, McNichols, and O’Brien(2005) also report evidence in support of this view.

Sell-Side School Ties 1415
can distinguish information effects from these agency effects throughout thepaper.
Our paper is unique in that we try to isolate a channel through which ana-lysts acquire valuable information. As such, our work is related to the recentpassage of Reg FD. Effective October 23, 2000, companies must reveal anymaterial information to all investors and analysts simultaneously in the caseof intentional disclosures, or within 24 hours in the case of unintentional dis-closures. According to SEC Proposed Rule S7–31-99, regulators believe thatselective disclosure is “not in the best interests of investors or the securitiesmarkets generally.” Several recent papers examining the impact of Reg FD onthe behavior of equity analysts conclude that the law has in fact been effec-tive in curtailing selective disclosure to analysts (see, for example, Mohanramand Sunder (2006), Agrawal, Chadha, and Chen (2006), and Gintschel andMarkov (2004)). Since our tests explore a specific possible channel of selectivedisclosure, they are relevant to this debate.9
Exploring the role of social networks, connections, and influence in financialmarkets is a relatively new development in the finance literature.10 Relatedto our work are the findings in Hong, Kubik, and Stein (2005), who documentword-of-mouth effects between same-city mutual fund managers with respectto their portfolio choices, and Kuhnen (2009), who documents a link betweenpast business connections between mutual fund directors and advisory firmsand future preferential contracting decisions.11 Also related are the findingsin Massa and Simonov (2005), who document a relation between the portfoliochoices of individual investors and their past educational background.12
Our empirical identification is similar to that in Cohen, Frazzini, and Malloy(2008), who exploit educational connections between mutual fund managersand corporate board members to identify information transfer through socialnetworks. Hwang and Kim (2009) and Butler and Gurun (2008) also use cor-porate board data to identify social networks, but focus on the impact of socialconnections on executive compensation. The use of corporate board linkages asa measure of personal networks is common in the network sociology literature(see, for example, Mizruchi (1982, 1992) and Useem (1984)). Board linkagesare typically isolated by looking at direct board interlocks between firms (as inHallock (1997)), “back-door” links among directors across firms (as in Larckeret al. (2005) and Conyon and Muldoon (2006)), or direct and indirect links be-tween board members and government agencies or officials (as in Faccio (2006)
9 See also Malloy (2005), who shows that geographically proximate analysts produce more accu-rate forecasts, but do so both before and after the enactment of Regulation FD, as well as Groysberget al. (2007), who document a decline in the forecast accuracy advantage of sell-side analysts overbuy-side analysts after the enactment of Regulation FD.
10 See Jackson (2005) for a survey on the economics of social networks.11 See also Hong, Kubik, and Stein (2004) for evidence that measures of sociability are linked
to increased stock market participation, and Hochberg, Ljungqvist, and Lu (2007) for evidence ofa positive impact of venture capital networks on investment performance.
12 See also Parkin (2006), who identifies both school clustering of lawyers at law firms thatcannot be explained by quality or location, and a link between promotion chances in law firms andthe concentration of partners with similar educational backgrounds.
1416 The Journal of Finance R©
and Fisman et al. (2006), among others), and have been shown to be impor-tant mechanisms for the sharing of information and the adoption of commonpractices across firms.13 Our approach is different in that we focus on directlinks between board members and equity analysts via shared educational back-grounds.
II. Data
The data in this study are collected from several sources. We search publicfilings and other miscellaneous information available over the World Wide Webto construct a novel database of the educational background of sell-side analystsissuing recommendations on U.S. domestic stocks.
We start by identifying all sell-side analysts on the I/B/E/S tape who provideat least one recommendation on a domestic stock between 1993 and 2006. Foreach analyst, I/B/E/S provides a numeric identifier, the analyst’s last name, theinitial of his/her first name, and a code corresponding the analyst’s brokeragefirm. We use the broker translation file to reconstruct the name of the broker-age house.14 Since our data construction methodology involves name searches,we delete observations with multiple names for a given numeric identifier orwith multiple identifiers for a given name. Finally, we discard teams, sinceI/B/E/S provides only the team members’ last names but not their first name.This leads to an initial list of 8,620 analysts issuing recommendations between1993 and 2006.
We hand-collect analysts’ educational background from a variety of sources.Our main data source is Zoominfo.com, a search engine that specializes incollecting and indexing biographical and employment data from publicly avail-able documents over the Web. From this site, we obtain each analyst’s fullname, job title, present and past employment history, and stocks covered in or-der to correctly identify an analyst in our initial set. We supplement the initialsearch with the BrokerCheck search engine available on the Financial IndustryRegulatory Authority website, which contains background information on cur-rent and former FINRA-registered security investment professionals. Finally,if we are unable to determine the analyst’s educational background using ourprimary sources, we use other sources available over the Web on a case-by-case basis to collect additional information. In building our final sample weuse a conservative approach and discard observations where we are unableto uniquely associate an analyst with a specific educational background. Thisoccurs either due to disagreement across information sources, or because we
13 Examples of the latter include the adoption of poison pills (Davis (1991)), corporate acquisi-tion activity (Haunschild (1993)), CEO compensation (Khurana (2002)), and the decision to makepolitical contributions (Mizruchi (1992)).
14 See Malloy, Marston, and Ljunqvist (2009) for issues and problems with the I/B/E/S historicalrecommendation data. Note that since we use a very recent snapshot of the data (circa late 2007),after cleanups to the historical data had already been put into effect, it is likely that futuresnapshots of the data will produce similar results over our sample period.

Sell-Side School Ties 1417
are unable to correctly identify the analyst.15 For each analyst we collect thename of the academic institution attended for either an undergraduate or agraduate degree.16
Biographical information for senior company officers and board members isprovided by Boardex of Management Diagnostics Limited. The data containrelational links among board of directors and other corporate officials. Linksin the data set are constructed by cross-referencing employment history, edu-cational background, and professional qualifications. For each firm, we use thelink file to reconstruct the annual identity and educational background time se-ries for senior officers (defined as CEO, CFO, or Chairman) and board members.The final data contain current and past roles of company officials with startyear and end year, a board dummy, and the academic institution where the in-dividual received an undergraduate and/or graduate degree (where available).We hand match institutions from our analyst data and Boardex and create aunique numeric identifier.17
We hand collect data on a number of educational institution characteristics.We collect rankings from U.S. News and World Report between 1995 and 2006and match these rankings back to our sample. U.S. News and World Reportannually ranks the Top 100 universities in the United States. We also collectdata on the location and conference of all universities in our sample from theuniversities’ websites.
Finally, we match the firms associated with all company officials and sell-sideanalysts to accounting and stock return data from CRSP/COMPUSTAT. Ourfinal sample includes educational background data on 1,820 analysts issuinga total of 56,994 recommendations on 5,132 CRSP stocks between October 30,1993 and December 20, 2006.
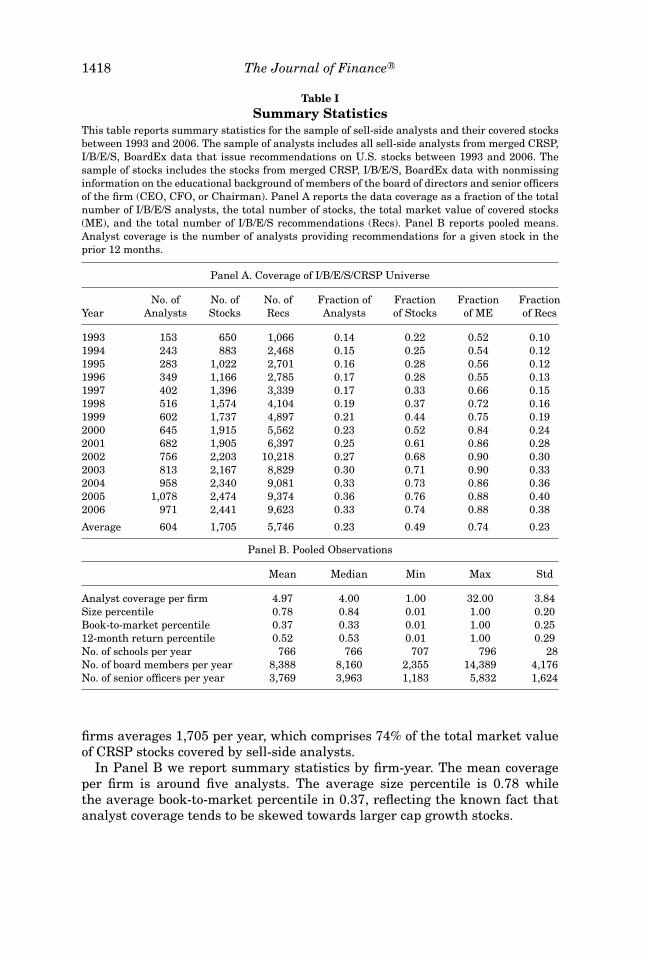
Table I reports summary statistics for the matched samples of firms-boards-analysts. Panel A shows that an average of 604 analysts issue 5,746 recom-mendations per year, which comprises 23% of the universe of sell-side analystsand 23% of the total number of recommendations per year.18 Our sample of
15 For example, if, according to I/B/E/S, a person named A. Summer covers technology stocksfor Goldman Sachs in 1999, but our Web searches uncover an Alan Summer and an Amy Summer,both of whom were analysts for Goldman Sachs covering technology stocks in 1999, we would notbe able to uniquely match this analyst.
16 One drawback of our data set is that graduation years are missing for 70% of the final samplesince most of the data are extracted from company releases or other public filings, which tend toomit graduation years. Information on degree type is also missing for about 35% of analysts. Wehave tried to collect these additional data items from each academic institution’s alumni networkbut have been unable to collect a large enough sample to date, since many universities restrictaccess to their alumni network and/or require written consent of the alumnus before releasing thisinformation.
17 See also Cohen et al. (2008) for additional details on data construction and matching usingthe BoardEx data.
18 Note that in unreported tests we have verified that the characteristics of our sample arevery similar to those of the entire database of I/B/E/S recommendations over this time period(e.g., in terms of the proportion of buys/sells, average calendar time portfolio returns of all buyrecommendations, etc.).
1418 The Journal of Finance R©
Table ISummary Statistics
This table reports summary statistics for the sample of sell-side analysts and their covered stocksbetween 1993 and 2006. The sample of analysts includes all sell-side analysts from merged CRSP,I/B/E/S, BoardEx data that issue recommendations on U.S. stocks between 1993 and 2006. Thesample of stocks includes the stocks from merged CRSP, I/B/E/S, BoardEx data with nonmissinginformation on the educational background of members of the board of directors and senior officersof the firm (CEO, CFO, or Chairman). Panel A reports the data coverage as a fraction of the totalnumber of I/B/E/S analysts, the total number of stocks, the total market value of covered stocks(ME), and the total number of I/B/E/S recommendations (Recs). Panel B reports pooled means.Analyst coverage is the number of analysts providing recommendations for a given stock in theprior 12 months.
Panel A. Coverage of I/B/E/S/CRSP Universe
No. of No. of No. of Fraction of Fraction Fraction FractionYear Analysts Stocks Recs Analysts of Stocks of ME of Recs
1993 153 650 1,066 0.14 0.22 0.52 0.101994 243 883 2,468 0.15 0.25 0.54 0.121995 283 1,022 2,701 0.16 0.28 0.56 0.121996 349 1,166 2,785 0.17 0.28 0.55 0.131997 402 1,396 3,339 0.17 0.33 0.66 0.151998 516 1,574 4,104 0.19 0.37 0.72 0.161999 602 1,737 4,897 0.21 0.44 0.75 0.192000 645 1,915 5,562 0.23 0.52 0.84 0.242001 682 1,905 6,397 0.25 0.61 0.86 0.282002 756 2,203 10,218 0.27 0.68 0.90 0.302003 813 2,167 8,829 0.30 0.71 0.90 0.332004 958 2,340 9,081 0.33 0.73 0.86 0.362005 1,078 2,474 9,374 0.36 0.76 0.88 0.402006 971 2,441 9,623 0.33 0.74 0.88 0.38
Average 604 1,705 5,746 0.23 0.49 0.74 0.23
Panel B. Pooled Observations
Mean Median Min Max Std
Analyst coverage per firm 4.97 4.00 1.00 32.00 3.84Size percentile 0.78 0.84 0.01 1.00 0.20Book-to-market percentile 0.37 0.33 0.01 1.00 0.2512-month return percentile 0.52 0.53 0.01 1.00 0.29No. of schools per year 766 766 707 796 28No. of board members per year 8,388 8,160 2,355 14,389 4,176No. of senior officers per year 3,769 3,963 1,183 5,832 1,624
firms averages 1,705 per year, which comprises 74% of the total market valueof CRSP stocks covered by sell-side analysts.
In Panel B we report summary statistics by firm-year. The mean coverageper firm is around five analysts. The average size percentile is 0.78 whilethe average book-to-market percentile in 0.37, reflecting the known fact thatanalyst coverage tends to be skewed towards larger cap growth stocks.
Sell-Side School Ties 1419
Table II reports summary statistics on our sample of school ties, broken downby academic institution. Panel A reports the average number of analyst ties tosenior corporate officials, while Panel B reports the average number of analystties to firm directors. Harvard University accounts for 18.53% of analyst ties tosenior officials in our sample, and 18.2% of analyst ties to corporate boards; IvyLeague schools in general account for 43.7% of analyst ties to senior officials,and 48.5% of analyst ties to corporate boards.19
Additional summary statistics on the percentage of linked stocks, the numberof linked stocks, and the number of stocks covered for different categories ofanalysts are reported in the Internet Appendix.20
III. Results: Returns to Sell-Side Recommendations
In this section we examine the stock return performance of recommendationsby sell-side analysts on securities to which they have school ties. We test thehypothesis that recommendations issued on stocks with school ties outperformrecommendations issued on stocks without ties.
To assess the relative performance of sell-side recommendations we use astandard calendar time portfolio approach.21 We classify a firm as having ed-ucational ties to an analyst if that analyst attended the same academic insti-tution as a senior officer (or, in alternate specifications, if the analyst attendedthe same school as a senior officer or a member of the board). We use theI/B/E/S numeric recommendation code to assign each recommendation to oneof two portfolios: (1) a BUY portfolio consisting of all stocks upgraded relativeto the previous recommendation or of stocks for which coverage is initiated, re-sumed, or reiterated with a buy or strong buy rating, and (2) a SELL portfolio,consisting of all stocks downgraded relative to the previous recommendation;stocks for which coverage is initiated, resumed or reiterated with a hold, sell, orstrong sell rating; or stocks that are dropped from coverage by the analyst. Wealso consider a version of both portfolios using only upgrades or downgrades.If the brokerage house does not report a stock as dropped from coverage and arecommendation is not revised or reiterated within 12 months, we let it expire.
Our portfolios are constructed as follows. For the BUY portfolio, we beginby identifying each BUY recommendation as described above. For each buyrecommendation, we skip a trading day between the recommendation date t andinvestment, and purchase the recommended stock at the close of day t + 1. Bywaiting a trading day we exclude the recommendation-date returns and ensurethat the portfolios are based on available information. Each recommended stockremains in the portfolio until it is downgraded or dropped from coverage, oruntil the underlying recommendation expires. Again, we skip a day betweenan event that causes a stock to be unloaded and the actual disinvestment:
19 Note that our results are not driven by a few particular schools (e.g., Ivy League), as we showlater in the paper.
20 The Internet Appendix can be found at http://www.afajof.org/supplements.asp.21 See also Barber, Lehavy, and Trueman (2005) and Barber et al. (2005).

1420 The Journal of Finance R©
Tab
leII
Lin
ks
bet
wee
nS
ell-
Sid
eA
nal
ysts
and
Fir
mM
anag
emen
tb
yA
cad
emic
Inst
itu
tion
Th
ista
ble
show
ssu
mm
ary
stat
isti
csof
the
ties
amon
gse
ll-s
ide
anal
ysts
and
U.S
.tra
ded
firm
sba
sed
oned
uca
tion
alba
ckgr
oun
dsbe
twee
n19
93an
d20
06.T
he
sam
ple
ofan
alys
tsin
clu
des
alls
ell-
side
anal
ysts
from
mer
ged
CR
SP,
I/B
/E/S
,an
dB
oard
Ex
data
that
issu
ere
com
men
dati
ons
onU
.S.s
tock
sbe
twee
n19
93an
d20
06.
Th
esa
mpl
eof
stoc
ksin
clu
des
the
stoc
ksfr
omm
erge
dC
RS
P,I/
B/E
/S,
and
Boa
rdE
xda
taw
ith
non
mis
sin
gin
form
atio
non
the
edu
cati
onal
back
grou
nd
ofm
embe
rsof
the
boar
dof
dire
ctor
san
dse
nio
rof
fice
rsof
the
firm
(CE
O,C
FO
,or
Ch
airm
an).
InP
anel
Aw
ecl
assi
fya
stoc
kas
hav
ing
aned
uca
tion
alti
eto
the
anal
yst
ifth
ean
alys
tat
ten
ded
the
sam
ein
stit
uti
onas
ase
nio
rof
fice
r(d
efin
edas
eith
erth
eC
EO
,CF
O,o
rC
hai
rman
ofth
ebo
ard)
.In
Pan
elB
we
clas
sify
ast
ock
ash
avin
gan
edu
cati
onal
tie
toth
ean
alys
tif
the
anal
yst
atte
nde
dth
esa
me
inst
itu
tion
asa
mem
ber
ofth
ebo
ard
ofdi
rect
ors.
Th
eta
ble
repo
rts
the
dist
ribu
tion
ofth
eto
tal
nu
mbe
rof
edu
cati
onal
lin
ksbe
twee
n19
93an
d20
06by
acad
emic
inst
itu
tion
.
Pan
elA
.An
alys
tT
ied
toF
irm
’sS
enio
rO
ffice
rsP
anel
B.A
nal
yst
Tie
dto
Boa
rdof
Dir
ecto
rs
Ran
kA
cade
mic
Inst
itu
tion
No.
ofT
ies
%of
Tota
lR
ank
Aca
dem
icIn
stit
uti
onN
o.of
Tie
s%
ofTo
tal
1H
arva
rdU
niv
ersi
ty94
118
.53
1H
arva
rdU
niv
ersi
ty2,
300
18.2
22
Un
iver
sity
ofP
enn
sylv
ania
522
10.2
82
Col
um
bia
Un
iver
sity
1,13
99.
023
New
York
Un
iver
sity
350
6.89
3U
niv
ersi
tyof
Pen
nsy
lvan
ia1,
065
8.44
4S
tan
ford
Un
iver
sity
311
6.12
4N
ewYo
rkU
niv
ersi
ty1,
006
7.97
5C
olu
mbi
aU
niv
ersi
ty28
85.
675
Yale
Un
iver
sity
717
5.68
6C
orn
ellU
niv
ersi
ty17
33.
416
Sta
nfo
rdU
niv
ersi
ty59
74.
737
M.I
.T.
168
3.31
7M
.I.T
.49
13.
898
Yale
Un
iver
sity
155
3.05
8C
orn
ellU
niv
ersi
ty43
73.
469
Un
iver
sity
ofC
hic
ago
140
2.76
9U
CB
erke
ley
347
2.75
10U
TA
ust
in13
72.
710
Un
iver
sity
ofC
hic
ago
317
2.51
Oth
ers
1,89
337
.28
Oth
ers
4,20
533
.32
Ivy
Lea
gue
2,22
043
.72
Ivy
Lea
gue
6,12
248
.51
All
5,07
810
0A
ll12
,621
100
Sell-Side School Ties 1421
for example, if a stock is downgraded at date t, we unwind the position at theclose of date t + 1. If more than one analyst recommends a particular stock ona given date, then the stock will appear multiple times in the portfolio, once foreach recommendation.
Finally, we compute value-weighted calendar time portfolios by averagingacross analysts, weighting individual recommendations by the analyst’s recom-mendation code. For the BUY portfolio, we reverse-score the recommendationcodes so that a Strong Buy is set equal to 5 (instead of 1, as it is in the raw data)and a Strong Sell is set equal to 1, so that a higher weight indicates a relativelymore bullish recommendation. We use the same method for the SELL portfo-lio, with the exception that in the final step we use the actual recommendationcodes as portfolio weights; that is, a Strong Buy is set equal to 1 and a StrongSell is set equal to 5, so that a higher weight indicates a relatively more bearishrecommendation.
This approach yields a time series of returns for each portfolio and has theadvantage of corresponding to a simple investment strategy of following sell-side recommendations, mimicking both the directional advice and the holdingperiod implied by the timing of the revisions.
For each stock, we compute risk-adjusted returns as in Daniel et al. (1997)(“DGTW”) by subtracting the return on a value-weighted portfolio of all CRSPfirms in the same size, (industry-adjusted) market-to-book ratio, and 1-yearmomentum quintile from the stock’s raw return. We update the 125 charac-teristic portfolios at the end of June of each year using conditional sorts, andadjust the market-to-book ratios using the 48-industry classifications from KenFrench’s website.22
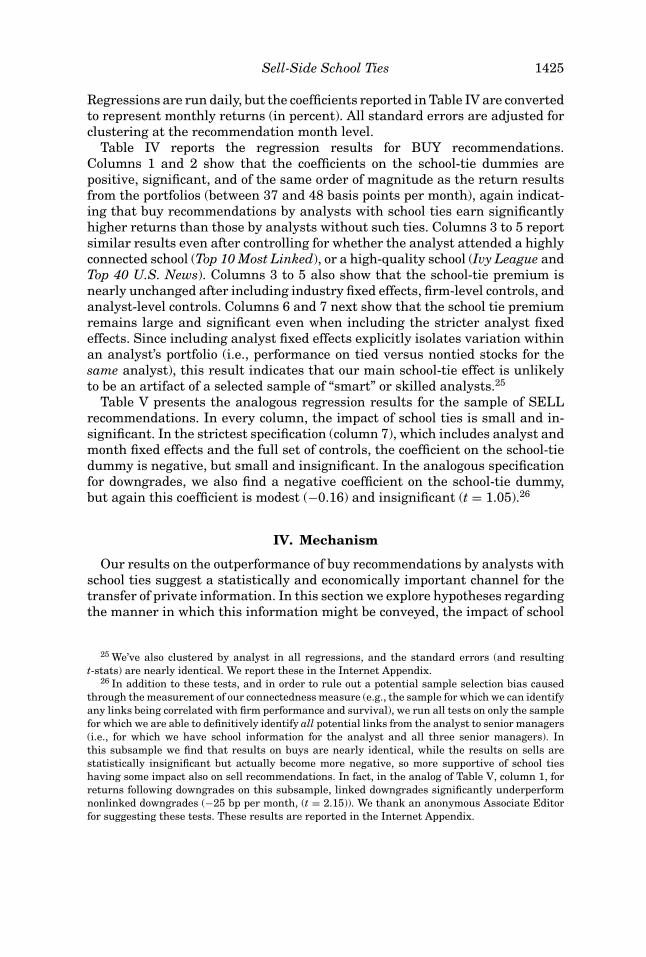
Table III, Panel A presents calendar time portfolio returns for our sampleof BUY recommendations, and illustrates one of our main results. BUY rec-ommendations with school ties earn 1.59% per month in raw returns, whileBUY recommendations without school ties earn 1.04%. A long–short portfoliothat purchases stocks after BUY recommendations by school-tied analysts andshorts stocks after BUY recommendations by non-school-tied analysts earns55 basis points per month (t = 3.75), which translates into an annual premiumof 6.60%. This long–short portfolio has the advantage that it conditions on thesignal of the recommendation (BUY in both cases), and thus isolates solely theschool-tie premium portion of the analysts’ recommendations. If we extendthe sample to examine ties between analysts to either senior management orthe board of directors, the return on this long–short portfolio is slightly smallerat 45 basis points per month, or 5.40% per year (t = 3.87). The risk-adjusted ab-normal returns are given in the third and fourth columns of Table III. The buyrecommendations on stocks without school ties earn basically a zero abnormalreturn. In contrast, the buy recommendations on stocks where the analyst hasschool ties precede large abnormal returns. Thus, the school-tie premium islargely unaffected by other return determinants (47 basis points, t = 3.96). Inlater tests we also show that this school-tie premium is not driven by analysts
22 http://mba.tuck.dartmouth.edu/pages/faculty/ken.french/data library.html
1422 The Journal of Finance R©
Tab
leII
IR
etu
rns
toS
choo
lT
ies,
1993
–200
6T
his
tabl
esh
ows
cale
nda
rti
me
port
foli
ore
turn
s.W
ecl
assi
fya
stoc
kas
hav
ing
aned
uca
tion
alti
eto
the
anal
yst
ifth
ean
alys
tat
ten
ded
the
sam
ein
stit
uti
onas
ase
nio
rof
fice
r(C
EO
,C
FO
,or
Ch
airm
an)
ora
boar
dm
embe
r.E
ach
reco
mm
enda
tion
isas
sign
edto
one
oftw
opo
rtfo
lios
:(1
)a
BU
Ypo
rtfo
lio
con
sist
ing
ofal
lst
ocks
upg
rade
dw
ith
resp
ect
toth
epr
evio
us
reco
mm
enda
tion
,or
for
wh
ich
cove
rage
isin
itia
ted,
resu
med
,or
reit
erat
edw
ith
abu
y(I
/B/E
/Sco
de=
2)or
stro
ng
buy
(I/B
/E/S
code
=1)
rati
ng,
and
(2)
aS
EL
Lpo
rtfo
lio,
con
sist
ing
ofal
lst
ocks
dow
ngr
aded
wit
hre
spec
tto
the
prev
iou
sre
com
men
dati
on,
for
wh
ich
cove
rage
isin
itia
ted,
resu
med
,or
reit
erat
edw
ith
ah
old
(I/B
/E/S
code
=3)
,se
ll(I
/B/E
/Sco
de=
4),
orst
ron
gse
ll(I
/B/E
/Sco
de=
5)ra
tin
g,or
that
are
drop
ped
from
cove
rage
.If
the
brok
erag
eh
ouse
does
not
repo
rtth
est
ock
asdr
oppe
dfr
omco
vera
gean
da
reco
mm
enda
tion
isn
otre
vise
dor
reit
erat
edw
ith
in12
mon
ths,
itis
con
side
red
expi
red.
We
skip
atr
adin
gda
ybe
twee
nre
com
men
dati
onan
din
vest
men
t(d
isin
vest
men
t).
For
the
BU
Ypo
rtfo
lio
each
reco
mm
ende
dst
ock
ish
eld
un
til
itis
dow
ngr
aded
ordr
oppe
dfr
omco
vera
ge,
oru
nti
lth
ere
com
men
dati
onex
pire
s.W
eco
mpu
teva
lue-
wei
ghte
dpo
rtfo
lios
byav
erag
ing
acro
ssan
alys
ts,w
eigh
tin
gin
divi
dual
reco
mm
enda
tion
sby
the
I/B
/E/S
reco
mm
enda
tion
code
;for
the
BU
Ypo
rtfo
lio,
we
reve
rse
thes
ere
com
men
dati
onco
des
soth
ata
stro
ng
buy
isse
tto
5an
da
stro
ng
sell
isse
tto
1.T
he
SE
LL
port
foli
ois
con
stru
cted
ina
sim
ilar
fash
ion
wit
hth
eex
cept
ion
that
the
orig
inal
I/B
/E/S
reco
mm
enda
tion
code
s(i
.e.,
stro
ng
sell
=5,
stro
ng
buy
=1)
are
use
das
the
port
foli
ow
eigh
ts.
We
repo
rtav
erag
ere
turn
san
dD
GT
W-a
dju
sted
retu
rns
for
the
peri
od19
93to
2006
.D
GT
Wch
arac
teri
stic
-ad
just
edre
turn
sar
ede
fin
edas
raw
retu
rns
min
us
the
retu
rns
ona
valu
e-w
eigh
ted
port
foli
oof
all
CR
SP
firm
sin
the
sam
esi
ze,(
indu
stry
-adj
ust
ed)
mar
ket-
to-b
ook,
and
1-ye
arm
omen
tum
quin
tile
.R
etu
rns
are
inm
onth
lype
rcen
t.L
/Sis
the
aver
age
retu
rnof
aze
roco
stpo
rtfo
lio
that
hol
dsth
epo
rtfo
lio
ofli
nke
dst
ocks
and
sell
ssh
ort
the
port
foli
oof
non
lin
ked
stoc
ks.t
-sta
tist
ics
are
show
nbe
low
the
esti
mat
es,a
nd
1%,5
%,a
nd
10%
stat
isti
cal
sign
ifica
nce
are
indi
cate
dw
ith
∗∗∗ ,
∗∗,a
nd
∗ ,re
spec
tive
ly.
Pan
elA
.Bu
yR
ecom
men
dati
ons
Bu
yR
ecom
men
dati
ons
(Lev
el)
On
lyU
pgra
des
Raw
Ret
urn
sA
bnor
mal
Ret
urn
sR
awR
etu
rns
Abn
orm
alR
etu
rns
No
shar
eded
uca
tion
alba
ckgr
oun
d1.
04∗∗
0.04
1.35
∗∗∗
0.31
∗∗∗
(1.9
7)(0
.43)
(2.8
1)(3
.14)
Lin
ked
reco
mm
enda
tion
sL
/SL
/SL
/SL
/SA
nal
yst
lin
ked
tose
nio
rm
anag
emen
t1.
59∗∗
∗0.
55∗∗
∗0.
51∗∗
∗0.
47∗∗
∗1.
65∗∗
∗0.
29∗
0.61
∗∗∗
0.30
∗(3
.04)
(3.7
5)(3
.19)
(3.9
6)(3
.16)
(1.7
1)(2
.86)
(1.9
3)
An
alys
tli
nke
dto
sen
ior
man
agem
ent
1.49
∗∗∗
0.45
∗∗∗
0.44
∗∗∗
0.40
∗∗∗
1.70
∗∗∗
0.35
∗∗∗
0.62
∗∗∗
0.31
∗∗or
boar
dof
dire
ctor
s(2
.91)
(3.8
7)(3
.24)
(4.6
3)(3
.35)
(2.3
2)(3
.49)
(2.3
0)
(con
tin
ued
)

Sell-Side School Ties 1423
Tab
leII
I—C
onti
nu
ed
Pan
elB
:Sel
lRec
omm
enda
tion
s
Sel
lRec
omm
enda
tion
s(L
evel
)O
nly
Dow
ngr
ades
Raw
Ret
urn
sA
bnor
mal
Ret
urn
sR
awR
etu
rns
Abn
orm
alR
etu
rns
No
shar
eded
uca
tion
alba
ckgr
oun
d1.
03∗
−0.1
71.
06∗
−0.2
1(1
.83)
−(1.
31)
(1.8
1)−(
1.45
)
Lin
ked
reco
mm
enda
tion
sL
/SL
/SL
/SL
/SA
nal
yst
lin
ked
tose
nio
rm
anag
emen
t1.
10∗∗
0.07
0.10
0.27
∗1.
26∗∗
0.20
0.25
0.46
∗(2
.05)
(0.4
6)(0
.61)
(1.9
2)(2
.20)
(0.8
5)(1
.01)
(1.9
4)A
nal
yst
lin
ked
tose
nio
rm
anag
emen
t1.
08∗∗
0.05
0.05
0.22
∗∗1.
09∗∗
0.03
0.05
0.26
∗or
boar
dof
dire
ctor
s(2
.08)
(0.4
9)(0
.37)
(2.2
6)(2
.05)
(0.2
2)(0
.34)
(1.8
2)

1424 The Journal of Finance R©
from the most connected schools or from a certain group of schools (e.g., IvyLeague).
The last two columns of Panel A report portfolio returns for the subset ofupgrades only (i.e., upgrades to buy or strong buy only, excluding initiationsand reiterations). The long–short portfolio of tied minus untied upgrades againearns large returns, ranging from 29 to 35 basis points per month over the fullsample period.
Panel B of Table III presents results for the sample of SELL recommenda-tions. Column 2 of Panel B indicates that we are unable to reject the hypothesisof no difference between the raw returns of sell recommendations by analystswith school ties and those without. The next two columns extend these find-ings to DGTW-adjusted returns. For the sample of analysts with links to eithersenior management or the board of directors, the returns on sell recommenda-tions by analysts with school ties are actually significantly higher than thoseby analysts without ties. However, as we will see below, when we explore thisresult more carefully in a regression context in order to control for other deter-minants of returns, we find that there is no difference between the abnormalreturns following linked and nonlinked sell recommendations.
Overall, our calendar time portfolio tests on the buy recommendations oflinked analysts reveal an economically and statistically significant channelthrough which analysts produce superior recommendations. Our results onsell recommendations suggest that either this information advantage does notextend to negative information, or that incentives not to reveal negative infor-mation are strong.
To ensure that our results are not driven by something specific about linkedanalysts or firms, we also employ panel regressions of the returns to buy/sellrecommendations on two school-tie dummy variables (one indicating a link tosenior management, and the other indicating a link to senior management ora member of the board), and a host of firm, broker, and analyst-level controlvariables. The dependent variable is daily returns (Ret). The control variablesinclude: a dummy equal to one if the analyst attended a Top 10 school in termsof number of links to firms; a dummy equal to one if the analyst attended anIvy League university; a dummy equal to one if the analyst attended a uni-versity ranked in the Top 40 by U.S. News and World Report; lagged markedcapitalization of the stock (Size); book-to-market (BM); past 1-year momen-tum (Past Returns); a measure of analyst experience, equal to the number ofyears an analyst has been making recommendations on I/B/E/S; an affiliationdummy, equal to one if the analyst is employed by a bank that has an un-derwriting relationship with the covered firm;23 an All-Star dummy variable,equal to one if the analyst is listed as an “All-Star” in the October issue ofInstitutional Investor in that year;24 a measure of brokerage size, equal to thetotal number of analysts that work for a given analyst’s brokerage house; andfixed effects for recommendation month, industry, and analyst where indicated.
23 The list of affiliated analysts is from Ljungqvist, Marston, and Wilhelm (2006).24 The list of “All-Star” analysts is from Ljungqvist, Marston, and Wilhelm (2009).
Sell-Side School Ties 1425
Regressions are run daily, but the coefficients reported in Table IV are convertedto represent monthly returns (in percent). All standard errors are adjusted forclustering at the recommendation month level.
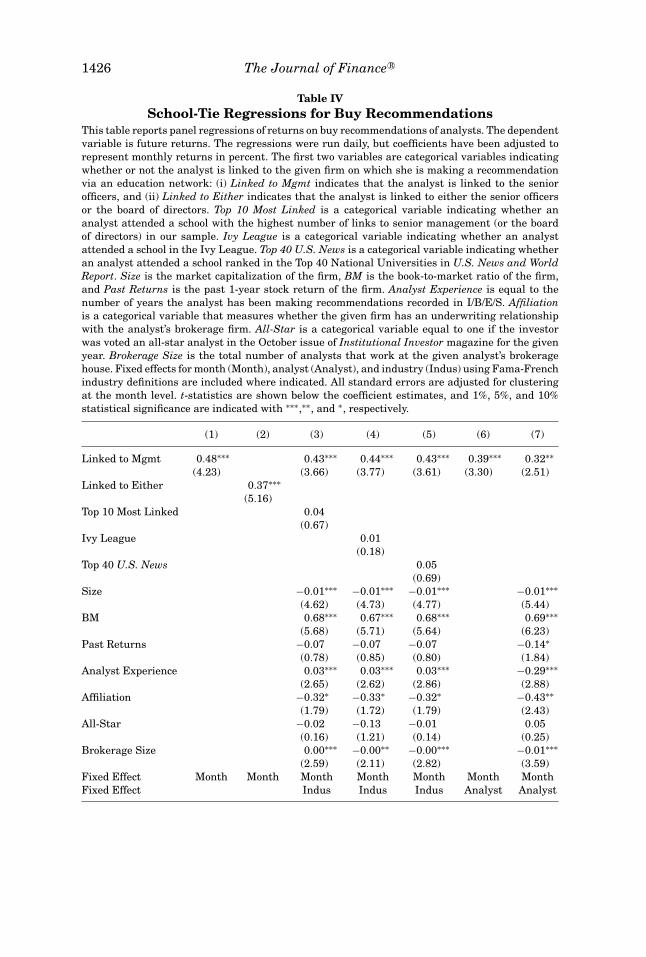
Table IV reports the regression results for BUY recommendations.Columns 1 and 2 show that the coefficients on the school-tie dummies arepositive, significant, and of the same order of magnitude as the return resultsfrom the portfolios (between 37 and 48 basis points per month), again indicat-ing that buy recommendations by analysts with school ties earn significantlyhigher returns than those by analysts without such ties. Columns 3 to 5 reportsimilar results even after controlling for whether the analyst attended a highlyconnected school (Top 10 Most Linked), or a high-quality school (Ivy League andTop 40 U.S. News). Columns 3 to 5 also show that the school-tie premium isnearly unchanged after including industry fixed effects, firm-level controls, andanalyst-level controls. Columns 6 and 7 next show that the school tie premiumremains large and significant even when including the stricter analyst fixedeffects. Since including analyst fixed effects explicitly isolates variation withinan analyst’s portfolio (i.e., performance on tied versus nontied stocks for thesame analyst), this result indicates that our main school-tie effect is unlikelyto be an artifact of a selected sample of “smart” or skilled analysts.25
Table V presents the analogous regression results for the sample of SELLrecommendations. In every column, the impact of school ties is small and in-significant. In the strictest specification (column 7), which includes analyst andmonth fixed effects and the full set of controls, the coefficient on the school-tiedummy is negative, but small and insignificant. In the analogous specificationfor downgrades, we also find a negative coefficient on the school-tie dummy,but again this coefficient is modest (−0.16) and insignificant (t = 1.05).26
IV. Mechanism
Our results on the outperformance of buy recommendations by analysts withschool ties suggest a statistically and economically important channel for thetransfer of private information. In this section we explore hypotheses regardingthe manner in which this information might be conveyed, the impact of school
25 We’ve also clustered by analyst in all regressions, and the standard errors (and resultingt-stats) are nearly identical. We report these in the Internet Appendix.
26 In addition to these tests, and in order to rule out a potential sample selection bias causedthrough the measurement of our connectedness measure (e.g., the sample for which we can identifyany links being correlated with firm performance and survival), we run all tests on only the samplefor which we are able to definitively identify all potential links from the analyst to senior managers(i.e., for which we have school information for the analyst and all three senior managers). Inthis subsample we find that results on buys are nearly identical, while the results on sells arestatistically insignificant but actually become more negative, so more supportive of school tieshaving some impact also on sell recommendations. In fact, in the analog of Table V, column 1, forreturns following downgrades on this subsample, linked downgrades significantly underperformnonlinked downgrades (−25 bp per month, (t = 2.15)). We thank an anonymous Associate Editorfor suggesting these tests. These results are reported in the Internet Appendix.
1426 The Journal of Finance R©
Table IVSchool-Tie Regressions for Buy Recommendations
This table reports panel regressions of returns on buy recommendations of analysts. The dependentvariable is future returns. The regressions were run daily, but coefficients have been adjusted torepresent monthly returns in percent. The first two variables are categorical variables indicatingwhether or not the analyst is linked to the given firm on which she is making a recommendationvia an education network: (i) Linked to Mgmt indicates that the analyst is linked to the seniorofficers, and (ii) Linked to Either indicates that the analyst is linked to either the senior officersor the board of directors. Top 10 Most Linked is a categorical variable indicating whether ananalyst attended a school with the highest number of links to senior management (or the boardof directors) in our sample. Ivy League is a categorical variable indicating whether an analystattended a school in the Ivy League. Top 40 U.S. News is a categorical variable indicating whetheran analyst attended a school ranked in the Top 40 National Universities in U.S. News and WorldReport. Size is the market capitalization of the firm, BM is the book-to-market ratio of the firm,and Past Returns is the past 1-year stock return of the firm. Analyst Experience is equal to thenumber of years the analyst has been making recommendations recorded in I/B/E/S. Affiliationis a categorical variable that measures whether the given firm has an underwriting relationshipwith the analyst’s brokerage firm. All-Star is a categorical variable equal to one if the investorwas voted an all-star analyst in the October issue of Institutional Investor magazine for the givenyear. Brokerage Size is the total number of analysts that work at the given analyst’s brokeragehouse. Fixed effects for month (Month), analyst (Analyst), and industry (Indus) using Fama-Frenchindustry definitions are included where indicated. All standard errors are adjusted for clusteringat the month level. t-statistics are shown below the coefficient estimates, and 1%, 5%, and 10%statistical significance are indicated with ∗∗∗,∗∗, and ∗, respectively.
(1) (2) (3) (4) (5) (6) (7)
Linked to Mgmt 0.48∗∗∗ 0.43∗∗∗ 0.44∗∗∗ 0.43∗∗∗ 0.39∗∗∗ 0.32∗∗(4.23) (3.66) (3.77) (3.61) (3.30) (2.51)
Linked to Either 0.37∗∗∗(5.16)
Top 10 Most Linked 0.04(0.67)
Ivy League 0.01(0.18)
Top 40 U.S. News 0.05(0.69)
Size −0.01∗∗∗ −0.01∗∗∗ −0.01∗∗∗ −0.01∗∗∗(4.62) (4.73) (4.77) (5.44)
BM 0.68∗∗∗ 0.67∗∗∗ 0.68∗∗∗ 0.69∗∗∗(5.68) (5.71) (5.64) (6.23)
Past Returns −0.07 −0.07 −0.07 −0.14∗(0.78) (0.85) (0.80) (1.84)
Analyst Experience 0.03∗∗∗ 0.03∗∗∗ 0.03∗∗∗ −0.29∗∗∗(2.65) (2.62) (2.86) (2.88)
Affiliation −0.32∗ −0.33∗ −0.32∗ −0.43∗∗(1.79) (1.72) (1.79) (2.43)
All-Star −0.02 −0.13 −0.01 0.05(0.16) (1.21) (0.14) (0.25)
Brokerage Size 0.00∗∗∗ −0.00∗∗ −0.00∗∗∗ −0.01∗∗∗(2.59) (2.11) (2.82) (3.59)
Fixed Effect Month Month Month Month Month Month MonthFixed Effect Indus Indus Indus Analyst Analyst

Sell-Side School Ties 1427
Table VSchool-Tie Regressions for Sell Recommendations
This table reports panel regressions of returns on sell recommendations of analysts. The dependentvariable is future returns. The regressions were run daily, but coefficients have been adjusted torepresent monthly returns in percent. All independent variables are defined as in Table IV. Fixedeffects for month (Month), analyst (Analyst), and industry (Indus) using Fama-French industrydefinitions are included where indicated. All standard errors are adjusted for clustering at themonth level. t-statistics are shown below the coefficient estimates, and 1%, 5%, and 10% statisticalsignificance are indicated with ∗∗∗,∗∗, and ∗, respectively.
(1) (2) (3) (4) (5) (6) (7)
Linked to Mgmt 0.02 0.04 0.04 0.05 −0.03 −0.06(0.25) (0.40) (0.34) (0.41) (0.34) (0.48)
Linked to Either 0.01(0.20)
Top 10 Most Linked 0.01(0.11)
Ivy League −0.01(0.08)
Top 40 U.S. News 0.02(0.27)
Size −0.01∗∗∗ −0.01∗∗∗ −0.01∗∗∗ −0.01∗∗∗(3.79) (3.82) (3.77) (4.66)
BM 0.45∗∗∗ 0.41∗∗∗ 0.45∗∗∗ 0.48∗∗∗(3.93) (3.40) (3.92) (4.45)
Past Returns −0.28∗∗ −0.35∗∗∗ −0.30∗∗ −0.37∗∗∗(2.24) (2.77) (2.41) (3.31)
Analyst Experience 0.02 0.02 0.02 −0.22∗(1.44) (1.52) (1.34) (1.69)
Affiliation −0.23 −0.36 −0.29 −0.27(0.76) (1.06) (0.95) (0.83)
All-Star −0.18 −0.11 −0.18 −0.10(1.65) (0.92) (1.55) (0.67)
Brokerage Size 0.00 0.00 0.00 0.00(0.86) (0.75) (0.94) (0.75)
Fixed Effect Month Month Month Month Month Month MonthFixed Effect Indus Indus Indus Analyst Analyst
ties on analyst status, and the types of information being transferred acrossthese networks.
A. Regulation on Selective Disclosure to Analysts
As noted above, our main test to distinguish between direct informationtransfer versus superior assessments of managerial quality as the driver of ourfindings is to split the sample into pre- and post-Reg FD periods. The pre-RegFD period was allegedly a time period plagued by problems stemming fromselective disclosure between firms and equity analysts, and hence Reg FD wasexpressly designed to curb this practice. The motivation expressed by the SEC

1428 The Journal of Finance R©
in its release27 on Regulation FD suggests that the school ties we identify inour tests are exactly the sort of private information channel between firms andanalysts that the regulation was designed to address. The fact that our resultsare significantly weaker in the post-Reg FD period suggests that the regulationwas effective in curbing the information advantage that analysts apparentlygained through their school networks.
To test this idea more formally, we employ panel regressions on buy rec-ommendations as in Table IV, except that we now also include a Post-RegFD dummy variable, and an interaction term (Link Mgmt∗Post-Reg FD), inaddition to the school-tie dummy variable and control variables mentionedearlier. Column 2 of Table VI presents the key test of the impact of Reg FDon the school-tie return premium. The coefficient on Link Mgmt measuresthe impact of school ties in the pre-Reg FD period. Its magnitude of 0.72(t = 3.61) implies an annual return premium of 8.64% per year. The interac-tion term (Link Mgmt∗Post-Reg FD) is designed to capture the effect of schoolties in the post-Reg FD period.28 We find that the coefficient on the interac-tion term is strongly negative and significant, while the combined effect (i.e.,[Link Mgmt∗Post-Reg]+[Linked to Mgmt]) is small (9bp = −63bp + 72bp) andinsignificant (F-statistic of 0.46, p > 0.50), indicating that the school-tie pre-mium is largely absent in the post-Reg FD period. Column 3 reports resultsfrom the same test, but only for the subset of analysts that are in the sam-ple both pre- and post-Reg FD. This tests controls for the possibility that, forsome reason, connected analysts may leave the sample post-Reg FD. Fromcolumn 3, the results are virtually identical for this sample of analysts.29
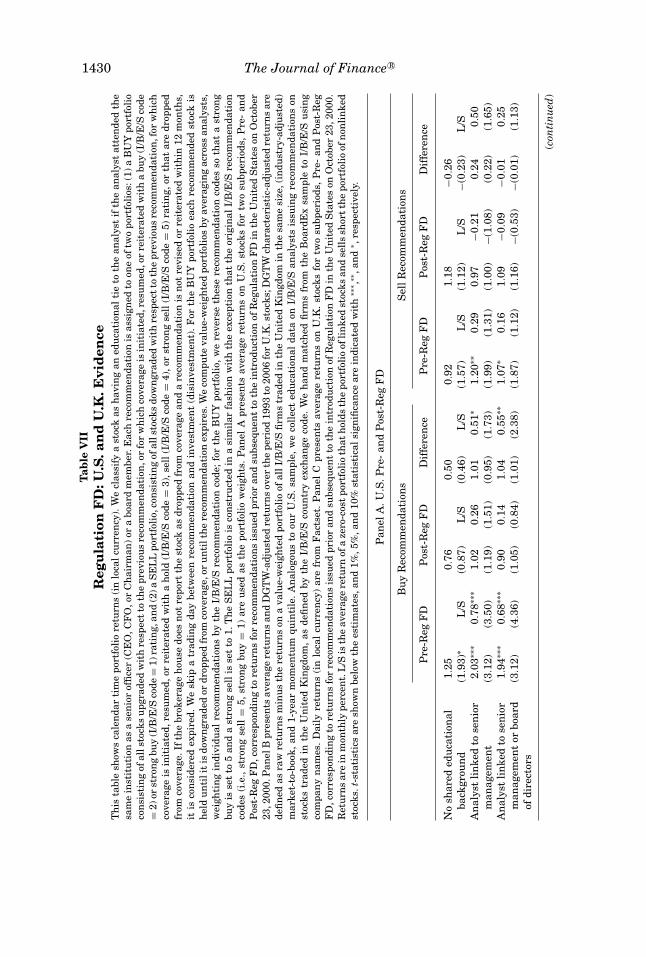
We also report calendar time portfolio results for the pre- and post-Reg FDtime periods in Panel A of Table VII. Panel A indicates that the large returns toschool ties for buy recommendations are concentrated in the pre-Reg FD period.Specifically, the school-tie premium in the pre-Reg FD period ranges between 68to 78 basis points per month, or 8.16% (t = 4.35) to 9.36% (t = 3.50) per year.30
Post-Regulation FD, this difference is only 14 to 26 basis points per month,and is statistically indistinguishable from zero. Panel A also reports results forsell recommendations, splitting the sample in the same way; not surprisingly,given our earlier results on sells, we find no significant differences between thetwo periods for sell recommendations.
Next, we construct an out-of-sample test of the impact of Reg FD by repli-cating our results in the United Kingdom, where there was no such regulation
27 Selective Disclosure and Insider Trading, SEC Release Nos. 33–7881, 34–43154, IC-24599,65 Fed. Reg. 51716 (Aug. 24, 2000).
28 We exclude month fixed effects in these regressions because the model cannot be estimatedwith a post-Reg FD dummy and month fixed effects jointly (as they are collinear).
29 We have also run these regressions using a firm fixed effect, and a firm-by-time period (pre-vs. post-Reg FD) fixed effect. After doing so, the school-tie premium remains virtually unchanged,suggesting that this result is not driven by any special characteristics of linked versus nonlinkedstocks, nor by a characteristic of the linked stocks that changed in the pre- and post-Reg FD timeperiods.
30 See the Internet Appendix for additional specifications using abnormal returns, upgrades,etc. The results are very similar to those reported here.

Sell-Side School Ties 1429
Table VIRegulation FD and Strength of Links
This table reports panel regressions of returns on buy recommendations of analysts. The dependentvariable is future returns. The regressions were run daily, but coefficients have been adjusted torepresent monthly returns (abnormal returns) in percent. Linked to Mgmt is defined as in Table III.Post-Reg FD is a categorical variable equal to one for all recommendations made after RegulationFD came into effect (Oct 23, 2000), and zero for all recommendations made before. Link Mgmt∗PostReg-FD is the interaction term between Linked to Mgmt and Post-Reg FD. Frac Link to Analyst isthe fraction of the board of directors that is linked to the analyst. Linked by Conf indicates whetherthe analyst attended a school competing in the same athletic conference as that of a senior manager.All other independent variables are defined as in Table IV. Column 3 (Sub) includes only the subsetof analysts that are in the sample both pre- and post-Reg FD. Fixed effects for month (Month),analyst (Analyst), and industry (Indus) using Fama-French industry definitions are included whereindicated. All standard errors are adjusted for clustering at the month level. t-statistics are shownbelow the coefficient estimates, and 1%, 5%, and 10% statistical significance are indicated with∗∗∗,∗∗, and ∗, respectively.
(1) (2) (3) (4) (5) (6) (7)Full Full Sub Full Full Full Full
Linked to Mgmt 0.79∗∗∗ 0.72∗∗∗ 0.88∗∗∗ 0.31∗∗∗ 0.31∗∗∗(4.31) (3.61) (3.88) (2.68) (2.59)
Link Mgmt∗ −0.58∗∗ −0.63∗∗ −0.91∗∗∗Post-Reg FD (2.51) (2.53) (3.03)
Frac Link to Analyst 0.69∗∗∗ 0.57∗∗(2.62) (2.07)
Linked to Either 0.19∗∗(2.43)
Linked by Conf 0.22∗∗∗ 0.15∗∗(2.59) (1.98)
Post-Reg FD −0.97∗∗∗ −1.78∗∗∗ −1.82∗∗∗(3.68) (3.43) (3.56)
Top 10 0.03 0.02 0.02(0.43) (0.31) (0.27)
Size −0.01∗∗∗ −0.01∗∗∗ −0.01∗∗∗ −0.01∗∗∗ −0.01∗∗∗ −0.01∗∗∗(5.24) (6.55) (5.89) (5.39) (5.47) (5.26)
Bm 0.62∗∗∗ 0.67∗∗∗ 0.79∗∗∗ 0.70∗∗∗ 0.70∗∗∗ 0.56∗∗∗(4.61) (5.58) (5.91) (6.24) (6.24) (4.35)
Past returns −0.19∗ −0.27∗∗∗ −0.24∗∗∗ −0.14∗ −0.14∗ −0.06(1.94) (3.54) (3.01) (1.83) (1.83) (0.62)
Analyst Experience 0.03∗∗ 0.16∗∗∗ 0.17∗∗∗ −0.29∗∗∗ −0.29∗∗∗ 0.03∗∗∗(2.16) (2.74) (3.03) (2.85) (2.85) (2.75)
Affiliation −0.83∗∗∗ −0.83∗∗∗ −0.80∗∗∗ −0.42∗∗ −0.42∗∗ −0.31∗(3.73) (4.31) (3.54) (2.40) (2.40) (1.72)
All-Star −0.04 0.17 0.17 0.05 0.05 −0.07(0.31) (0.78) (0.74) (0.25) (0.24) (0.71)
Brokerage Size −0.00∗∗ −0.01∗∗∗ −0.01∗∗∗ −0.01∗∗∗ −0.01∗∗∗ −0.00∗∗∗(2.30) (4.04) (4.17) (3.61) (3.62) (2.96)
Fixed Effect Indus Analyst Analyst Analyst Analyst Month MonthFixed Effect Indus Indus Month Month
1430 The Journal of Finance R©
Tab
leV
IIR
egu
lati
onF
D:U
.S.a
nd
U.K
.Evi
den
ceT
his
tabl
esh
ows
cale
nda
rti
me
port
foli
ore
turn
s(i
nlo
cal
curr
ency
).W
ecl
assi
fya
stoc
kas
hav
ing
aned
uca
tion
alti
eto
the
anal
yst
ifth
ean
alys
tat
ten
ded
the
sam
ein
stit
uti
onas
ase
nio
rof
fice
r(C
EO
,CF
O,o
rC
hai
rman
)or
abo
ard
mem
ber.
Eac
hre
com
men
dati
onis
assi
gned
toon
eof
two
port
foli
os:(
1)a
BU
Ypo
rtfo
lio
con
sist
ing
ofal
lsto
cks
upg
rade
dw
ith
resp
ect
toth
epr
evio
us
reco
mm
enda
tion
,or
for
wh
ich
cove
rage
isin
itia
ted,
resu
med
,or
reit
erat
edw
ith
abu
y(I
/B/E
/Sco
de=
2)or
stro
ng
buy
(I/B
/E/S
code
=1)
rati
ng,
and
(2)a
SE
LL
port
foli
o,co
nsi
stin
gof
alls
tock
sdo
wn
grad
edw
ith
resp
ect
toth
epr
evio
us
reco
mm
enda
tion
,for
wh
ich
cove
rage
isin
itia
ted,
resu
med
,or
reit
erat
edw
ith
ah
old
(I/B
/E/S
code
=3)
,sel
l(I
/B/E
/Sco
de=
4),o
rst
ron
gse
ll(I
/B/E
/Sco
de=
5)ra
tin
g,or
that
are
drop
ped
from
cove
rage
.If
the
brok
erag
eh
ouse
does
not
repo
rtth
est
ock
asdr
oppe
dfr
omco
vera
gean
da
reco
mm
enda
tion
isn
otre
vise
dor
reit
erat
edw
ith
in12
mon
ths,
itis
con
side
red
expi
red.
We
skip
atr
adin
gda
ybe
twee
nre
com
men
dati
onan
din
vest
men
t(d
isin
vest
men
t).
For
the
BU
Ypo
rtfo
lio
each
reco
mm
ende
dst
ock
ish
eld
un
tili
tis
dow
ngr
aded
ordr
oppe
dfr
omco
vera
ge,o
ru
nti
lth
ere
com
men
dati
onex
pire
s.W
eco
mpu
teva
lue-
wei
ghte
dpo
rtfo
lios
byav
erag
ing
acro
ssan
alys
ts,
wei
ghti
ng
indi
vidu
alre
com
men
dati
ons
byth
eI/
B/E
/Sre
com
men
dati
onco
de;
for
the
BU
Ypo
rtfo
lio,
we
reve
rse
thes
ere
com
men
dati
onco
des
soth
ata
stro
ng
buy
isse
tto
5an
da
stro
ng
sell
isse
tto
1.T
he
SE
LL
port
foli
ois
con
stru
cted
ina
sim
ilar
fash
ion
wit
hth
eex
cept
ion
that
the
orig
inal
I/B
/E/S
reco
mm
enda
tion
code
s(i
.e.,
stro
ng
sell
=5,
stro
ng
buy
=1)
are
use
das
the
port
foli
ow
eigh
ts.
Pan
elA
pres
ents
aver
age
retu
rns
onU
.S.
stoc
ksfo
rtw
osu
bper
iods
,P
re-
and
Pos
t-R
egF
D,c
orre
spon
din
gto
retu
rns
for
reco
mm
enda
tion
sis
sued
prio
ran
dsu
bseq
uen
tto
the
intr
odu
ctio
nof
Reg
ula
tion
FD
inth
eU
nit
edS
tate
son
Oct
ober
23,2
000.
Pan
elB
pres
ents
aver
age
retu
rns
and
DG
TW
-adj
ust
edre
turn
sov
erth
epe
riod
1993
to20
06fo
rU
.K.s
tock
s;D
GT
Wch
arac
teri
stic
-adj
ust
edre
turn
sar
ede
fin
edas
raw
retu
rns
min
us
the
retu
rns
ona
valu
e-w
eigh
ted
port
foli
oof
allI
/B/E
/Sfi
rms
trad
edin
the
Un
ited
Kin
gdom
inth
esa
me
size
,(in
dust
ry-a
dju
sted
)m
arke
t-to
-boo
k,an
d1-
year
mom
entu
mqu
inti
le.
An
alog
ous
toou
rU
.S.
sam
ple,
we
coll
ect
edu
cati
onal
data
onI/
B/E
/San
alys
tsis
suin
gre
com
men
dati
ons
onst
ocks
trad
edin
the
Un
ited
Kin
gdom
,as
defi
ned
byth
eI/
B/E
/Sco
un
try
exch
ange
code
.W
eh
and
mat
ched
firm
sfr
omth
eB
oard
Ex
sam
ple
toI/
B/E
/Su
sin
gco
mpa
ny
nam
es.
Dai
lyre
turn
s(i
nlo
cal
curr
ency
)ar
efr
omF
acts
et.
Pan
elC
pres
ents
aver
age
retu
rns
onU
.K.
stoc
ksfo
rtw
osu
bper
iods
,P
re-
and
Pos
t-R
egF
D,c
orre
spon
din
gto
retu
rns
for
reco
mm
enda
tion
sis
sued
prio
ran
dsu
bseq
uen
tto
the
intr
odu
ctio
nof
Reg
ula
tion
FD
inth
eU
nit
edS
tate
son
Oct
ober
23,2
000.
Ret
urn
sar
ein
mon
thly
perc
ent.
L/S
isth
eav
erag
ere
turn
ofa
zero
-cos
tpo
rtfo
lio
that
hol
dsth
epo
rtfo
lio
ofli
nke
dst
ocks
and
sell
ssh
ort
the
port
foli
oof
non
lin
ked
stoc
ks.t
-sta
tist
ics
are
show
nbe
low
the
esti
mat
es,a
nd
1%,5
%,a
nd
10%
stat
isti
cals
ign
ifica
nce
are
indi
cate
dw
ith
∗∗∗ ,
∗∗,a
nd
∗ ,re
spec
tive
ly.
Pan
elA
.U.S
.Pre
-an
dP
ost-
Reg
FD
Bu
yR
ecom
men
dati
ons
Sel
lRec
omm
enda
tion
s
Pre
-Reg
FD
Pos
t-R
egF
DD
iffe
ren
ceP
re-R
egF
DP
ost-
Reg
FD
Dif
fere
nce
No
shar
eded
uca
tion
al1.
250.
760.
500.
921.
18−0
.26
back
grou
nd
(1.9
3)∗
L/S
(0.8
7)L
/S(0
.46)
L/S
(1.5
7)L
/S(1
.12)
L/S
−(0.
23)
L/S
An
alys
tli
nke
dto
sen
ior
2.03
∗∗∗
0.78
∗∗∗
1.02
0.26
1.01
0.51
∗1.
20∗∗
0.29
0.97
−0.2
10.
240.
50m
anag
emen
t(3
.12)
(3.5
0)(1
.19)
(1.5
1)(0
.95)
(1.7
3)(1
.99)
(1.3
1)(1
.00)
−(1.
08)
(0.2
2)(1
.65)
An
alys
tli
nke
dto
sen
ior
1.94
∗∗∗
0.68
∗∗∗
0.90
0.14
1.04
0.55
∗∗1.
07∗
0.16
1.09
−0.0
9−0
.01
0.25
man
agem
ent
orbo
ard
(3.1
2)(4
.36)
(1.0
5)(0
.84)
(1.0
1)(2
.38)
(1.8
7)(1
.12)
(1.1
6)−(
0.53
)−(
0.01
)(1
.13)
ofdi
rect
ors
(con
tin
ued
)

Sell-Side School Ties 1431
Tab
leV
II—
Con
tin
ued
Pan
elB
.U.K
.Sam
ple,
1993
–200
6
Bu
yR
ecom
men
dati
ons
Sel
lRec
omm
enda
tion
s
Raw
Ret
urn
sA
bnor
mal
Ret
urn
sR
awR
etu
rns
Abn
orm
alR
etu
rns
No
shar
eded
uca
tion
al0.
71−0
.13
0.45
−0.2
4ba
ckgr
oun
d(1
.41)
L/S
(0.5
1)L
/S(0
.78)
L/S
(0.9
1)L
/SA
nal
yst
lin
ked
tose
nio
r2.
58∗∗
∗1.
87∗∗
∗1.
54∗∗
1.67
∗∗−0
.34
−0.7
90.
020.
26m
anag
emen
t(3
.11)
(2.7
9)(2
.09)
(2.2
0)(0
.39)
(1.0
6)(0
.04)
(0.4
6)
Pan
elC
.U.K
.Pre
-an
dP
ost-
Reg
FD
Bu
yR
ecom
men
dati
ons
Sel
lRec
omm
enda
tion
s
Pre
-Reg
FD
Pos
t-R
egF
DD
iffe
ren
ceP
re-R
egF
DP
ost-
Reg
FD
Dif
fere
nce
No
shar
eded
uca
tion
al0.
540.
91−0
.37
0.38
0.57
−0.1
9ba
ckgr
oun
d(0
.71)
L/S
(1.4
7)L
/S−(
0.36
)L
/S(0
.47)
L/S
(0.8
0)L
/S(0
.16)
L/S
An
alys
tli
nke
dto
sen
ior
2.32
∗∗1.
78∗∗
2.90
∗∗1.
99∗
−0.5
8−0
.21
−0.4
8−0
.86
−0.0
8−0
.65
−0.4
1−0
.21
man
agem
ent
(1.9
8)(2
.11)
(2.4
8)(1
.82)
(0.3
4)(0
.15)
(0.5
2)(1
.18)
(0.0
4)(0
.40)
(0.2
3)(0
.14)

1432 The Journal of Finance R©
enacted during our sample period. Again we form buy-sell portfolios of linkedand nonlinked recommendations, but we now restrict our analysis to U.K.-listed stocks for which we have analyst recommendations on I/B/E/S and avail-able educational background information on both the analyst and the seniorofficers of the firm.31 Panel B of Table VII shows that over the entire sampleperiod, we again find a large school-tie return premium on buy recommenda-tions for U.K.-listed stocks: a long–short portfolio that purchases linked buyrecommendations and shorts nonlinked buy recommendations earns 187 basispoints per month (t = 2.79) in raw returns, and 167 basis points per month(t = 2.20) in abnormal returns. Again, we find no significant school-tie pre-mium on sell recommendations. However, unlike in the United States, we seeno significant difference in the school-tie premium on buy recommendationsbetween the pre- and post-Reg FD time periods.32 The point estimates of theschool-tie premium are actually slightly higher (although not significantly) inthe post-Reg FD period. This evidence supports the view that the Reg FD effectthat we find in the main (U.S.) sample is in fact driven completely by this newregulation against selective disclosure. In the absence of the regulatory change,school ties continue to confer significant benefits to analysts.
In summary, all of our findings indicate that Reg FD had a large impacton the school-tie premium that we identify in this paper, suggesting that themost likely mechanism driving the superior performance of analysts on theirschool-tied recommendations is direct information transfer.33
Our results on the impact of Reg FD are also consistent with several recentpapers that examine the impact of the regulation on the behavior of equity ana-lysts and conclude that the law has in fact been effective in curtailing selectivedisclosure to analysts (see, for example, Mohanram and Sunder (2006), Agrawalet al. (2006), and Gintschel and Markov (2004)). For example, Mohanram andSunder (2006) find that analysts who may have had preferential links withthe firms they covered, such as analysts from large brokerage houses, tendedto have greater forecast accuracy pre-Reg FD, but were unable to maintaintheir forecasting superiority post-Reg FD. Coupled with our findings, these
31 Analogous to our U.S. sample, we collect educational data on I/B/E/S analysts issuing recom-mendations on stocks traded in the United Kingdom, as defined by the I/B/E/S country exchangecode. We hand match firms from the Boardex sample to I/B/E/S using company names. Daily re-turns (in local currency) are from Factset. Market equity and book equity are from CompustatGlobal. Note that the coverage of our sample is sparse for non-U.S. data: by requiring educationalinformation on I/B/E/S analysts covering U.K. stocks, we limit our sample to an average of 26analysts, 69 stocks, and 131 recommendations per year over the 1993 to 2006 time period.
32 For brevity we only report results for links to senior management, and for raw returns (inPanel C). Results are very similar for the full set of specifications used earlier.
33 Note that Cohen et al. (2008) do not find a large impact of Reg FD on the return premium thatmutual fund managers earn on their school-connected stocks relative to their nonconnected stocks.This could be due to a different mechanism at work in the case of mutual fund managers. Thisresult could also be due to the fact that equity analysts were under intense scrutiny during thistime period, not only as a result of Reg FD, but also due to alleged conflicts of interest that led toseveral new policy measures being enacted by the SEC, NASD, and NYSE, and which culminatedin the Global Settlement of 2003.

Sell-Side School Ties 1433
results suggest that Reg FD has been successful in leveling the informationplaying field for sell-side research, and likely signals a shift towards greaterindependence from senior management on the part of financial analysts.
B. Strength of School Ties, All-Star Value, and Robustness Checks
In this section we explore additional implications of our results. First, ifschool ties are driving the results we find, then stronger ties should increasethe strength of the school-tie premium for these analysts. Columns 4 and 5 inTable VI test this using a variable (Frac Link to Analyst) equal to the percentageof top firm management (board members + senior management) to whom theanalyst has a link. From Table VI, this proxy for the strength of the school-tielink is positively and significantly related to the school-tie premium. This holdseven after controlling for the effect of having school ties in general (column 5).The coefficient in column 5 implies that a one–standard deviation increase inthe strength of school ties to management increases the school-tie premium bynearly 1% per year.
In addition to this link-strength measure, we also create a new measure ofsocial ties. If social networks are an important source of information advantagefor analysts, then other types of social networks may provide the same advan-tage. We attempt to show one alternative measure in Table VI. The measure weuse is common athletic conference (for example, Big 10). Attending the sameathletic conference could be an impetus for information sharing (or could re-duce the cost of information gathering) in much the same way as school alumnirelationships. We thus create the categorical variable Linked by Conf , which isequal to one if the analyst attended a school that competes in the same athleticconference as a senior manager’s school, and zero otherwise. From columns 6and 7, we find that in addition to having an alumni connection, an athleticconference connection affords analysts a significant advantage in collecting in-formation on the firm.34 Specifically, from column 7, including all controls, theanalyst’s recommendations on conference-linked stocks outperform by 15 bpper month (t = 1.98), nearly half the magnitude of the alumni result, but stillsignificant.35
Another way to quantify the value of the social networks that we isolate inthis paper is to test the extent to which school ties predict the probability of theanalyst becoming an All-Star. We run OLS and probit regressions forecastingAll-Star status and find that the number of school ties is a strong positive pre-dictor of the likelihood of being an All-Star. A one–standard deviation increasein the number of connections increases the probability of being an All-Star bynearly 50% (from 9.2% to 13.6%). These results are reported in the InternetAppendix.
34 Note that in both specifications we include Linked to Mgmt to orthogonalize against thoseinstances in which the analyst and senior manager attended the same school.
35 We also find similar effects using common state of school attended (e.g., Iowa and Iowa State),although a bit weaker.

1434 The Journal of Finance R©
To better understand the type of information being transferred across thenetworks, we also examine the relative forecast accuracy of analysts withschool ties. Specifically, we test the hypothesis that the information advan-tage gained by linked analysts is related to information that would allow ananalyst to better predict earnings per share numbers reported by firms. We findno significant differences in relative forecast accuracy (or relative forecast op-timism) between the forecasts of analysts with school ties and those without.36
These results suggest that the school-tie return premium that we document inSection III is unlikely to relate to information obtained about future earningsper share numbers. We also look at the propensity of buys among school-tiedand nontied firms that later announce a merger, as well as merger-related newsreturn decompositions, and find little difference, suggesting that the passingof merger-related information is unlikely to fully explain our findings.
Finally, we run a number of robustness checks on our results. These includesplitting our sample by a series of stock, analyst, and school characteristics.We report these results in the Internet Appendix.
V. Conclusion
In this paper we investigate information dissemination in security markets.We use the recommendations of sell-side equity analysts as a laboratory tostudy the impact of social networks on agents’ ability to gather superior in-formation about firms. In particular, we test the hypothesis that school tiesbetween analysts and senior corporate officers impart comparative informa-tion advantages in the production of analyst research. Our main result is thatequity analysts outperform on their stock recommendations when they havean educational link to that company. A simple portfolio strategy of going longthe buy recommendations of analysts with school ties and going short the buyrecommendations of analysts without ties earns returns of 6.60% per year inthe full sample.
This result suggests that analysts’ social networks facilitate the direct trans-fer of information, or alternatively that these networks simply allow analyststo better assess managerial quality. To distinguish between these two hypothe-ses, we exploit a regulation introduced during our sample period that explicitlyaimed to block the mechanism of selective information transfer: RegulationFD, instated by the SEC in October of 2000. We find a large effect of the regula-tion: pre-Reg FD the return premium from school ties is 9.36% per year, whilepost-Reg FD the return premium is nearly zero and insignificant. A similar testin the United Kingdom, which did not experience a change in the disclosure
36 Following Malloy (2005) and Clement (1999) and using 1- and 2-year-ahead earnings forecastsdrawn from the I/B/E/S Detail File, we run Fama-MacBeth cross-sectional regressions of demeanedabsolute forecast error (DAFE), proportional mean absolute forecast error (PMAFE), and relativeoptimism (OPT) on a variety of analyst characteristics plus a dummy variable equal to one if theanalyst is linked to the board of directors or a senior officer of the firm being covered. Althoughthe sign on the dummy variables in the DAFE and PMAFE regressions is consistently negative(indicating that linked analysts are more accurate), the coefficients are generally insignificant.

Sell-Side School Ties 1435
environment during this sample period, reveals a large and significant school-tie premium for buy recommendations over the entire sample period, both pre-and post-2000.
Taken together, our findings suggest that agents in financial markets cangain an informational advantage through their social networks. In addition,legislation designed to block selective disclosure can be effective in curbingthis practice. The magnitude of our results indicates that informal informa-tion networks are an important, yet underemphasized, channel through whichprivate information gets incorporated into prices. Identifying the types of in-formation transferred across social networks and the extent to which socialnetworks are important in other information environments can provide usa richer understanding of information flow and price evolution in securitymarkets.
REFERENCESAgrawal, Anup, Sahiba Chadha, and Mark A. Chen, 2006, Who is afraid of Reg FD? The behavior
and performance of sell-side analysts following the SEC’s Fair Disclosure Rules, Journal ofBusiness 79, 2811–2834.
Barber, Brad, Reuven Lehavy, Maureen McNichols, and Brett Trueman, 2001, Can investors profitfrom the prophets? Security analyst recommendations and stock returns, Journal of Finance56, 531–564.
Barber, Brad, Reuven Lehavy, Maureen McNichols, and Brett Trueman, 2003, Reassessing thereturns to analysts’ stock recommendations, Financial Analysts Journal 59, 88–96.
Barber, Brad, Reuven Lehavy, Maureen McNichols, and Brett Trueman, 2005, Buys, holds, andsells: The distribution of investment banks’ stock ratings and the implications for the prof-itability of analysts’ recommendations, Journal of Accounting and Economics 41, 87–117.
Barber, Brad, Reuven Lehavy, and Brett Trueman, 2005, Comparing the stock recommendationperformance of investment banks and independent research firms, Journal of Financial Eco-nomics 85, 490–517.
Butler, Alexander W., and Umit G. Gurun, 2008, Connected companies’ compensation, Workingpaper, University of Texas at Dallas.
Chevalier, Judith, and Glenn Ellison, 1999, Career concerns of mutual fund managers, QuarterlyJournal of Economics 114, 389–432.
Clement, Michael B., 1999, Analyst forecast accuracy: Do ability, resources, and portfolio complex-ity matter? Journal of Accounting and Economics 27, 285–303.
Cohen, Lauren, Andrea Frazzini, and Christopher J. Malloy, 2008, The small world of invest-ing: Board connections and mutual fund returns, Journal of Political Economy 116, 951–979.
Conyon, Martin J., and Mark R. Muldoon, 2006, The small world of corporate boards, Journal ofBusiness Finance and Accounting 33, 1321–1343.
Daniel, Kent, Mark Grinblatt, Sheridan Titman, and Russ Wermers, 1997, Measuring mutual fundperformance with characteristic-based benchmarks, Journal of Finance 52, 1035–1058.
Davis, Gerald F., 1991, Agents without principles? The spread of the poison pill through the inter-corporate network, Administrative Science Quarterly 36, 583–613.
Faccio, Mara, 2006, Politically connected firms, American Economic Review 96, 369–386.Fisman, David, Ray Fisman, Julia Galef, and Rakesh Khurana, 2006, Estimating the value of
connections to Vice-President Cheney, Working paper, Columbia University.Gintschel, Andreas, and Stanimir Markov, 2004, The effectiveness of Regulation FD, Journal of
Accounting and Economics 37, 293–314.Gleason, Cristi A., and Charles M. C. Lee, 2003, Analyst forecast revisions and market price
discovery, The Accounting Review 78, 193–225.

1436 The Journal of Finance R©
Groysberg, Boris, Paul Healy, Craig Chapman, Devin Shanthikumar, and Yang Gui, 2007, Dobuy-side analysts out-perform the sell-side? Working paper, Harvard University.
Hallock, Kevin F., 1997, Reciprocally interlocking boards of directors and executive compensation,Journal of Financial and Quantitative Analysis 32, 331–344.
Haunschild, Pamela R., 1993, Interorganizational imitation: The impact of interlocks on corporateacquisition activity, Administrative Science Quarterly 38, 564–592.
Hochberg, Yael, Alexander Ljungqvist, and Yang Lu, 2007, Whom you know matters: Venturecapital networks and investment performance, Journal of Finance 62, 251–301.
Holmstrom, Bengt, 1999, Managerial incentive problems: A dynamic perspective, Review of Eco-nomic Studies 66, 169–182.
Hong, Harrison, and Jeffrey D. Kubik, 2003, Analyzing the analysts: Career concerns and biasedforecasts, Journal of Finance 58, 313–351.
Hong, Harrison, Jeffrey D. Kubik, and Amit Solomon, 2000, Security analysts’ career concerns andherding of earnings forecasts, RAND Journal of Economics 31, 121–144.
Hong, Harrison, Jeffrey D. Kubik, and Jeremy C. Stein, 2004, Social interaction and stock marketparticipation, Journal of Finance 59, 137–163.
Hong, Harrison, Jeffrey D. Kubik, and Jeremy C. Stein, 2005, Thy neighbor’s portfolio: Word-of-mouth effects in the holdings and trades of money managers, Journal of Finance 60,2801–2824.
Hwang, Byoung-Hyoun, and Seoyoung Kim, 2009, It pays to have friends, Journal of FinancialEconomics 93, 138–158.
Jackson, Matthew O., 2005, The economics of social networks, in Richard Blundell, Whitney Newey,and Torsten Persson, eds. Proceedings of the 9th World Congress of the Econometric Society(Oxford University Press, Oxford, UK).
Jegadeesh, Narasimhan, Joonghyuk Kim, Susan D. Krische, and Charles M. C. Lee, 2004, Analyz-ing the analysts: When do recommendations add value? Journal of Finance 59, 1083–1124.
Khurana, Rakesh, 2002, Searching for a Corporate Savior: The Irrational Quest for CharismaticCEOs (Princeton University Press, Princeton, NJ).
Kuhnen, Camelia M., 2009, Business networks, corporate governance and contracting in the mu-tual fund industry, Journal of Finance 64, 2185–2220.
Lamont, Owen, 2002, Macroeconomic forecasts and microeconomic forecasters, Journal of Eco-nomic Behavior and Organization 48, 265–280.
Larcker, David F., Scott A. Richardson, Andrew J. Seary, and Irem Tuna, 2005, Back door linksbetween directors and executive compensation, Working paper, University of Pennsylvania.
Lin, Hsiou-wei, and Maureen F. McNichols, 1998, Underwriting relationships, analysts’ earn-ings forecasts and investment recommendations, Journal of Accounting and Economics 25,101–127.
Lin, Hsiou-wei, Maureen F. McNichols, and Patricia O’Brien, 2005, Analyst impartiality and in-vestment banking relationships, Journal of Accounting Research 43, 623–650.
Ljungqvist, Alexander, F. Marston, and W. J. Wilhelm, 2006, Competing for securities underwrit-ing mandates: Banking relationships and analyst recommendations, Journal of Finance 61,301–340.
Ljungqvist, Alexander, F. Marston, and W. J. Wilhelm, 2009, Scaling the hierarchy: How and whyinvestment banks compete for syndicate co-management appointments, Review of FinancialStudies 22, 3977–4007.
Malloy, Christopher J., 2005, The geography of equity analysis, Journal of Finance 60, 719–755.
Malloy, Christopher J., Felicia Marston, and Alexander Ljungqvist, 2009, Rewriting history, Jour-nal of Finance 64, 1935–1960.
Massa, Massimo, and Simonov, 2005, History versus geography, Working paper, Stockholm Schoolof Economics.
Michaely, Roni, and Kent L. Womack, 1999, Conflict of interest and the credibility of underwriteranalyst recommendations, Review of Financial Studies 12, 653–686.
Michaely, Roni, and Kent L. Womack, 2007, What are analysts really good at? Working paper,Cornell University.

Sell-Side School Ties 1437
Mikhail, Michael B., Beverly R. Walther, and Richard H. Willis, 1999, Does forecast accuracymatter to security analysts? The Accounting Review 74, 185–200.
Mizruchi, Mark S., 1982, The American Corporate Network, 1904–1974 (Sage Publications, BeverlyHills, CA).
Mizruchi, Mark S., 1992, The Structure of Corporate Political Action: Inter-Firm Relations andTheir Consequences (Harvard University Press, Cambridge, MA).
Mohanram, Partha, and Shyam V. Sunder, 2006, How has regulation FD affected the operationsof financial analysts? Contemporary Accounting Research 23, 491–525.
Parkin, Rachel, 2006, Legal careers and school connections, Working paper, Harvard University,Cambridge, MA.
Scharfstein, David S., and Jeremy C. Stein, 1990, Herd behavior and investment, American Eco-nomic Review 80, 465–479.
Stickel, Scott E., 1991, Common stock returns surrounding earnings forecast revisions: Morepuzzling evidence, The Accounting Review 66, 402–416.
Stickel, Scott E., 1992, Reputation and performance among security analysts, Journal of Finance47, 1811–1836.
Useem, Michael, 1984, The Inner Circle (Oxford University Press Oxford, UK).Womack, Kent, 1996, Do brokerage analysts’ recommendations have investment value? Journal of
Finance 51, 137–167.