Self Supervision for Attention Networks
10
Self Supervision for Attention Networks Badri N Patro *† IIT Kanpur [email protected] Kasturi G S * NSUT ‡ [email protected] Ansh Jain * NSUT [email protected] Vinay P Namboodiri University of Bath [email protected] Abstract In recent years, the attention mechanism has become a fairly popular concept and has proven to be successful in many machine learning applications. However, deep learn- ing models do not employ supervision for these attention mechanisms which can improve the model’s performance significantly. Therefore, in this paper, we tackle this lim- itation and propose a novel method to improve the atten- tion mechanism by inducing “self-supervision”. We devise a technique to generate desirable attention maps for any model that utilizes an attention module. This is achieved by examining the model’s output for different regions sampled from the input and obtaining the attention probability dis- tributions that enhance the proficiency of the model. The attention distributions thus obtained are used for supervi- sion. We rely on the fact, that attenuation of the unimpor- tant parts, allows a model to attend to more salient regions, thus strengthening the prediction accuracy. The quantita- tive and qualitative results published in this paper show that this method successfully improves the attention mechanism as well as the model’s accuracy. In addition to the task of Visual Question Answering(VQA), we also show results on the task of Image classification and Text classification to prove that our method can be generalized to any vision and language model that uses an attention module. 1. Introduction Humans beings have the ability to comprehend a scene by paying attention to selective parts of an image instead of processing the entire scene. This ability to intelligently pick where to look reduces the problem complexity as it al- lows us to focus on regions of interest and ignore the back- ground clutter. The attention mechanism, inspired by such human behavior, has gained immense popularity among re- searchers. But even after commendable success in vari- ous tasks (like machine translation, object recognition, im- * Equal contribution † Currently working at Google ‡ Netaji Subhas University of Technology Figure 1. Supervision of attention module using surrogate atten- tion maps in a multi-modal system taking VQA as the example. age captioning, visual question answering, etc) the atten- tion modules that implicitly learn during training are not very accurate. They differ immensely from human atten- tion (i.e. where human beings attend to while performing the same task) and this results in incorrect predictions by the model. Thus, adding supervision to the attention mod- ule can be beneficial as explored in previous research works of [20] [8] [23]. Das et al. in [8] depicted that there is a strong interdependence between focusing on the ‘right re- gions’ and obtaining better semantic understanding while solving a problem. They showed (in the context of visual question answering) that an attention model that correlates better with human attention has better reliability in predict- ing the correct output and introduced a dataset of human- like attention called VQA-HAT. However, obtaining such human-like attention maps for the supervision of each ma- chine learning task is impractical and unrealistic, as anno- tations are time-consuming and require a lot of human re- sources. To tackle this problem, in this paper we propose a novel method to provide “self-supervision” for an attention net- work without incorporating any external module or dataset. This method can be used with inputs of different modalities (text and image are analyzed in this paper) and can be gen- eralized to any attention-based neural network. We gener- ate desirable attention maps that act as the surrogate ground truth for the attention maps implicitly produced by a model. 726
Transcript of Self Supervision for Attention Networks
Self Supervision for Attention Networks
Badri N Patro ∗†
IIT Kanpur
Kasturi G S ∗
NSUT‡
Ansh Jain ∗
NSUT
Vinay P Namboodiri
University of Bath
Abstract
In recent years, the attention mechanism has become a
fairly popular concept and has proven to be successful in
many machine learning applications. However, deep learn-
ing models do not employ supervision for these attention
mechanisms which can improve the model’s performance
significantly. Therefore, in this paper, we tackle this lim-
itation and propose a novel method to improve the atten-
tion mechanism by inducing “self-supervision”. We devise
a technique to generate desirable attention maps for any
model that utilizes an attention module. This is achieved by
examining the model’s output for different regions sampled
from the input and obtaining the attention probability dis-
tributions that enhance the proficiency of the model. The
attention distributions thus obtained are used for supervi-
sion. We rely on the fact, that attenuation of the unimpor-
tant parts, allows a model to attend to more salient regions,
thus strengthening the prediction accuracy. The quantita-
tive and qualitative results published in this paper show that
this method successfully improves the attention mechanism
as well as the model’s accuracy. In addition to the task
of Visual Question Answering(VQA), we also show results
on the task of Image classification and Text classification to
prove that our method can be generalized to any vision and
language model that uses an attention module.
1. Introduction
Humans beings have the ability to comprehend a scene
by paying attention to selective parts of an image instead
of processing the entire scene. This ability to intelligently
pick where to look reduces the problem complexity as it al-
lows us to focus on regions of interest and ignore the back-
ground clutter. The attention mechanism, inspired by such
human behavior, has gained immense popularity among re-
searchers. But even after commendable success in vari-
ous tasks (like machine translation, object recognition, im-
∗Equal contribution†Currently working at Google‡Netaji Subhas University of Technology
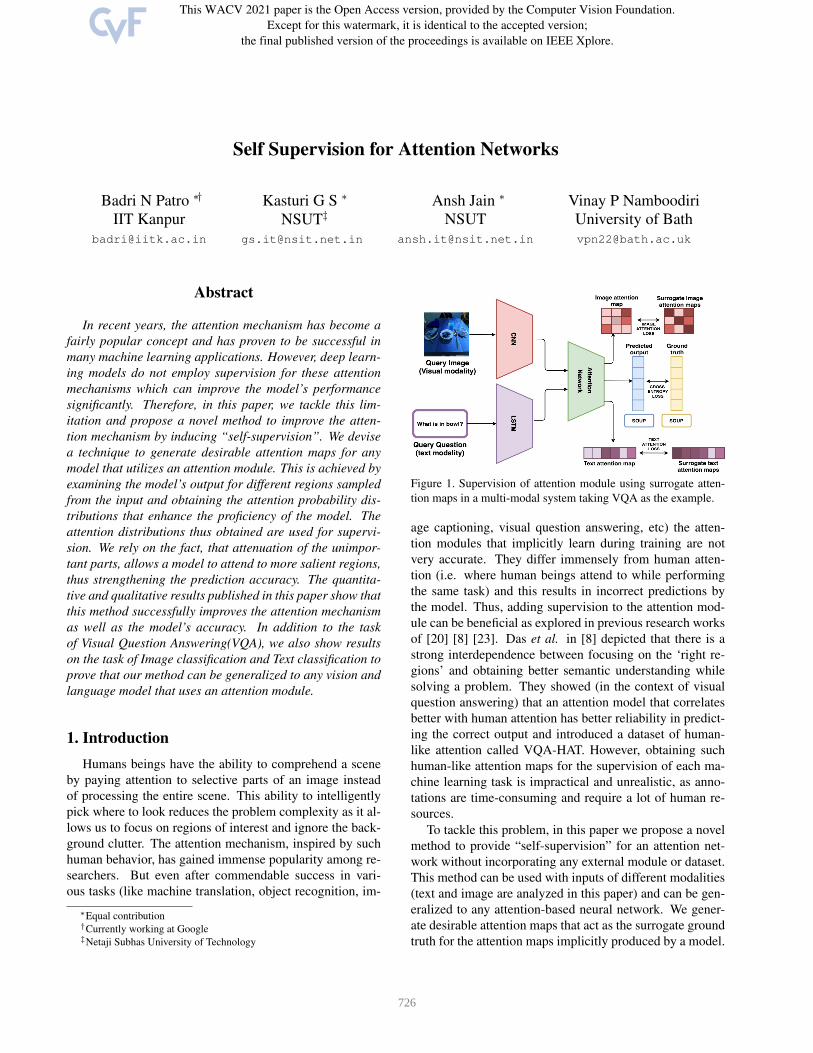
Figure 1. Supervision of attention module using surrogate atten-
tion maps in a multi-modal system taking VQA as the example.
age captioning, visual question answering, etc) the atten-
tion modules that implicitly learn during training are not
very accurate. They differ immensely from human atten-
tion (i.e. where human beings attend to while performing
the same task) and this results in incorrect predictions by
the model. Thus, adding supervision to the attention mod-
ule can be beneficial as explored in previous research works
of [20] [8] [23]. Das et al. in [8] depicted that there is a
strong interdependence between focusing on the ‘right re-
gions’ and obtaining better semantic understanding while
solving a problem. They showed (in the context of visual
question answering) that an attention model that correlates
better with human attention has better reliability in predict-
ing the correct output and introduced a dataset of human-
like attention called VQA-HAT. However, obtaining such
human-like attention maps for the supervision of each ma-
chine learning task is impractical and unrealistic, as anno-
tations are time-consuming and require a lot of human re-
sources.
To tackle this problem, in this paper we propose a novel
method to provide “self-supervision” for an attention net-
work without incorporating any external module or dataset.
This method can be used with inputs of different modalities
(text and image are analyzed in this paper) and can be gen-
eralized to any attention-based neural network. We gener-
ate desirable attention maps that act as the surrogate ground
truth for the attention maps implicitly produced by a model.
726

These surrogate attention maps are generated by feeding the
pre-trained baseline model with randomly masked versions
of the inputs. The confidence of the model for prediction
of the ground truth for each masked input is recorded. This
way, we find out the input regions salient for the ground
truth class prediction by analyzing the masked input and its
corresponding confidence score for the ground truth predic-
tion.
Figure 1 shows the supervision technique proposed in
this paper. The architecture shown displays the multi-modal
supervision technique. For the individual tasks of image at-
tention supervision and text attention supervision, the ba-
sic architecture remains the same, however, only the corre-
sponding input modality is present. We define this approach
in detail and also explain the generation of surrogate atten-
tion maps used for supervision in section 3. The major con-
tributions of this paper are as follows:
• We provide a novel technique to generate attention
maps which are analogous to human attention, which
are used as self-supervision for the attention model
• We show that the addition of supervision not only al-
lows the model to generate better attention maps but
also increases its prediction accuracy.
• We show the generality of our method by applying it to
three distinct classification tasks employing different
attention mechanisms.
2. Related Work
Attention: The main objective of the attention mech-
anism is to either highlight the important local information
or address the issue of irrelevant noise brought by the global
features. It is one of the most successful techniques used
in deep learning for computer vision and natural language
processing. Past work on attention include [12] [28] [31]
[24] [30] [21]. Vaswani et al. [28], propose an architecture
based solely on attention mechanism which performs well
on the task of machine translation. Yang et al. [31] show
that image question answering often requires multiple steps
of reasoning and using multiple layers of attention leads to
a better model. Xu et al.[30] show through visualization,
how the model can automatically learn to fix its gaze on
salient objects while generating caption. Hence, the ability
of attention is enhanced by the fact that it can benefit a wide
range of distinct problems. An interesting work by Fukui et
al. [10], proposes an Attention Branch Network for CNN
architecture and improves the model’s performance by us-
ing an attention branch but differs with our method as we
explicitly try to improve the attention mechanism which in
turn improves the model’s prediction capabilities and can-
not our method can be generalized beyond CNN. Patro et
al.[20] also try to obtain an improved attention for a visual
question answering (VQA) task by employing an external
explanation module and incorporating a discriminator that
aims to bring distributions of attention maps and visual ex-
planation closer. However, in our method instead of using
explanation as supervision, we generate desirable attention
maps implicitly from the existing pre-trained model.
Self-supervision: The concept of self-supervision was
introduced to overcome the limitations of traditional super-
vision such as effort of producing new datasets, availability
of vast amount of unlabelled data or difficulty in providing
annotations. Some of the work which can be considered
as self-supervised include [5], [26], [6], [21]. Patro et al.
[21] proposed an exemplar base self-supervision method to
improve attention for the Visual Question Answering task.
However, this method uses a pre-trained model to get an
exemplar image, which is not an exact method for self-
supervision.
Self-Attention: The self-attention(also called intra-
attention) module helps in finding out the relationship
amongst different segments of an input to a model and
where to pay more attention. This mechanism can also be
used for a wide variety of tasks. Cheng et al. [7] corre-
late the previous sentence with the current word using self-
attention and achieves good results for the task of machine
reading. Xu et al. [30] has proposed a self-attention based
method to generate proper descriptions of the contents de-
picted in an image.
In this paper for the purpose of attention in text, we
choose the self-attention mechanism proposed by Lin et
al. [18], although our proposed method can be extended to
any attention mechanism in general. To provide a thorough
analysis of our technique we apply our method to 3 tasks i.e.
Image Classification, Text Classification, and VQA. The
VQA task was first proposed by Malinowski et al. [19] and
combines both textual and visual modalities. Past work on
VQA include [2] [13] [29]. The analysis of our method for
image and text classification is done on CIFAR-10 [16] and
TREC-6 [1] datasets respectively. The randomized mask-
ing technique for images in our model resembles the work
by Petsiuk et al. [22] in which this technique is used for
obtaining visual explanation. We take inspiration from this
and use the masking technique to get supervision for our at-
tention model in images. In the case of text, we simulate
masking by concealing two words at a time and feeding it
to the classification model as input.
3. Method
The process of yielding supervision for attention in-
volves two steps. The first step is to generate surrogate
ground truth attention maps Att from the baseline model
pre-trained on the required machine learning task. The sec-
ond step involves re-training the model and supervising the
attention maps produced by the model Att with Att which
gives the model an additional supervision. The improved
727

attention module helps the model to focus on the right re-
gions, removes the noise from the input, and thus enhances
the model’s prediction capabilities. The first step of gener-
ating attention maps Att for image i.e. AttI and for text i.e.
AttQ involves different methods which are explained in the
subsequent sub-sections.
For the second step of supervision, we utilize a similar
mechanism for image and text. The generated attention
maps Att are considered to be the surrogate ground truth
for Att produced by the model. We calculate the loss Latt
between the Att and Att to introduce the supervision for
attention mechanism as:-
Latt = loss(Att, Att) (1)
We use different variants of the loss() function for calcu-
lating attention loss and present results with all the variants.
The details of all four types of loss functions used are ex-
plained in section 4.3.
The attention Att produced by the model is applied over
the input and non-linearities are then applied to the attended
input to produce probabilities over the class labels. The
classification loss is defined as:-
Lossc =1
K
K∑
k=1
−logP (ak|input) (2)
Note that we average the log-likelihoods over all the cor-
rect answers a1, a2, ..., aK where K is the number of train-
ing samples. The final loss is calculated as Lossc + γ ∗Lossatt where γ is the scaling factor which brings both the
losses to the same scale.
3.1. Generation of Surrogate Attention Supervisionfor Images
We first generate m random masks with values in the
range [0,1] for each region. For each input, we apply the mgenerated masks and probe the model with all the masked
versions of that input. Then we find out the attention map
with the highest confidence in predicting the ground truth
as shown in figure 2. The selector module shown in the dia-
gram is a simple rule-based module that selects the attention
map with the highest score for ground truth prediction. We
choose a singular attention map with the highest prediction
score for ground truth instead of considering the weighted
sum of all the attention maps because during initial experi-
ments we found that we get better results, both qualitatively
and quantitatively with the former. This might be due to the
fact that the weighted average method gives certain impor-
tance to regions corresponding to non-ground truth classes
as well whereas the highest-scoring mask focuses almost
entirely on regions important to the ground-truth class.
Let the image features obtained after passing through
a CNN architecture such as ResNet or VGGNet be X ∈
Figure 2. Generation of Surrogate Attention Maps for visual-
attention based network.
RC×N where C represents the number of channels and
N = W ∗ H represents the dimension of image features.
Let Mi be a random mask with values of each region in
the range of [0,1] and having it’s dimensions the same as
image regions i.e W ∗ H . The masked versions of in-
put are obtained by element-wise multiplication of the in-
put with a mask and are represented as X ⊙ Mi where
Mi can be M0,M1, . . . ,Mm. A mask is applied to each
channel of the image feature producing the masked input
X ′i = X ⊙Mi ∈ RC×N . Let the ground truth class prob-
ability predicted by the pre-trained baseline model when
probed with masked image be f(X ′i). We find mask Mi
with which we get the maximum value of f(X ′i) and re-
(a) Ques: What colour is the Boy’s shirt
in the shoulder region? Ans: Pink
Original Attention Surrogate Attention
(b) Ques: What is around the Man’s neck ?
Ans: Tie
Original Attention Surrogate Attention
Figure 3. Comparison of Image Attention Maps with(right) and
without(left) Masking for VQA.
728

trieve the attention map AttI generated by the pre-trained
model when for the corresponding input i.e. X ′i .
The image features for the task of VQA were extracted
from layer 4 of ResNet-152 network, therefore the num-
ber of channels is C = 2048 and the number of regions
N = 14×14. The baseline model used for evaluation of our
method on VQA is similar to the one proposed in [13] but
slightly modified by including the self-attention module for
text as well. This modification makes the model standard
for comparison with our method for both image and text at-
tention supervision. For image classification on CIFAR-10
we obtain image representation withC = 32 andN = 8×8for each image. We implement a CNN based classification
code and apply the self-attention module to use as a baseline
for classification on the CIFAR-10 dataset. The variation in
the above feature dimensions for different tasks is intended
to show that our method is independent of the number of
channels and can be extended to any channel size.
Figure 3 shows the attention maps produced by the pre-
trained baseline VQA model. It depicts the comparison be-
tween the attention map originally produced by the model
and the attention map chosen i.e. AttI after probing the
model with masked inputs. It clearly shows that AttI cor-
relates better with human attention as masking helps in hid-
ing the unimportant regions and enables the model to focus
more accurately on the regions that are important for ob-
taining the ground truth answer.
3.2. Generation of Surrogate Attention Supervisionfor Text
To generate supervision for attention maps of text, we
aim to find out the words which the model needs to attend
to more, for predicting the output class correctly. Suppose
we have a text T which has n words (q1, q2, q3, . . . , qn),we mask two words at a time and probe the classifica-
tion model with the masked text T ′ for example , T ′ =(t1, t2, 0, 0, . . . , tn) . There are total
(
n2
)
possible combina-
tions for T ′. Let the ground truth class probability predicted
by the model when probed with masked text be f(T ′). We
find the masked text T ′ with which we get the maximum
value of f(T ′), and retrieve the attention map AttQ gen-
erated by the model when probed with T ′. This method is
depicted in figure 4. Similar to images, we choose one at-
tention map instead of a weighted average of all for text as
well. The self-attention model used for text classification on
the TREC-6 dataset is [18] which provides the baseline for
our experiments and results. We use the same baseline for
the VQA task as defined in 3.1 but in this case, we supervise
the attention module that attends to text. We get a better at-
tention map AttQ with the masked question as compared
to the one generated with the unmasked question AttQ, as
shown in figure-5. This is again because the noise i.e. the
unimportant regions are being hidden from the model and
Figure 4. Generation of Surrogate Attention Maps for textual-
attention based network.
thus the model focuses on the important regions.
Figure 5. Comparison of text attention visualisation with(right)
and without(left) masking for the task of VQA. Here, opacity of
the red color is directly proportional to weight of the correspond-
ing word in the attention map generated
3.3. Combined multimodal supervision
We also provide the method for supervision on both im-
age and text combined as shown in fig. 1. This method is
evaluated on VQA only, as it combines both these modal-
ities. First, surrogate ground-truth attention maps are re-
trieved as explained in 3.1 and 3.2. The supervision is
then done by minimizing Loss = Lossc + γ ∗ LossattI +β ∗ LossattT where LossattI is the image attention loss,
LossattT is the text attention loss and γ, β are scaling fac-
tors. The baseline model used for comparison in VQA re-
mains constant in this case as well and is the same as the
one defined in 3.1. However, the difference in this case as
expected is that we supervise both image and text attention
modules.
4. Experiments
We evaluate our proposed method and provide both
quantitative and qualitative analyses for the VQA task.
VQA is a classification task in which we give an image
and question as input and the output is one of 3000 pos-
sible answers. The baseline model used is VQA-SAN with
self-attention introduced for text. Quantitative analysis in-
729

cludes i) evaluation of our proposed model against the base-
line models ii) comparison of the attention map generated
by our proposed model with the attention map generated by
the baseline model for VQA task by calculating Rank Cor-
relation (RC) score and Earth Mover Distance (EMD) [4]
against VQA-HAT dataset [8] as shown in table 3. The
qualitative analysis includes i) visualization of image at-
tention maps generated by the baseline and our proposed
model (fig 8), ii) visualisation of text attention maps for
question(fig 9).
Further, we provide quantitative analysis for image and
text classification. We show the accuracy comparison of the
baseline model with our method. The baseline used for text
classification is [18] and for image classification, we imple-
ment a basic CNN based classification model with a self-
attention module. We also provide the code for our method
on Text Classification task1.
4.1. Dataset
We evaluate our method on three dataset , 1) VQA-v1
[3], 2) CIFAR-10[16] and 3) TREC-6[1]. For the VQA task
we choose VQA-v1 [3] which consists of 204,721 images
form the MS COCO dataset [17]. This evaluation is done
on the real open-ended challenge which consists of 614,163
questions and 6,141,630 answers.
We choose VQA v1 dataset to evaluate our model be-
cause it allows us to compare the attention maps produced
by our model against the VQA HAT dataset, which in turn,
allows us to quantify whether our VQA model is “looking”
at the same regions of the image as humans do to produce
an answer. Furthermore, we are quantitatively able to prove
that our model is able to achieve its ultimate goal that is
to improve the attention maps produced by an attention-
module-based deep learning model.
CIFAR-10[16] dataset is an image dataset that consists
of 60000, 32 × 32 size color images. The train split con-
sists of 50000 and the test split consists of the remaining
10000 images. There is a total of 10 class labels in which
the images are classified.
TREC-6[1] is a dataset for text classification consisting
of 5452 train and 500 test samples classified into 6 class
labels. We evaluate our method on this dataset and provide
results in section-4.6.
4.2. Training and Model Configuration
We train our model intending to minimize the total loss
given by: Losstotal = Lossc + γ ∗ Lossatt Where Losscis cross-entropy classification loss, which signifies the dif-
ference between ground truth and prediction. The Lossatt
1The code is available at https://github.com/
Anonymous1207/Self_Supervsion_for_Attention_
Networks
is the loss between surrogate attention maps and the atten-
tion maps predicted by the model. Apart from the adversar-
ial loss, Lossatt was also taken as CORAL[25] loss, Mean
Square Error (MSE) loss, and maximum mean discrepancy
(MMD)[27] loss for supervision loss for training our model
to show the comparison between these losses. As shown by
the results, the adversarial loss has the best performance.
We form the binary masks for images, by randomly as-
signing values of 0 and 1 to maps with dimensions Ws∗ H
s
and then using bilinear interpolation for creating maps of
size W ∗H . Hence, each region has a corresponding value
in the map between 0 and 1. We take the value of ‘s’ as 6 for
VQA dataset and 2 for CIFAR-10 dataset after extensive ex-
perimentation and a total number of masks as 500 for each
image. We also include a mask with all values as 1 i.e., the
entire image is sent without masking any region. This was
done because in some cases sending the whole image gave
the best result and so this case needed to be considered as
well. In the case of text, we do not mask randomly, instead,
we calculate the importance of each word in the text itself
by masking two words at a time as discussed in section 3.2.
4.3. Loss Functions
Adversarial Loss: For this variant, we formulate the su-
pervision task as a zero-sum adversarial game between two
players (Att,Att), with one set of players being a Gener-
ator (G) network and the other being a discriminator (D)
network. The solution for a zero-sum game is called a min-
max solution, where the min-max [11] objective is defined
as:-
minG
maxD
Latt(G,D) = EgAtt∼GAtt(xi)[logD(gAtt/xi)]
+ EgAtt
∼GAtt
(xi)[log(1−D(G(gAtt/xi)))]
(3)
Maximum Mean Discrepancy (MMD) Net: In this
variant, we minimize this distance using MMD [27] based
standard distribution distance metric. We have computed
this distance with respect to a representation ψ(.). In our
case, we obtain representation feature ψ(α) for attention &
ψ(µ) for importance map for ground-truth class. Then we
compute the distance vector between them
LMMD(µ, α) =∣
∣
∣
∣
1
µ
∑
µi∈µ
ψ(µi)−1
α
∑
αi∈α
ψ(αi)∣
∣
∣
∣ (4)
CORAL Net: In this variant, we minimize the distance
between second-order statistics (co-variances) of attention
and importance map using CORAL loss [25] based on
standard distribution distance metric. Here, both (µ) and
(α) are the d-dimensional deep layer activation feature for
attention and importance map. We have computed fea-
ture co-variance matrix of attention feature and importance
730

(a) Example 1 (b) Example 2
Figure 6. Right side of each example shows original image and left side shows importance of each words and corresponding answer
prediction probability if only unmasked words are sent as questions.
map feature represented by C(α) and C(µ) respectively.
Then we compute the distance between their second-order
statistics(co-variance) using the following formula where
||.||F is the square matrix Frobenius norm:
LCoral(µ, α) =1
4
∣
∣
∣
∣C(µ)− C(α)∣
∣
∣
∣
2
F(5)
MSE Net: In this variant, we minimize the Mean Square
Error between the attention mask and importance map. The
mean square loss is defined by :
LMSE(µ, α) =1
N
∑
i
(µi − αi)2 (6)
We evaluate the above architectures for the method pro-
posed in this paper although we advocate the use of adver-
sarial loss as it shows the best result.
Ques: What is the dog doing? Ans: Laying down
Original Image 100 masks
(Prediction Acc :21.2%) (Prediction Acc :36.4%)
500 masks 1000 masks
(Prediction Acc :45.3%) (Prediction Acc :45.4%)
Figure 7. Comparison of surrogate attention maps taking different
number of masks
4.4. Selection of masks for image attention
The number of masks was selected by conducting an ex-
periment to determine the effect of the number of masks on
the output probability for the ground truth while consider-
ing computation complexity as well. We experimented with
100, 500, and 1000 masks on a few images and visualized
the results as shown by the example in figure 7. The experi-
ment revealed that for most images the score for the ground
truth increased significantly when the number of masks was
increased from 100 to 500 whereas, for 1000 masks, the ac-
curacy was either comparable or insignificantly improved
to 500 masks. Hence the optimum number of masks was
chosen to be 500.
4.5. Importance of text tokens
Although we generate self-supervision for attention in
text by masking two words at a time, we conducted exper-
iments to determine the importance of different words in
text for the task of VQA as well. We first obtained the out-
put probability of ground-truth answers by masking all ex-
cept one word, similarly, we masked all words except two
and so on. The results for masking all words except two
are shown in 6. We send each text input with all text tokens
(i.e. words) masked except two and extracted the two words
that achieved the highest score in predicting the correct an-
swer. The experiment revealed that in most cases, a high
confidence score (close to the score obtained when the en-
tire text input is used) for predicting ground-truth answers
was achieved even when two words were given as input. In
some cases, the masked input even outperformed the itera-
tion where the entire unmasked text is given as input. This
experiment further enforced that few tokens are more im-
portant than others in text inputs and few tokens even add
noise that makes a model predict poorly. Hence, improve-
ment in attention for text correlates to the enhancement of a
model’s accuracy.
4.6. Quantitative Results for Image and Text Classification
The tables 1 and 2 show the results of Text classifica-
tion and Image classification on TREC-6 and CIFAR-10
datasets respectively. The results depict the comparison of
731

Model Accuracy
Baseline Model 81.20
Text Supervision + Coral 81.89
Text Supervision + MSE 82.33
Text Supervision + MMD 84.80
Text Supervision + Adv 84.91
Table 1. Accuracy comparison on TREC-6 dataset for text atten-
tion supervision.
our method with the baseline. Moreover, we train the model
with self-supervision of attention, using different types of
losses as defined in Section 4.3 and show the results. These
results reinforce one of the claims in this paper that the
proposed method can be extended to multiple models that
are attention-based and improve the results. We are able
to achieve a 3.7% improvement in accuracy over the base-
Models Accuracy
Baseline Model 69.59
Image Supervision + Coral 69.83
Image Supervision + MSE 69.87
Image Supervision + MMD 70.80
Image Supervision + Adv 71.12
Table 2. Accuracy comparison on CIFAR-10 dataset for Image at-
tention supervision.
line for text classification and 1.5% improvement over the
baseline for image classification. Accuracies are shown for
the test split of both the datasets. We advocate the use of
Adversarial loss as it gives better results compared to other
losses.
(a) Ques : What is in the bowl? (b) Ques: What is the person doing to the kite?
Ans: Soup Ans:Flying
Raw Image Baseline model Our model Raw Image Baseline model Our model
(c) Ques: What color is the wetsuit? (d) Ques: What is the person hitting?
Ans : Black Ans: Tennis ball
Raw Image Baseline model Our model Raw Image Baseline model Our model
(d) Ques: How many bottles is the middle guy trying? (e) Ques: What is the teddy bear sitting on?
Ans : 3 Ans: Table
Raw Image Baseline model Our model Raw Image Baseline model Our model
Figure 8. Comparison of the attention maps generated by the baseline VQA model and our proposed model. Using our self-supervision
technique, our method focus on. more accurate as compare to baseline attention map.
732

4.7. Qualitative Analysis for VQA (Multimodal)
We compare the attention maps generated by the base-
line model and our proposed technique and observe a sig-
nificant improvement in our method. In figure 8 we can see
how attention is improved as we go from the baseline model
(SAN[32]) to the proposed model. For example, in the first
illustration, the baseline is unable to focus on any specific
portion of the image, but the proposed model is able to focus
accurately on the bowl (indicated by intense orange color).
The same can be observed for other illustrations. The com-
parison of text attention is also shown in the figure 9. It
is shown that the method proposed in this paper can focus
more clearly on words that are considered important by hu-
mans while answering such questions. For example, for the
question ”What is leaning against the house?”, the baseline
method does not attend well to ”leaning” which is an im-
portant word to answer this question.
Figure 9. Comparison of self attention of text for baseline and our
proposed method.
4.8. Quantitative results for VQA
We compare attention maps generated by our proposed
method with the baseline VQA method (SAN[32]) based on
rank correlation metric and EMD metric against the VQA-
HAT dataset [8]. The results as shown in table 3 show the
ability of our method to improve attention and correlate bet-
ter with human attention. We also compare the results of
the baseline model with our proposed method based on an-
swer prediction accuracy using the VQA-v1[3] dataset, as
shown in the table-4. We obtain an improvement of around
3.85% over the VQA baseline for the combined model with
adversarial loss function used for calculating attention loss.
Our proposed method with textual attention supervision im-
proves by 2% and visual attention supervision improves by
3.7%. The accuracy improvement signifies that improving
the attention also improves the prediction capability of the
model. Our method can be extended to attention mecha-
nisms other than (SAN) as well such as MCB [9], MLB
[15] and BAN[14]. However, our objective is not to com-
pare different attention modules but to propose a method to
provide self-supervision for attention based deep learning
models, so we select SAN which is relatively simpler and
requires less computation.
Model RC(↑) EMD(↓)
Baseline 0.08 0.421
Ques + Coral 0.09 0.393
Ques + MSE 0.10 0.387
Ques + MMD 0.12 0.381
Ques + Adv 0.13 0.370
Image + Coral 0.10 0.381
Image + MSE 0.11 0.372
Image + MMD 0.13 0.369
Image + Adv 0.15 0.350
Both + Adv 0.15 0.352
Table 3. Rank Correlation and EMD between HAT attention and
final generated attention masks from our model.
Models All Y/N Num Other
Baseline 58.08 76.7 35.2 44.2
Ques + Coral 58.17 76.03 36.3 45.2
Ques + MSE 58.85 76.8 36.9 45.6
Ques + MMD 59.29 77.0 37.04 46.0
Ques + Adv 60.11 77.5 37.5 46.7
Image + Coral 59.23 76.2 36.6 45.1
Image + MSE 60.42 77.07 37.21 45.7
Image + MMD 61.02 77.9 37.6 46.2
Image + Adv 61.76 78.3 38.2 47.0
Both + Adv 61.92 78.6 38.3 47.2
Table 4. Accuracy comparison on VQA-v1 dataset for VQA task.
5. Conclusion
In this chapter, we have proposed a method to obtain
self-supervision for improving attention in both visual and
textual modalities. Specifically, we consider the use of a
random masking technique for obtaining attention supervi-
sion. Our method provides a means for obtaining surrogate
supervision for attention. The proposed method also shows
that improved attention indeed results in improved results
for semantic classification tasks. In the future, we would
like to investigate other such means for obtaining a higher
correlation between human-like attention and a model’s at-
tention, and have an improved performance and higher in-
terpretability for solving vision and language-based prob-
lems.
733

References
[1] Trec-6 dataset repository. https://trec.nist.gov/
presentations/TREC6/index.html.
[2] Aishwarya Agrawal, Jiasen Lu, Stanislaw Antol, Margaret
Mitchell, C Lawrence Zitnick, Devi Parikh, and Dhruv Batra.
Vqa: Visual question answering. International Journal of
Computer Vision, 123(1):4–31, 2017.
[3] Stanislaw Antol, Aishwarya Agrawal, Jiasen Lu, Margaret
Mitchell, Dhruv Batra, C. Lawrence Zitnick, and Devi
Parikh. VQA: Visual Question Answering. In International
Conference on Computer Vision (ICCV), 2015.
[4] Martin Arjovsky, Soumith Chintala, and Leon Bottou.
Wasserstein gan. stat, 1050:26, 2017.
[5] Liqun Chen, Zhe Gan, Yu Cheng, Linjie Li, Lawrence Carin,
and JJ (Jingjing) Liu. Graph optimal transport for cross-
domain alignment. In ICML 2020, July 2020.
[6] Yen-Chun Chen, Linjie Li, Licheng Yu, Ahmed El Kholy,
Faisal Ahmed, Zhe Gan, Yu Cheng, and Jingjing Liu. Uniter:
Universal image-text representation learning. In European
Conference on Computer Vision, pages 104–120. Springer,
2020.
[7] Jianpeng Cheng, Li Dong, and Mirella Lapata. Long short-
term memory-networks for machine reading. In Proceedings
of the 2016 Conference on Empirical Methods in Natural
Language Processing, pages 551–561, Austin, Texas, Nov.
2016. Association for Computational Linguistics.
[8] Abhishek Das, Harsh Agrawal, C. Lawrence Zitnick, Devi
Parikh, and Dhruv Batra. Human Attention in Visual Ques-
tion Answering: Do Humans and Deep Networks Look at
the Same Regions? In Conference on Empirical Methods in
Natural Language Processing (EMNLP), 2016.
[9] Akira Fukui, Dong Huk Park, Daylen Yang, Anna Rohrbach,
Trevor Darrell, and Marcus Rohrbach. Multimodal com-
pact bilinear pooling for visual question answering and vi-
sual grounding. In Proceedings of the 2016 Conference on
Empirical Methods in Natural Language Processing, pages
457–468, Austin, Texas, Nov. 2016. Association for Compu-
tational Linguistics.
[10] Hiroshi Fukui, Tsubasa Hirakawa, Takayoshi Yamashita, and
Hironobu Fujiyoshi. Attention branch network: Learning of
attention mechanism for visual explanation. In Proceedings
of the IEEE/CVF Conference on Computer Vision and Pat-
tern Recognition (CVPR), June 2019.
[11] Ian Goodfellow, Jean Pouget-Abadie, Mehdi Mirza, Bing
Xu, David Warde-Farley, Sherjil Ozair, Aaron Courville, and
Yoshua Bengio. Generative adversarial nets. In Advances
in neural information processing systems, pages 2672–2680,
2014.
[12] L. Itti, C. Koch, and E. Niebur. A model of saliency-based
visual attention for rapid scene analysis. IEEE Transactions
on Pattern Analysis and Machine Intelligence, 20(11):1254–
1259, 1998.
[13] Vahid Kazemi and Ali Elqursh. Show, ask, attend, and an-
swer: A strong baseline for visual question answering. arXiv
preprint arXiv:1704.03162, 2017.
[14] Jin-Hwa Kim, Jaehyun Jun, and Byoung-Tak Zhang. Bilin-
ear attention networks. In Advances in Neural Information
Processing Systems, pages 1571–1581, 2018.
[15] Jin-Hwa Kim, Kyoung Woon On, Woosang Lim, Jeonghee
Kim, Jung-Woo Ha, and Byoung-Tak Zhang. Hadamard
Product for Low-rank Bilinear Pooling. In The 5th Inter-
national Conference on Learning Representations, 2017.
[16] Alex Krizhevsky, Geoffrey Hinton, et al. Learning multiple
layers of features from tiny images. 2009.
[17] Tsung-Yi Lin, Michael Maire, Serge Belongie, James Hays,
Pietro Perona, Deva Ramanan, Piotr Dollar, and C Lawrence
Zitnick. Microsoft coco: Common objects in context. In
European Conference on Computer Vision, pages 740–755.
Springer, 2014.
[18] Zhouhan Lin, Minwei Feng, Cicero Nogueira dos Santos,
Mo Yu, Bing Xiang, Bowen Zhou, and Yoshua Bengio. A
structured self-attentive sentence embedding. 5th Interna-
tional Conference on Learning Representations, 2017.
[19] Mateusz Malinowski and Mario Fritz. A multi-world ap-
proach to question answering about real-world scenes based
on uncertain input. In Advances in Neural Information Pro-
cessing Systems (NIPS), 2014.
[20] Badri Patro, Anupriy, and Vinay Namboodiri. Explanation
vs attention: A two-player game to obtain attention for vqa.
Proceedings of the AAAI Conference on Artificial Intelli-
gence, 34:11848–11855, 04 2020.
[21] Badri Patro and Vinay P. Namboodiri. Differential atten-
tion for visual question answering. In The IEEE Conference
on Computer Vision and Pattern Recognition (CVPR), June
2018.
[22] Vitali Petsiuk, Abir Das, and Kate Saenko. Rise: Random-
ized input sampling for explanation of black-box models. In
British Machine Vision Conference (BMVC), 2018.
[23] Tingting Qiao, J. Dong, and Duanqing Xu. Exploring
human-like attention supervision in visual question answer-
ing. In Thirty-Second AAAI Conference on Artificial Intelli-
gence, 2018.
[24] Kevin J Shih, Saurabh Singh, and Derek Hoiem. Where to
look: Focus regions for visual question answering. In Pro-
ceedings of the IEEE conference on computer vision and pat-
tern recognition, pages 4613–4621, 2016.
[25] Baochen Sun and Kate Saenko. Deep coral: Correlation
alignment for deep domain adaptation. In European Con-
ference on Computer Vision, pages 443–450. Springer, 2016.
[26] Hao Tan and Mohit Bansal. LXMERT: Learning cross-
modality encoder representations from transformers. In
Proceedings of the 2019 Conference on Empirical Methods
in Natural Language Processing and the 9th International
Joint Conference on Natural Language Processing (EMNLP-
IJCNLP), pages 5100–5111, Hong Kong, China, Nov. 2019.
Association for Computational Linguistics.
[27] Eric Tzeng, Judy Hoffman, Ning Zhang, Kate Saenko, and
Trevor Darrell. Deep domain confusion: Maximizing for
domain invariance. arXiv preprint arXiv:1412.3474, 2014.
[28] Ashish Vaswani, Noam Shazeer, Niki Parmar, Jakob Uszko-
reit, Llion Jones, Aidan N Gomez, Łukasz Kaiser, and Illia
Polosukhin. Attention is all you need. In Advances in neural
information processing systems, pages 5998–6008, 2017.
734

[29] Huijuan Xu and Kate Saenko. Ask, attend and answer: Ex-
ploring question-guided spatial attention for visual question
answering. In European Conference on Computer Vision,
pages 451–466. Springer, 2016.
[30] Kelvin Xu, Jimmy Ba, Ryan Kiros, Kyunghyun Cho, Aaron
Courville, Ruslan Salakhudinov, Rich Zemel, and Yoshua
Bengio. Show, attend and tell: Neural image caption gen-
eration with visual attention. In International conference on
machine learning, pages 2048–2057, 2015.
[31] Zichao Yang, Xiaodong He, Jianfeng Gao, Li Deng, and
Alex Smola. Stacked attention networks for image question
answering. In Proceedings of the IEEE Conference on Com-
puter Vision and Pattern Recognition, pages 21–29, 2016.
[32] Zichao Yang, Xiaodong He, Jianfeng Gao, Li Deng, and
Alex Smola. Stacked attention networks for image question
answering. In Proceedings of the IEEE Conference on Com-
puter Vision and Pattern Recognition, pages 21–29, 2016.
735