Self-Organizing Maps · Several Different Kohonen Nets • Linear associative memory (concept...
68
Self-Organizing Maps “Kohonen Nets” Feature Maps (a form of competitive learning)
Transcript of Self-Organizing Maps · Several Different Kohonen Nets • Linear associative memory (concept...
Self-Organizing Maps
“Kohonen Nets”Feature Maps
(a form of competitive learning)
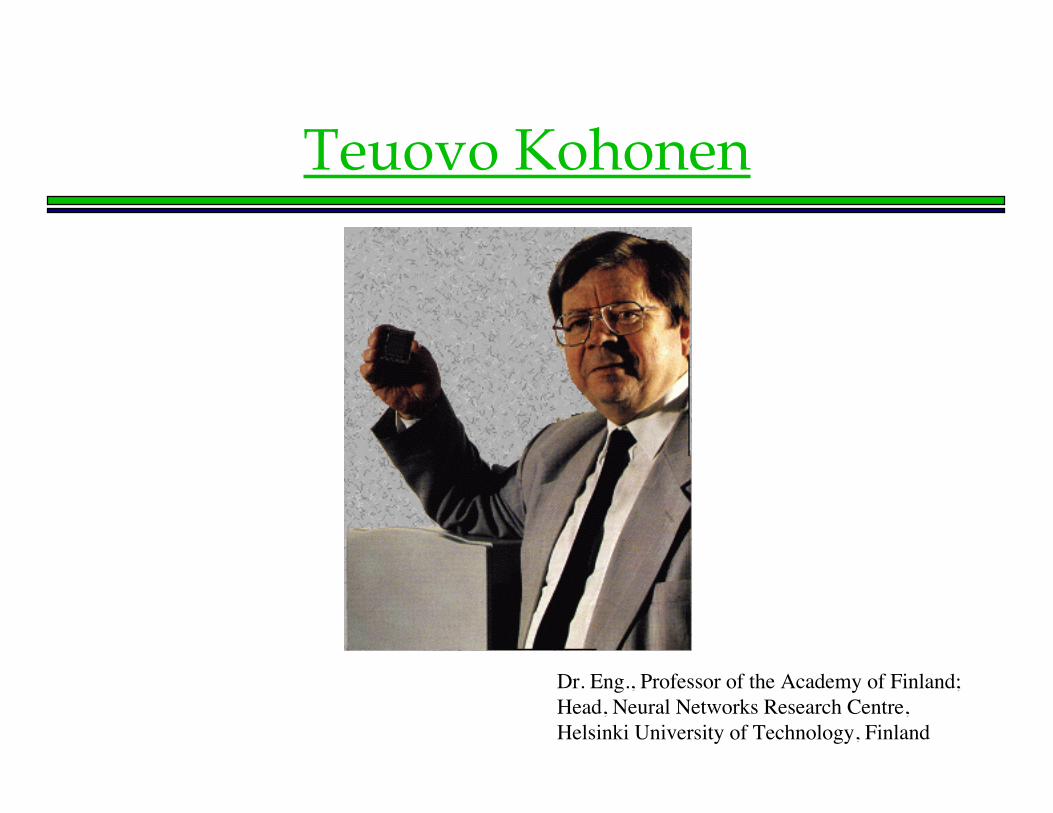
Teuovo Kohonen
Dr. Eng., Professor of the Academy of Finland;Head, Neural Networks Research Centre,Helsinki University of Technology, Finland
Several Different Kohonen Nets
• Linear associative memory (conceptdiscovered at same time as that by JamesAnderson)
• Self-Organizing Maps (SOMs)• Similar to LVQ clustering• Fundamentally unsupervised• Supervision can be overlaid• Additional structure can be superimposed
Maps in Neurobiology
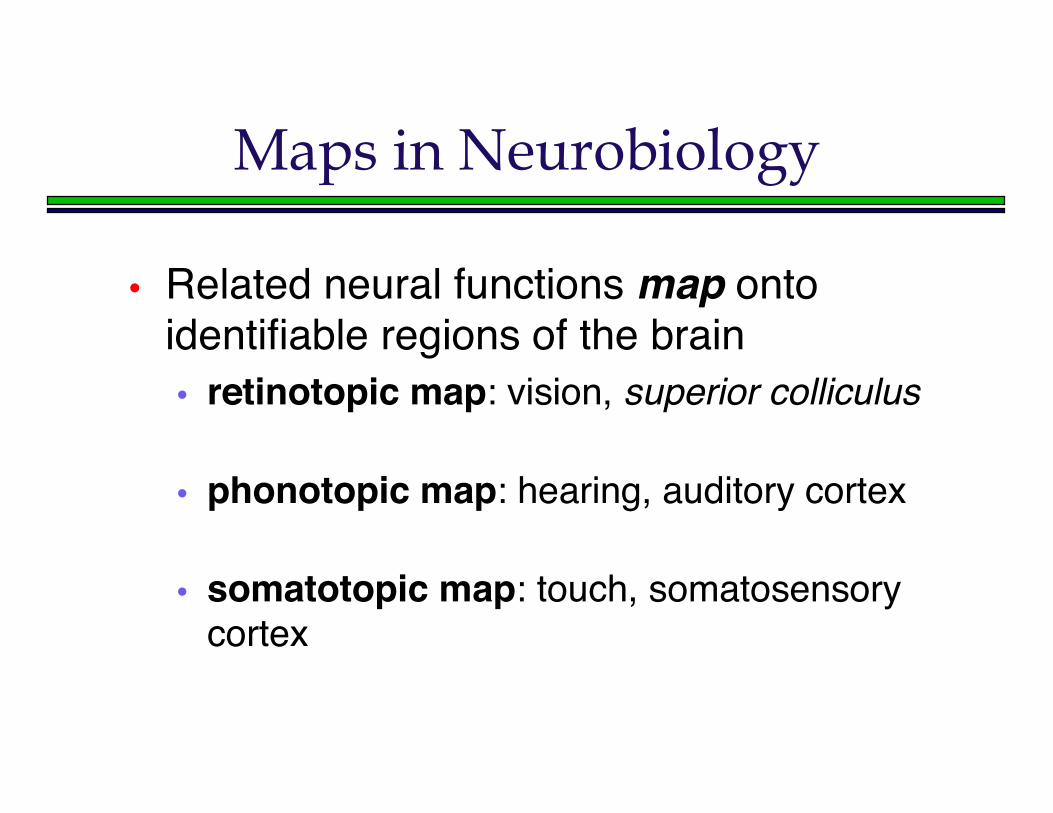
• Related neural functions map ontoidentifiable regions of the brain• retinotopic map: vision, superior colliculus
• phonotopic map: hearing, auditory cortex
• somatotopic map: touch, somatosensorycortex
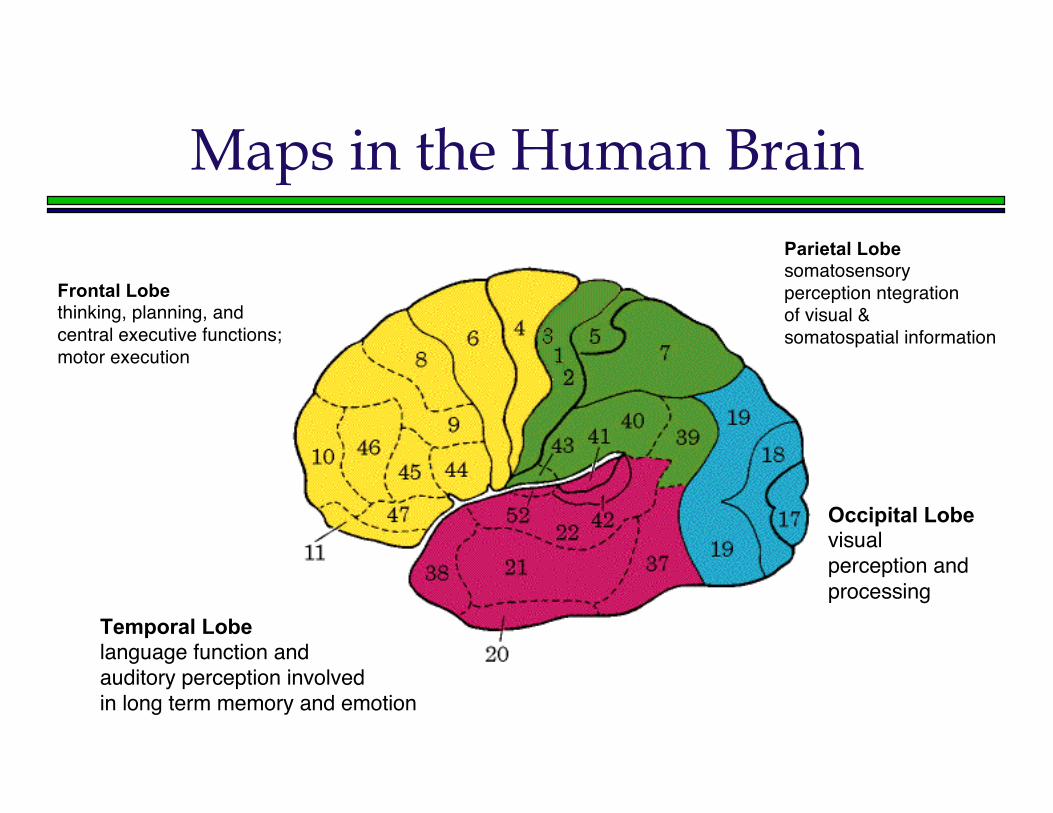
Maps in the Human Brain
Frontal Lobethinking, planning, andcentral executive functions; motor execution
Parietal Lobesomatosensory perception ntegration of visual & somatospatial information
Temporal Lobe language function and auditory perception involved in long term memory and emotion
Occipital Lobevisual perception and processing
Desired Properties of Maps
• Approximation of input space: generally amany-one mapping of input space into weightspace
• Topology-preserving: points close togetherin input space should map to points closetogether in weight space.
• Density-preserving: regions of similardensity should map to regions of proportionaldensity.
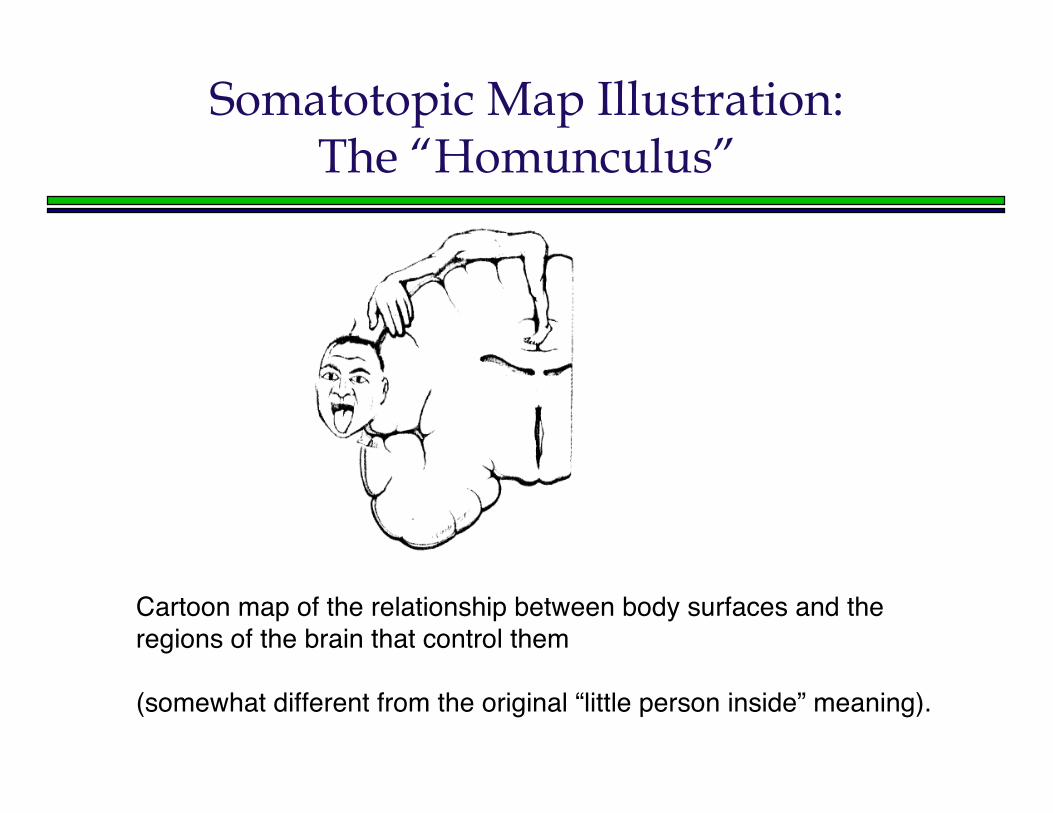
Somatotopic Map Illustration:The “Homunculus”
Cartoon map of the relationship between body surfaces and theregions of the brain that control them
(somewhat different from the original “little person inside” meaning).
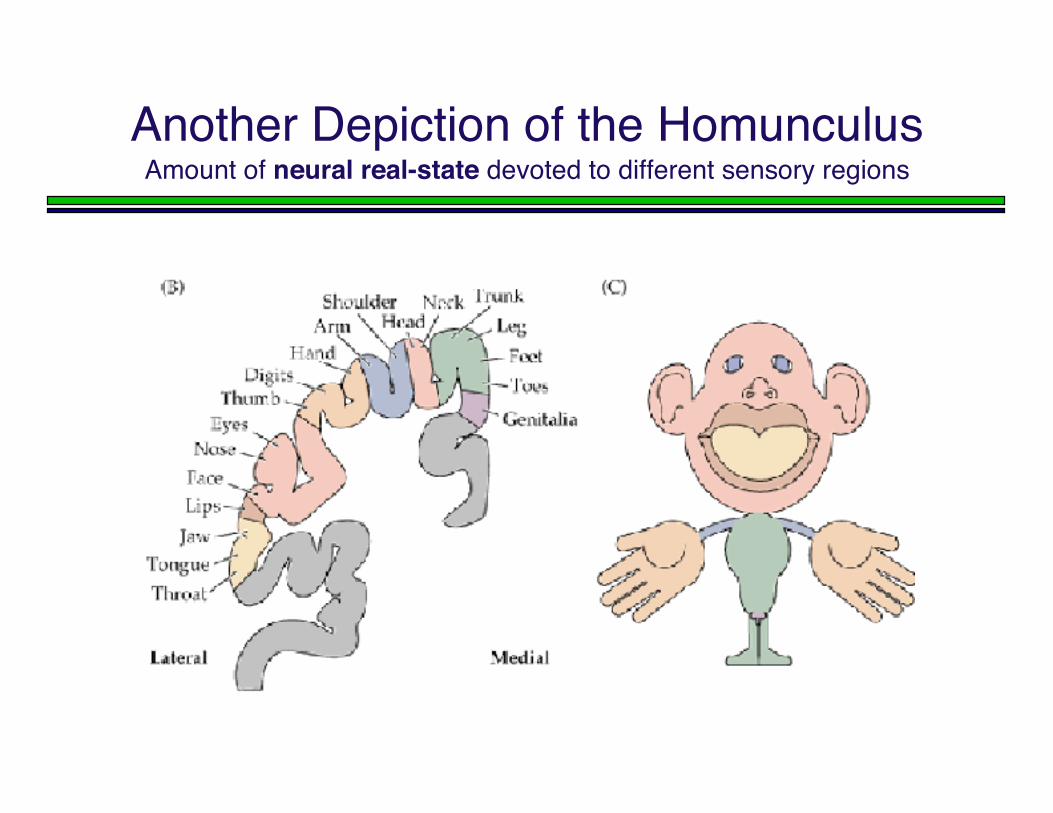
Another Depiction of the HomunculusAmount of neural real-state devoted to different sensory regions
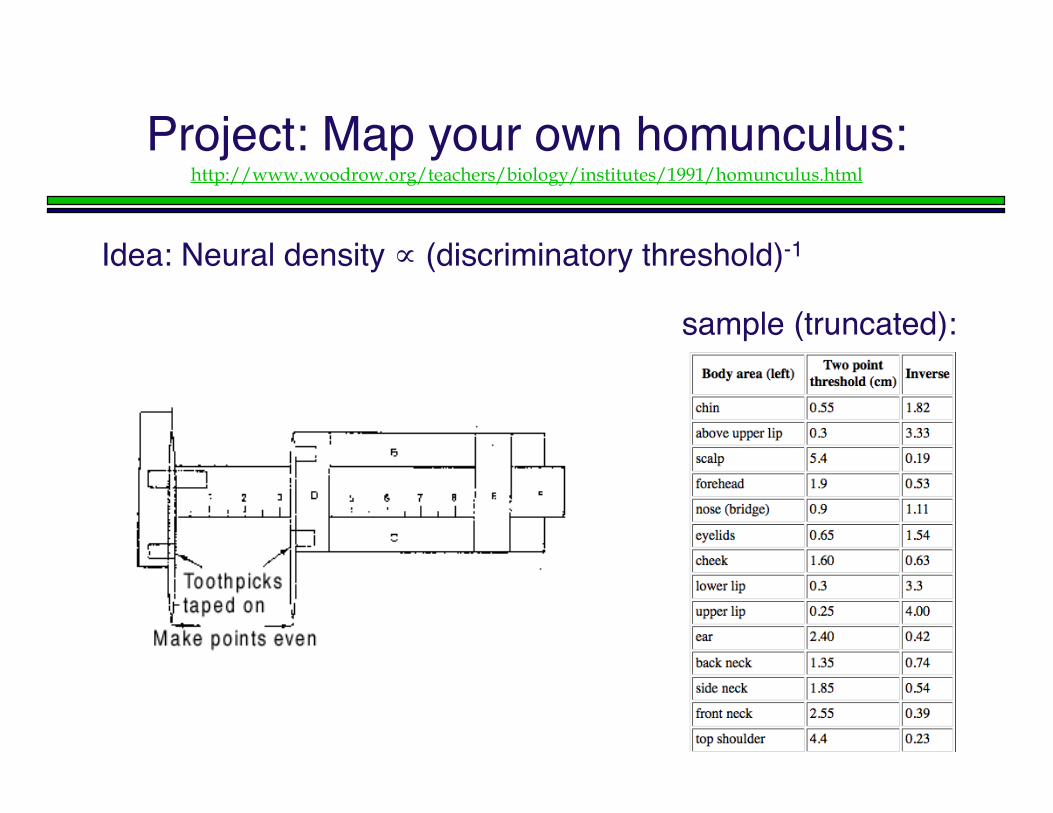
Project: Map your own homunculus:http://www.woodrow.org/teachers/biology/institutes/1991/homunculus.html
sample (truncated):
Idea: Neural density ∝ (discriminatory threshold)-1
Derivation of SOM
• Consider a spatial “field” of neurons.• Each neuron has an on-center, off-surround type of
behavior• Itʼs response is high to an input that occurs close by, low
otherwise.• When a stimulus is presented, neurons “compete” by
mutual lateral inhibition.• The winner and neurons in the neighborhood have
their weights strengthened in the direction (in weightspace) of the stimulus.
• Neurons tend to learn to respond to sets of similarstimulii.
Hubel and Wiesel Findings (1958)
• Simple cells in the visual cortex respond tospecific angular orientations of light bars.
• Complex cells respond to specific orientationand direction of motion.
• End-stopped cells respond to specificorientation, motion, and length.
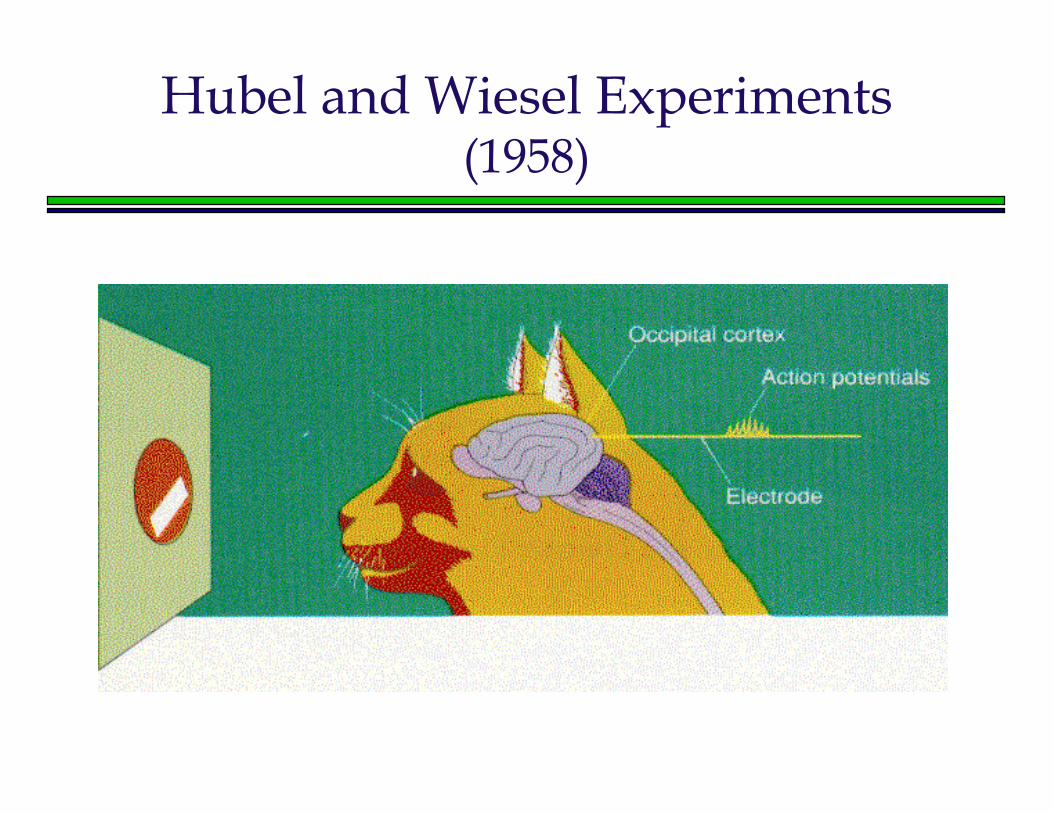
Hubel and Wiesel Experiments(1958)
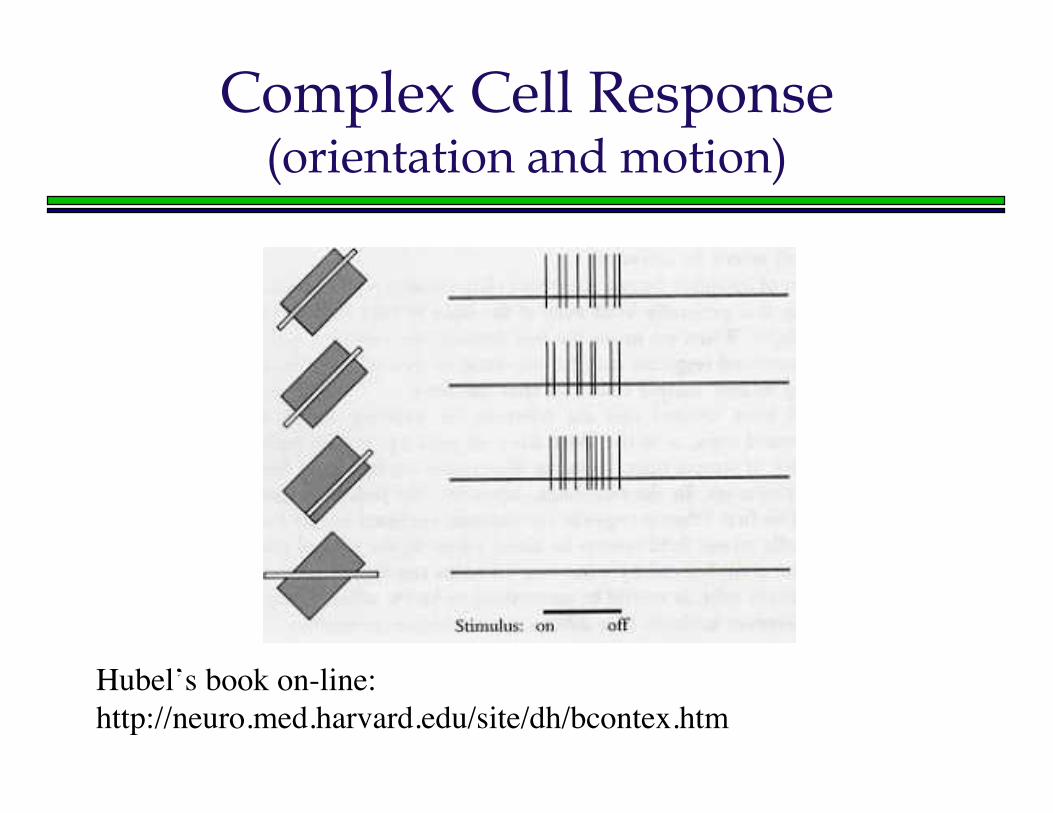
Complex Cell Response(orientation and motion)
Hubel’s book on-line:http://neuro.med.harvard.edu/site/dh/bcontex.htm
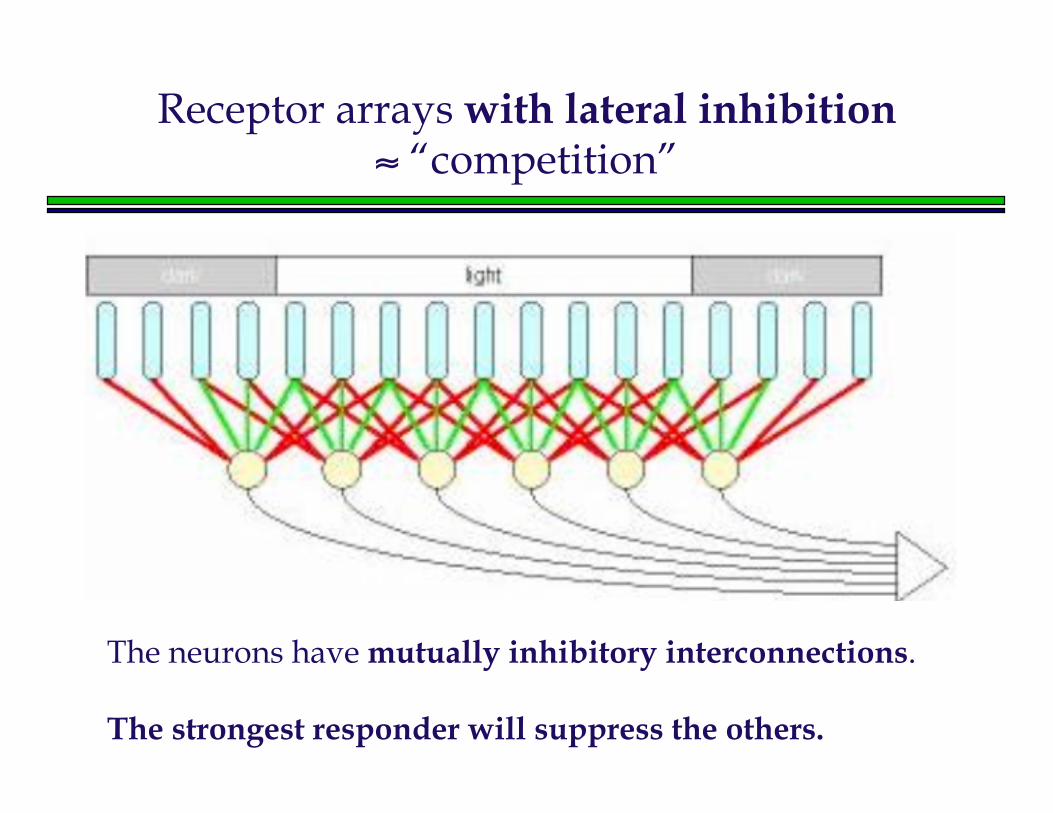
Receptor arrays with lateral inhibition≈ “competition”
The neurons have mutually inhibitory interconnections.
The strongest responder will suppress the others.
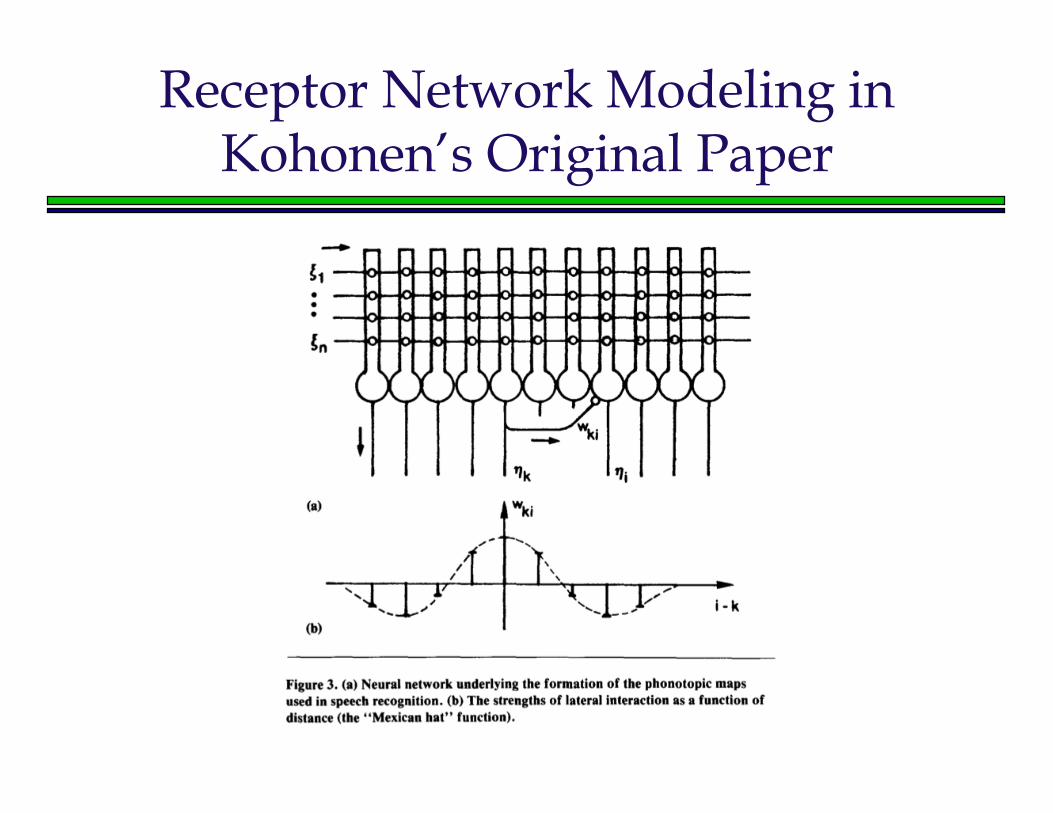
Receptor Network Modeling inKohonen’s Original Paper
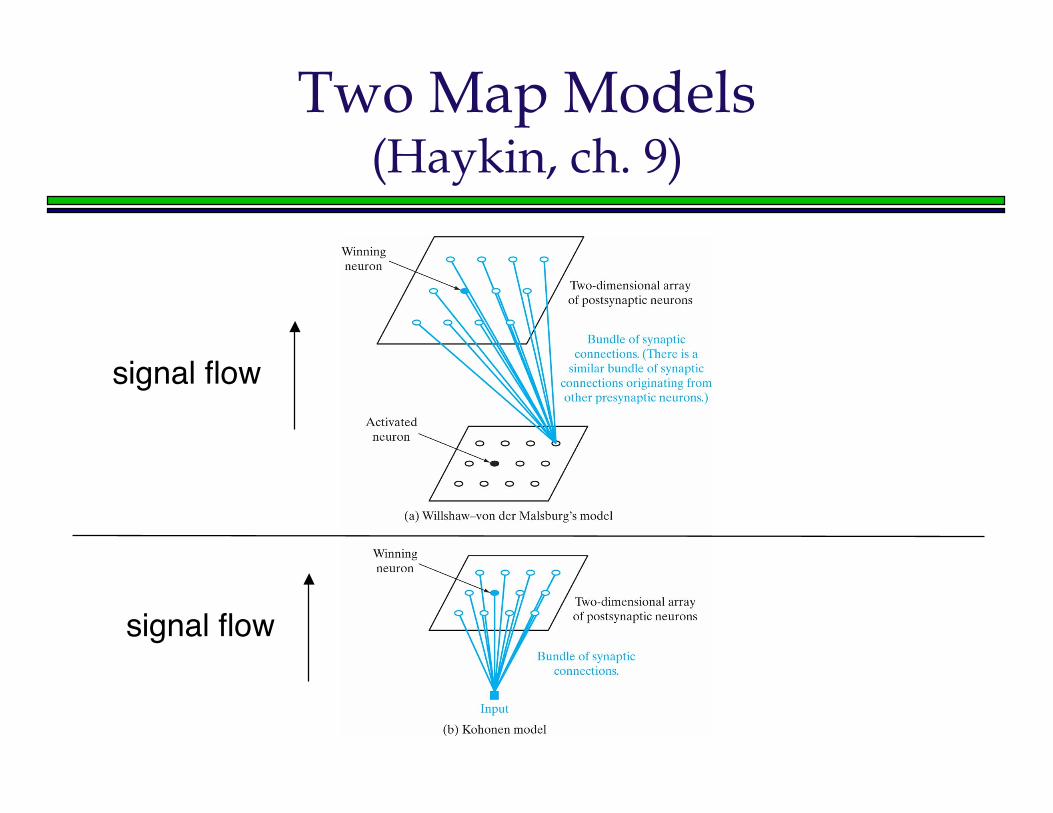
Two Map Models(Haykin, ch. 9)
signal flow
signal flow
Self-Organizing Map Modeling
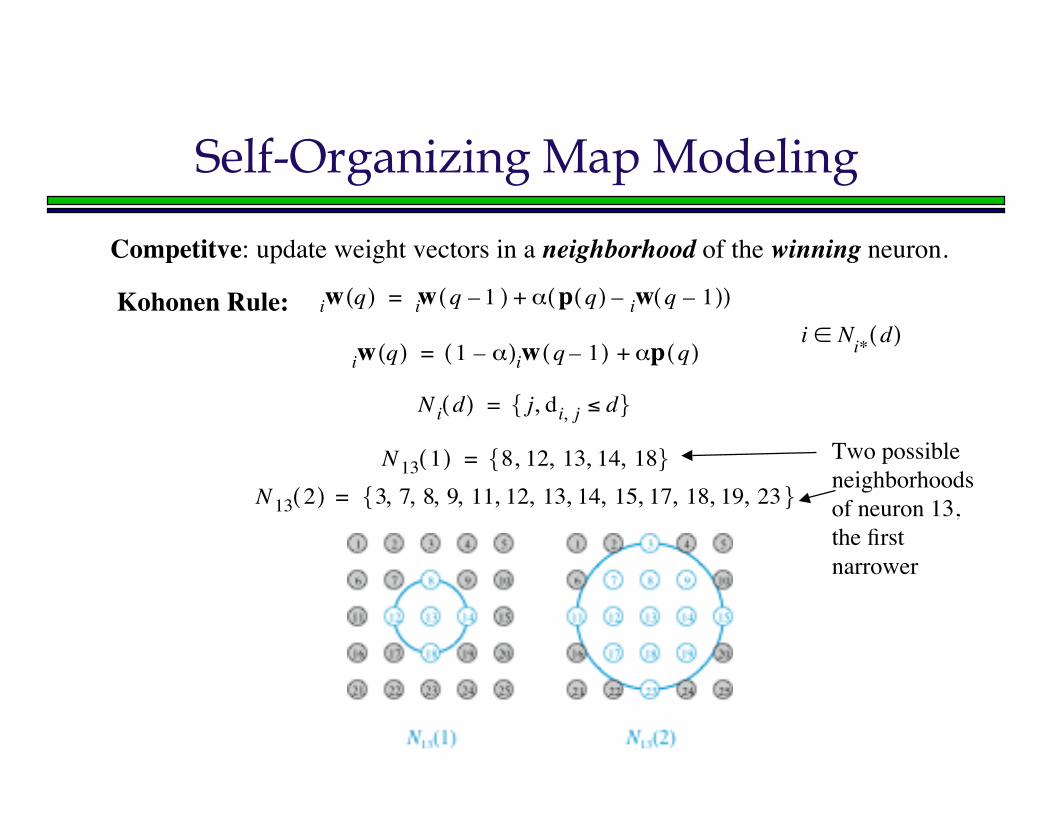
wi q( ) wi q 1–( ) ! p q( ) wi q 1–( )–( )+=
wi q( ) 1 !–( )wi q 1–( ) !p q( )+=i Ni! d( )"
Competitve: update weight vectors in a neighborhood of the winning neuron.
Ni d( ) j di j, d!,{ }=
N13 1( ) 8 12 13 14 18, , , ,{ }=N13 2( ) 3 7 8 9 11 12 13 14 15 17 18 19 23, , , , , , , , , , , ,{ }=
Kohonen Rule:
Two possibleneighborhoodsof neuron 13,the firstnarrower
Annealing Behavior
• As training progresses:• the learning rate is gradually reduced• the size of the neighborhood is gradually
reduced
• Neighborhood can be based on• Euclidean distance, or• Superimposed structure
Kohonen Learning Algorithm
• Repeatedly present input vectors untilresources exceeded:• At each vector presentation do the following:
• Find the node k whose weight vector is closest to thecurrent input vector.
• Train node k and all nodes in some neighborhood of k.• Decrease the learning rate slightly.• After every M cycles, decrease the size of the
neighborhood.
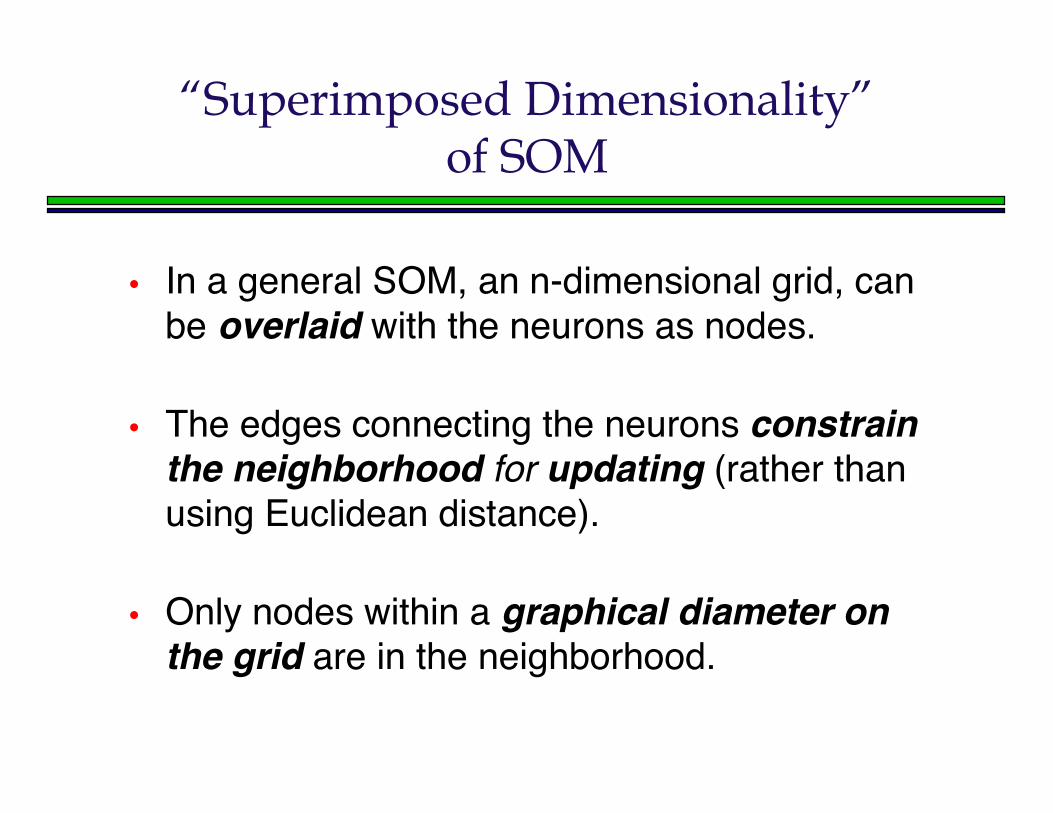
“Superimposed Dimensionality”of SOM
• In a general SOM, an n-dimensional grid, canbe overlaid with the neurons as nodes.
• The edges connecting the neurons constrainthe neighborhood for updating (rather thanusing Euclidean distance).
• Only nodes within a graphical diameter onthe grid are in the neighborhood.
Uses of “Imposed Dimensionality” inData Analysis
• Data points may have an unknown, but often large,underlying dimensionality, e.g. the underlyingphenomenon or process that has several dimensionsof attributes (such as color dimensions, various sizeor rate dimensions, etc.)
• By training a network with an imposed grid with agiven dimensionality, the relationships among thedata may become visualizable, especially if theimposed number of dimensions is small.
Uses of “Imposed Dimensionality” inData Analysis
• In other words, training the map “organizes”the data according to similarity in eachdimension.
Demo Applets
• /cs/cs152/kohonen/ demo1, demo2, demo3• Legend:
• black = input data point (random over a 2-Dregion; 2-dimensional data)
• red = neuron in winner neighborhood; learns byKohonen rule
• blue = other neuron• Learning rate and neighborhood both
decrease with time; demo speeds up overtime.
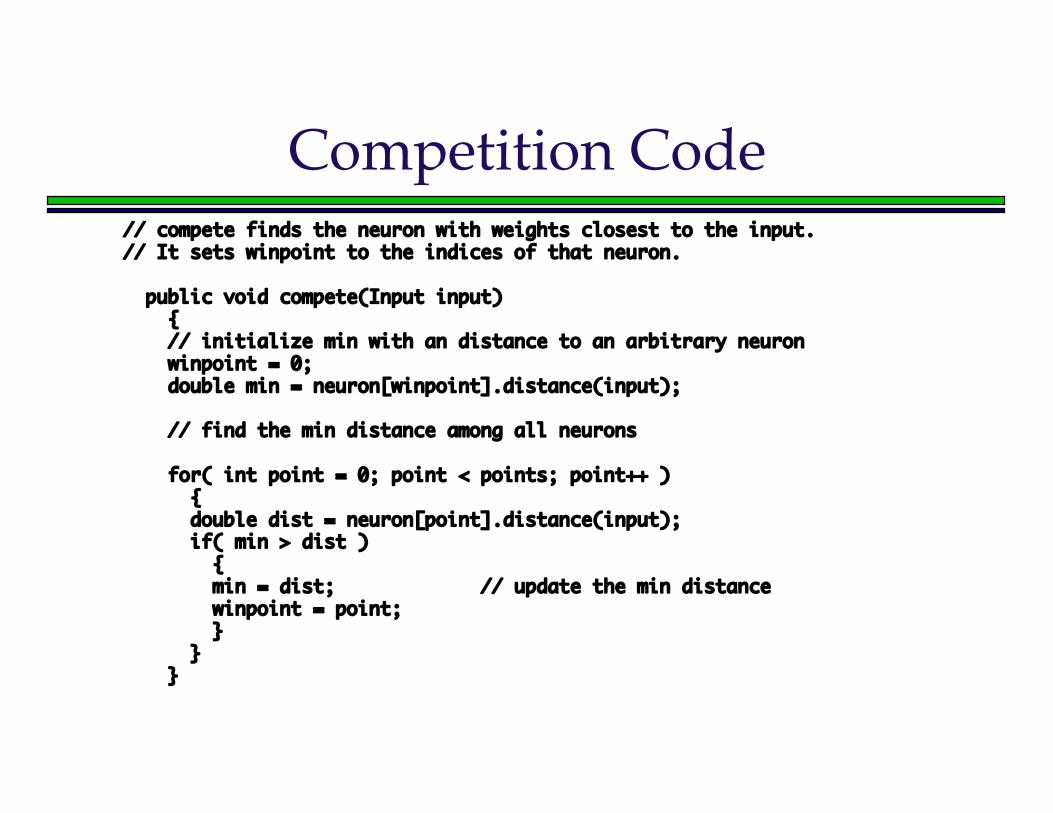
Competition Code// compete finds the neuron with weights closest to the input.// It sets winpoint to the indices of that neuron.
public void compete(Input input) { // initialize min with an distance to an arbitrary neuron winpoint = 0; double min = neuron[winpoint].distance(input);
// find the min distance among all neurons
for( int point = 0; point < points; point++ ) { double dist = neuron[point].distance(input); if( min > dist ) { min = dist; // update the min distance winpoint = point; } } }
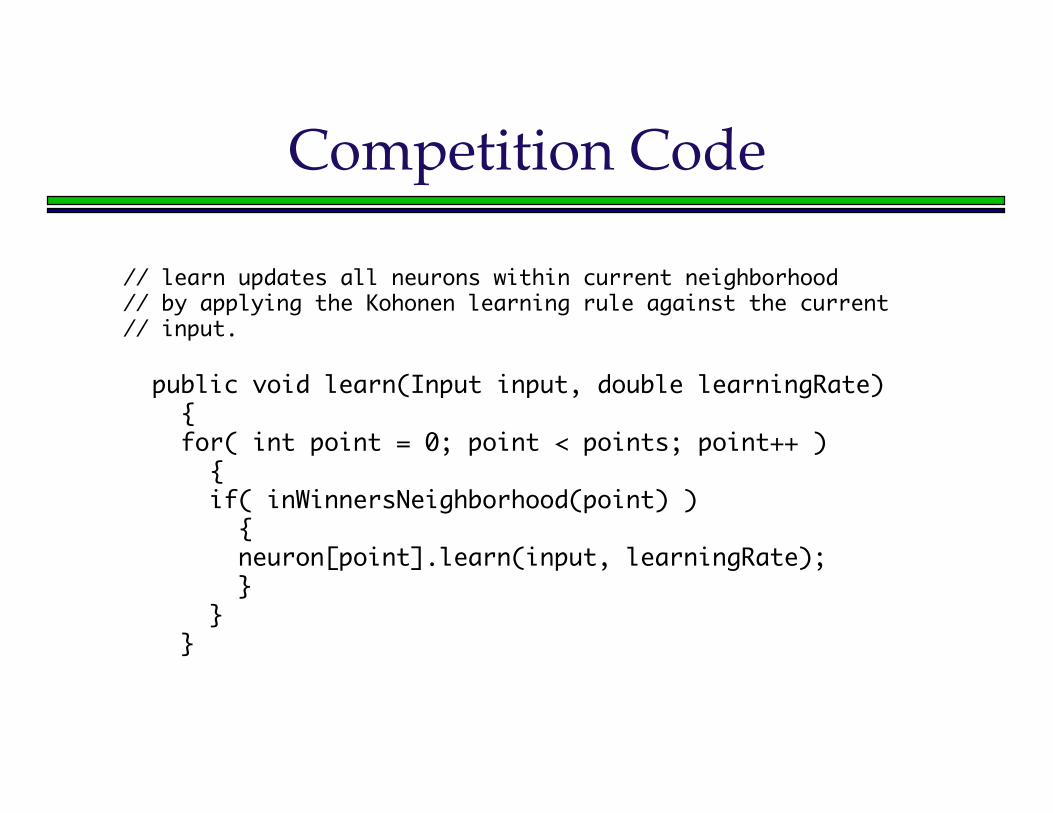
Competition Code
// learn updates all neurons within current neighborhood// by applying the Kohonen learning rule against the current// input.
public void learn(Input input, double learningRate) { for( int point = 0; point < points; point++ ) { if( inWinnersNeighborhood(point) ) { neuron[point].learn(input, learningRate); } } }
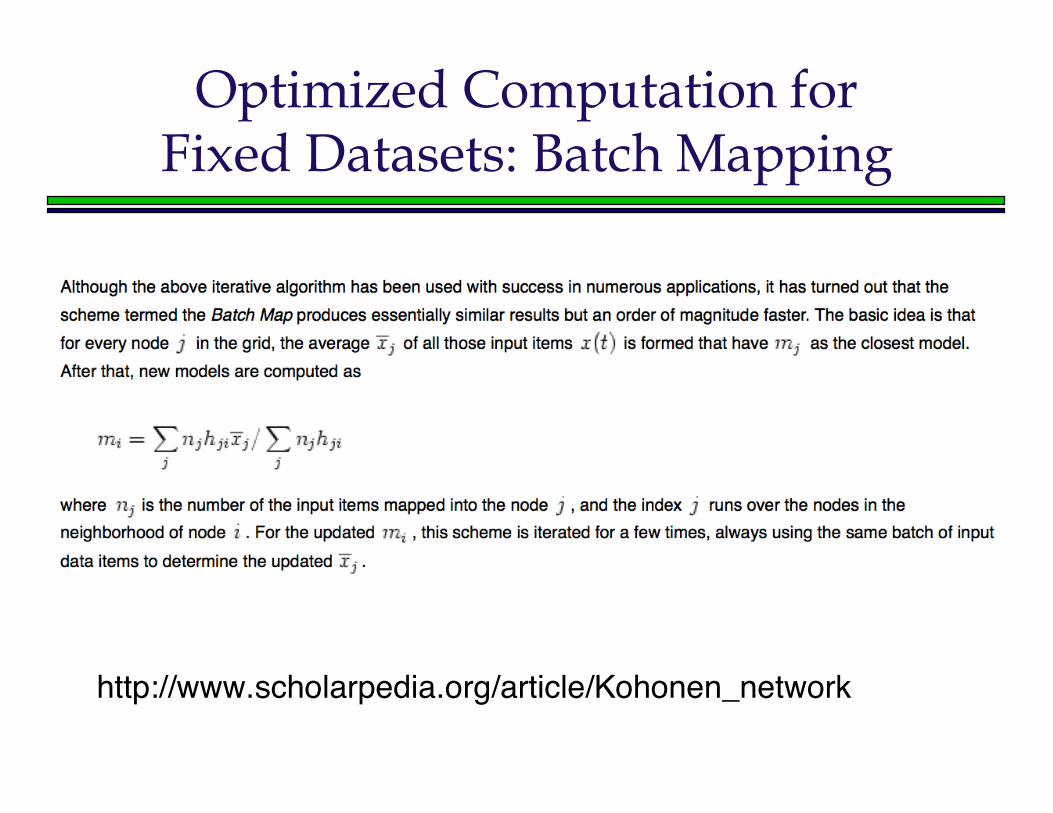
Optimized Computation forFixed Datasets: Batch Mapping
http://www.scholarpedia.org/article/Kohonen_network
Phonetic Typewriter:Kohonen’s Original Application
• Objective: Spoken words →phonemes• Languages: Finnish, Japanese• Claimed > 92% accuracy in 10 mins. of
training.
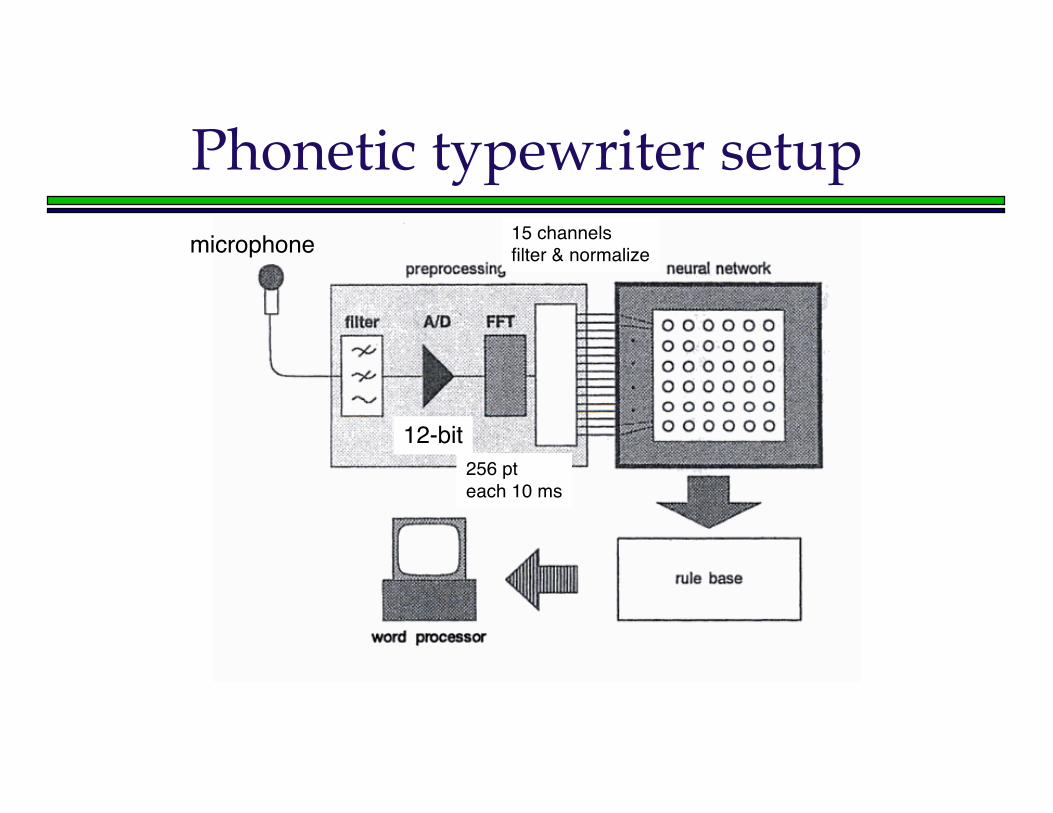
microphone
12-bit256 pteach 10 ms
15 channelsfilter & normalize
Phonetic typewriter setup
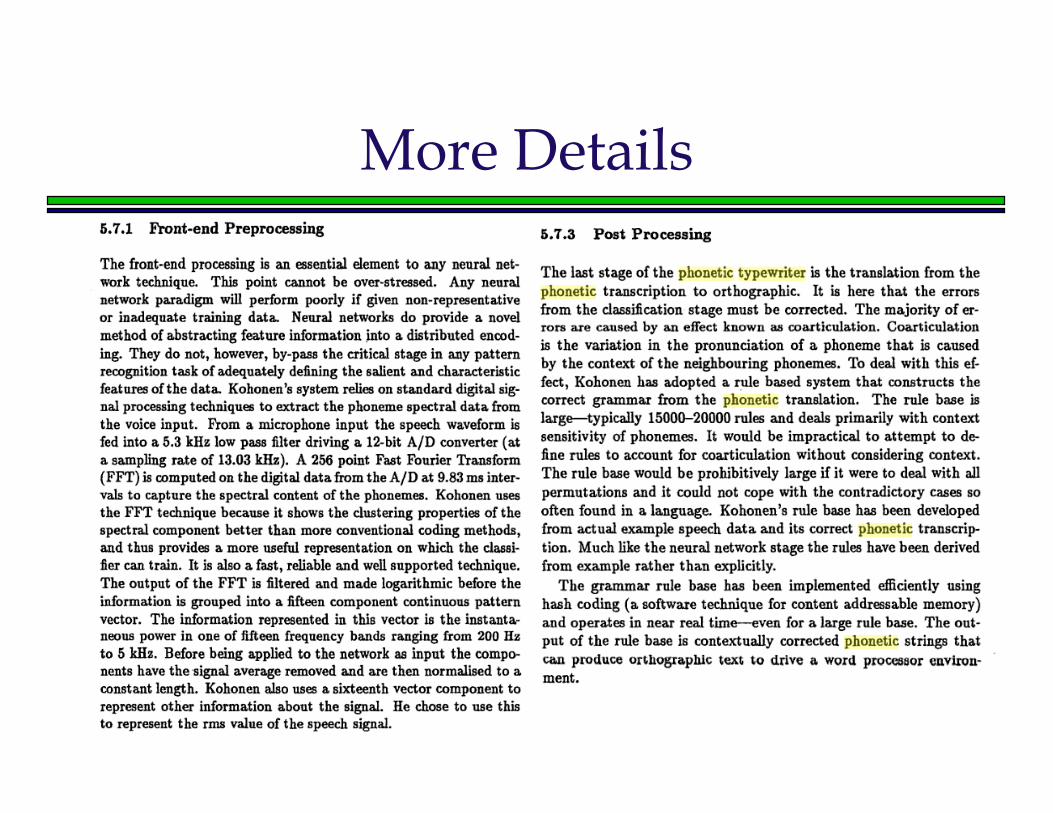
More Details
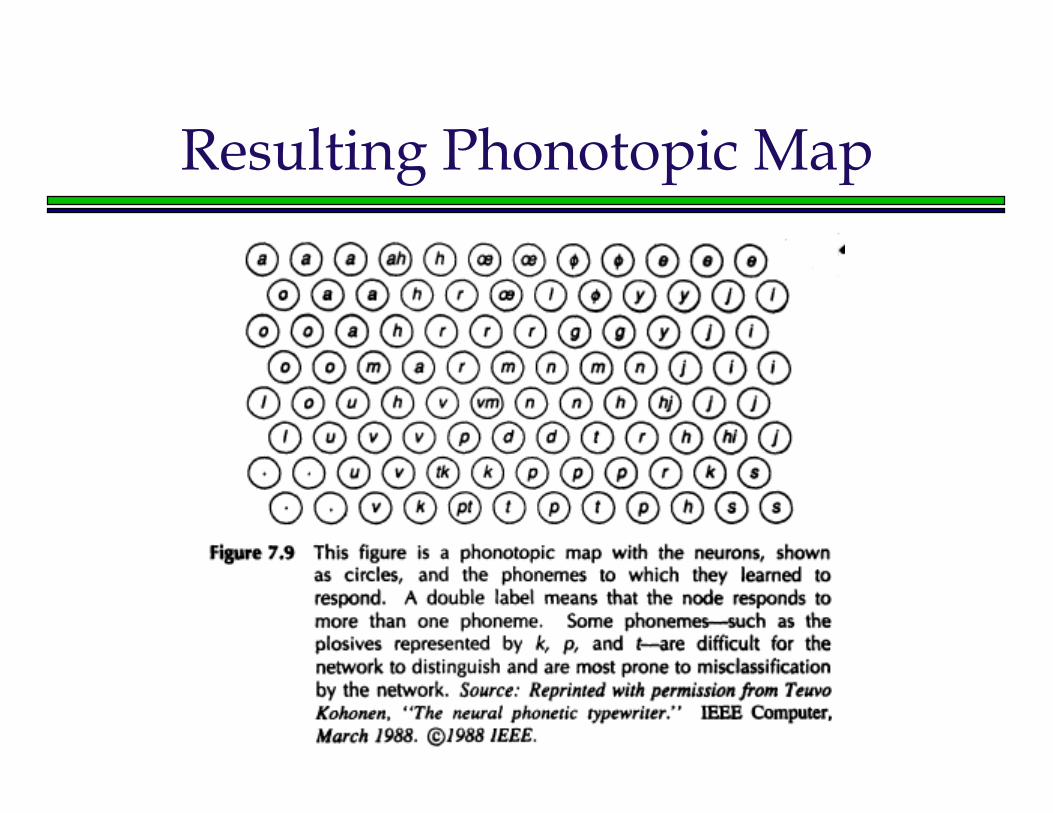
Resulting Phonotopic Map
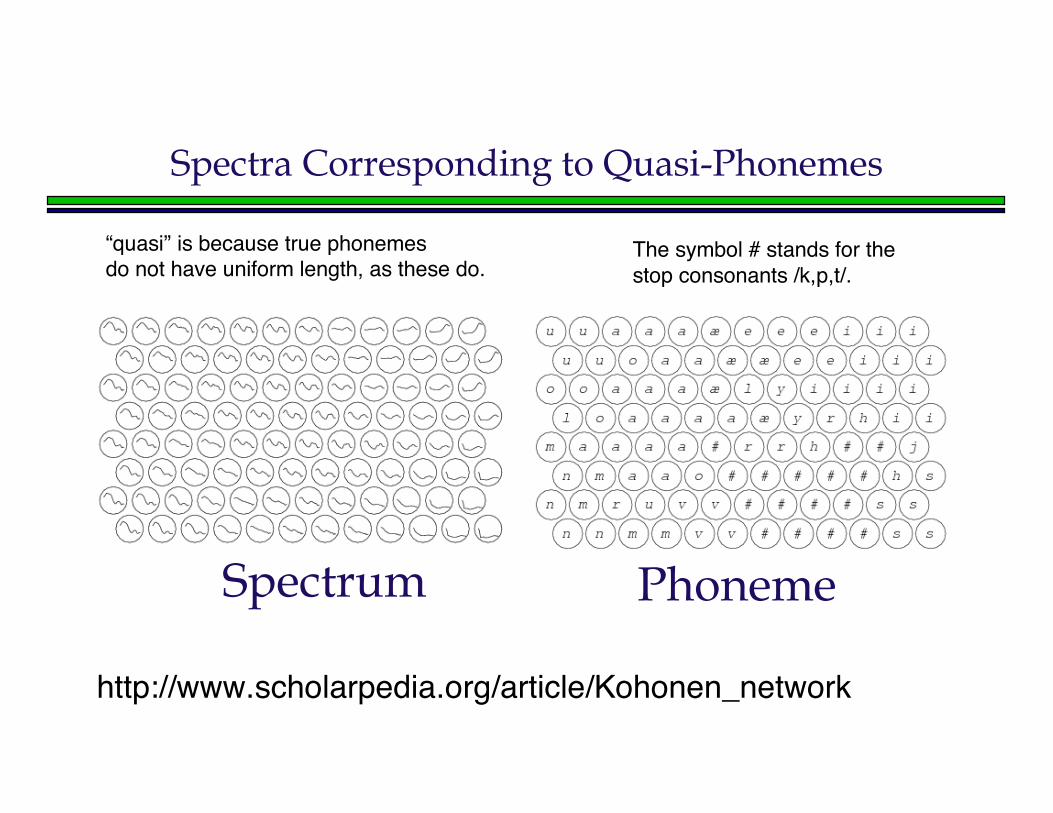
Spectra Corresponding to Quasi-Phonemes
Spectrum Phoneme
http://www.scholarpedia.org/article/Kohonen_network
The symbol # stands for the stop consonants /k,p,t/.
“quasi” is because true phonemesdo not have uniform length, as these do.
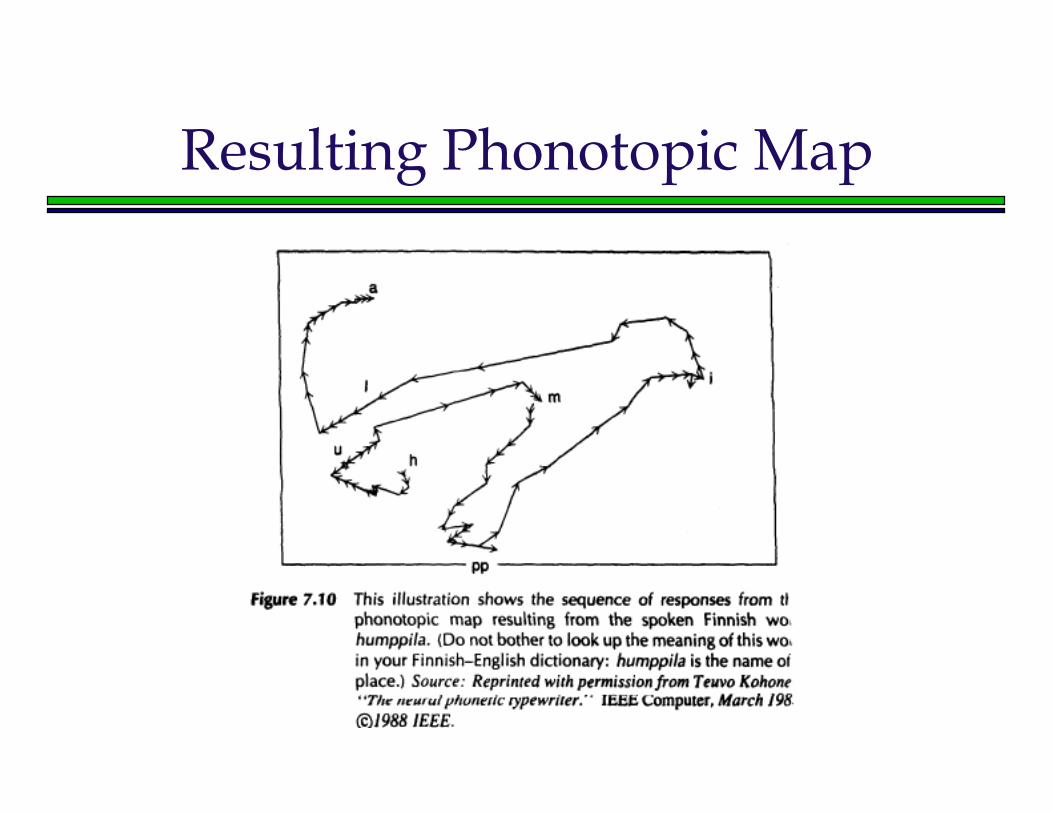
Resulting Phonotopic Map
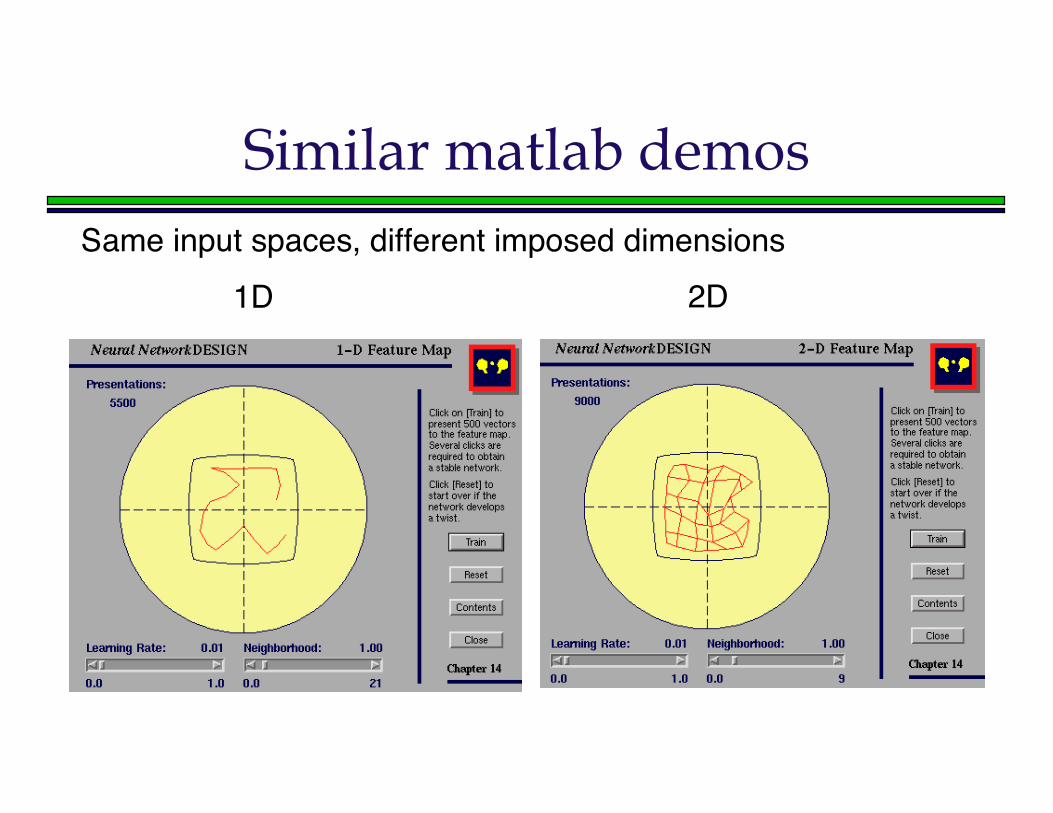
Similar matlab demosSame input spaces, different imposed dimensions
1D 2D
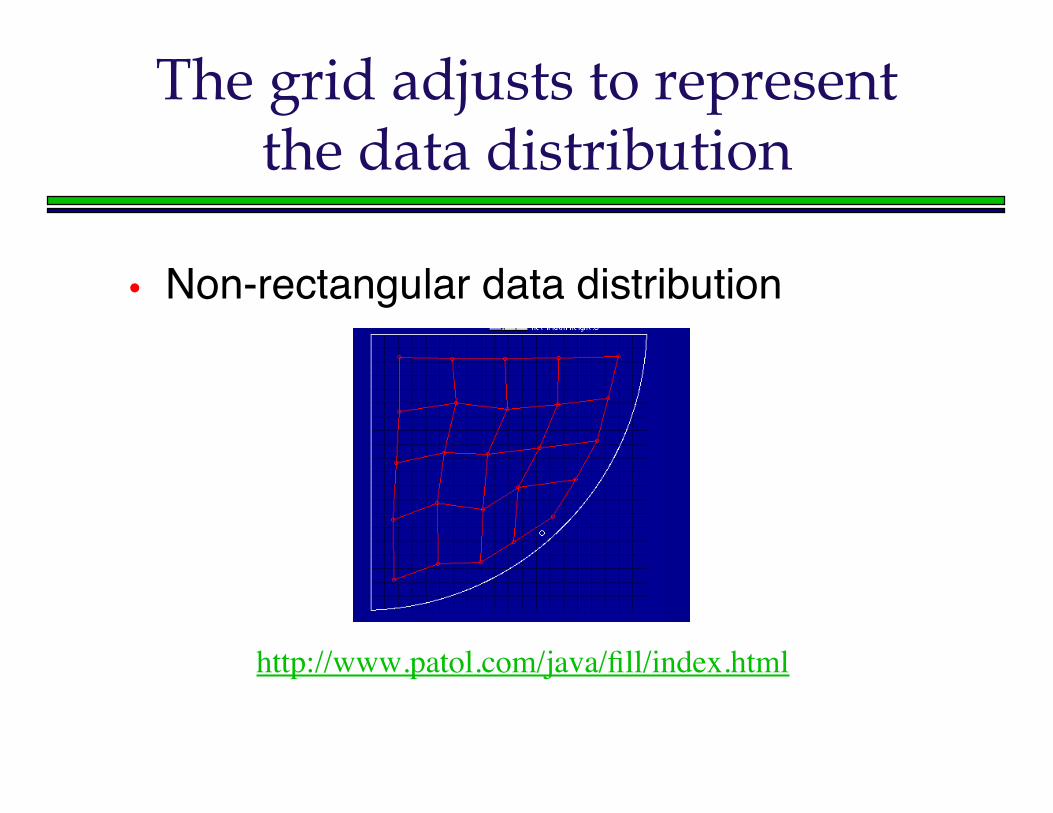
The grid adjusts to representthe data distribution
• Non-rectangular data distribution
http://www.patol.com/java/fill/index.html
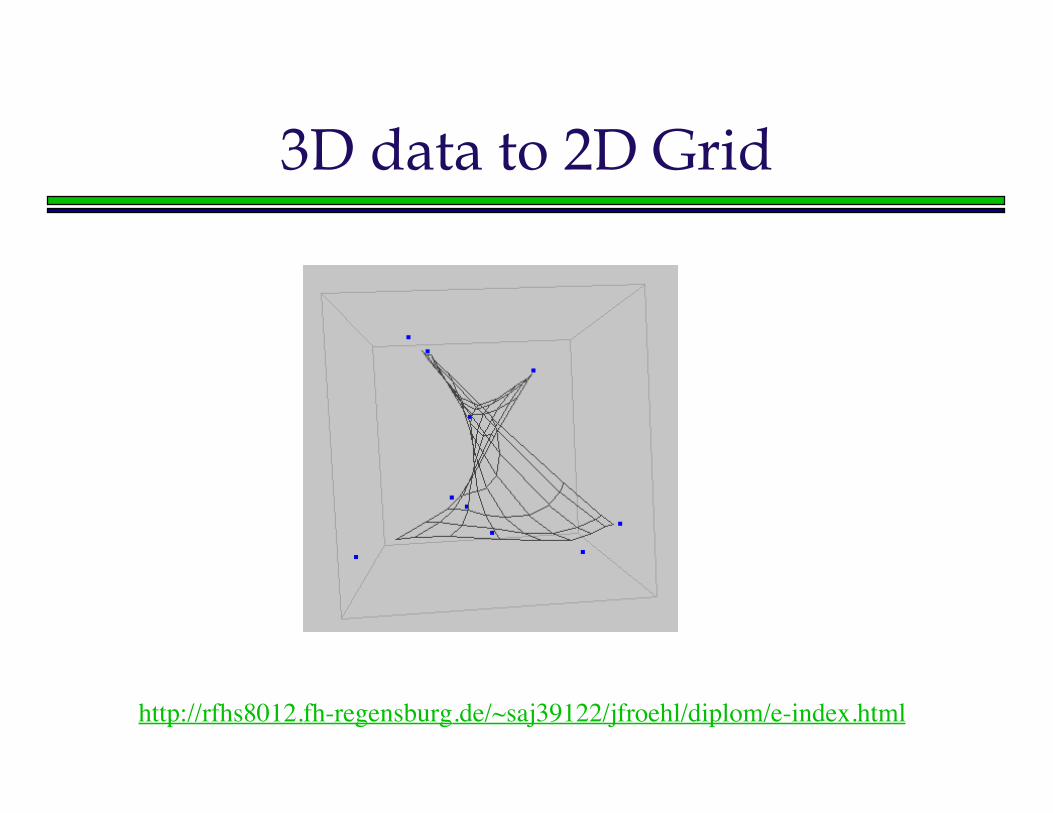
3D data to 2D Grid
http://rfhs8012.fh-regensburg.de/~saj39122/jfroehl/diplom/e-index.html
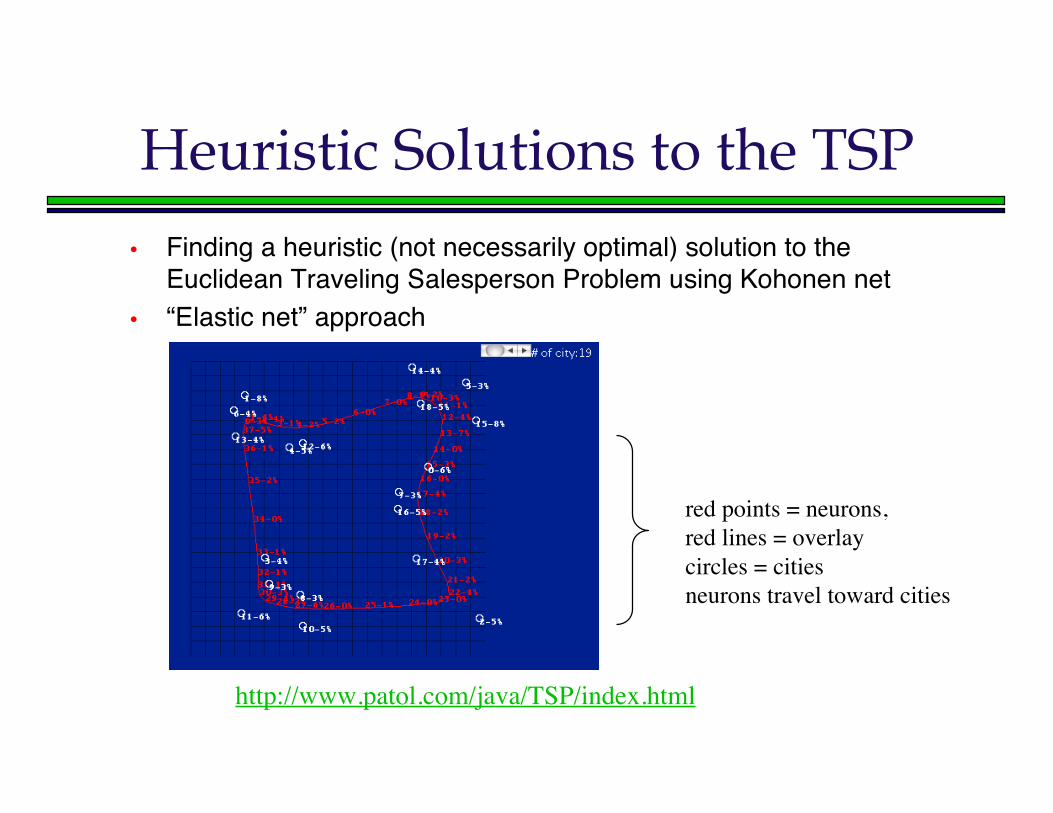
Heuristic Solutions to the TSP• Finding a heuristic (not necessarily optimal) solution to the
Euclidean Traveling Salesperson Problem using Kohonen net• “Elastic net” approach
http://www.patol.com/java/TSP/index.html
red points = neurons,red lines = overlaycircles = citiesneurons travel toward cities
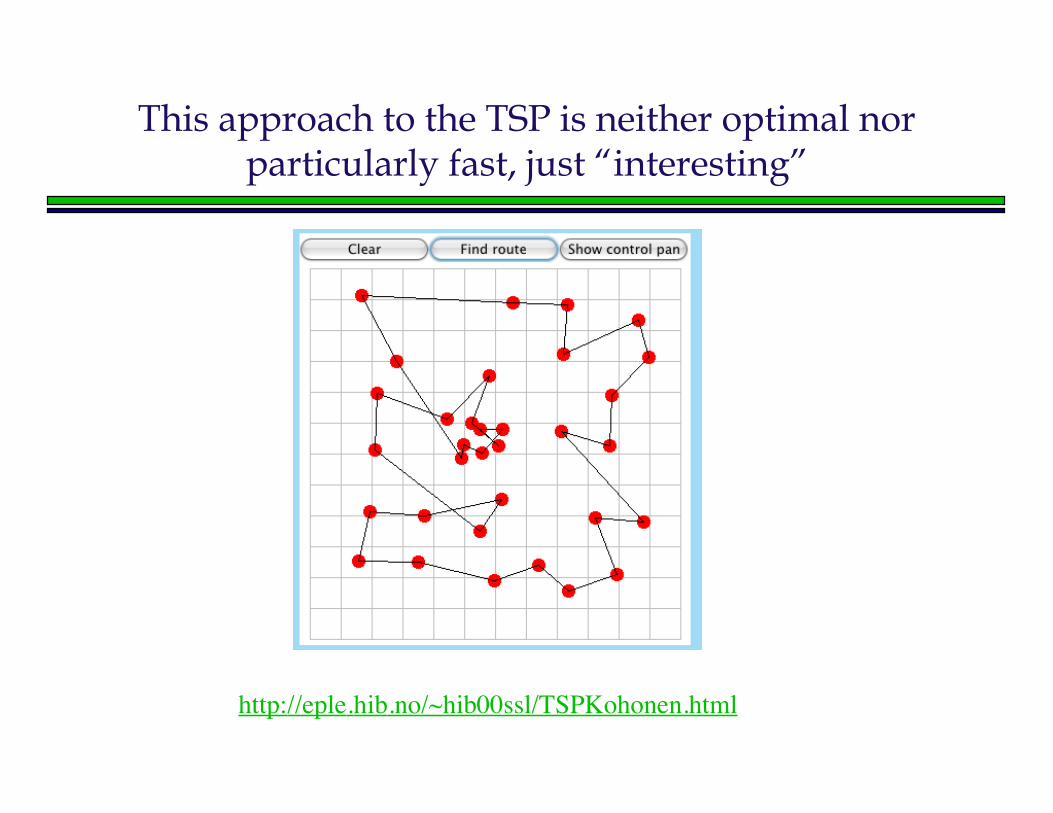
This approach to the TSP is neither optimal norparticularly fast, just “interesting”
http://eple.hib.no/~hib00ssl/TSPKohonen.html
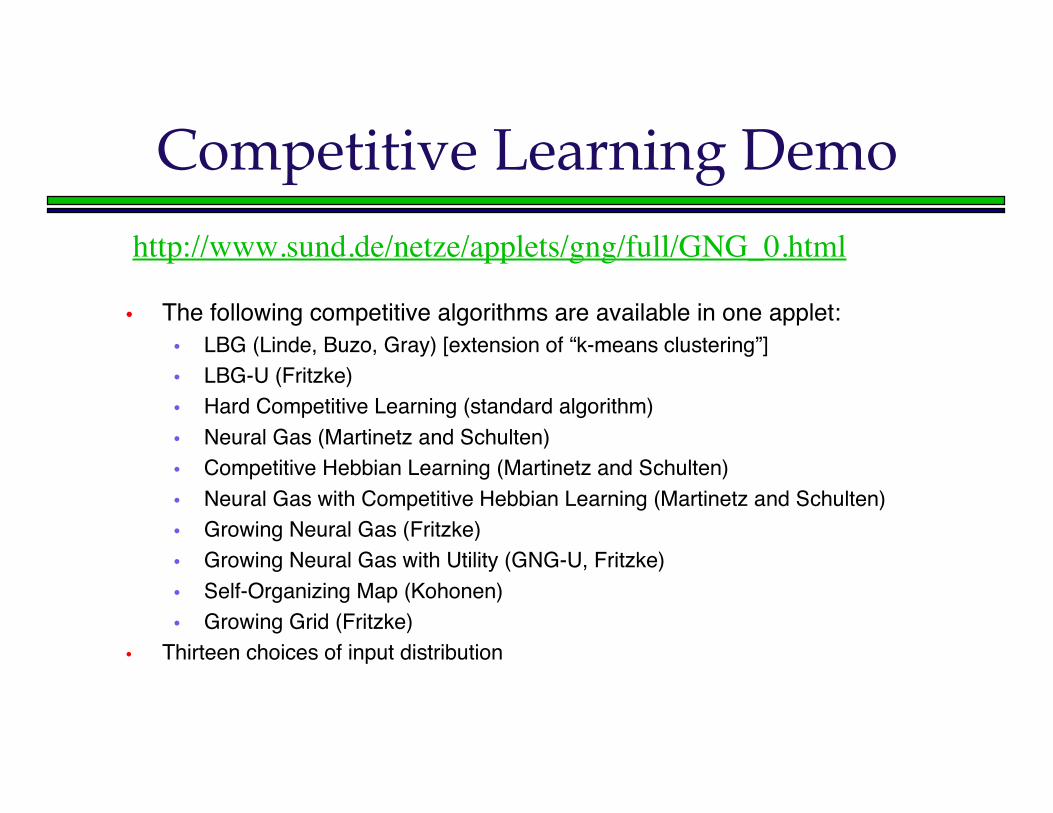
Competitive Learning Demo
• The following competitive algorithms are available in one applet:• LBG (Linde, Buzo, Gray) [extension of “k-means clustering”]• LBG-U (Fritzke)• Hard Competitive Learning (standard algorithm)• Neural Gas (Martinetz and Schulten)• Competitive Hebbian Learning (Martinetz and Schulten)• Neural Gas with Competitive Hebbian Learning (Martinetz and Schulten)• Growing Neural Gas (Fritzke)• Growing Neural Gas with Utility (GNG-U, Fritzke)• Self-Organizing Map (Kohonen)• Growing Grid (Fritzke)
• Thirteen choices of input distribution
http://www.sund.de/netze/applets/gng/full/GNG_0.html
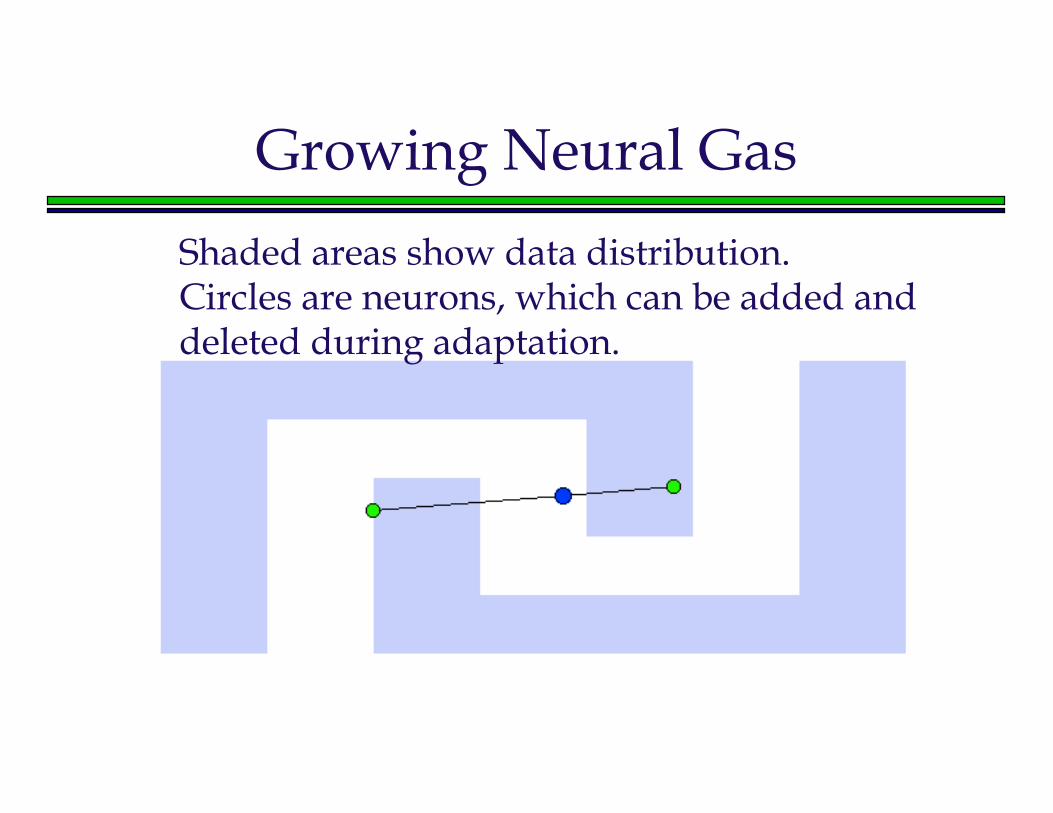
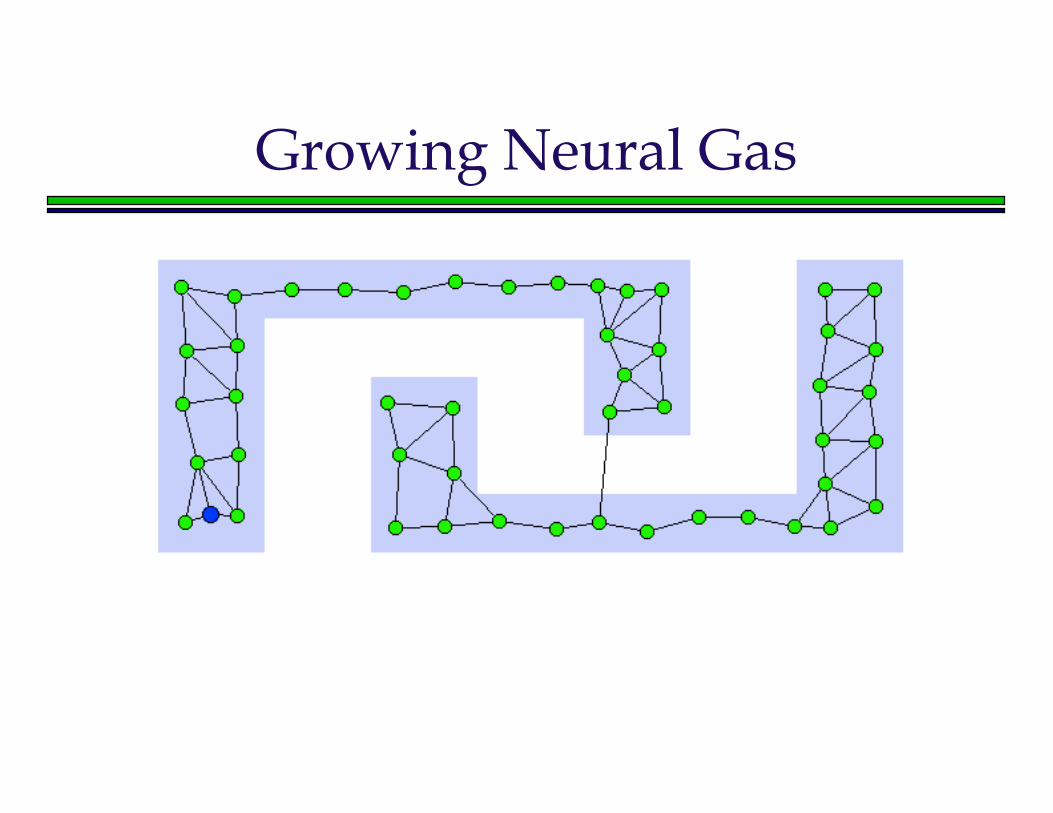
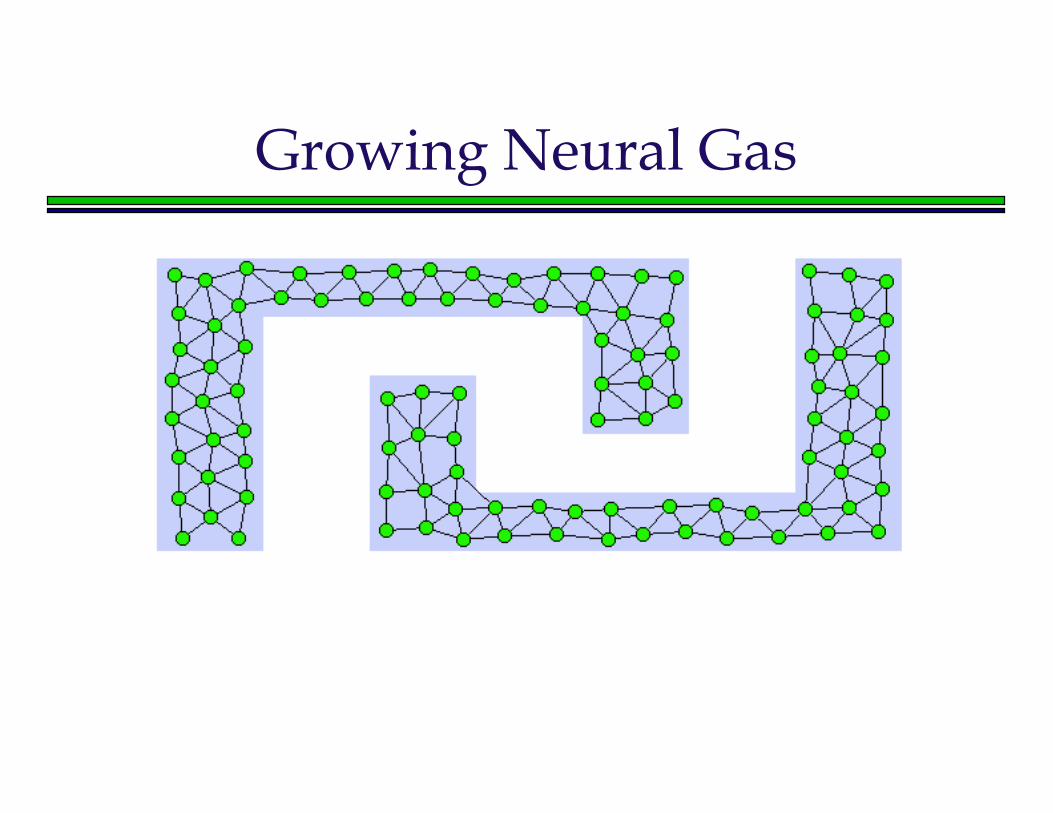
Growing Neural Gas
Shaded areas show data distribution.Circles are neurons, which can be added anddeleted during adaptation.
Growing Neural Gas
Growing Neural Gas
Unsupervised Applications of SOMs
• Discovering similarities in data (clustering)
• Data-mining
• KDD (Knowledge Discovery in Databases)
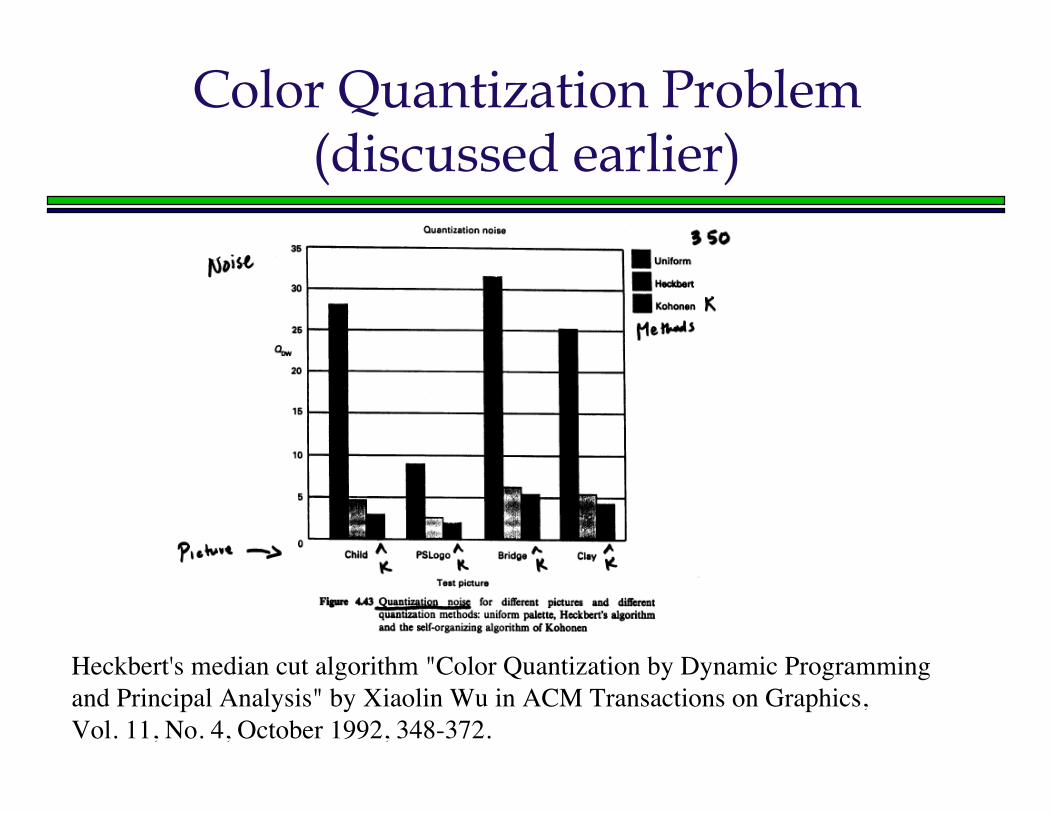
Color Quantization Problem(discussed earlier)
Heckbert's median cut algorithm "Color Quantization by Dynamic Programming and Principal Analysis" by Xiaolin Wu in ACM Transactions on Graphics, Vol. 11, No. 4, October 1992, 348-372.
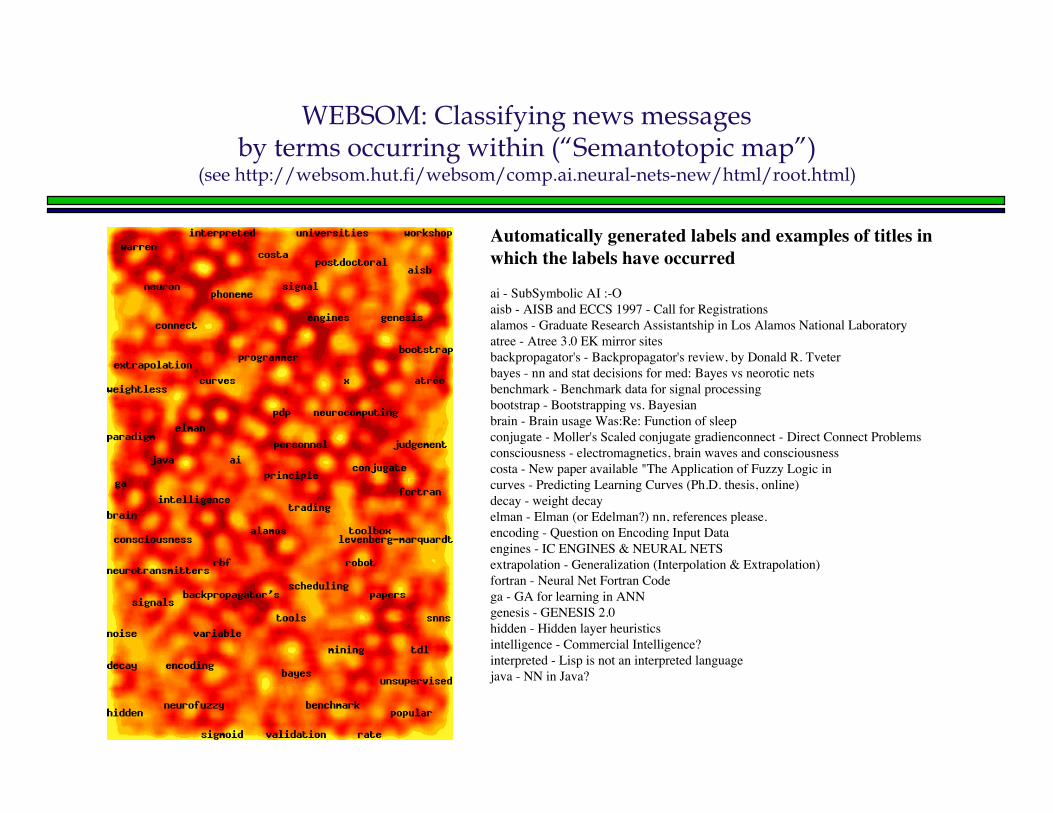
WEBSOM: Classifying news messagesby terms occurring within (“Semantotopic map”)
(see http://websom.hut.fi/websom/comp.ai.neural-nets-new/html/root.html)
Automatically generated labels and examples of titles inwhich the labels have occurred
ai - SubSymbolic AI :-Oaisb - AISB and ECCS 1997 - Call for Registrationsalamos - Graduate Research Assistantship in Los Alamos National Laboratoryatree - Atree 3.0 EK mirror sitesbackpropagator's - Backpropagator's review, by Donald R. Tveterbayes - nn and stat decisions for med: Bayes vs neorotic netsbenchmark - Benchmark data for signal processingbootstrap - Bootstrapping vs. Bayesianbrain - Brain usage Was:Re: Function of sleepconjugate - Moller's Scaled conjugate gradienconnect - Direct Connect Problemsconsciousness - electromagnetics, brain waves and consciousnesscosta - New paper available "The Application of Fuzzy Logic incurves - Predicting Learning Curves (Ph.D. thesis, online)decay - weight decayelman - Elman (or Edelman?) nn, references please.encoding - Question on Encoding Input Dataengines - IC ENGINES & NEURAL NETSextrapolation - Generalization (Interpolation & Extrapolation)fortran - Neural Net Fortran Codega - GA for learning in ANNgenesis - GENESIS 2.0hidden - Hidden layer heuristicsintelligence - Commercial Intelligence?interpreted - Lisp is not an interpreted languagejava - NN in Java?
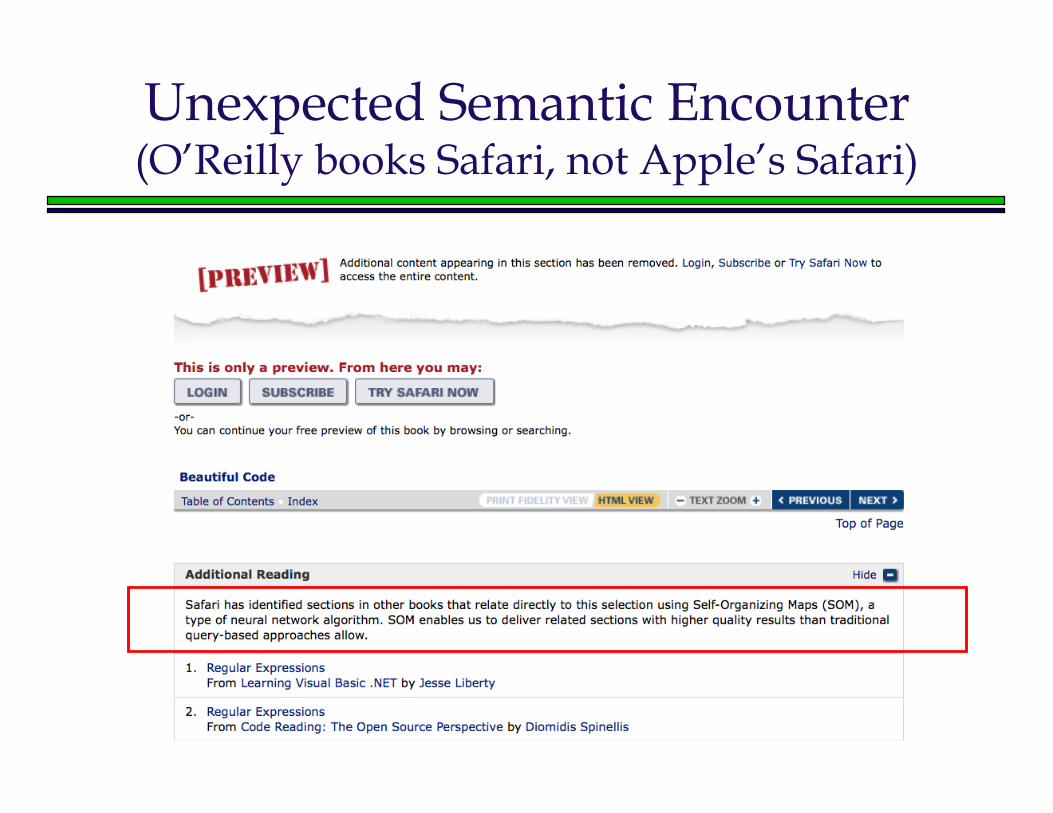
Unexpected Semantic Encounter(O’Reilly books Safari, not Apple’s Safari)
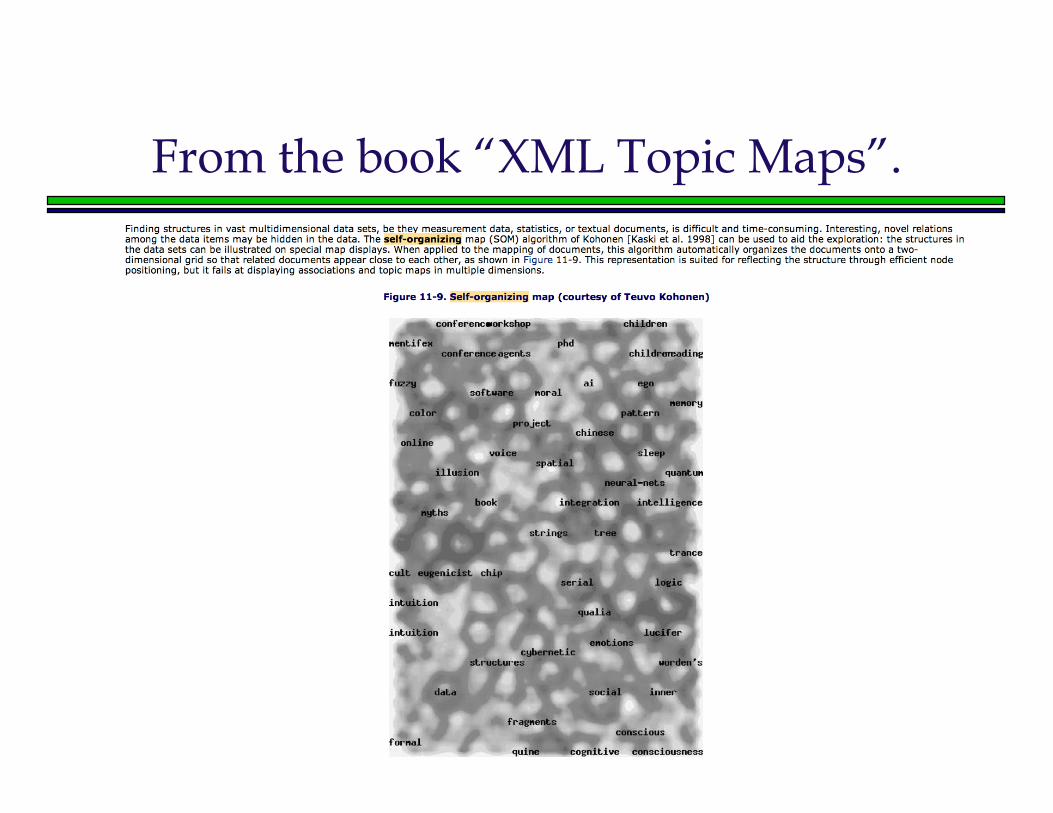
From the book “XML Topic Maps”.
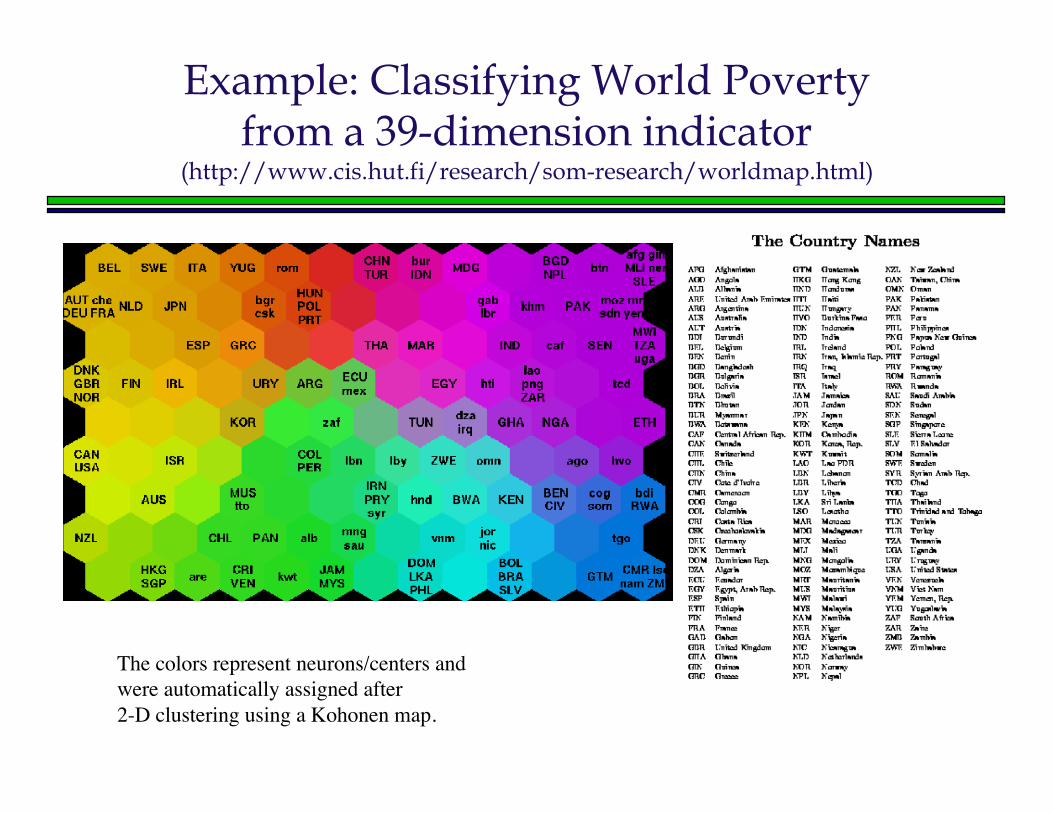
Example: Classifying World Povertyfrom a 39-dimension indicator
(http://www.cis.hut.fi/research/som-research/worldmap.html)
The colors represent neurons/centers and were automatically assigned after2-D clustering using a Kohonen map.
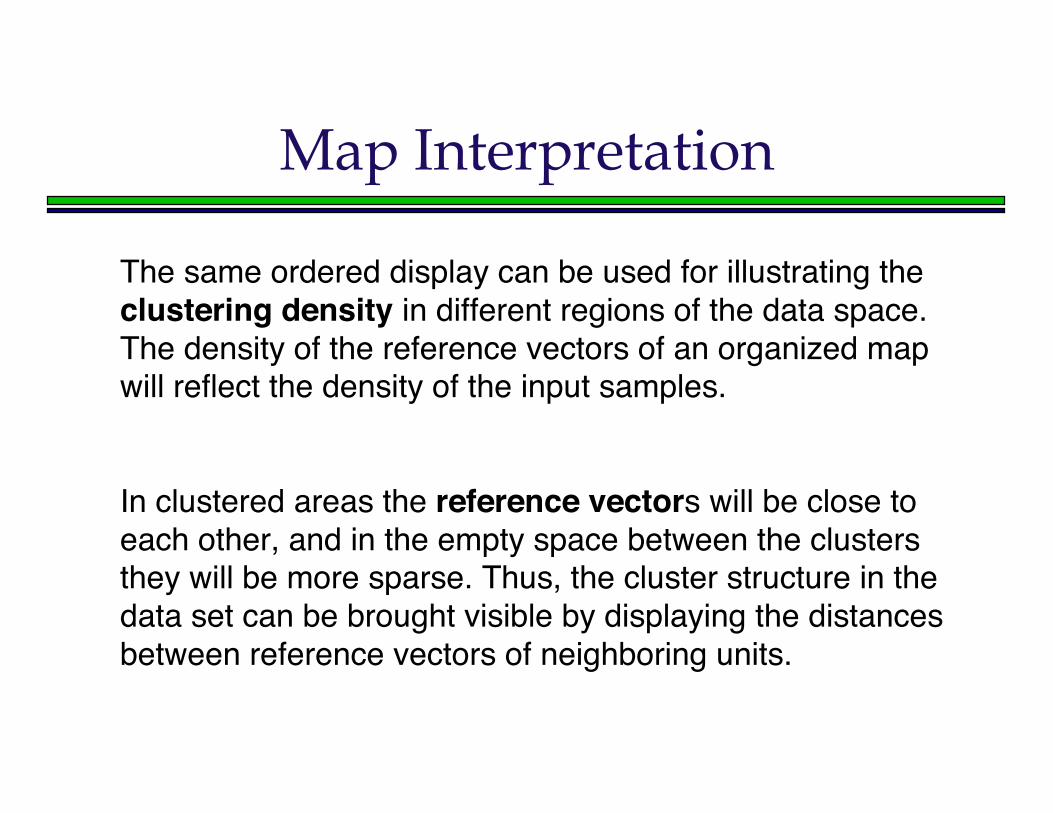
Map Interpretation
The same ordered display can be used for illustrating theclustering density in different regions of the data space.The density of the reference vectors of an organized mapwill reflect the density of the input samples.
In clustered areas the reference vectors will be close toeach other, and in the empty space between the clustersthey will be more sparse. Thus, the cluster structure in thedata set can be brought visible by displaying the distancesbetween reference vectors of neighboring units.
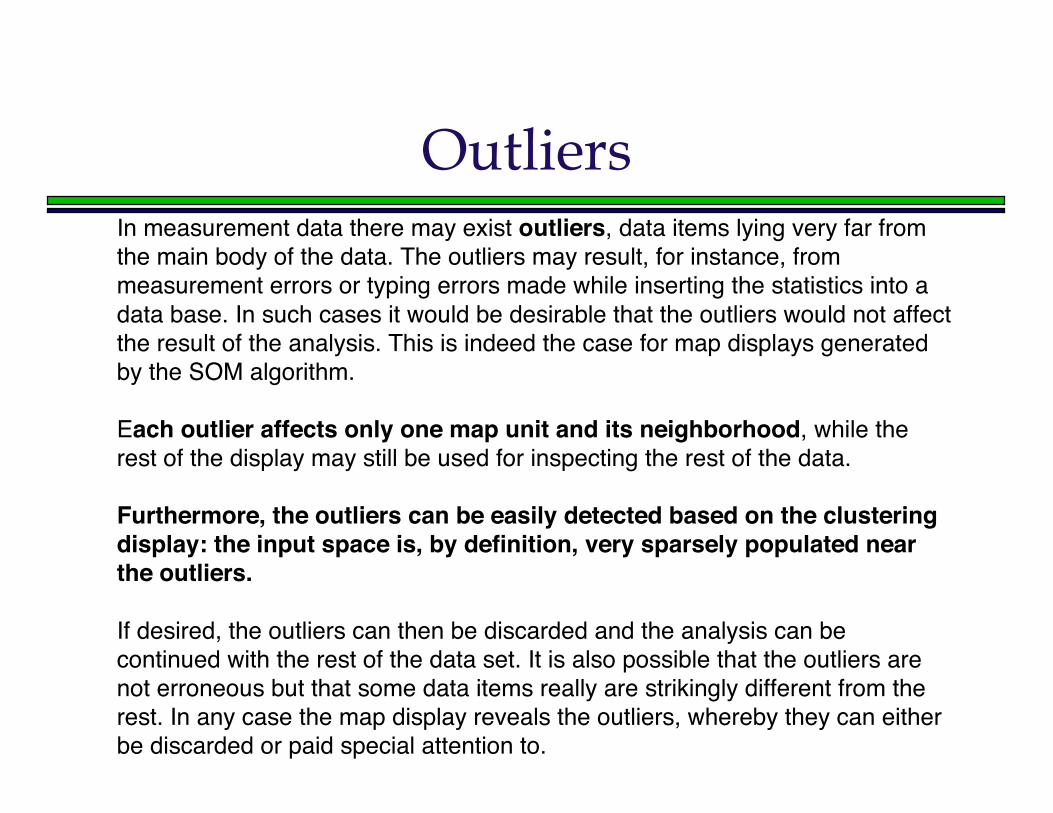
OutliersIn measurement data there may exist outliers, data items lying very far fromthe main body of the data. The outliers may result, for instance, frommeasurement errors or typing errors made while inserting the statistics into adata base. In such cases it would be desirable that the outliers would not affectthe result of the analysis. This is indeed the case for map displays generatedby the SOM algorithm.
Each outlier affects only one map unit and its neighborhood, while therest of the display may still be used for inspecting the rest of the data.
Furthermore, the outliers can be easily detected based on the clusteringdisplay: the input space is, by definition, very sparsely populated nearthe outliers.
If desired, the outliers can then be discarded and the analysis can becontinued with the rest of the data set. It is also possible that the outliers arenot erroneous but that some data items really are strikingly different from therest. In any case the map display reveals the outliers, whereby they can eitherbe discarded or paid special attention to.
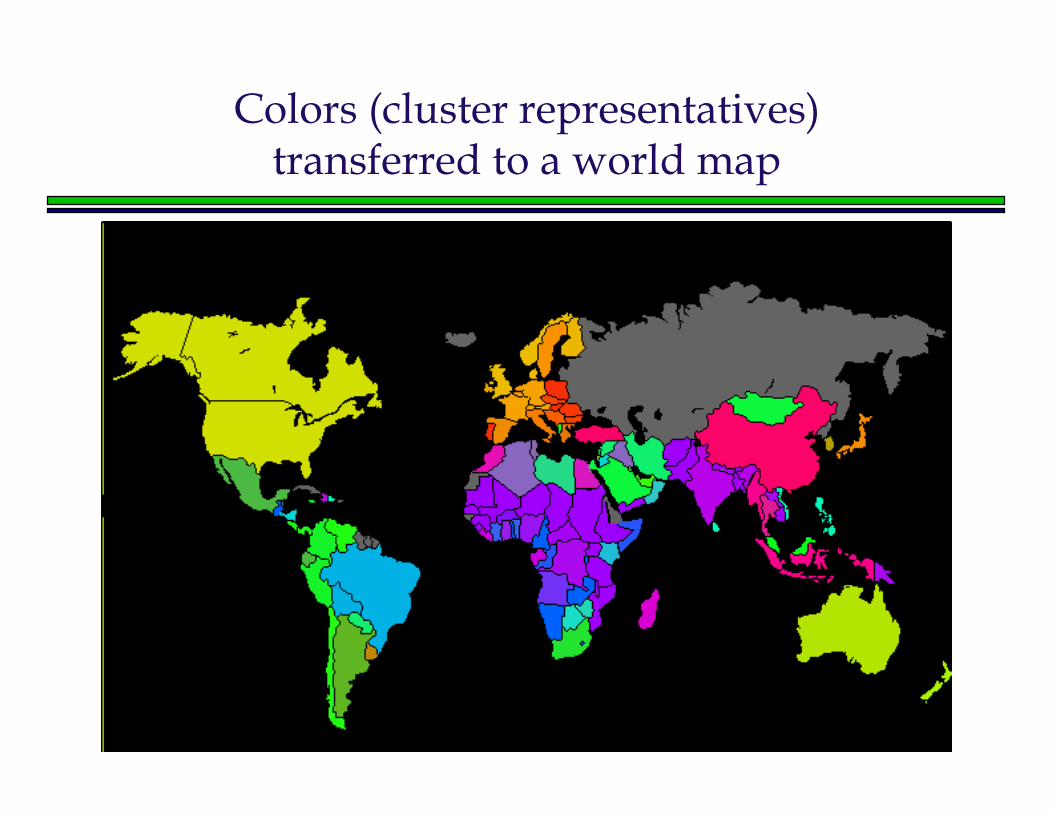
Colors (cluster representatives)transferred to a world map
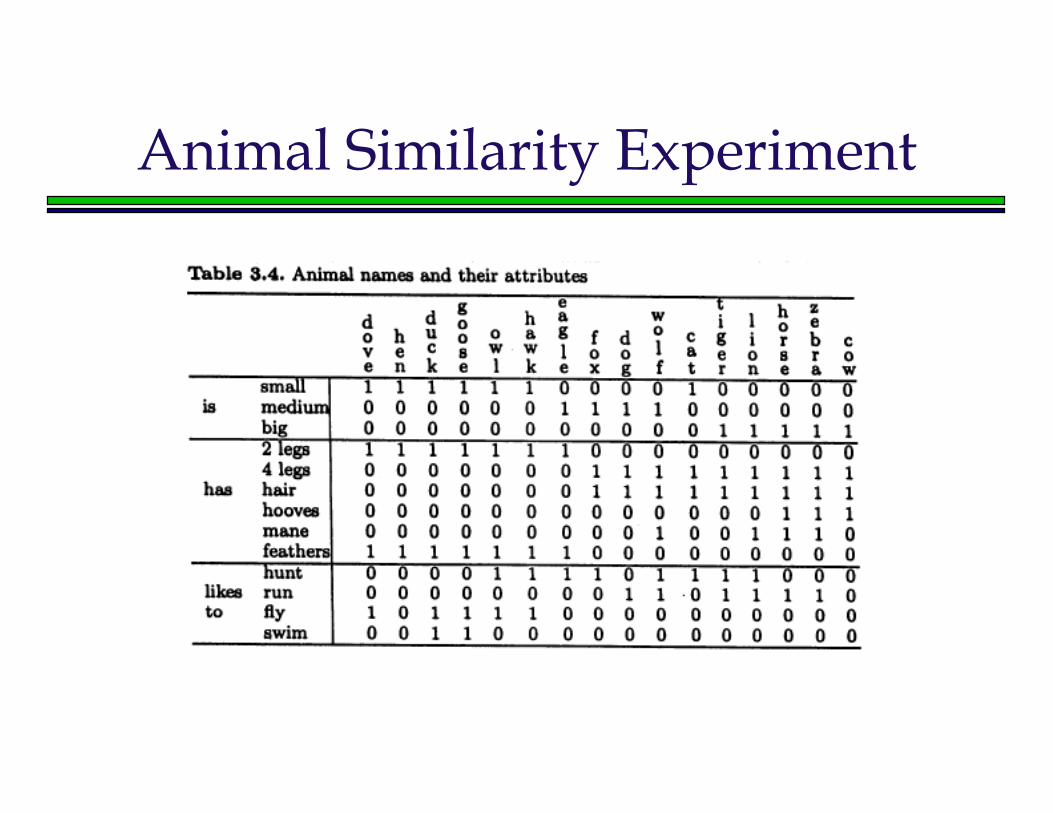
Animal Similarity Experiment
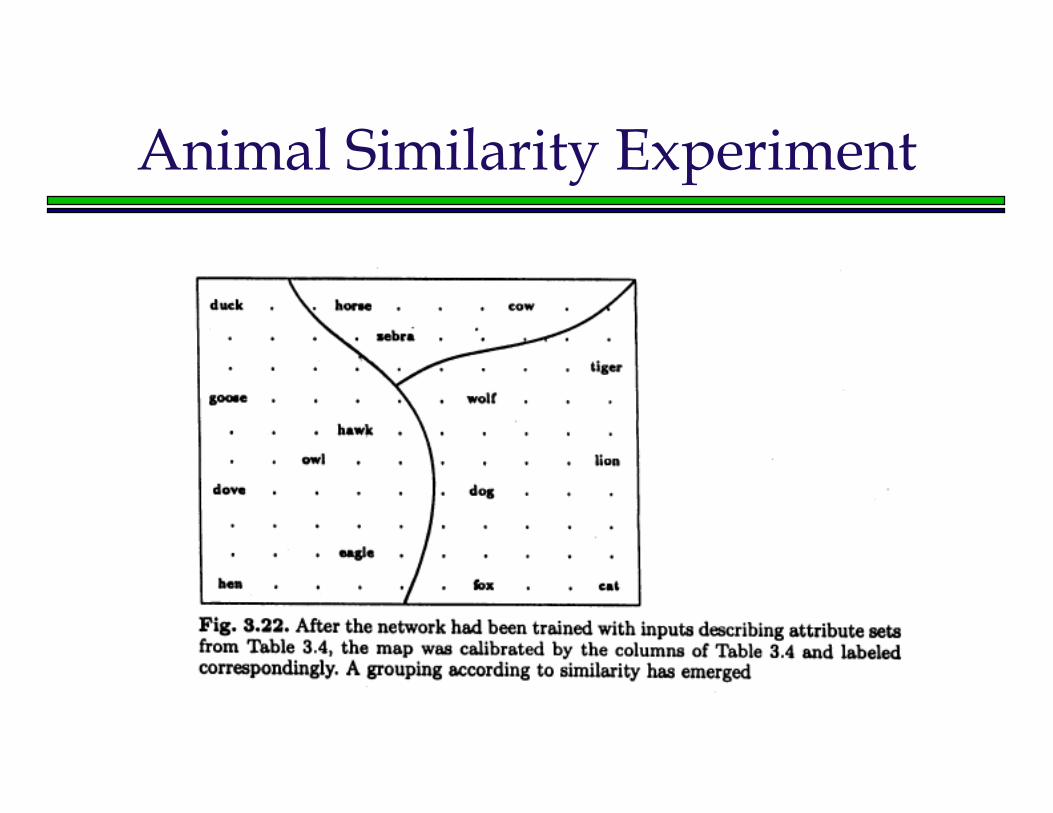
Animal Similarity Experiment
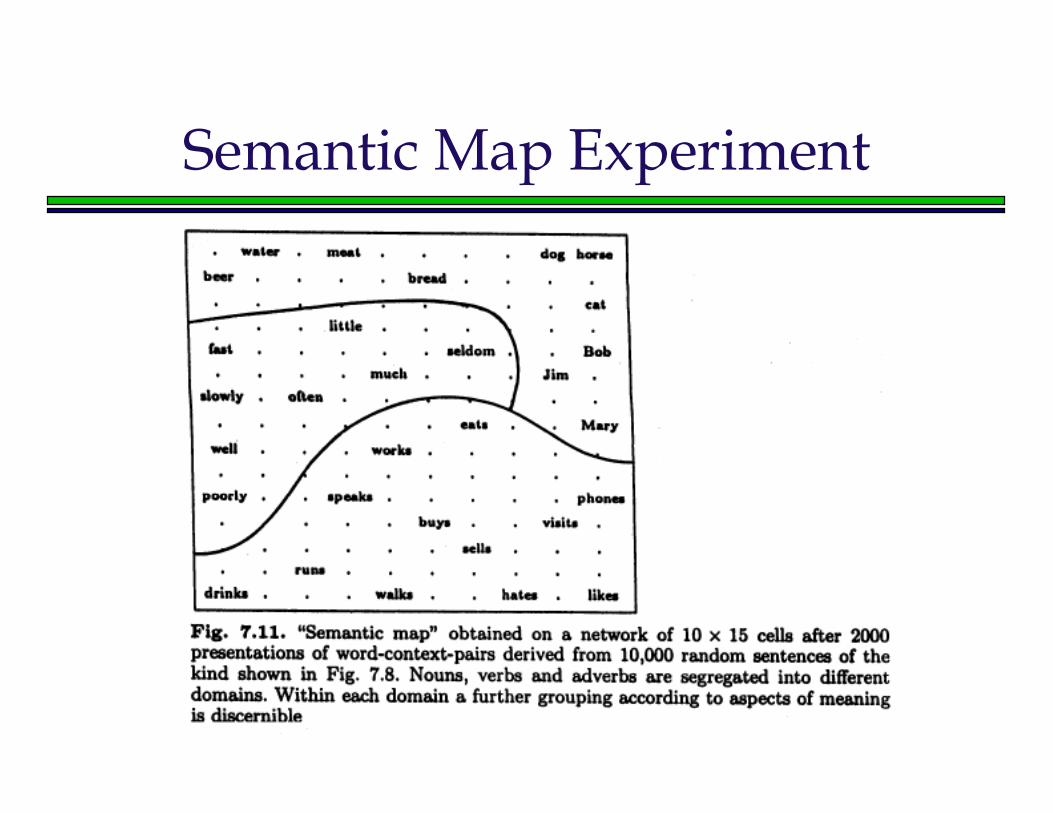
Semantic Map Experiment
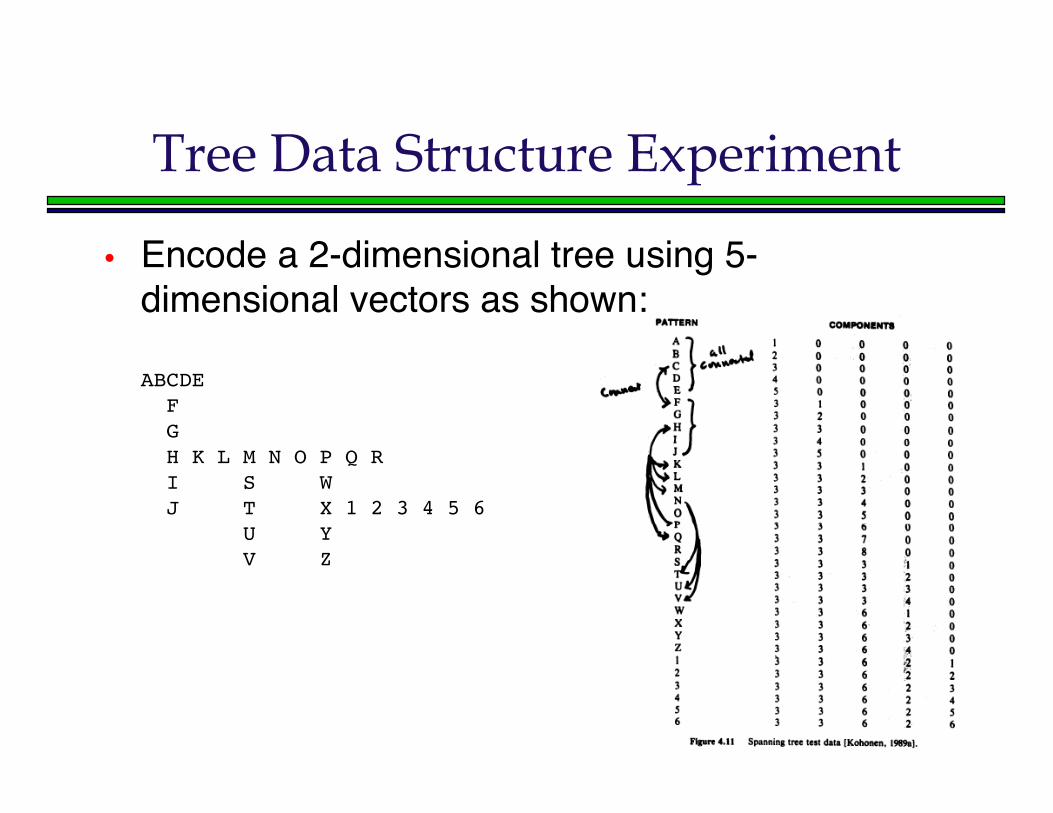
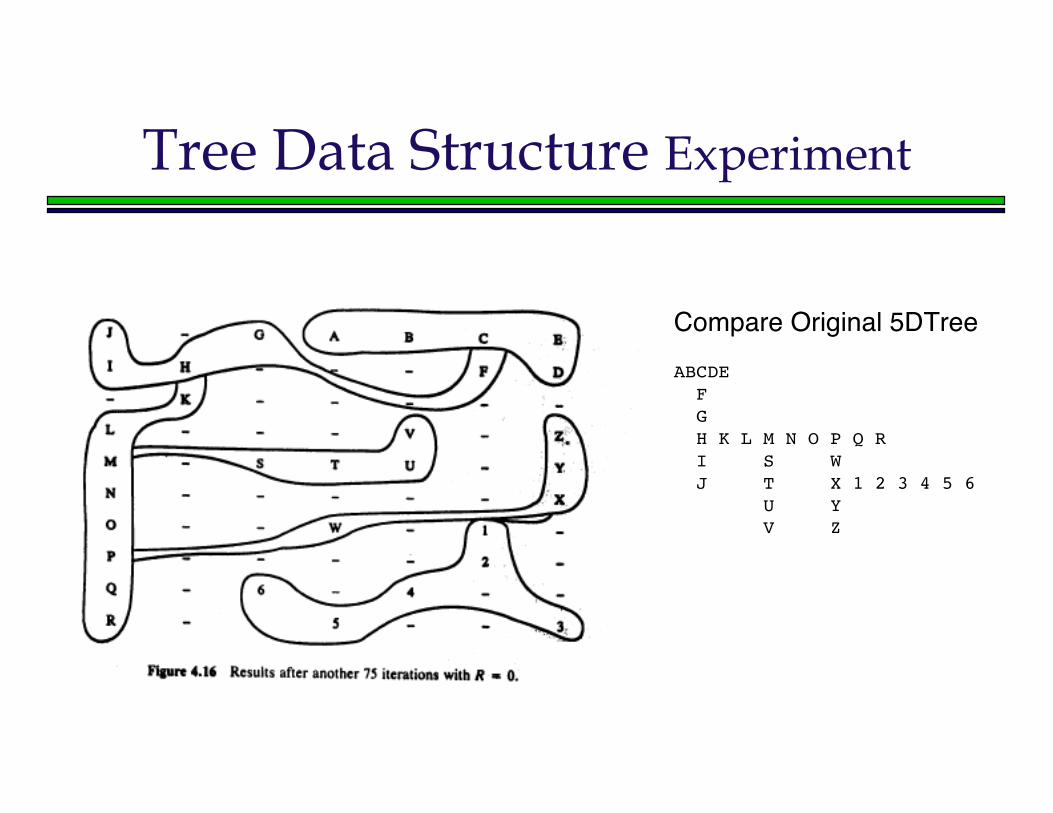
Tree Data Structure Experiment
• Encode a 2-dimensional tree using 5-dimensional vectors as shown:
ABCDE F G H K L M N O P Q R I S W J T X 1 2 3 4 5 6 U Y V Z
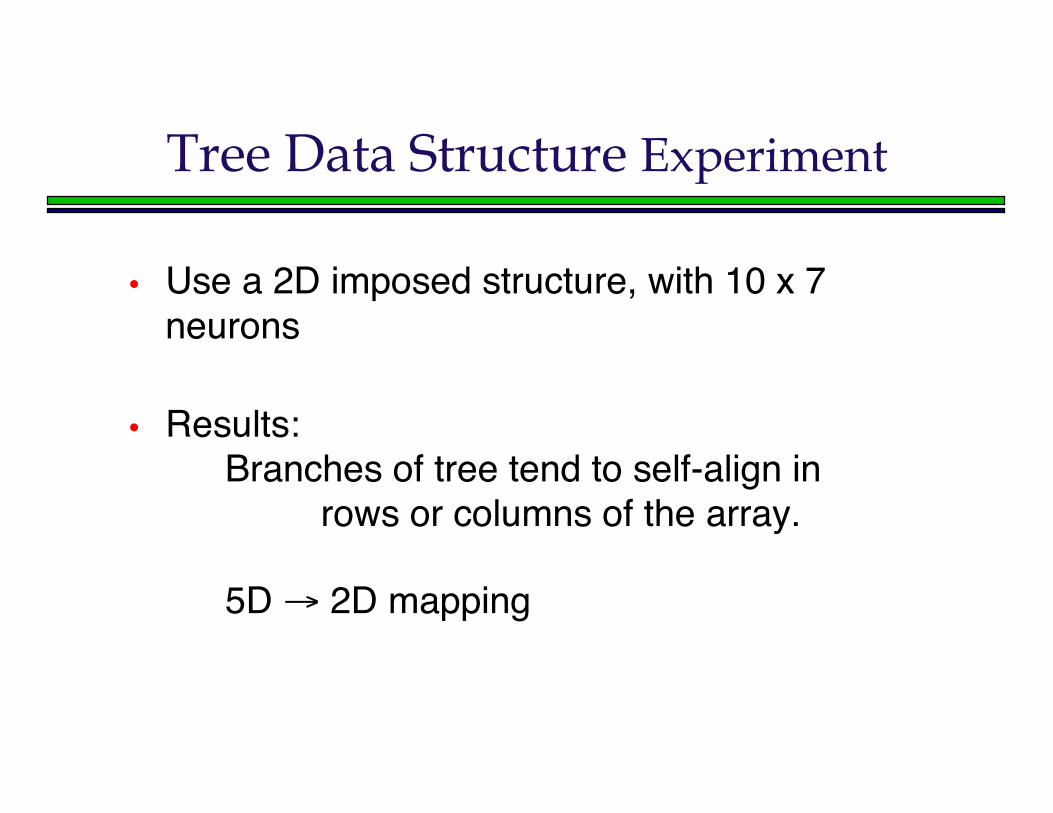
Tree Data Structure Experiment
• Use a 2D imposed structure, with 10 x 7neurons
• Results:Branches of tree tend to self-align in
rows or columns of the array.
5D → 2D mapping
Tree Data Structure Experiment
Compare Original 5DTreeABCDE F G H K L M N O P Q R I S W J T X 1 2 3 4 5 6 U Y V Z
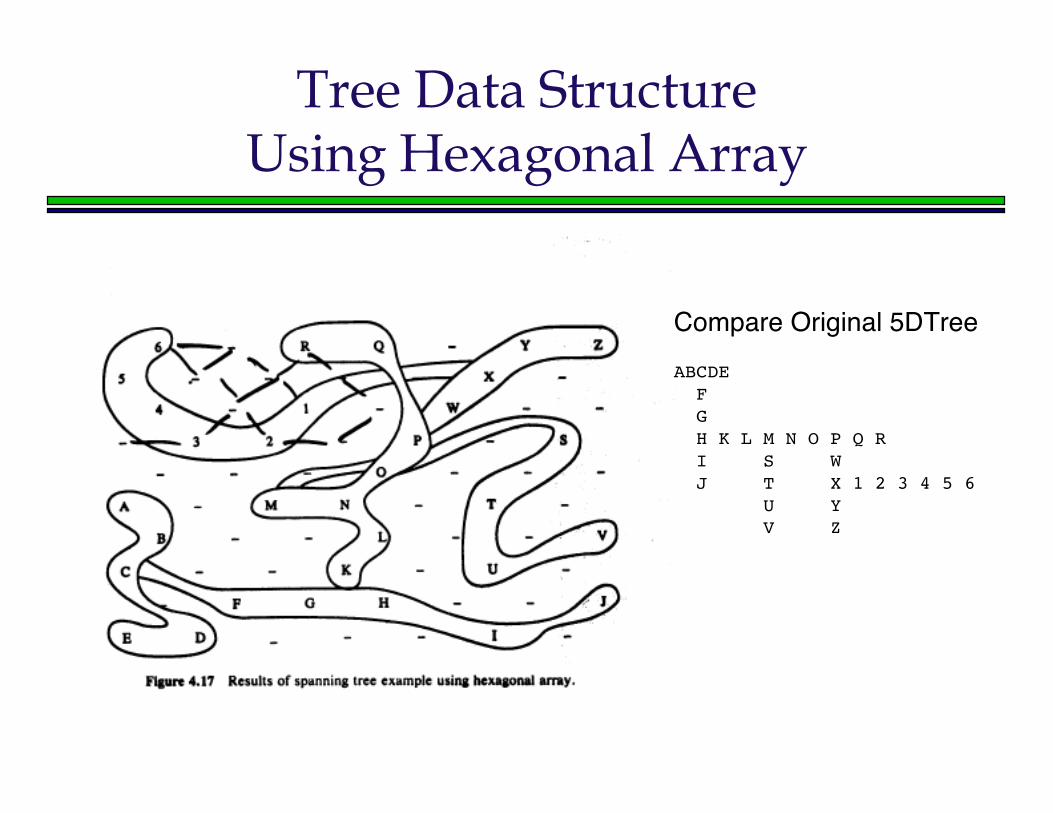
Tree Data StructureUsing Hexagonal Array
Compare Original 5DTreeABCDE F G H K L M N O P Q R I S W J T X 1 2 3 4 5 6 U Y V Z
Supervised Applications of KohonenNets
• Most applications that can be treatedwith MLPʼs can also be treated in someway by variants of Kohonen nets.
• Example: Learning a function f:D→R isdone by treating the sample space as aset of (d, r) pairs.
Function ApproximationExample
• Assume 1-dimensional domain forsimplicity (not required in general).
• Represent pairs y = f(x) as (x, y).
• Learn pairs by a 2-D Kohonen net.
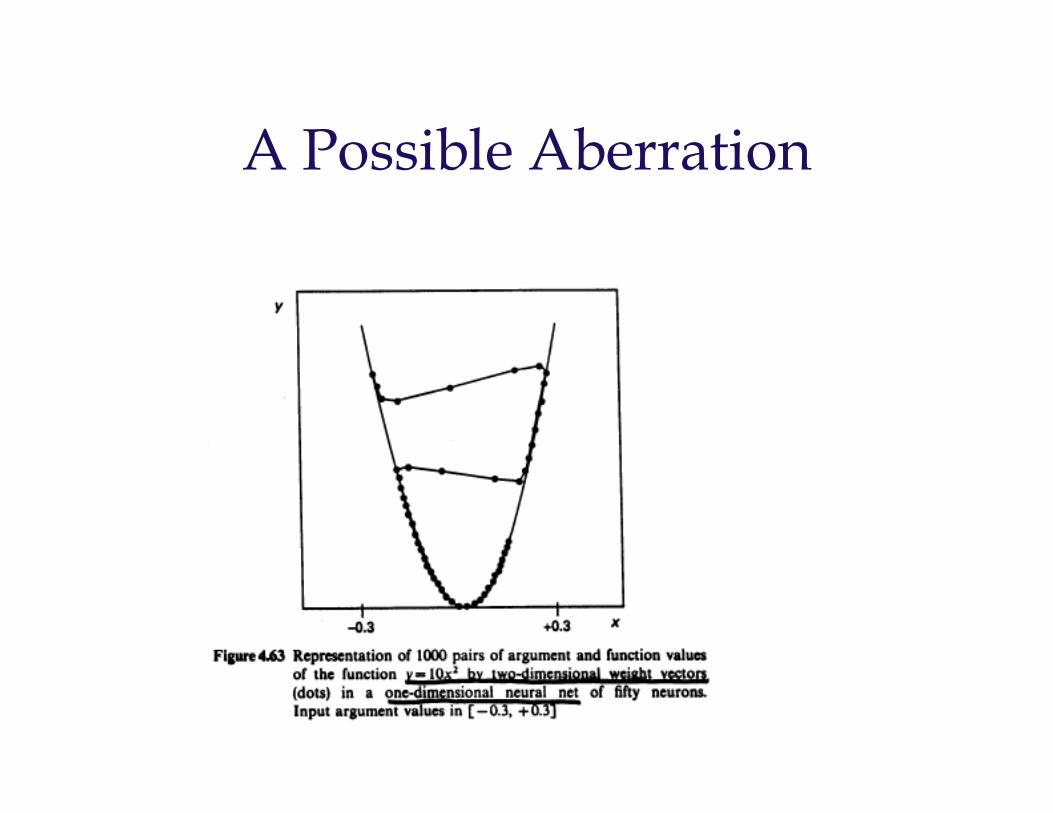
A Possible Aberration
Master-Slave Technique
• A technique known as “master-slave” canreduce the likelihood of an aberration, asshown on a previous diagram.• Select competition winners based only on x, not
on the pair (x, y).
• The weight components corresponding to x arecalled the master weights, and others are calledslave weights.
• Adapt both master and slave weights together.
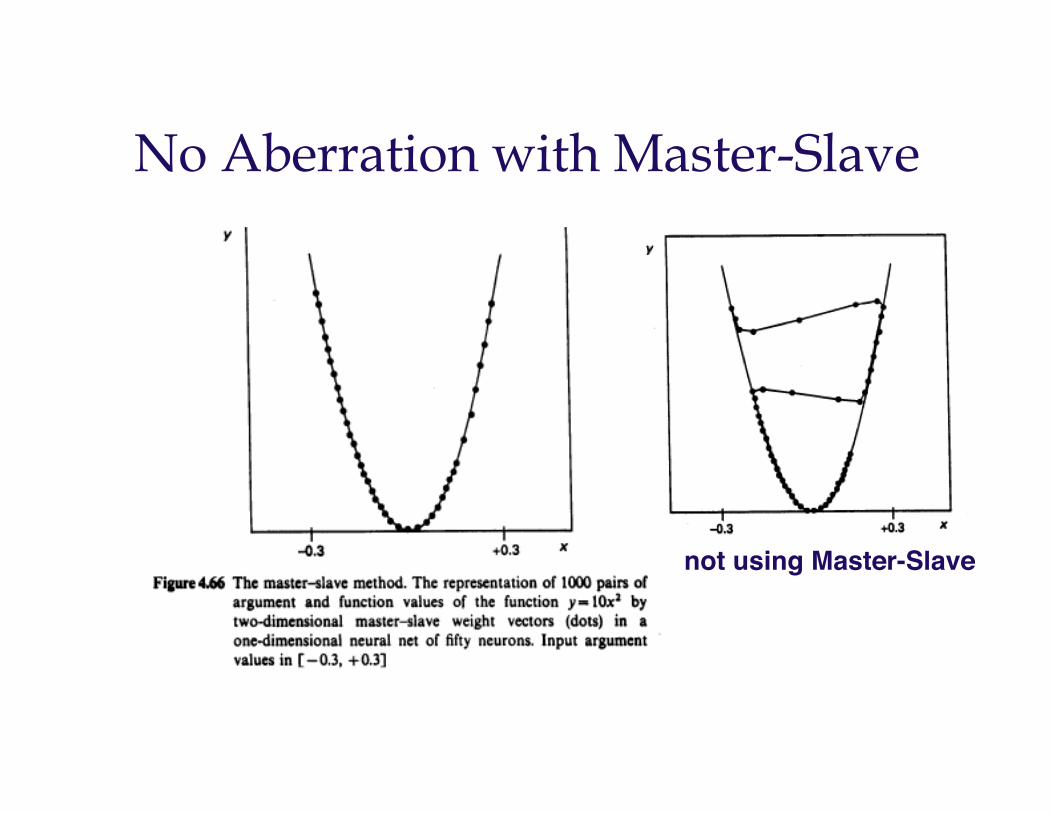
No Aberration with Master-Slave
not using Master-Slave
Example:Robot Hand-Eye Coordination
• Want a robot to coordinate its hand withwhat it sees on the monitor.
• Robot arm should be able to place an objectin a given position identified in view.
• The problem is how to set the armʼs angles(called “inverse kinematics”).
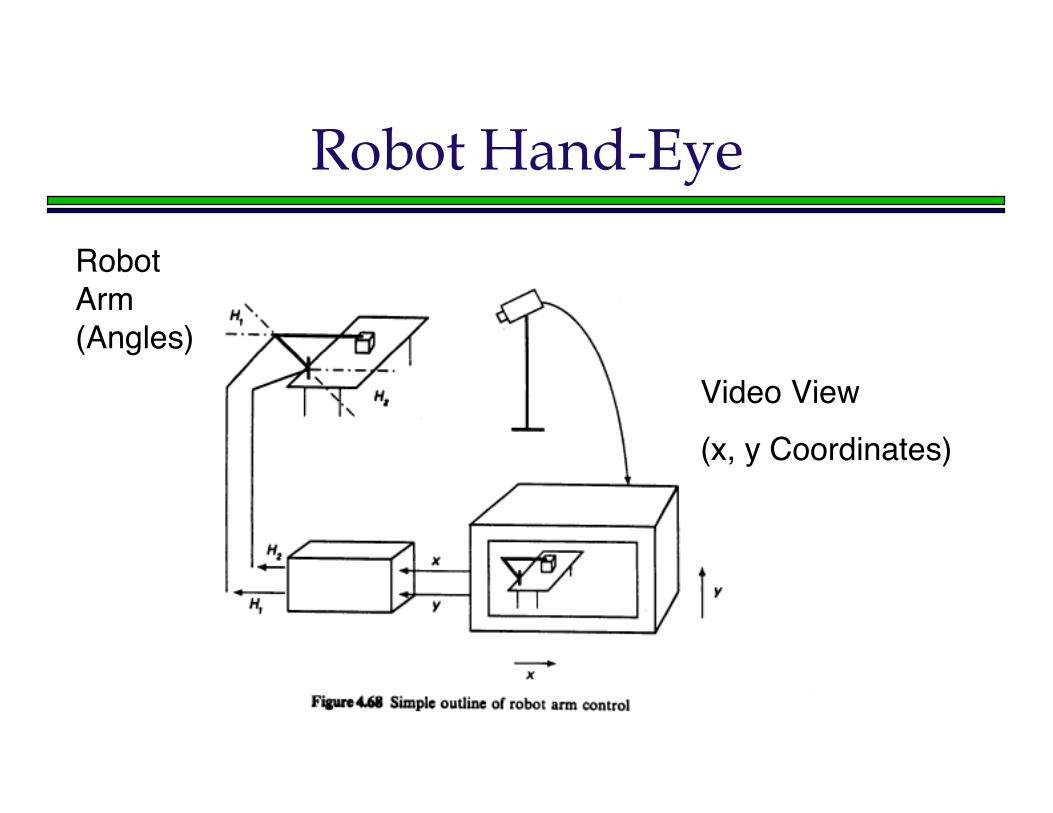
Robot Hand-Eye
RobotArm(Angles)
Video View(x, y Coordinates)
Use of Master-Slave
• The view is the master.• The hand is the slave.• Winner is determined w.r.t. the view.• Both view and hand are adapted together• Example:
• 20x20 neuron map, 2D overlay• 4 weights per neuron
(2 for master/view and 2 for slave/angles)
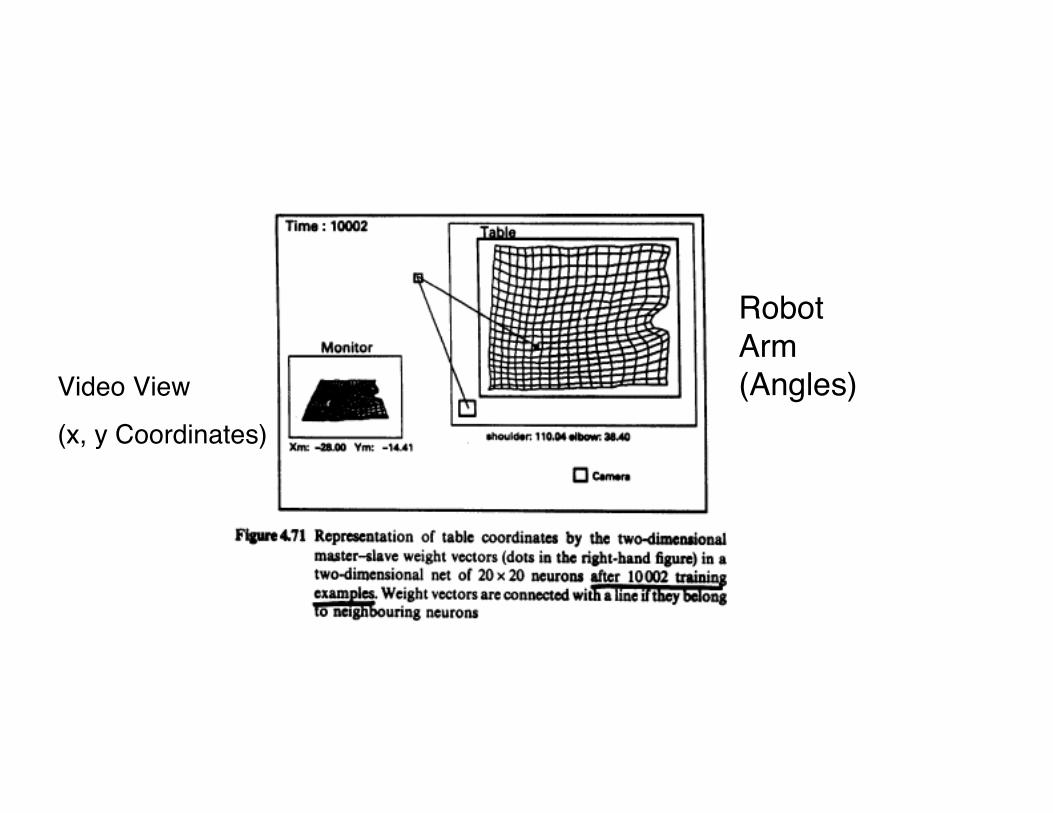
Video View
(x, y Coordinates)
RobotArm(Angles)
Problems Unsuitable forKohonen Nets
• Kohonen nets work by clustering.
• Nearby data points are expected to behavesimilarly, e.g. have similar outputs (topology-preserving property).
• Parity-like problems such as the XOR do nothave this property. These would tend to beunstable for solution by a Kohonen net.
Other Applications Papers


![LNAI 4020 - Agent Community Extraction for 2D-RoboSoccer · 2017-08-23 · ior patterns of an individual agent with the help of self-organizing maps (SOMs) is addressed in [9]. We](https://static.fdocuments.in/doc/165x107/5f8f6d4e2767e1393e549013/lnai-4020-agent-community-extraction-for-2d-robosoccer-2017-08-23-ior-patterns.jpg)