
SELF-ORGANIZED CRITICALITY AND MAGNETICALLY CONFINED ... · SELF-ORGANIZED CRITICALITY AND...
34
RAUL SANCHEZ Departamento de Física Universidad Carlos III de Madrid, Leganés, SPAIN SELF-ORGANIZED CRITICALITY AND MAGNETICALLY CONFINED FUSION PLASMAS ISSI Team Meeting - Self-Organized Criticality and Turbulence October 14-19, 2012, Bern, Switzerland 1 Monday, October 15, 12
Transcript of SELF-ORGANIZED CRITICALITY AND MAGNETICALLY CONFINED ... · SELF-ORGANIZED CRITICALITY AND...
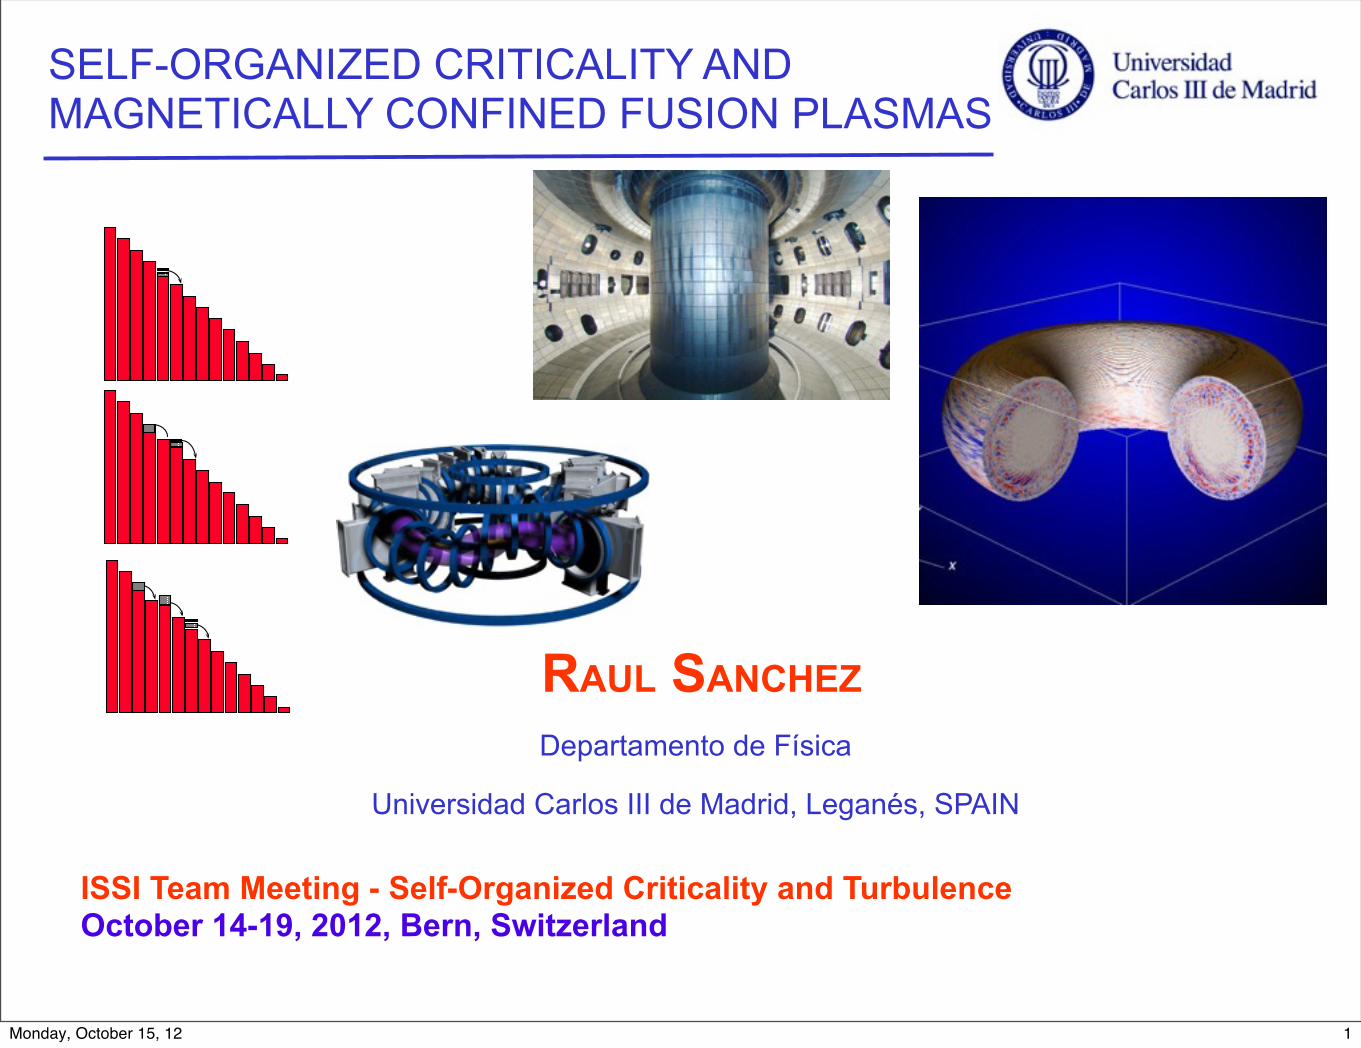
RAUL SANCHEZDepartamento de Física
Universidad Carlos III de Madrid, Leganés, SPAIN
SELF-ORGANIZED CRITICALITY AND MAGNETICALLY CONFINED FUSION PLASMAS
ISSI Team Meeting - Self-Organized Criticality and TurbulenceOctober 14-19, 2012, Bern, Switzerland
1Monday, October 15, 12
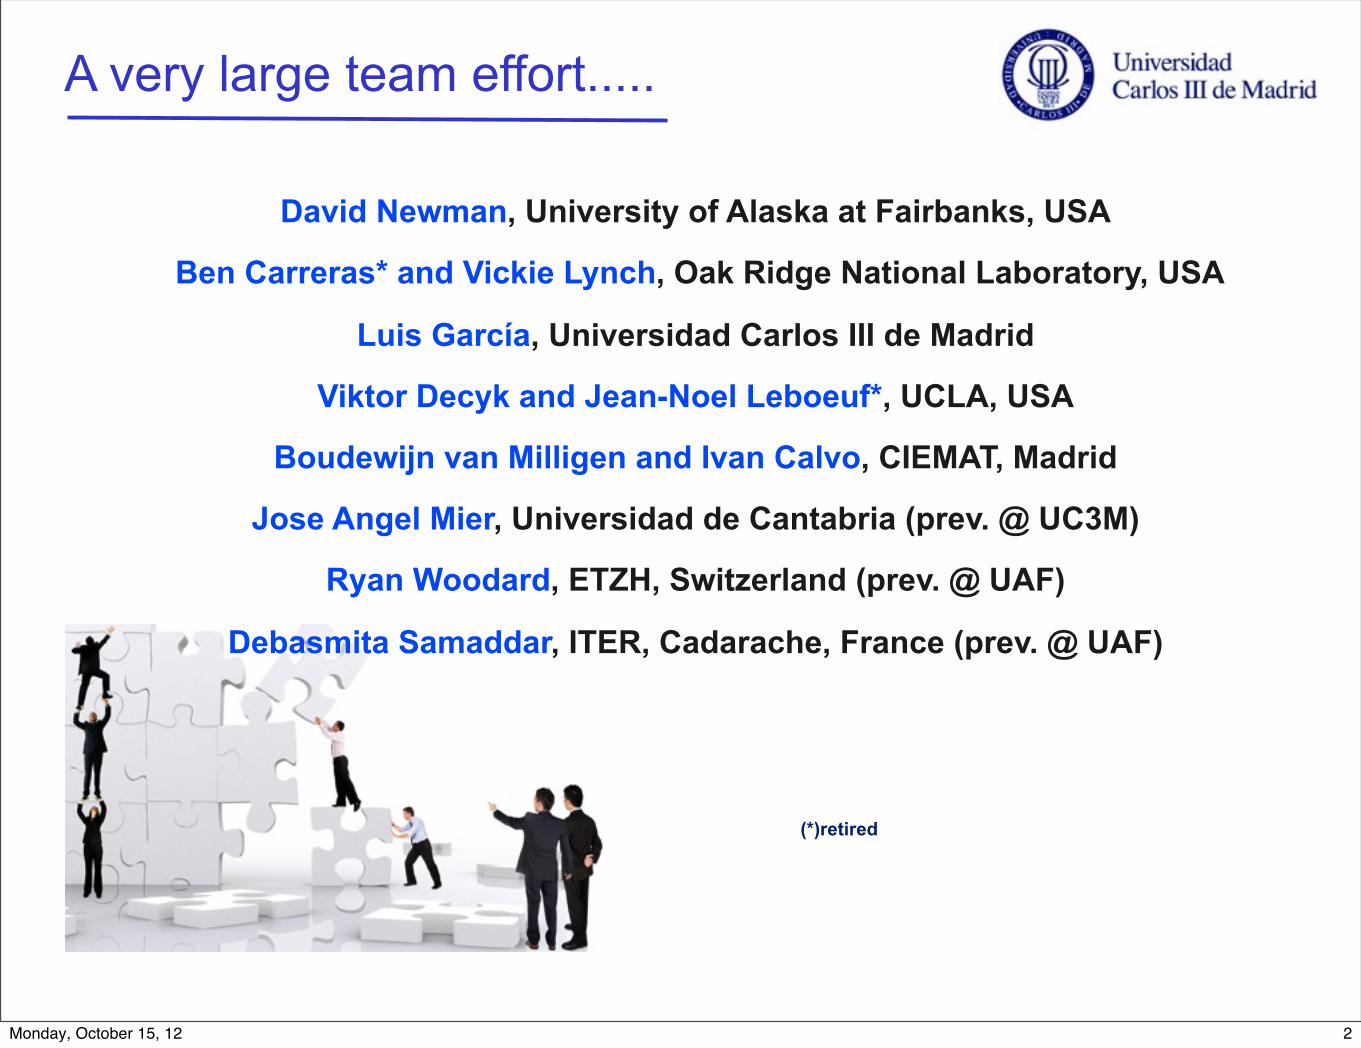
David Newman, University of Alaska at Fairbanks, USA
Ben Carreras* and Vickie Lynch, Oak Ridge National Laboratory, USA
Luis García, Universidad Carlos III de Madrid
Viktor Decyk and Jean-Noel Leboeuf*, UCLA, USA
Boudewijn van Milligen and Ivan Calvo, CIEMAT, Madrid
Jose Angel Mier, Universidad de Cantabria (prev. @ UC3M)
Ryan Woodard, ETZH, Switzerland (prev. @ UAF)
Debasmita Samaddar, ITER, Cadarache, France (prev. @ UAF)
(*)retired
A very large team effort.....
2Monday, October 15, 12
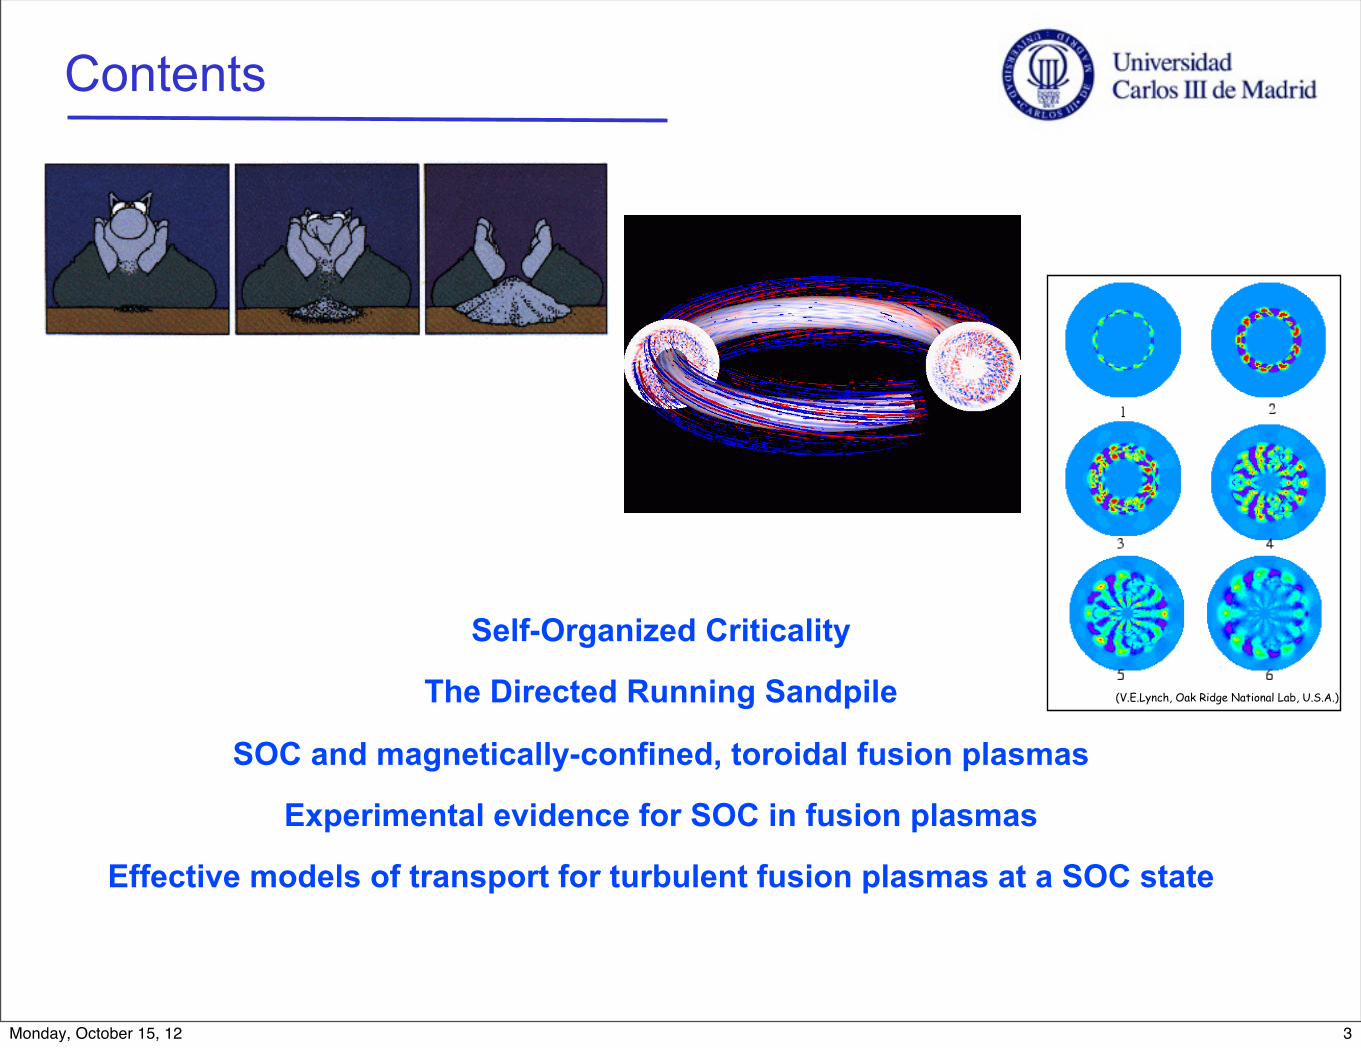
Self-Organized Criticality
The Directed Running Sandpile
SOC and magnetically-confined, toroidal fusion plasmas
Experimental evidence for SOC in fusion plasmas
Effective models of transport for turbulent fusion plasmas at a SOC state
Contents
(V.E.Lynch, Oak Ridge National Lab, U.S.A.)!
3Monday, October 15, 12
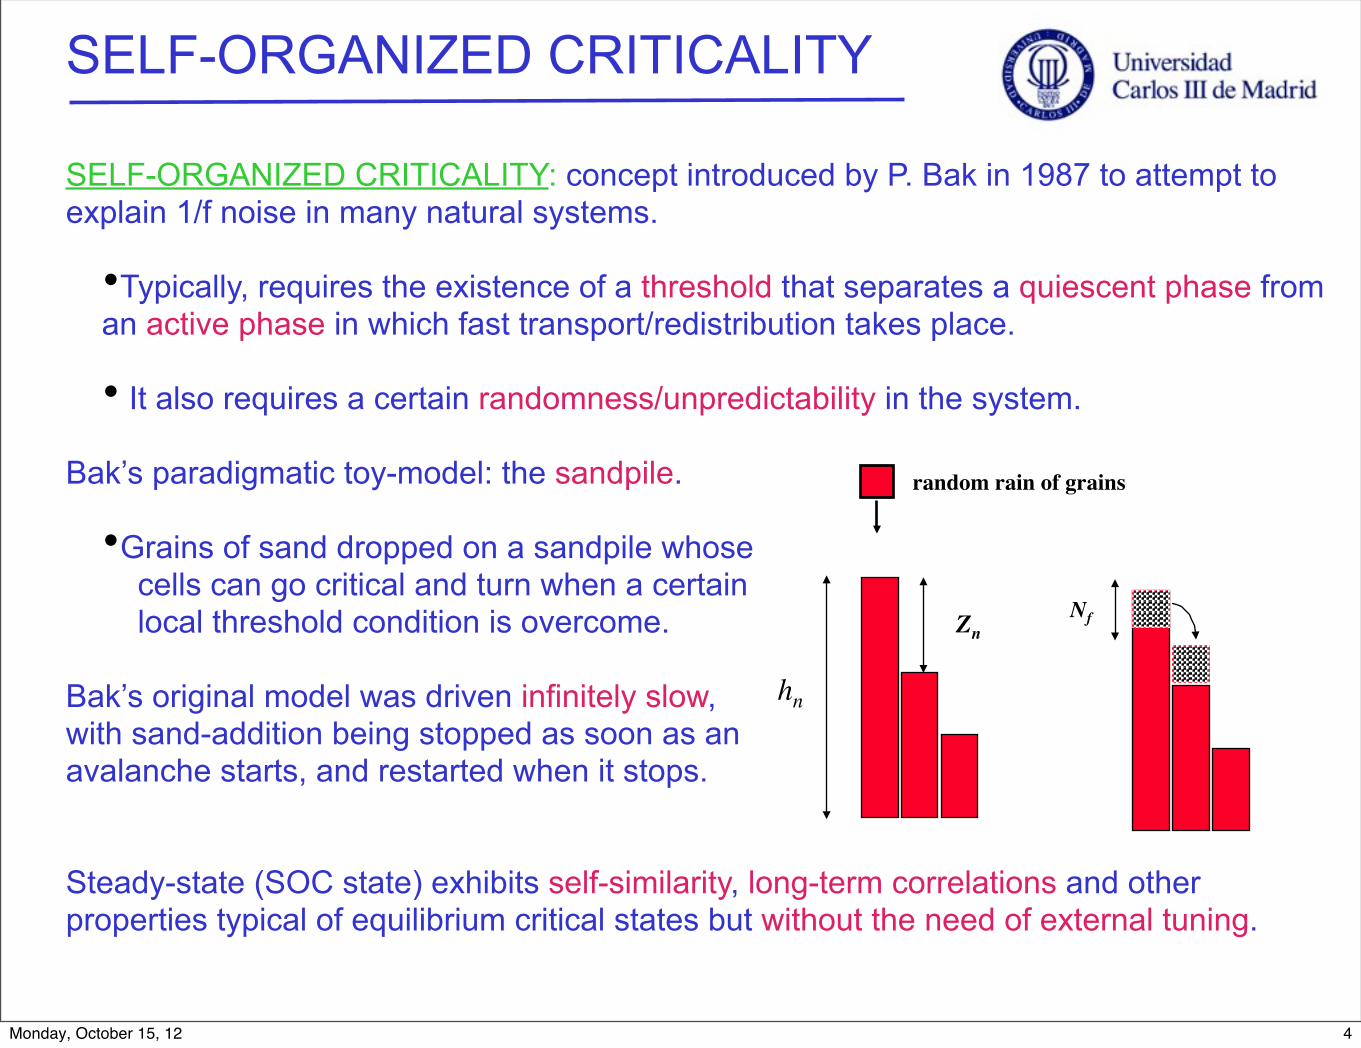
SELF-ORGANIZED CRITICALITY
SELF-ORGANIZED CRITICALITY: concept introduced by P. Bak in 1987 to attempt to explain 1/f noise in many natural systems.
•Typically, requires the existence of a threshold that separates a quiescent phase from an active phase in which fast transport/redistribution takes place.
• It also requires a certain randomness/unpredictability in the system.
Bak’s paradigmatic toy-model: the sandpile.
•Grains of sand dropped on a sandpile whosecells can go critical and turn when a certainlocal threshold condition is overcome.
Bak’s original model was driven infinitely slow,with sand-addition being stopped as soon as an avalanche starts, and restarted when it stops.
Steady-state (SOC state) exhibits self-similarity, long-term correlations and other properties typical of equilibrium critical states but without the need of external tuning.
hn!
Zn!Nf!
random rain of grains!
4Monday, October 15, 12
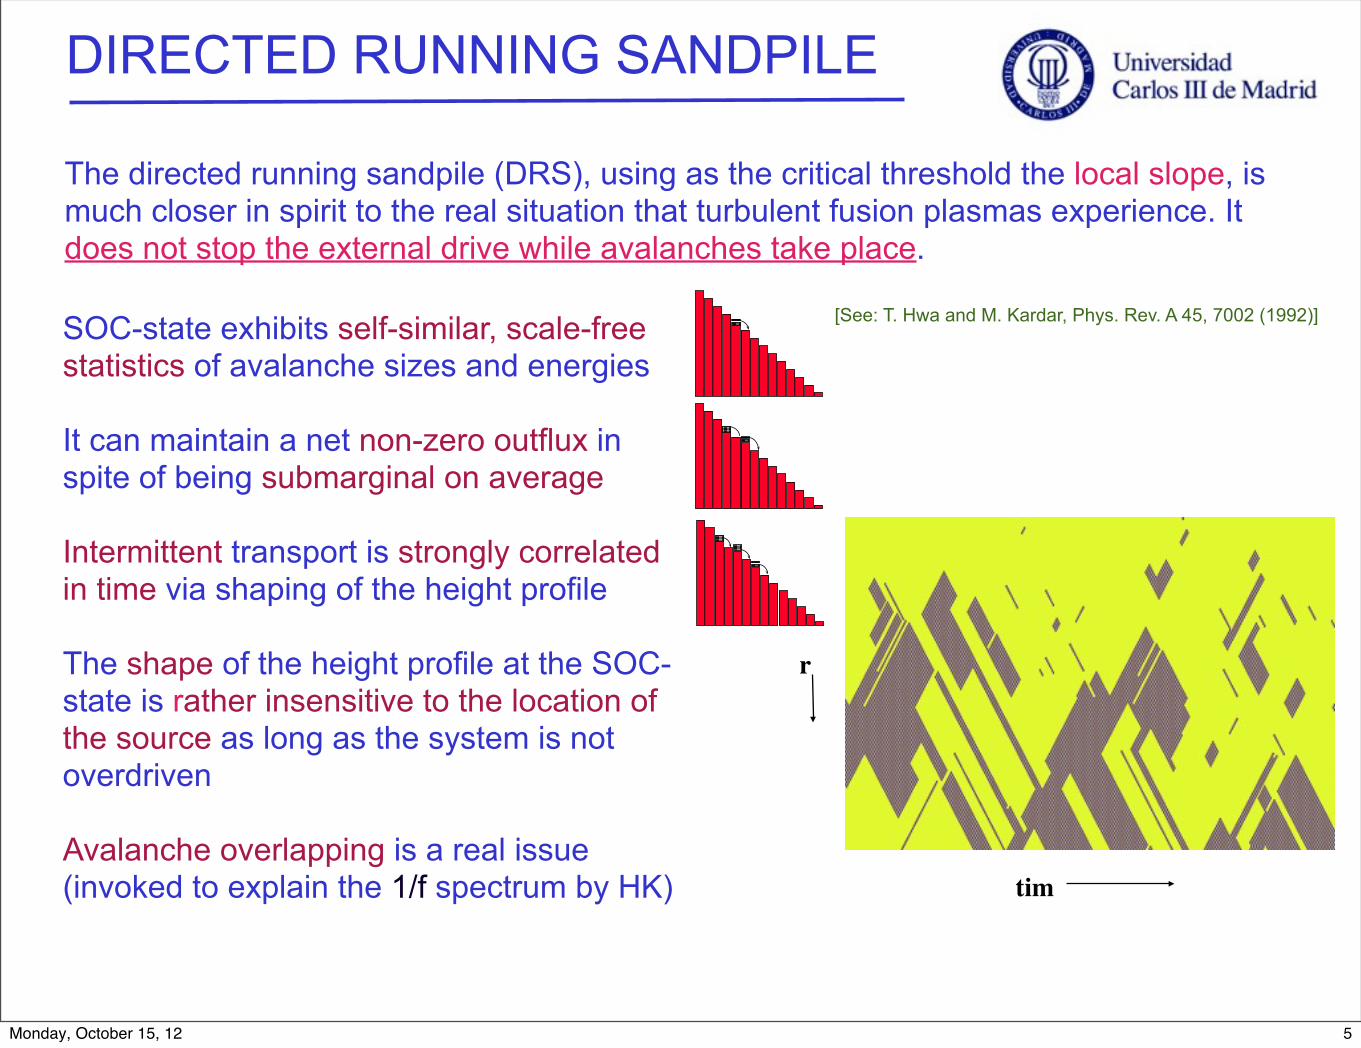
DIRECTED RUNNING SANDPILE
The directed running sandpile (DRS), using as the critical threshold the local slope, is much closer in spirit to the real situation that turbulent fusion plasmas experience. It does not stop the external drive while avalanches take place.
[See: T. Hwa and M. Kardar, Phys. Rev. A 45, 7002 (1992)]SOC-state exhibits self-similar, scale-free statistics of avalanche sizes and energies
It can maintain a net non-zero outflux in spite of being submarginal on average
Intermittent transport is strongly correlated in time via shaping of the height profile
The shape of the height profile at the SOC-state is rather insensitive to the location of the source as long as the system is not overdriven
Avalanche overlapping is a real issue (invoked to explain the 1/f spectrum by HK)
r
tim
5Monday, October 15, 12
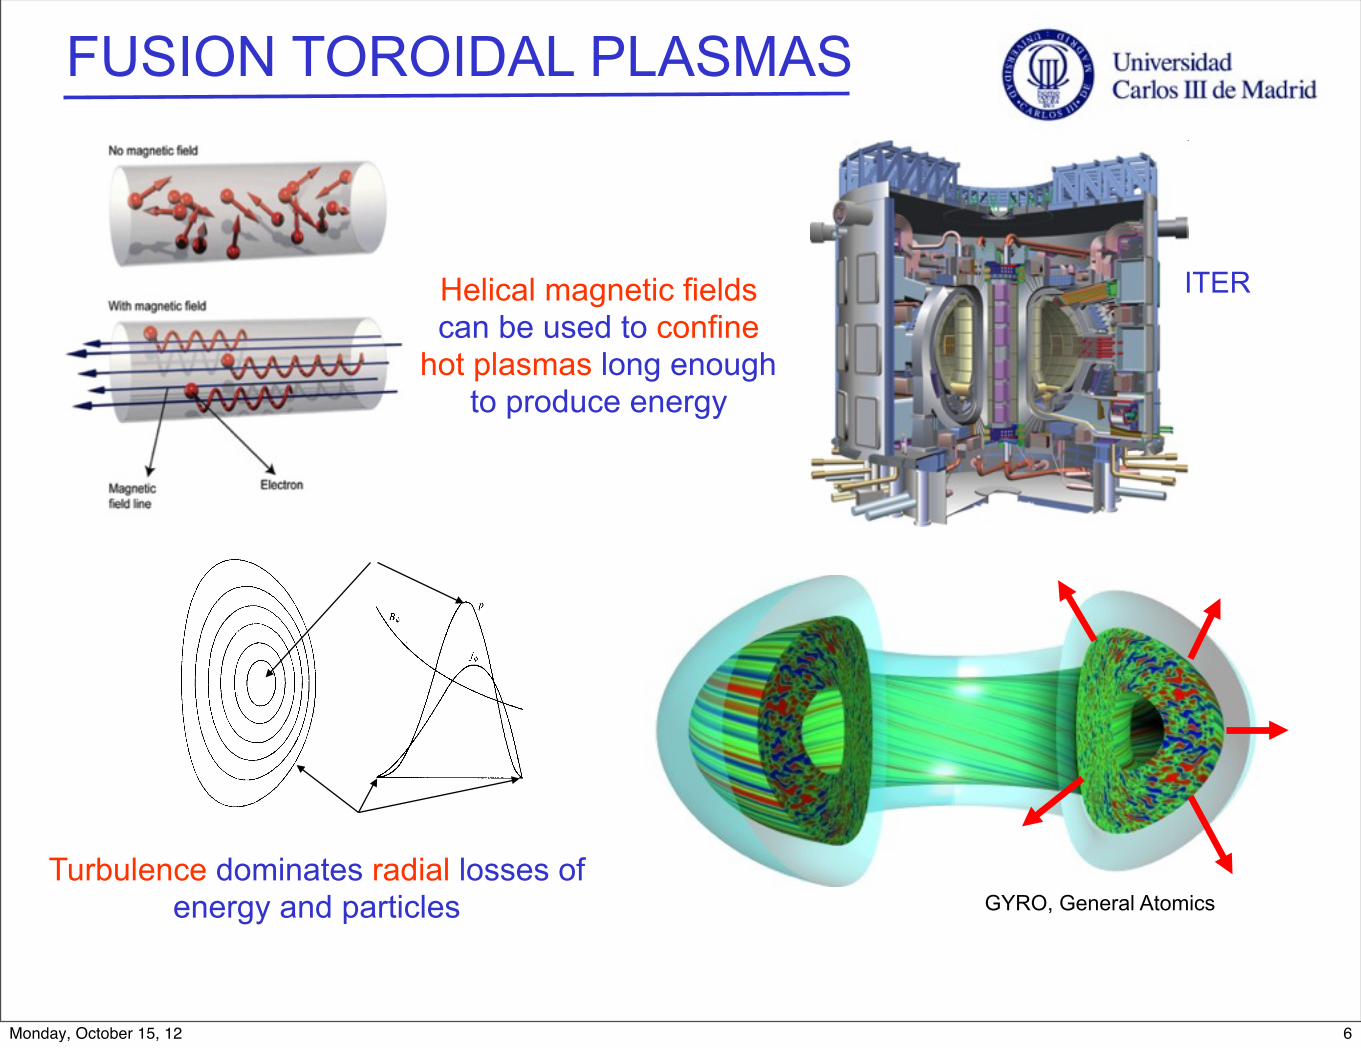
FUSION TOROIDAL PLASMAS
ITERHelical magnetic fields can be used to confine
hot plasmas long enough to produce energy
Turbulence dominates radial losses of energy and particles GYRO, General Atomics
6Monday, October 15, 12
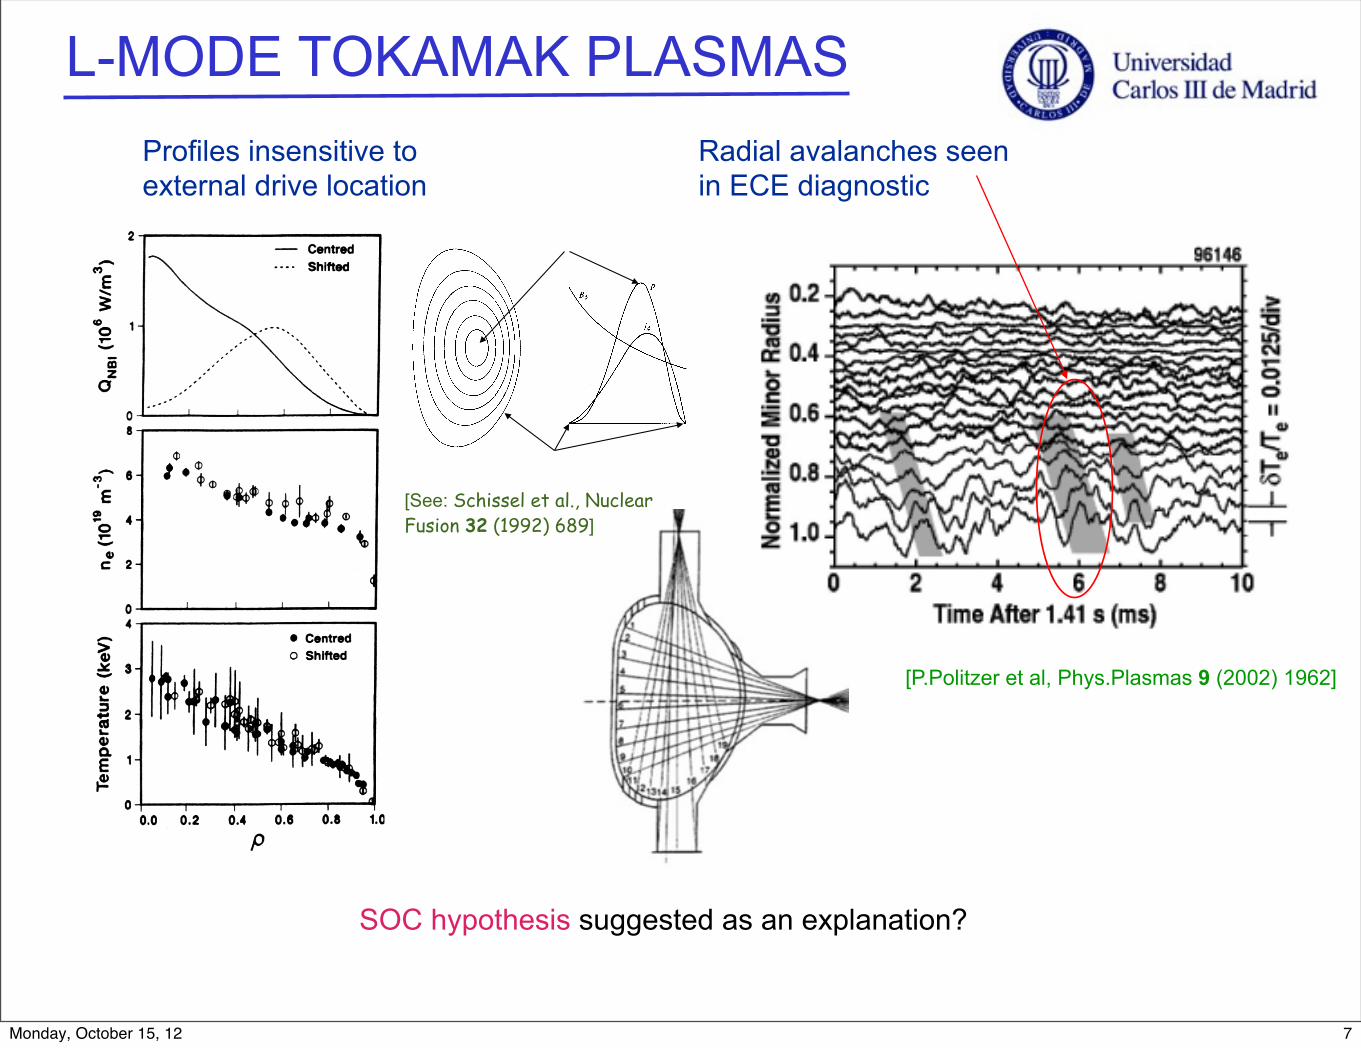
L-MODE TOKAMAK PLASMASProfiles insensitive to external drive location
[See: Schissel et al., Nuclear Fusion 32 (1992) 689]
Radial avalanches seen in ECE diagnostic
[P.Politzer et al, Phys.Plasmas 9 (2002) 1962]
SOC hypothesis suggested as an explanation?
7Monday, October 15, 12
P.H. Diamond et al, Phys. Plasmas 2, 3640 (1995) - Theory, PDED.E. Newman et al, Phys. Plasmas 3, 1858 (1996) - Sandpile, near-marginal dyns, shear flow effectsB.A. Carreras et al, Phys. Plasmas 3, 2904 (1996) - Simulation (Interch. fluid), near marginal, avalanchesR. Dendy et al, Pl. Phys. Contr. Fusion 39, 1947(1997) - Sandpile, near-marginal dynsX. Garbet et al, Phys. Plasmas 5, 2836 (1998) - Simulation (gyrofluid, DTEM), near marginal, flux-drivenY. Sarazin et al, Phys. Plasmas 5, 4214 (1998) - Simulation (gyrofluid, ITG), near marginal, flux-drivenT. Rhodes et al., Phys. Lett. A 253, 181 (1998) - Experimental, tokamak, fluctuation statisticsB.A. Carreras et al., Phys. Rev. Lett. 80, 4438 (1998) - Experimental, Hurst exponents, edge fluctuationsM.A. Pedrosa et al., Phys. Rev. Lett. 82, 3621 (1999) - Experimental, power spectra, edge fluctuationsB.A. Carreras et al., Phys. Rev. Lett. 83, 3653 (1999) - Experimental, self-similarity, edge fluctuationsP. Beyer et al, Pl. Phys. Contr. Fusion 41, A757 (1999) - Experimental, tokamak, edge fluctuationsB. A. Carreras et al, Phys. Rev. E 60, 4770 (1999) - Sandpile, Effective Tr. Model (CTRWs)B. A. Carreras et al., Phys. Plasmas 8, 5096 (2001) - Simulation (Interch., fluid), Eff. Tr. Model (CTRWs)R. Sanchez et al., Nucl. Fusion 41, 247 (2001) - Sandpile, diffusion effects, ELMsS. Chapman et al, Phys. Rev. Lett. 86, 2814 (2001) - Sandpile, ELMsE. Spada et al, Phys. Rev. Lett. 86, 3032 (2001) - Experimental (against) - W. times, No s-similarityR. Sanchez et al, Phys. Rev. Lett. 88, 068302 (2002) - Sandpile, Wait. timesP.A. Politzer et al, Phys. Plasmas 9, 1962 (2002) - Experimental, avalanche viz., ECE, tokamakL. García et al, Phys. Plasmas 9, 841 (2002) - Theory, PDE (continuum sandpile)R. Sanchez et al, Phys. Rev. Lett. 90, 185005 (2003) - Experimental - W. times, Response to Spada's PRLI Gruzinov et al, Phys. Plasmas 10, 569 (2003) - Sandpile, ELMsV. Tangri et al, Phys. Rev. Lett. 91, 025011 (2003) - Theory, PDE (continuum sandpile)Y Xu et al, Phys. Plasmas 11, 5413 (2004) - Experimental, Tokamak, edge fluctuationsB.Ph. van Milligen et al, Phys. Plasmas 11, 2272 (2004) - Theory, Effective Tr. Model (CTRWs/Master Eqs.)D. del-Castillo-Negrete et al, Phys. Plasmas (2004) - Simulation (Interch., fluid), Eff. Tr. Model (Fract. Diff. Eqs)B. Dudson et al, Pl. Phys. Contr. Fusion 47, 885 (2005) - Experimental, spherical tokamakL. Marrelli et al, Phys. Plasmas 12, 030701 (2005) - Experimental, reverse field pinchR. Sanchez et al, Phys. Rev. E 74, 016305 (2006) - Theory, Eff. Tr. Models (FBM/FLM -> FDEs)J.A. Mier et al, Phys. Plasmas 13, 102308 (2006) - Simulation (DTEM, fluid), effect of diffusionF. Sattin et al, Phys. Rev. Lett. 96, 105005 (2006) - Sandpile, include WTsJ. A. Mier et al, Phys. Rev. Lett. 101, 165001 (2008) - Simulation (DTEM, fluid), Eff. Tr. Model (Lagr. Diag.)Y. Sarazin et al, Nucl. Fusion 50, 054004 (2010) - Simulation (ITG, gyrokinetics), near-marg., avalanchesH. Isliker et al, Phys. Plasmas 17, 082303 (2010) - Sandpile, ITG-likeJ. Maggs et al, Phys. Rev. Lett. 107, 185003 (2011) - Experimental (against) - Lorenzian, random pulsesS. Tokunaga et al, Phys. Plasmas 19, 092303 (2012) - Experimental, tokamak, enhanced modesB. van Milligen et al, Phys. Rev. Lett. 109, 105001 (2012) - Experimental - Response to Magg's PRLGZ dos Santos et al, Phys. Lett. A 376, 753 (2012) - Experimental, tokamak
Lots of activity (not comprehensive...)
8Monday, October 15, 12
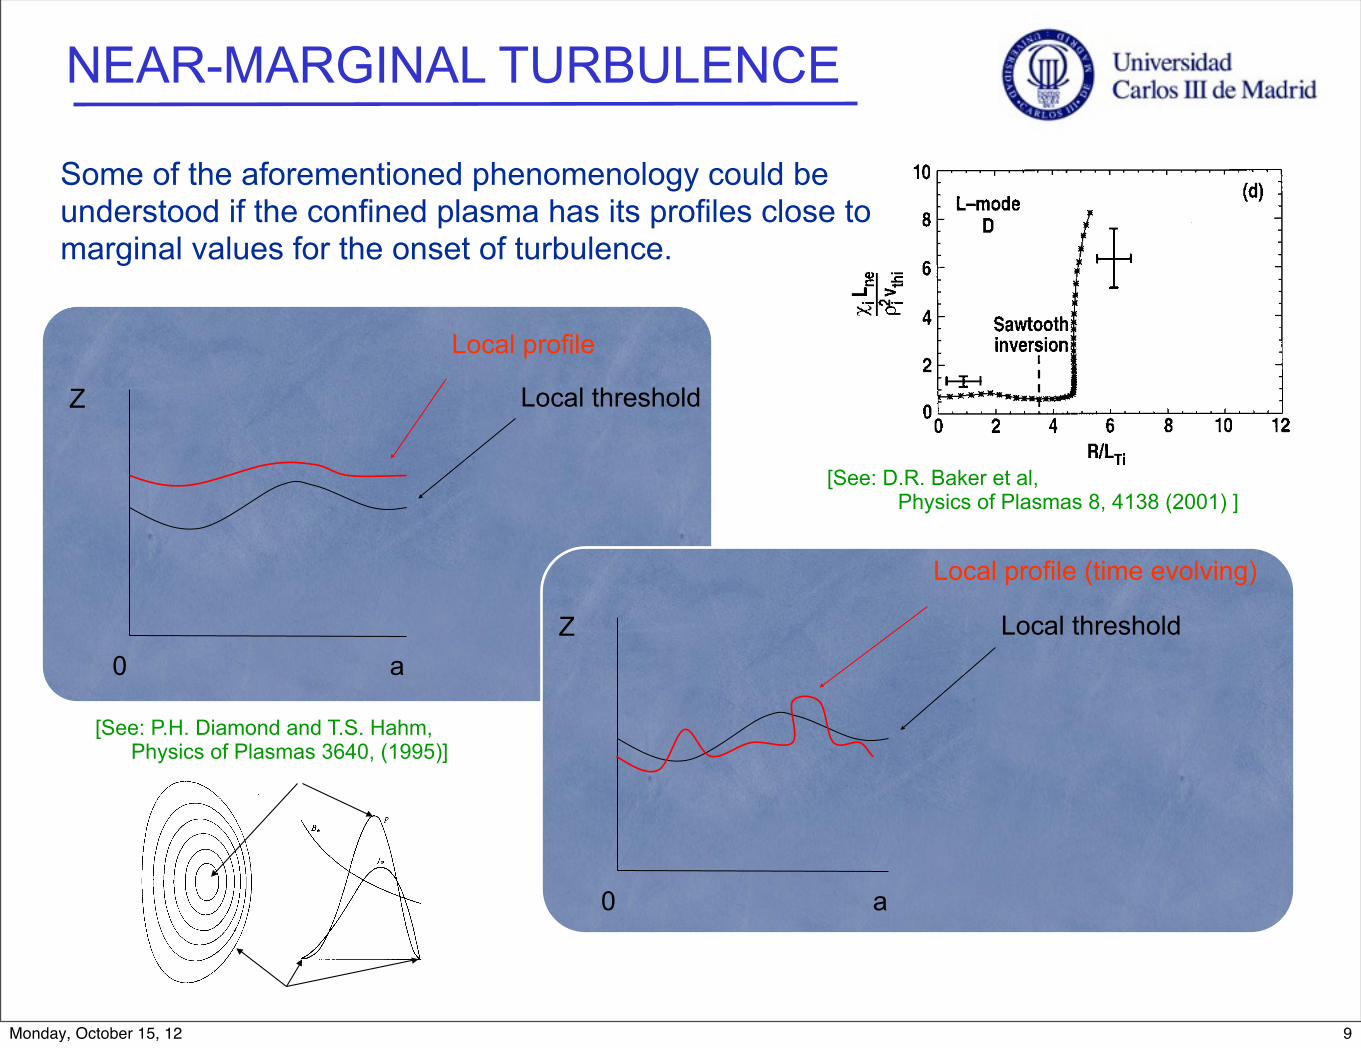
NEAR-MARGINAL TURBULENCE
0 a
Z Local threshold
Local profile
0 a
Z Local threshold
Local profile (time evolving)
same graph for one discharge. This result was obtained from
TRANSP. Figures 1!b"–1!d" plot the data for a single analyzedtime for each discharge. This result was obtained from
ONETWO. Figures 1!a"–1!d" correspond to the discharges la-beled L-mode A, B, C, and D, respectively, in Table I.
The data plotted in Fig. 1!a" is for #normalized!0.75 whilefor Figs. 1!b"–1!d" the data is for #normalized!0.85. The dis-charge plotted in Fig. 1!a", ‘‘L-mode A,’’ is a nonsawtoothingL-mode that has been initiated using the technique of early
auxiliary heating that creates a broad or hollow current pro-
file. In fact, this shot has a small region in the plasma with
weak negative central shear !NCS". This shot has beams inthe countercurrent direction with a power just below the em-
pirical threshold for creating an ITB.14 Although for the
times plotted there is no clear ITB, there is still good con-
finement, as evidenced by the low values of normalized $ i .
‘‘L-mode B,’’ ‘‘L-mode C,’’ and ‘‘L-mode D’’ are sawtooth-
ing L-mode shots with the standard positive shear. ‘‘L-mode
B’’ and ‘‘L-mode C’’ are limited on the inside wall while
‘‘L-mode D’’ is in the SND configuration. These three have
much lower thermal confinement than ‘‘L-mode A,’’ as evi-
denced by the much higher values of normalized $ i . A trans-
port analysis at this very center of a sawtoothing plasma has
large errors in the calculated diffusivities, and, in fact, the
diffusivities do not well represent the time-averaged energy
fluxes. The thermal diffusivities that are present here are cal-
culated in a time interval just before the sawtooth crash
when, within the error, the time rate of change of the internal
energy is zero. The thermal diffusivities are thus only ap-
proximate and probably represent an overestimate of the ac-
tual conductive part of the energy flux just before the crash.
It should be noted that only four of the eight plasma dis-
charges individually discussed in this paper exhibit any saw-
tooth behavior. For the range of sawtoothing discharges dis-
cussed here and presented in Figs. 1–4, there is no
correlation between the sawtooth inversion radius and the
location of the critical gradient.
From Fig. 1, it is clear that $ i has a strong nonlinear
dependence on R/LTi , consistent with the concept of a criti-
cal gradient. There are two important aspects to this result.
First, $ i only becomes large when R/LTi is greater than some
‘‘critical’’ value. Second, for a large region of the plasma,
R/LTi is approximately constant. This can be seen in Fig. 2,
where R/LTi is plotted as a function of the normalized minor
radius. The fact that the gradient is approximately constant
over a large region of the plasma is not directly related to the
critical gradient phenomenon, but is a, perhaps coincidental,
property of most standard DIII-D L-mode discharges. These
four discharges are archetypical of this property of DIII-D
L-mode plasmas. In fact, the wide range of DIII-D L-mode
shots also exhibit a wider range of R/LTi values than evi-
denced by these data. All L-mode discharges, however, do
show this type of strong dependence of $ i on R/LTi .
In a later section we will see that rotational shear, caused
either by pressure gradients or beam-driven rotation, can
have an important effect on the observed range of R/LTi . At
some level, this rotational shear is always present in DIII-D.
For comparison with discharges with stronger rotational
shear, plotted in Fig. 2 is the absolute magnitude of the ve-
locity shearing rate !%E"B! for these low rotational shear
L-mode shots.
In order to lend credence to the concept that the results
in Fig. 1 are evidence of a critical gradient, plotted in Fig. 2
is the radial profile of the critical value of
R/LTi (R/LTi-crit-IP), as predicted by a parametrized version
of the IFS-PPPL transport model.3 The parametrized expres-
sion for the IFS-PPPL critical gradient is given by
R/LTi-crit-IP# f f •gg•hh ,with
FIG. 1. !a" Normalized $ i vs R/LTi . The data points are for a range of times
and radii from a discharge in the L-mode. The time range spans a time in the
L-mode with low MHD activity and no observable internal transport barrier.
The radial locations span 0!#!0.75. This discharge is denoted by ‘‘L-modeA’’ in Table I. !b" Normalized $ i vs R/LTi , for a single time of an L-mode
discharge, denoted as ‘‘L-mode B’’ in Table I. Note the difference in the
vertical scale from Fig. 1!a". The line connects sequential radial points. Theradial locations span 0!#!0.85. !c" The same as !b", except the data is fordischarge ‘‘L-mode C.’’ !d" The same as !b", except the data is for discharge‘‘L-mode D.’’ Representative error bars are shown on various plots, but it
should be recognized that each point has its own error, which can vary from
point to point.
4130 Phys. Plasmas, Vol. 8, No. 9, September 2001 Baker et al.
Downloaded 23 Apr 2009 to 160.91.249.50. Redistribution subject to AIP license or copyright; see http://pop.aip.org/pop/copyright.jsp
Some of the aforementioned phenomenology could be understood if the confined plasma has its profiles close to marginal values for the onset of turbulence.
[See: D.R. Baker et al, Physics of Plasmas 8, 4138 (2001) ]
[See: P.H. Diamond and T.S. Hahm, Physics of Plasmas 3640, (1995)]
9Monday, October 15, 12
SOC AND TOKAMAK PLASMASAn analogy between HK’s sandpile an a magnetically confined toroidal fusion plasma can be easily done if it is near-marginal conditions.
[See: D.E. Newman et al, Phys. Plasmas 3, 1858 (1996)]
Den
sity
time
radius10Monday, October 15, 12
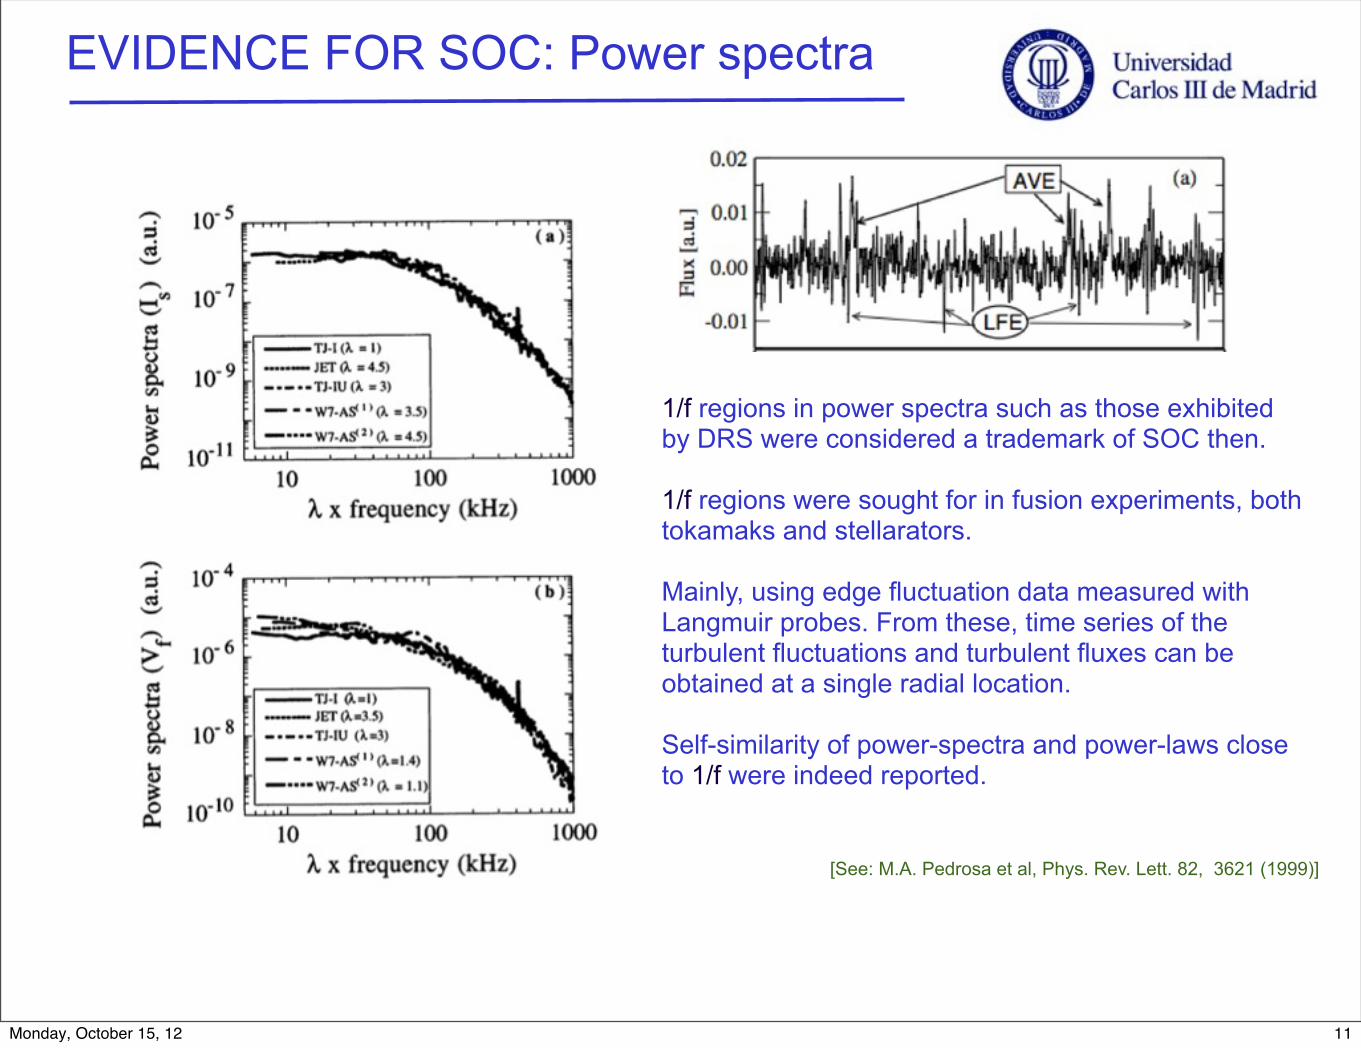
EVIDENCE FOR SOC: Power spectra
1/f regions in power spectra such as those exhibited by DRS were considered a trademark of SOC then.
1/f regions were sought for in fusion experiments, both tokamaks and stellarators.
Mainly, using edge fluctuation data measured with Langmuir probes. From these, time series of the turbulent fluctuations and turbulent fluxes can be obtained at a single radial location.
Self-similarity of power-spectra and power-laws close to 1/f were indeed reported.
[See: M.A. Pedrosa et al, Phys. Rev. Lett. 82, 3621 (1999)]
11Monday, October 15, 12
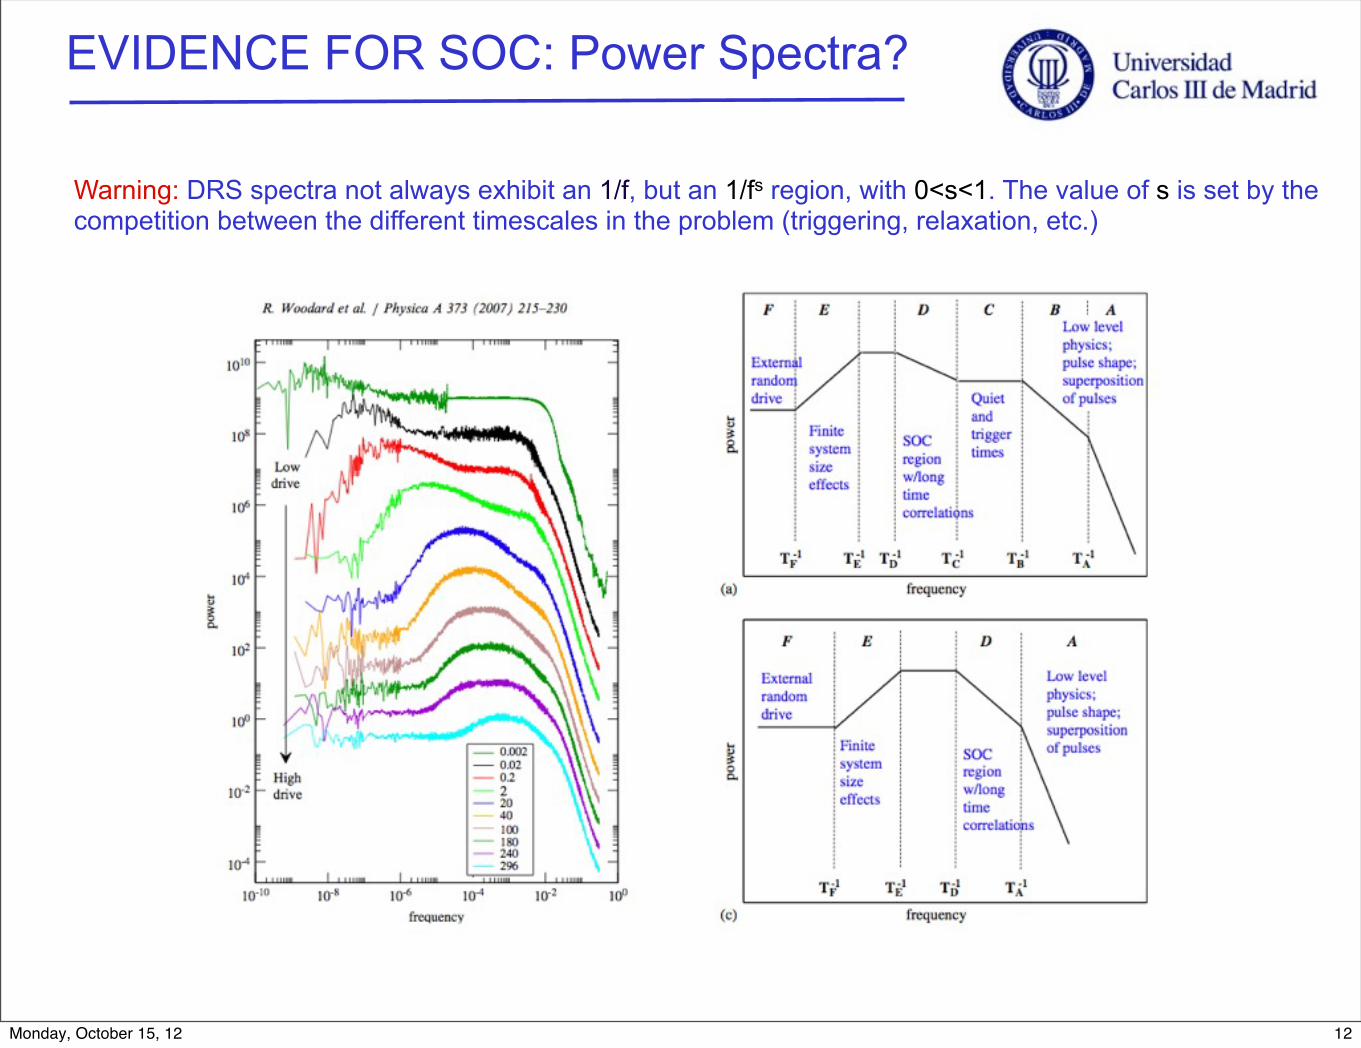
EVIDENCE FOR SOC: Power Spectra?
Warning: DRS spectra not always exhibit an 1/f, but an 1/fs region, with 0<s<1. The value of s is set by the competition between the different timescales in the problem (triggering, relaxation, etc.)
12Monday, October 15, 12

� �
� �H� �0.5
Hurst exponents: R/S analysis
The Hurst exponent was introduced by Hurst (1952) to quantify correlation in time series.
He assumed that any stationary signal can be thought of as the ordered sequence of displacements of a particle. If the signal is random, the motion of such a particle will be that of a random walk, and the distance from its initial position will grow on average as t1/2.
If the signal contains positive correlations between successive displacement, such distance will grow with a stronger exponent, tH, H > 1/2. Similarly, if negative correlations exist, it will grow with H < 1/2.
H, the Hurst exponent, can be determined in many ways. One of the most popular ones is the R/S method, which is one of the more un-sensitive to noises.
2
2.5
3
3.5
4
4.5
5
0 10 20 30 40 50
g(t)
Time (a.u.)
Reference line
Range
τ
R/s
Time lag
13Monday, October 15, 12

EVIDENCE FOR SOC: Hurst exponents
It is found that Hurst exponent values (for activity or local/global fluxes) are more robust than power-spectra exponents to capture DRS SOC dynamics.
[See: R. Woodard et al, Physica A 373, 215 (2007)]
14Monday, October 15, 12

EVIDENCE FOR SOC: Hurst exponents
A plethora of fusion experiments showed positively correlated Hurst exponents beyond the turbulent typical scales: the mesoscale.
[See: B. Carreras et al, Phys. Plasmas 5, 3632 (1998)]
15Monday, October 15, 12

EVIDENCE FOR SOC: Waiting times
In the late-90s, it was suggested that the statistics of waiting-times between avalanches could be used as a test for SOC.
In the original Bak sandpile and in DRS, waiting-times followed Poisson (exponential) statistics, due to the randomness of the drive.
This statement must be made more precise, though. When sufficiently large avalanches are considered, correlations are indeed apparent, and power-laws appear.
Furthermore, for non-random drives, power-laws may appear with no thresholding. These, however, are a reflection of drive correlations, not dynamical ones. Via thresholding, the SAME power-law can be made to appear as in the random drive case!
[See: R. Sanchez et al, Phys. Rev. Lett.88, 068302 (2002)]
16Monday, October 15, 12

EVIDENCE FOR SOC: Waiting times
The waiting-time statistics of edge fluctuation data from tokamaks and stellarators are consistent with SOC waiting-time statistics.
[See: R. Sanchez et al, Phys. Rev. Lett. 90, 185005 (2003)]
17Monday, October 15, 12
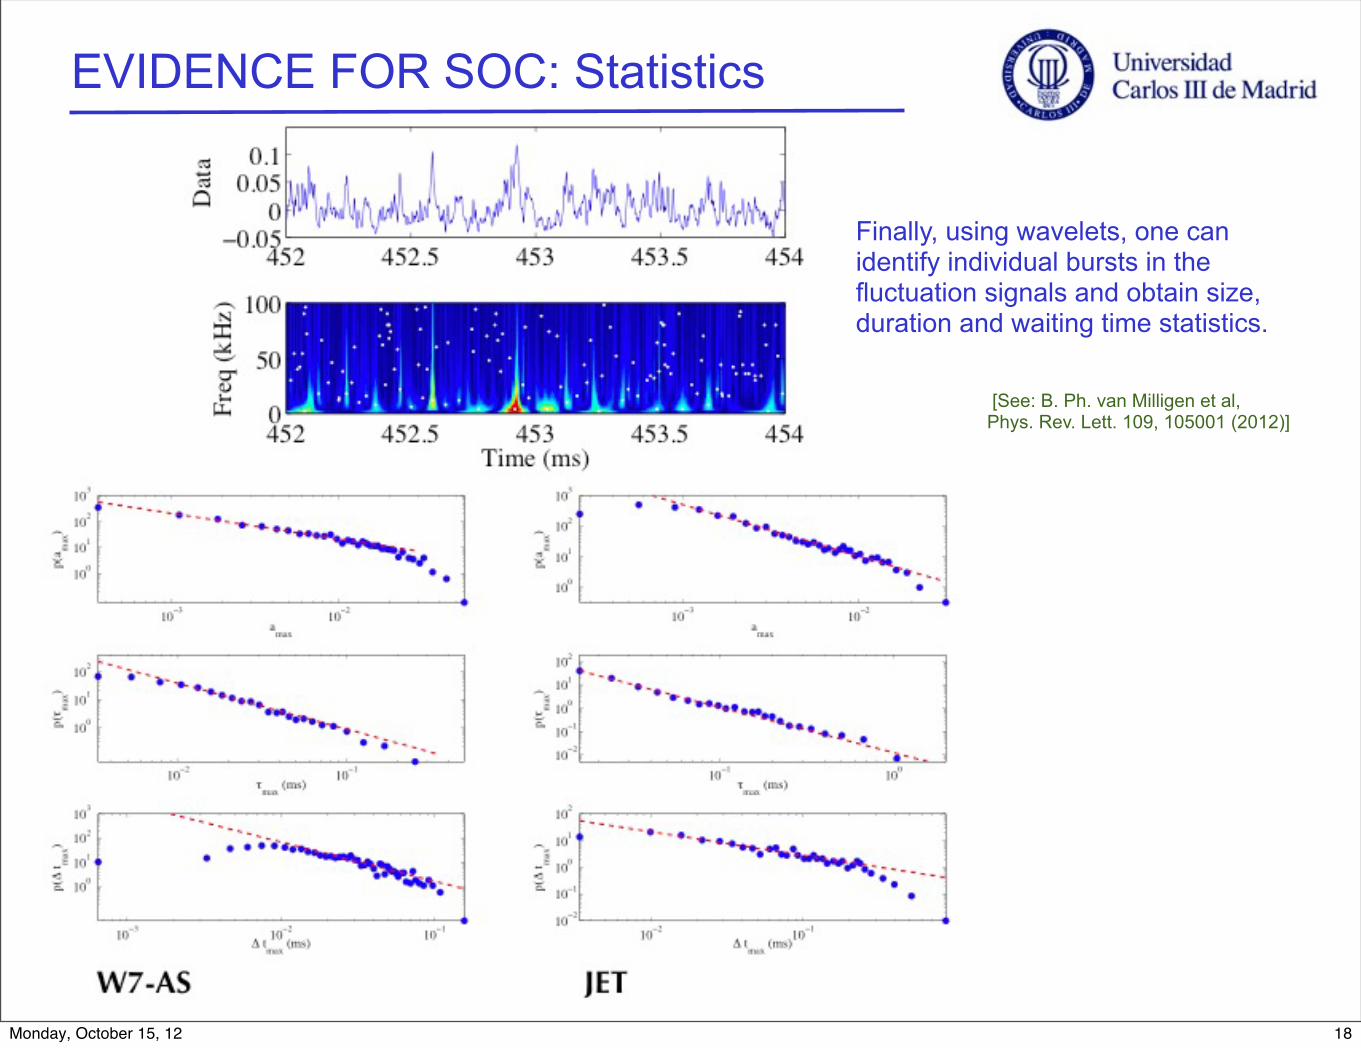
EVIDENCE FOR SOC: Statistics
Finally, using wavelets, one can identify individual bursts in the fluctuation signals and obtain size, duration and waiting time statistics.
[See: B. Ph. van Milligen et al, Phys. Rev. Lett. 109, 105001 (2012)]
18Monday, October 15, 12
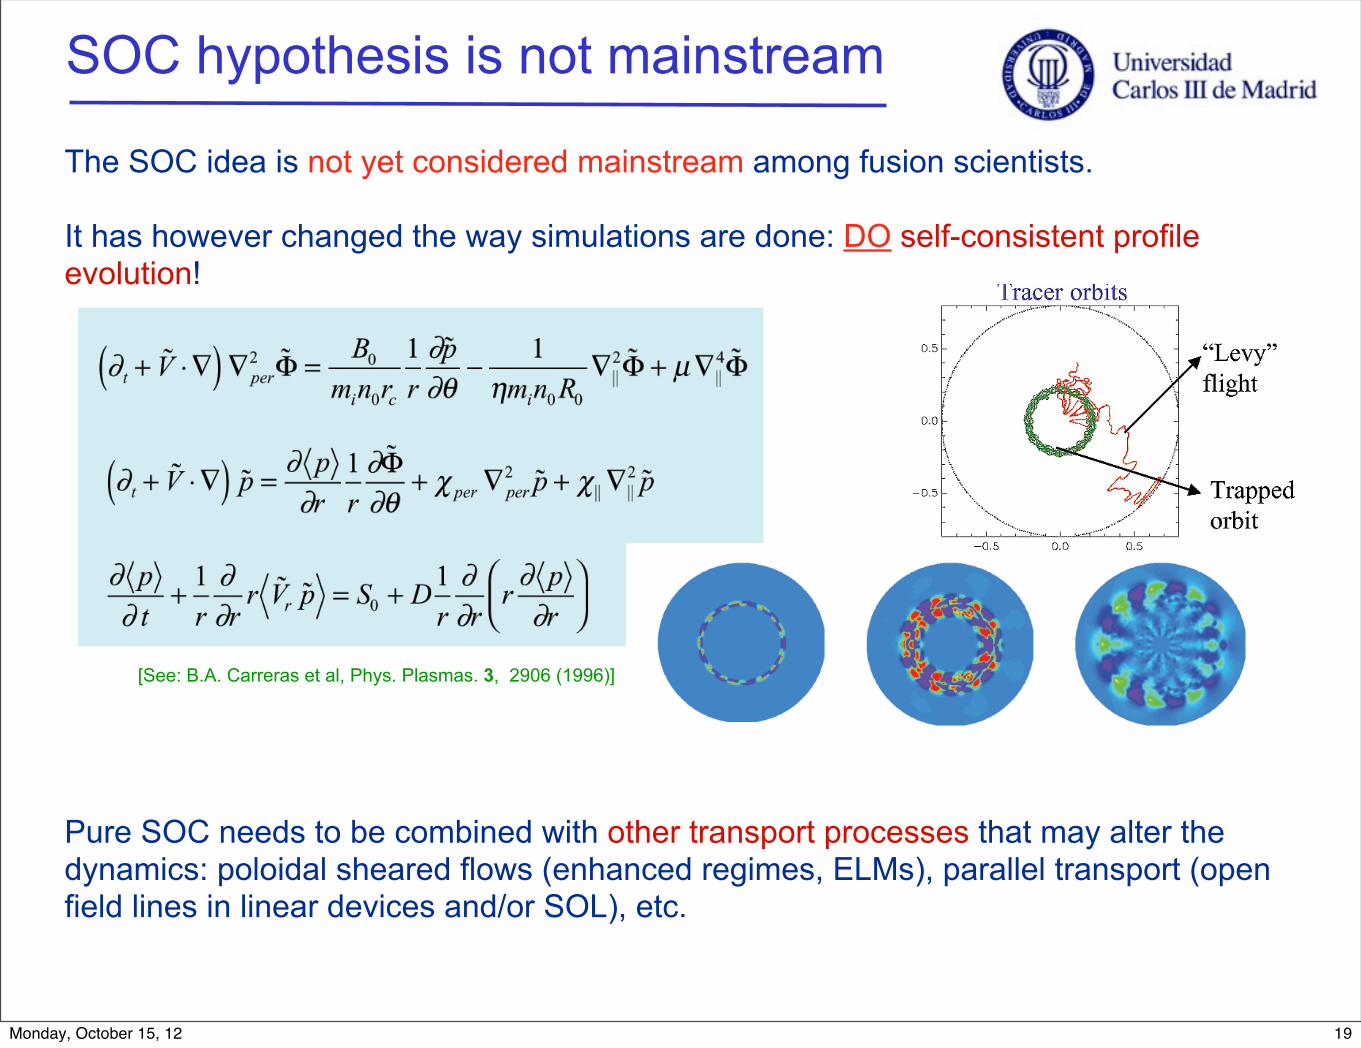
SOC hypothesis is not mainstream
The SOC idea is not yet considered mainstream among fusion scientists.
It has however changed the way simulations are done: DO self-consistent profile evolution!
Pure SOC needs to be combined with other transport processes that may alter the dynamics: poloidal sheared flows (enhanced regimes, ELMs), parallel transport (open field lines in linear devices and/or SOL), etc.
[See: B.A. Carreras et al, Phys. Plasmas. 3, 2906 (1996)]
19Monday, October 15, 12

SOC or non-SOC distinction matters!
ITER
But SOC may have very important implications for the future of fusion:
Intermittent transport events exiting the device with a divergent power-law distribution yield very different peak-energy loads (that must be absorbed by first walls/divertors) than in the case of diffusive transport. This issue is central to the design and cost of these elements of a reactor!
Scaling of energy confinement with the system size is also very different in a SOC state compared with the more traditional diffusive-like scalings. Huge implications for size needed for fusion and its cost!
Whether ITER will be in a SOC state or not is unknown. But the ability of turbulence to locally get rid of excess free energy increases with a power of temperature. And ITER will be very hot!
20Monday, October 15, 12

Modeling transport in fusion plasmas:
How does one effectively model transport and estimate confinement in a SOC state?
What are the proper “renormalized” fluxes that will do a good enough job?
21Monday, October 15, 12
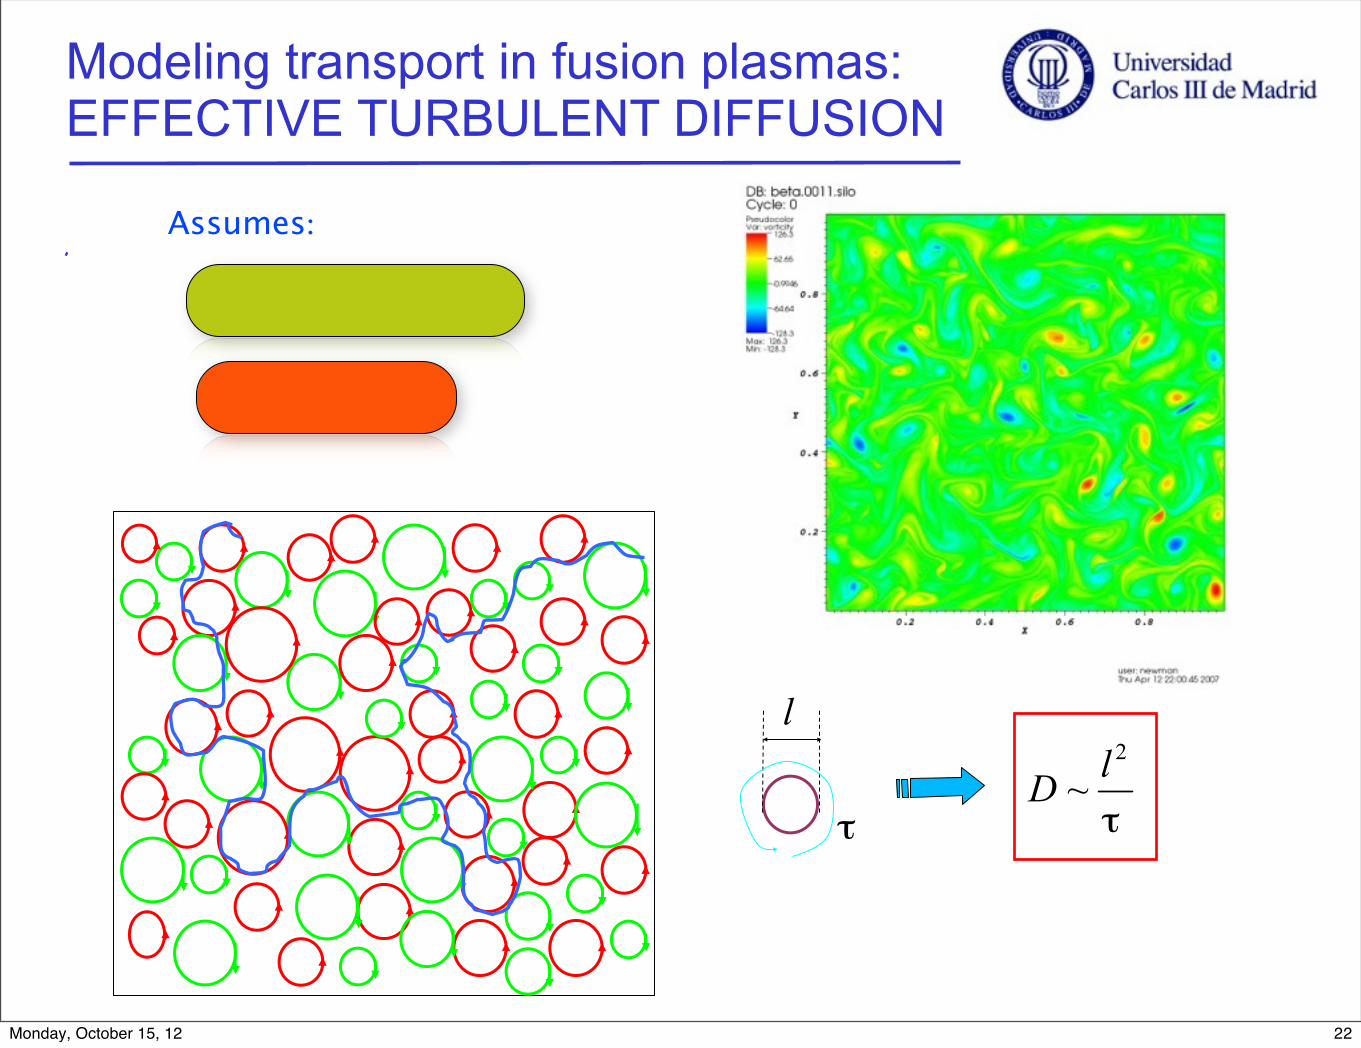
Modeling transport in fusion plasmas: EFFECTIVE TURBULENT DIFFUSION
Assumes:
Characteristic scales
Lack of memory
22Monday, October 15, 12

⇥n0
⇥t= ⇤ ·
⇤ t
0
�V(r, t)V(R(t�|r, t), t)⇤n0(R(t�|r, t), t)
⇥
Lagrangian trajectories
EFFECTIVE TURBULENT DIFFUSION:mathematical assumptions
[See: R. Balescu, “Aspects of Plasma Turbulent Transport”, IOP, Bristol (2005) ]
23Monday, October 15, 12
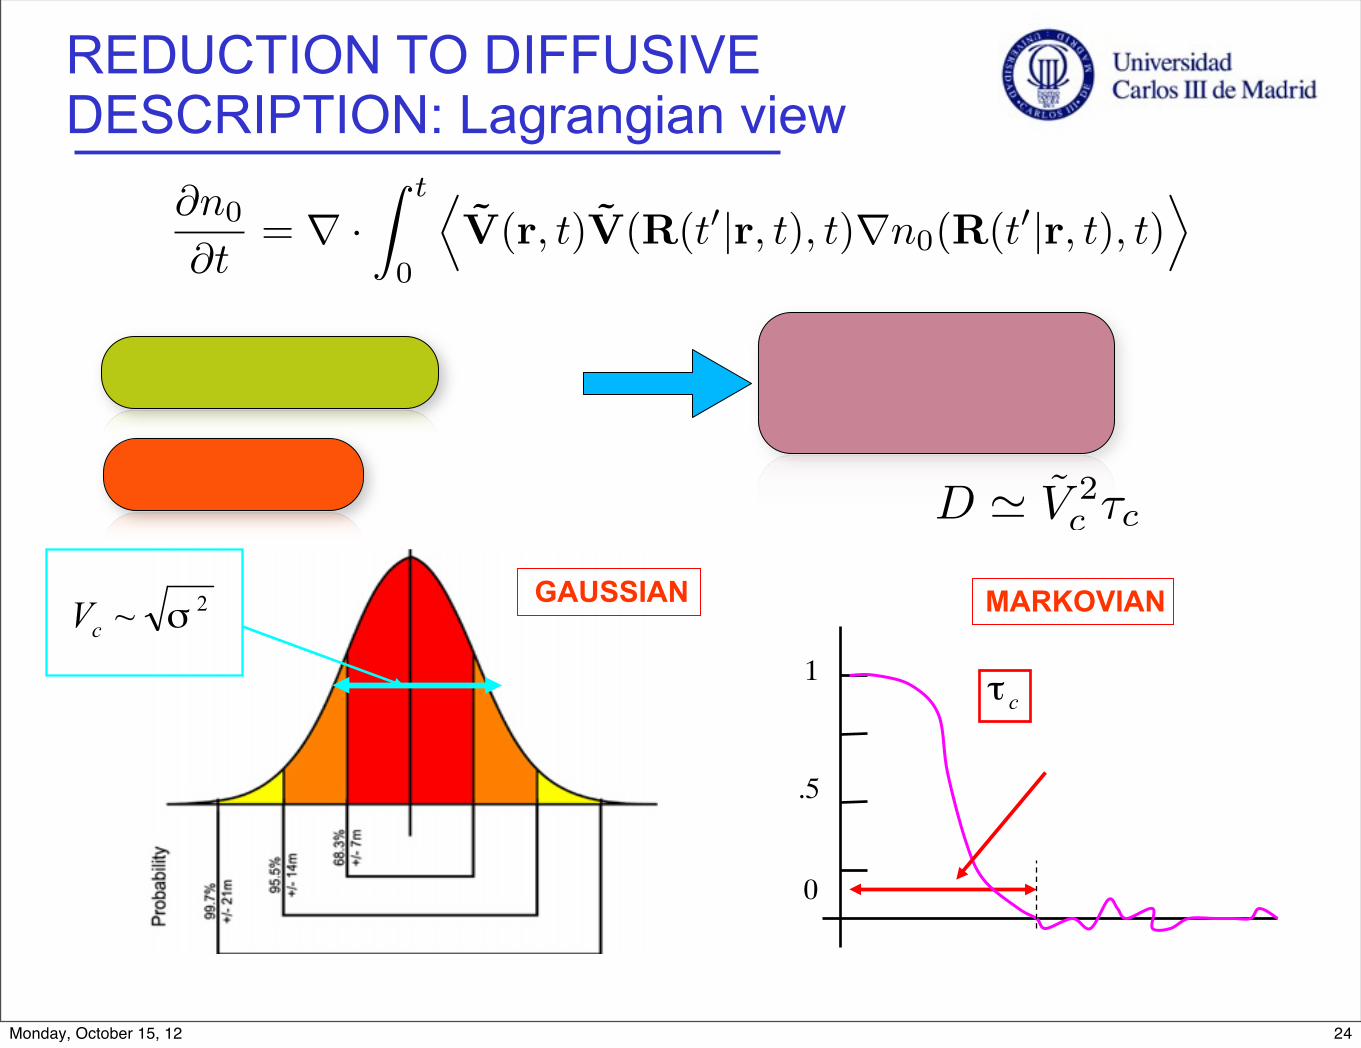
D � V 2c �c
�n
�t� D
�n
�x2
REDUCTION TO DIFFUSIVE DESCRIPTION: Lagrangian view
MARKOVIANGAUSSIAN
1
0
.5
Characteristic Scales
Lack of Memory
⇥n0
⇥t= ⇤ ·
⇤ t
0
�V(r, t)V(R(t�|r, t), t)⇤n0(R(t�|r, t), t)
⇥
24Monday, October 15, 12
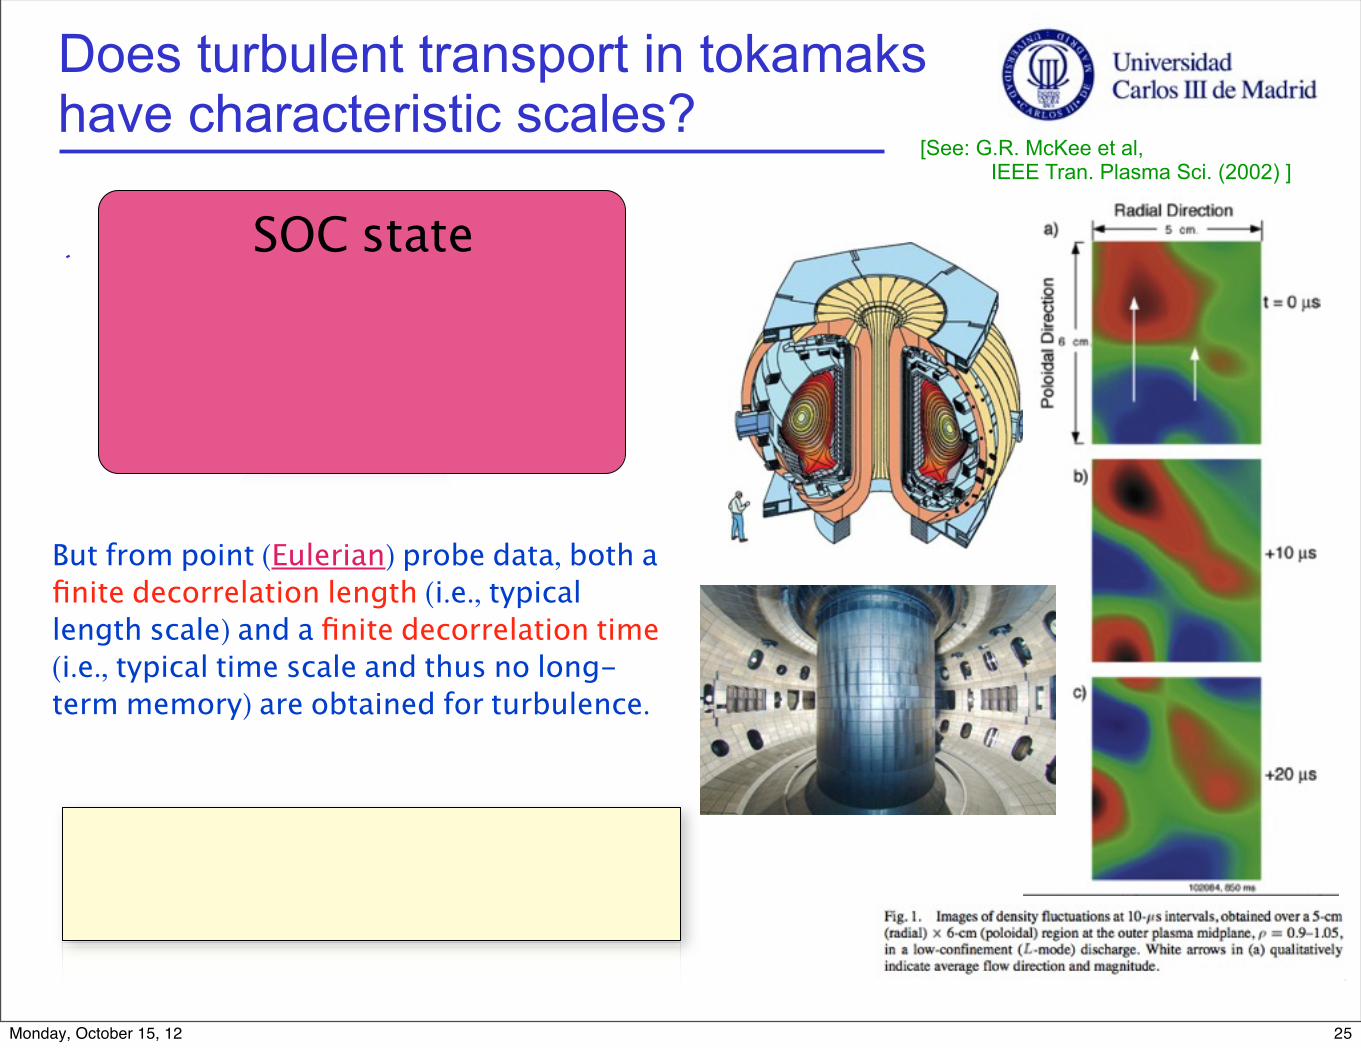
Does turbulent transport in tokamaks have characteristic scales?
Lack of characteristic scales
Memory
But from point (Eulerian) probe data, both a finite decorrelation length (i.e., typical length scale) and a finite decorrelation time (i.e., typical time scale and thus no long-term memory) are obtained for turbulence.
So how is it even possible that SOC play a role at all in this context?
SOC state
[See: G.R. McKee et al, IEEE Tran. Plasma Sci. (2002) ]
25Monday, October 15, 12
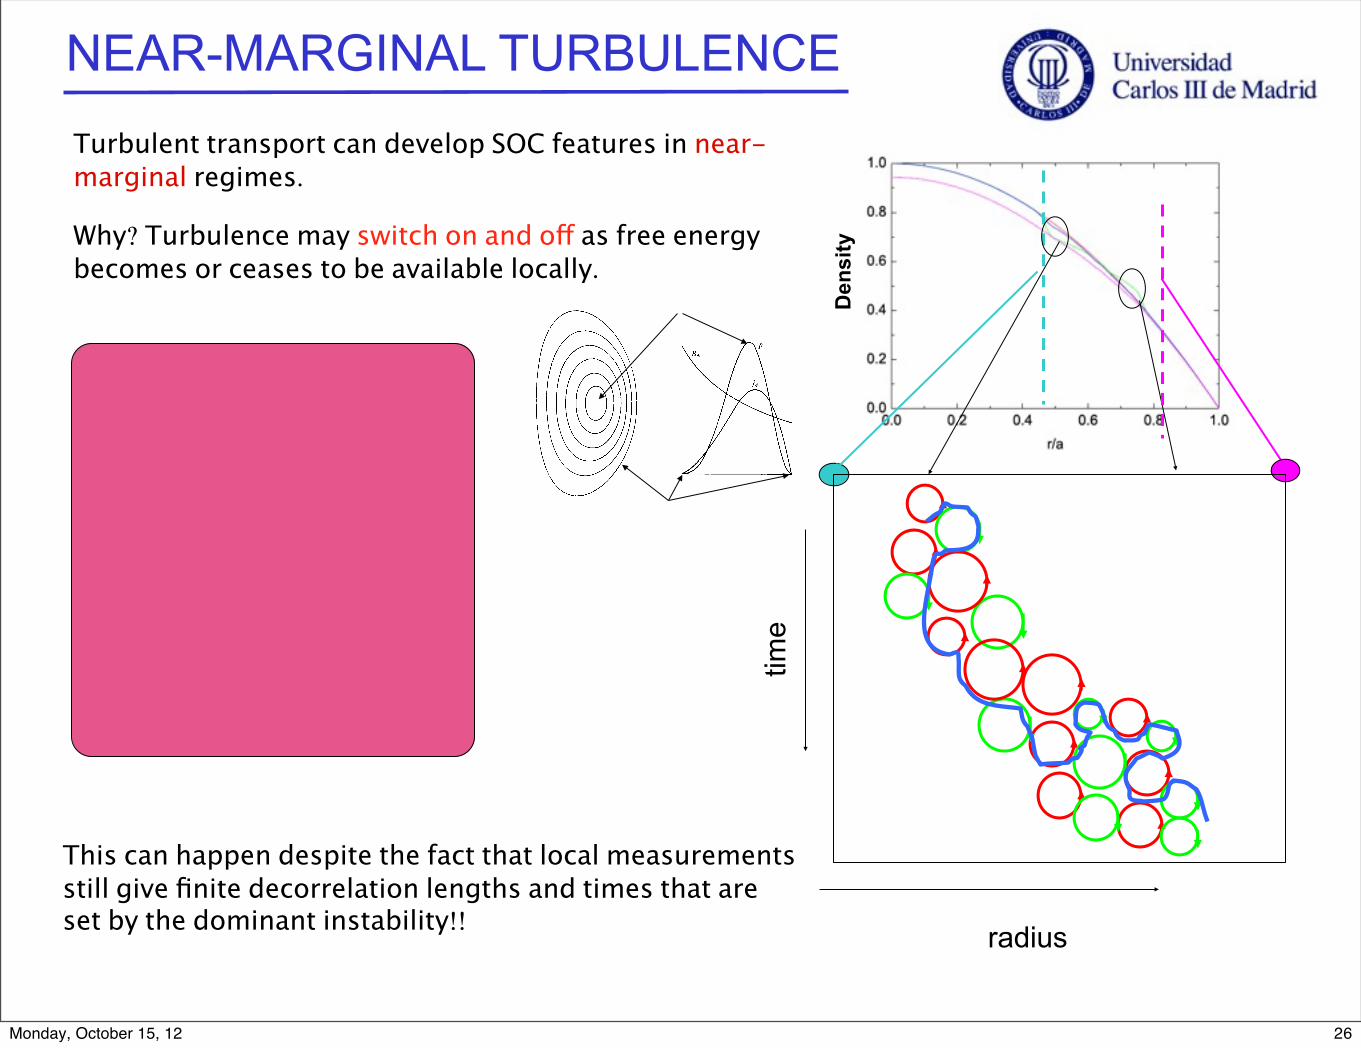
NEAR-MARGINAL TURBULENCE
Memory stored in profile
Den
sity
time
radius
Spatio-temporalcorrelations
Transport via avalanches
Lack of typical scales
Turbulent transport can develop SOC features in near-marginal regimes.
Why? Turbulence may switch on and off as free energy becomes or ceases to be available locally.
This can happen despite the fact that local measurements still give finite decorrelation lengths and times that are set by the dominant instability!!
26Monday, October 15, 12
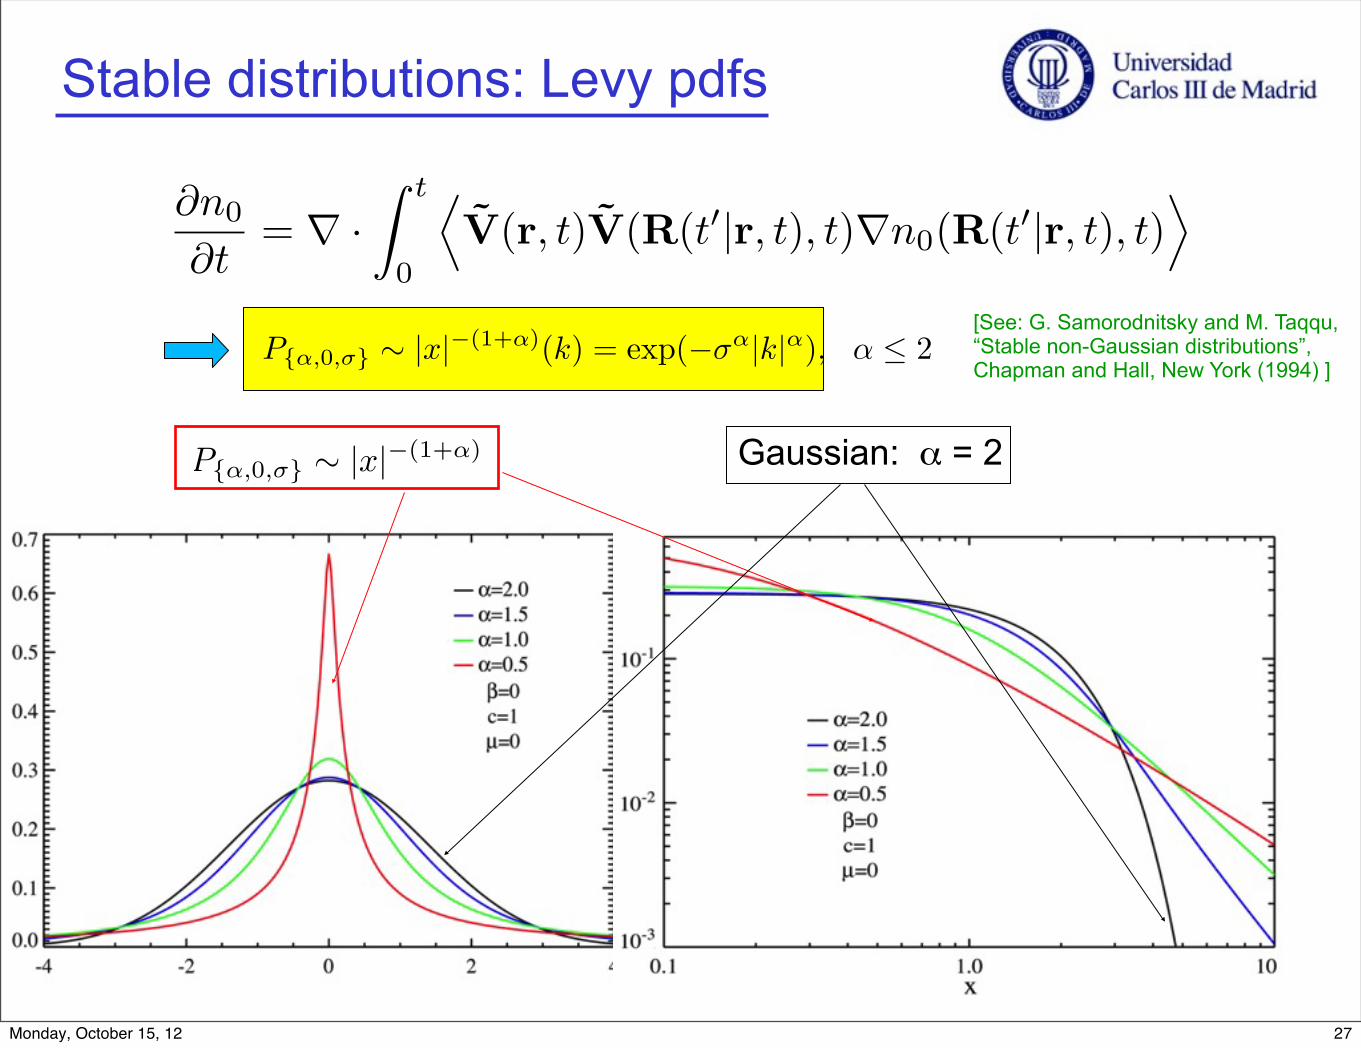
Stable distributions: Levy pdfs
P{�,0,⇥} � |x|�(1+�) Gaussian: α = 2
P{�,0,⇥} ⇤ |x|�(1+�)(k) = exp(�⇥�|k|�), � ⇥ 2
⇥n0
⇥t= ⇤ ·
⇤ t
0
�V(r, t)V(R(t�|r, t), t)⇤n0(R(t�|r, t), t)
⇥
[See: G. Samorodnitsky and M. Taqqu, “Stable non-Gaussian distributions”, Chapman and Hall, New York (1994) ]
27Monday, October 15, 12
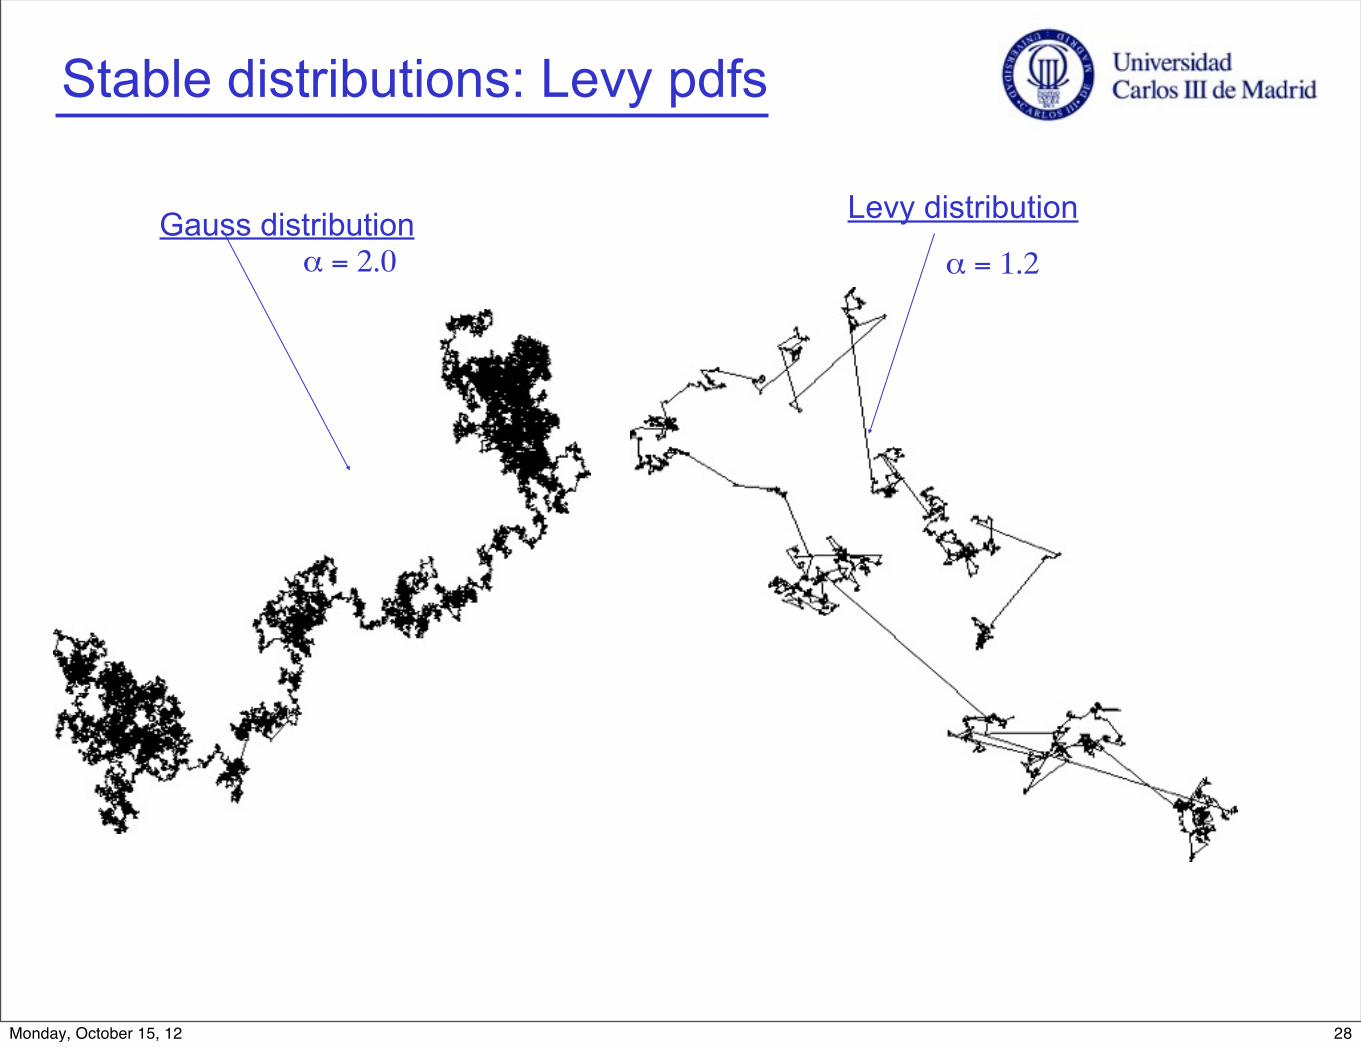
Levy distributionGauss distributionα = 1.2α = 2.0
Stable distributions: Levy pdfs
28Monday, October 15, 12

LAGRANGIAN MEMORY
Levy distribution
α = 1.2
Gauss distribution
α = 2.0
Η=1/α, random; Η > 1/α, correlated positively; Η < 1/α, correlated negatively
⇥n0
⇥t= ⇤ ·
⇤ t
0
�V(r, t)V(R(t�|r, t), t)⇤n0(R(t�|r, t), t)
⇥
[See: B.B. Mandelbrot and J.W. van Ness,SIAM Review 10, 422 (1968); I. Calvo and R. Sanchez, J. Phys. A 32, 055003 (2009) ]
[See: H.E. Hurst, Trans. Am. Soc. Civ. Eng. 110, 770 (1951)] ]
H, Hurst exponent
29Monday, October 15, 12
�n
�t= 0D
1��Ht
�D
��n
�|x|�
�
�n
�t= D
�2n
�x2
No!
Yes!
Fractional Transport equations
Standard Transport equations
“Complex” EFFECTIVE TRANSPORT
Spatio-temporalcorrelations
Lack of typical scales
Lack of memory Typical scales
[See: R. Sanchez, B.ph. van Milligen, B.A. Carreras and D.E. Newman,
Physical Review E 74, 016305 (2006) ]
30Monday, October 15, 12

r
φ
θ
routrin
Dissipative trapped electron mode (DTEM) plasma turbulence in a periodic cylinder
NEAR-MARGINAL SIMULATION:An example of SOC transport
Den
sity
31Monday, October 15, 12

Lagrangian information from DTEM TURBULENCE SIMULATION
Spatio-temporalcorrelations
Lack of typical scales
[See: J.A. Mier, R. Sanchez, L. Garcia, D.E. Newman and B.A. Carreras,
Phys. Rev. Lett. 101,165001 (2008)]
32Monday, October 15, 12
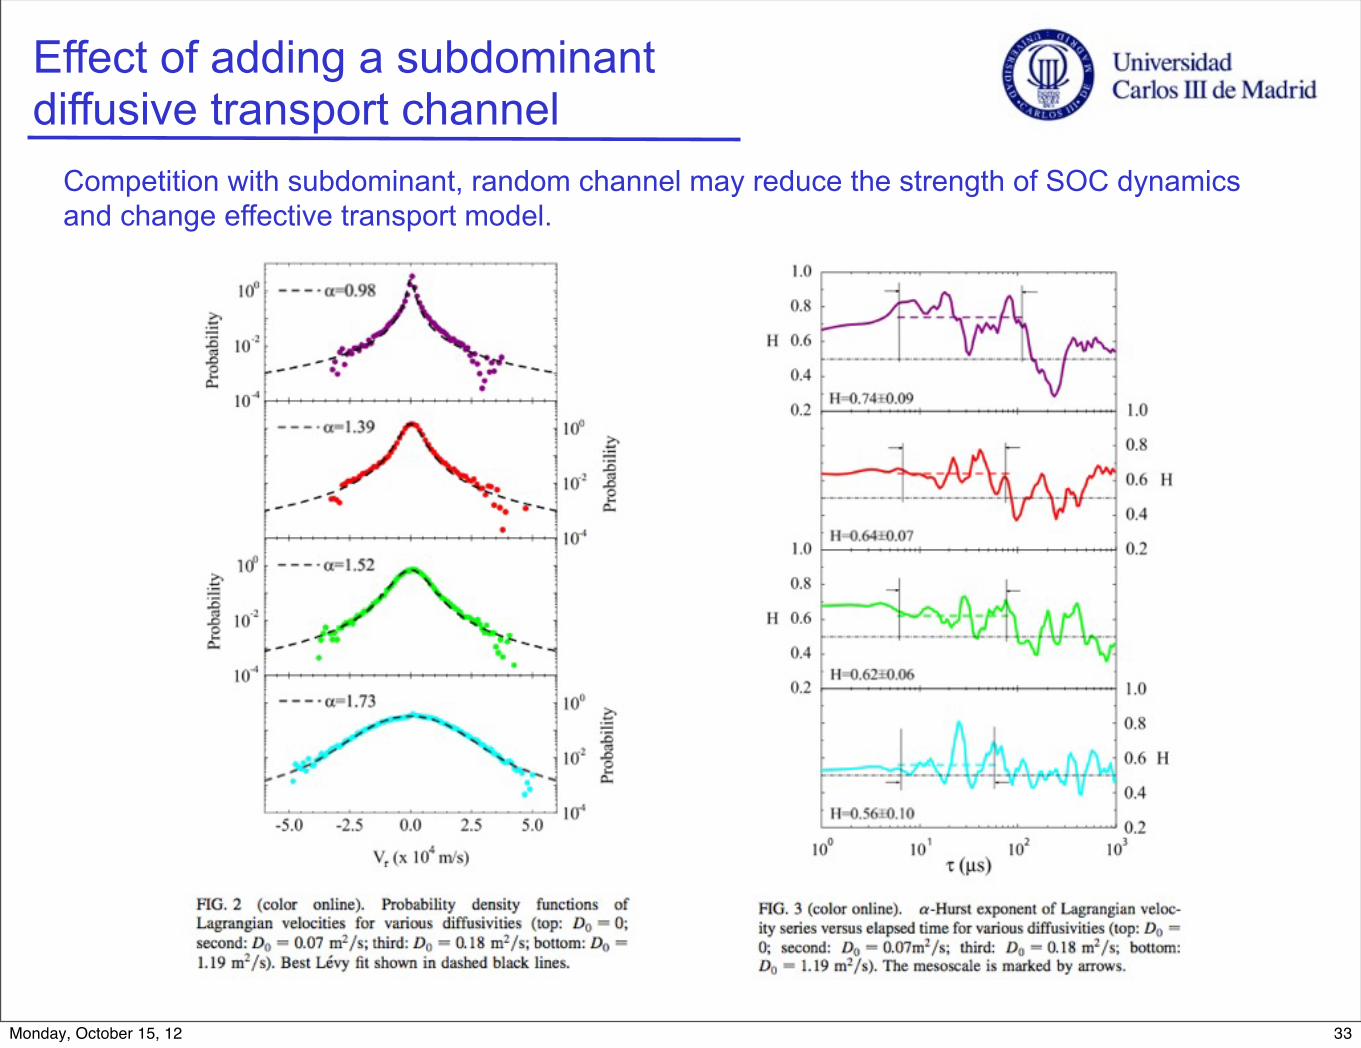
Effect of adding a subdominant diffusive transport channel
Competition with subdominant, random channel may reduce the strength of SOC dynamics and change effective transport model.
33Monday, October 15, 12

CONCLUSIONS
• Turbulence involves many degrees of freedom and nonlinear interactions à breeding ground for self-organized criticality and complexity
• Toroidal fusion plasmas confined in tokamaks or stellarators are strongly turbulent and may exhibit complex behaviors: emergence of patterns and coherent structures, self-organization, memory, etc.
• Near-marginal turbulence is an example of a situation in which ‘SOC’ behaviors should be expected in fusion plasmas.
• Relevant from practical stand-point: even if mean energy outflux is fixed by external heating in steady-state, intermittent dynamics may yield large peak outfluxes that first wall components and/or divertors may not be able to withstand.
• Scaling of confinement properties with system size also quite different in SOC-dominated regimes.
• Tools, mathematical models and ideas from “complexity theory” are very useful to understand and characterize what is going on in SOC states.
34Monday, October 15, 12


![[ON TIME-CRITICALITY] TIME-CRITICALITY … · ["ON TIME-CRITICALITY"] TIME-CRITICALITY Time-critical signal processing in humans and machines ... - ancient Greek prosody based on](https://static.fdocuments.in/doc/165x107/5b914fb509d3f215288b5a2b/on-time-criticality-time-criticality-on-time-criticality-time-criticality.jpg)

