
Self-Organization of Myosin II in Reconstituted Actomyosin...
10
Self-Organization of Myosin II in Reconstituted Actomyosin Bundles Matthew R. Stachowiak, † Patrick M. McCall, ‡§ Todd Thoresen, ‡{ Hayri E. Balcioglu, † Lisa Kasiewicz, † Margaret L. Gardel, ‡§{ and Ben O’Shaughnessy † * † Department of Chemical Engineering, Columbia University, New York, New York; and ‡ Department of Physics, § James Franck Institute, and { Institute for Biophysical Dynamics, University of Chicago, Chicago, Illinois ABSTRACT Cells assemble a variety of bundled actomyosin structures in the cytoskeleton for activities such as cell-shape regulation, force production, and cytokinesis. Although these linear structures exhibit varied architecture, two common organi- zational themes are a punctate distribution of myosin II and distinct patterns of actin polarity. The mechanisms that cells use to assemble and maintain these organizational features are poorly understood. To study these, we reconstituted actomyosin bundles in vitro that contained only actin filaments and myosin II. Upon addition of ATP, the bundles contracted and the uniformly distributed myosin spontaneously reorganized into discrete clusters. We developed a mathematical model in which the motion of myosin II filaments is governed by the polarities of the actin filaments with which they interact. The model showed that the assembly of myosins into clusters is driven by their tendency to migrate to locations with zero net actin filament polarity. With no fitting parameters, the predicted distribution of myosin cluster separations was in close agreement with our experiments, including a 3/2 power law decay for intermediate length scales. Thus, without an organizing template or accessory proteins, a minimal bundle of actin and myosin has the inherent capacity to self-organize into a heterogeneous banded structure. INTRODUCTION The actin cytoskeleton serves many purposes for cells, such as providing structural stability, guiding intracellular trans- port, and generating contractile force (1). To perform these diverse functions, the cytoskeleton adopts a variety of organizations which require assembly and maintenance processes that can deliver components with tight spatial and temporal regulation (2–4). Cytoskeletal structures that exert contractile force are based on actin filaments, myosin II, and other components. Cells assemble these compo- nents into contractile networks and bundles (5) for physio- logical processes such as muscle contraction (6), cell division (7,8), cell migration (9,10), and tissue morphogen- esis (11,12). A common organizational feature of diverse con- tractile actomyosin structures is the presence of myosin II puncta. In nonmuscle cells, such puncta are aggregates of bipolar minifilaments, each containing ~10–30 nonmuscle myosin II dimers (13,14). A second feature, demonstrated for some actomyosin organizations, is spatially organized actin filament polarity that is correlated with myosin posi- tions. These features are most clearly seen in the myofibrils of striated muscle whose architecture, based on the sarco- mere repeat unit, exhibits spatially periodic actin filament polarity and myosin II density (6). In muscle, myosin II thick filaments contract sarcomeres by pulling inward on actin filaments whose pointed ends orient toward the myosin located at the sarcomere center, whereas the barbed ends reside at the sarcomere boundaries. By comparison, actomy- osin bundles in nonmuscle cells display a broad range of architectures. In stationary cells, stress fibers, contractile bundles of actin filaments and myosin II, display sarco- mere-like structure, including alternating actin polarity and regularly spaced distinct myosin puncta with a period of ~1 mm along the bundle (15,16). However, stress fibers in migrating cells display both graded and mixed actin filament polarity (15), and in fission yeast, the cyto- kinetic contractile ring contains irregularly organized myosin puncta and apparently random actin filament polarity (17,18). Recent studies have addressed the processes used by cells to assemble and organize the components that constitute these actomyosin structures. Dorsal stress fibers are assem- bled by formin-mediated polymerization of actin filaments from focal adhesions, after which myosin puncta appear that displace the actin filament cross-linking protein a-actinin (4). Once assembled, mature stress fibers and other actomyosin bundles undergo continuous actin polymeriza- tion from focal adhesions and insertion of nascent puncta of myosin II and a-actinin (19,20). However, the mecha- nisms that underlie these processes of organization remain poorly understood. Two broad strategies of assembly and organization of actomyosin structures can be envisaged: templating and self-assembly. In a templating strategy, preexisting templates bearing the blueprint of the structure to be assem- bled could act as molecular scaffolds to direct components to specific locations. In striated muscle the giant proteins ti- tin, nebulin, and obscurin may assume such a role (21), and c-titin, an isoform expressed in nonmuscle cells, has been Submitted April 24, 2012, and accepted for publication August 9, 2012. *Correspondence: [email protected] Hayri E. Balcioglu’s present address is Division of Toxicology, Leiden/ Amsterdam Center for Drug Research, Leiden University, Leiden, The Netherlands Editor: David Odde. Ó 2012 by the Biophysical Society 0006-3495/12/09/1265/10 $2.00 http://dx.doi.org/10.1016/j.bpj.2012.08.028 Biophysical Journal Volume 103 September 2012 1265–1274 1265
Transcript of Self-Organization of Myosin II in Reconstituted Actomyosin...
Biophysical Journal Volume 103 September 2012 1265–1274 1265
Self-Organization of Myosin II in Reconstituted Actomyosin Bundles
Matthew R. Stachowiak,† Patrick M. McCall,‡§ Todd Thoresen,‡{ Hayri E. Balcioglu,† Lisa Kasiewicz,†
Margaret L. Gardel,‡§{ and Ben O’Shaughnessy†*†Department of Chemical Engineering, Columbia University, New York, New York; and ‡Department of Physics, §James Franck Institute, and{Institute for Biophysical Dynamics, University of Chicago, Chicago, Illinois
ABSTRACT Cells assemble a variety of bundled actomyosin structures in the cytoskeleton for activities such as cell-shaperegulation, force production, and cytokinesis. Although these linear structures exhibit varied architecture, two common organi-zational themes are a punctate distribution of myosin II and distinct patterns of actin polarity. The mechanisms that cells use toassemble and maintain these organizational features are poorly understood. To study these, we reconstituted actomyosinbundles in vitro that contained only actin filaments andmyosin II. Upon addition of ATP, the bundles contracted and the uniformlydistributed myosin spontaneously reorganized into discrete clusters. We developed a mathematical model in which the motion ofmyosin II filaments is governed by the polarities of the actin filaments with which they interact. The model showed that theassembly of myosins into clusters is driven by their tendency to migrate to locations with zero net actin filament polarity. Withno fitting parameters, the predicted distribution of myosin cluster separations was in close agreement with our experiments,including a �3/2 power law decay for intermediate length scales. Thus, without an organizing template or accessory proteins,a minimal bundle of actin and myosin has the inherent capacity to self-organize into a heterogeneous banded structure.
INTRODUCTION
The actin cytoskeleton serves many purposes for cells, suchas providing structural stability, guiding intracellular trans-port, and generating contractile force (1). To perform thesediverse functions, the cytoskeleton adopts a variety oforganizations which require assembly and maintenanceprocesses that can deliver components with tight spatialand temporal regulation (2–4). Cytoskeletal structures thatexert contractile force are based on actin filaments, myosinII, and other components. Cells assemble these compo-nents into contractile networks and bundles (5) for physio-logical processes such as muscle contraction (6), celldivision (7,8), cell migration (9,10), and tissue morphogen-esis (11,12).
A common organizational feature of diverse con-tractile actomyosin structures is the presence of myosin IIpuncta. In nonmuscle cells, such puncta are aggregates ofbipolar minifilaments, each containing ~10–30 nonmusclemyosin II dimers (13,14). A second feature, demonstratedfor some actomyosin organizations, is spatially organizedactin filament polarity that is correlated with myosin posi-tions. These features are most clearly seen in the myofibrilsof striated muscle whose architecture, based on the sarco-mere repeat unit, exhibits spatially periodic actin filamentpolarity and myosin II density (6). In muscle, myosin IIthick filaments contract sarcomeres by pulling inward onactin filaments whose pointed ends orient toward the myosin
Submitted April 24, 2012, and accepted for publication August 9, 2012.
*Correspondence: [email protected]
Hayri E. Balcioglu’s present address is Division of Toxicology, Leiden/
Amsterdam Center for Drug Research, Leiden University, Leiden, The
Netherlands
Editor: David Odde.
� 2012 by the Biophysical Society
0006-3495/12/09/1265/10 $2.00
located at the sarcomere center, whereas the barbed endsreside at the sarcomere boundaries. By comparison, actomy-osin bundles in nonmuscle cells display a broad range ofarchitectures. In stationary cells, stress fibers, contractilebundles of actin filaments and myosin II, display sarco-mere-like structure, including alternating actin polarityand regularly spaced distinct myosin puncta with aperiod of ~1 mm along the bundle (15,16). However, stressfibers in migrating cells display both graded and mixedactin filament polarity (15), and in fission yeast, the cyto-kinetic contractile ring contains irregularly organizedmyosin puncta and apparently random actin filamentpolarity (17,18).
Recent studies have addressed the processes used by cellsto assemble and organize the components that constitutethese actomyosin structures. Dorsal stress fibers are assem-bled by formin-mediated polymerization of actin filamentsfrom focal adhesions, after which myosin puncta appearthat displace the actin filament cross-linking proteina-actinin (4). Once assembled, mature stress fibers and otheractomyosin bundles undergo continuous actin polymeriza-tion from focal adhesions and insertion of nascent punctaof myosin II and a-actinin (19,20). However, the mecha-nisms that underlie these processes of organization remainpoorly understood.
Two broad strategies of assembly and organizationof actomyosin structures can be envisaged: templatingand self-assembly. In a templating strategy, preexistingtemplates bearing the blueprint of the structure to be assem-bled could act as molecular scaffolds to direct componentsto specific locations. In striated muscle the giant proteins ti-tin, nebulin, and obscurin may assume such a role (21), andc-titin, an isoform expressed in nonmuscle cells, has been
http://dx.doi.org/10.1016/j.bpj.2012.08.028
1266 Stachowiak et al.
identified in stress fibers, although its role is unknown. Ina self-assembly strategy, components could spontaneouslyassemble themselves into organized structures. For ex-ample, to assemble its cytokinetic contractile ring, fissionyeast uses a dynamic search-and-capture mechanism inwhich membrane-anchored components condense them-selves into a tight ring by transient actin connections thatmyosin II pulls upon to draw the components together (8).
In vitro reconstitution of minimal actomyosin structuresis a powerful approach to expose mechanisms of assembly,organization, and function. Some of the authors of this studyrecently reconstituted networks of actomyosin bundlestethered to substrate-bound beads (22). At a sufficientlyhigh density of myosin, they observed spontaneous as-sembly of bundles that contained only actin filaments andsmooth muscle myosin II thick filaments. Upon additionof ATP, the bundles contracted and became taut, generating~500 pN of tension. This showed that myosin acting alone iscapable of eliciting contraction of actin bundles on cellularlength scales.
Here, we reconstituted contractile bundles of actin fila-ments and skeletal muscle myosin II thick filaments to inves-tigate the mechanisms of organization. In the presence ofATP, the bundles contracted and became taut over severalseconds. Over a longer timescale of ~30 s, skeletal musclemyosin II, initially distributed uniformly along the bundles,self-organized into distinct puncta reminiscent of those in theactomyosin cytoskeleton of living cells. This demonstratesthat myosin II self-organizes into a punctate spatial arrange-ment without templating and without the accessory proteinsfound in cellular actomyosin bundles. To understand themyosin II self-organization quantitatively, we developed amathematical model based on the forces exerted by myosinII thick filaments on actin filaments. These forces propelmyosin in the direction of local actin polarity in the bundle.The resulting motions aggregate myosin filaments at thosebundle locations where the net bundle polarity vanishes.With no fitting parameters, our model successfully repro-duces the broad distribution of distances between neigh-boring myosin puncta, dmyo, observed in our experiments.In particular, our prediction that the distribution followsa power-law decay of � d
�3=2myo on intermediate scales less
than the filament length is in remarkably close agreementwith our measurements. Our results suggest that polarity ofthe local actin network is an important regulator of myosinII organization, and that cells may employ a self-assemblystrategy to organize components in actomyosin assemblies.
MATERIALS AND METHODS
Buffers
Spin-down buffer
20 mM MOPS, pH 7.4, 500 mM KCl, 4 mM MgCl2, 0.1 mM EGTA, and
500 mM ATP.
Biophysical Journal 103(6) 1265–1274
Wash buffer
20 mM MOPS, pH 7.4, 50 mM KCl, 4 mM MgCl2, and 0.1 mM EGTA.
Assay buffer
20 mM MOPS, pH 7.4, 100 mM KCl, 4 mM MgCl2, 0.1 mM EGTA,
0.7% methylcellulose, 0.25 mg/mL glucose, 0.25% b-ME, 0.25 mg/mL
glucose oxidase, and 35 mg/mL catalase.
Protein preparations
Myosin thick filaments
Rabbit skeletal muscle myosin II (Cytoskeleton, Denver, CO) is fluores-
cently labeled with Oregon Green (OG) 488 maleimide dye (Molecular
Probes, Invitrogen, Carlsbad, CA), as described previously (13). Snap-
frozen aliquots of OG-labeled and phosphorylated myosin are rapidly
thawed. To isolate active myosin, myosin dimers are mixed with phalloi-
din-stabilized F-actin at a 1:4 myosin/actin molar ratio in spin-down buffer
and centrifuged for 30 min at 100,000 � g. The supernatant contains
myosin with low affinity to F-actin in saturating ATP (presumed to be enzy-
matically active), whereas the high-affinity binding fraction cosediments
with the F-actin pellet (presumed to be enzymatically dead). Myosin protein
concentrations are determined spectroscopically. Myosin thick filaments,
which we estimate are typically no more than 0.5 mm in length (see
Fig. S1 in the Supporting Material), are formed by diluting myosin in assay
buffer, thus changing the salt conditions from 500 mM to 120 mM KCl and
waiting 10 min at room temperature.
Actin filaments
Preparation of actin was described in a previous study (22). G-actin
was generously supplied by Dr. David Kovar (University of Chicago,
Chicago, IL).
Assembly of bundled F-actin networks
Bead and coverslip preparation were described previously (22). Assembly
of a network of bundles existing predominately within a single confocal
plane is achieved using steps similar to those described in a previous study
(22). First, a 10- to 20-mm-thick polyacrylamide gel is formed on a cover-
slip, and biotinylated BSA is covalently attached to the top surface. This
substrate is largely inert to nonspecific myosin or actin binding (23). The
substrate is loaded into a flow chamber customized for imaging with
high-numerical-aperture objectives and small (~30 mL) exchange volumes.
A dilute suspension of 3-mm-diameter neutravidin-coated beads in wash
buffer is perfused into the flow chamber and incubated for ~10 min to allow
the beads to sediment and bind to the biotinylated-BSA surface. Unbound
beads are removed by further perfusion of wash buffer. Tetramethylrhod-
amine (TMR)-phalloidin-stabilized F-actin containing 10% biotinylated
G-actin is gently sheared to a mean length of ~6.5 mm (22), diluted to
1 mM in assay buffer, and perfused into the chamber. Over 30 min, F-actin
binds to the avidin beads, forming asters that likely contain actin filaments
of random polarity (22). Amajority of unbound F-actin is removed by perfu-
sion of two chamber volumes of assay buffer. The remaining bead-bound
F-actin provides sites to template the assembly of actomyosin bundles.
Upon perfusion of assay buffer containing myosin thick filaments in an
ADP background, a bundled network forms over 30 min. The chamber is
then washed with one volume of assay buffer, and contraction is initiated
via perfusion of assay buffer with 100 mM ATP. Microscopy was described
previously (22). All images shown are inverted contrast with low-pass
filtering. We have observed myosin self-organization qualitatively in
numerous experiments over several years; quantitative results presented in
this articlewere obtained from two independent experiments, one containing
261 total actomyosin bundles and the other containing 118 total bundles.
Self-Organization of Myosin 1267
Image analysis
The timescale for myosin II to reach its steady-state distribution is
defined by the first image in which myosin ceases visible motion.
The spacings between myosin II puncta are measured at steady state
using ImageJ software (http://rsb.info.nih.gov/ij/). The myosin intensity
profile along a 10-pixel (~1-mm)-wide line drawn over the bundle is
measured, and the separation between adjacent puncta, dmyo, is defined as
the distance between adjacent fluorescence-intensity peaks. Total bundle
length, L, is determined by the length of a straight line drawn along the
entire bundle, between bead attachment points or branch points with other
bundles.
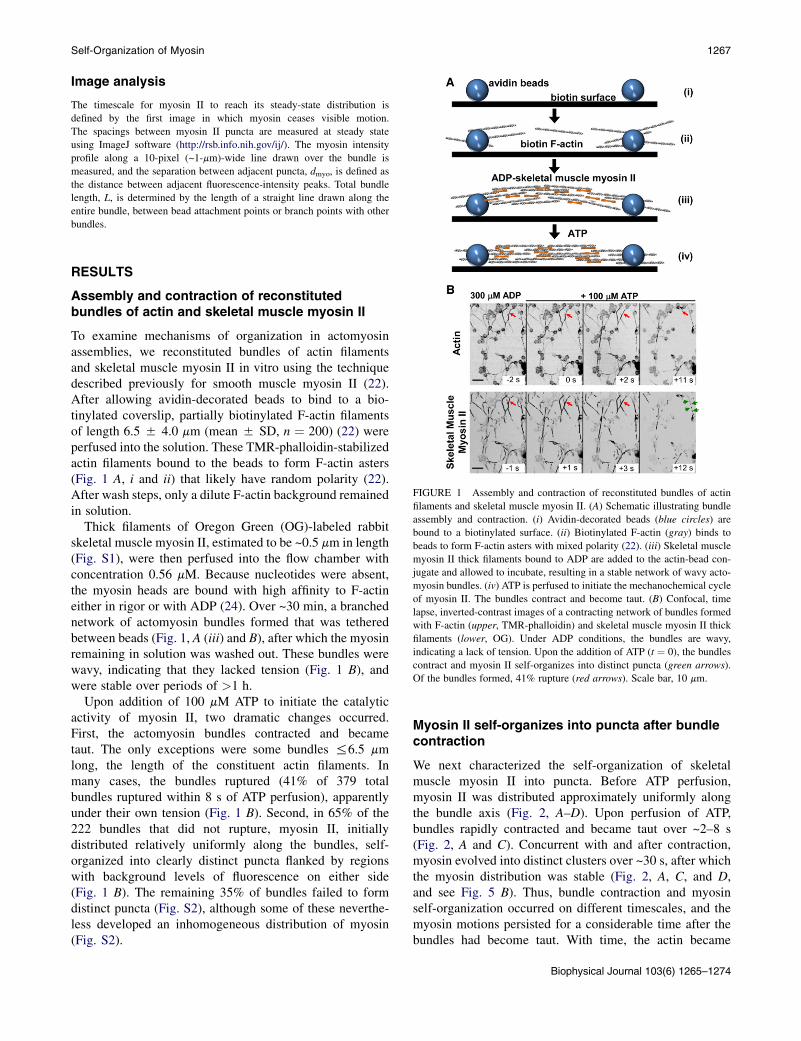
FIGURE 1 Assembly and contraction of reconstituted bundles of actin
filaments and skeletal muscle myosin II. (A) Schematic illustrating bundle
assembly and contraction. (i) Avidin-decorated beads (blue circles) are
bound to a biotinylated surface. (ii) Biotinylated F-actin (gray) binds to
beads to form F-actin asters with mixed polarity (22). (iii) Skeletal muscle
myosin II thick filaments bound to ADP are added to the actin-bead con-
jugate and allowed to incubate, resulting in a stable network of wavy acto-
myosin bundles. (iv) ATP is perfused to initiate the mechanochemical cycle
of myosin II. The bundles contract and become taut. (B) Confocal, time
lapse, inverted-contrast images of a contracting network of bundles formed
with F-actin (upper, TMR-phalloidin) and skeletal muscle myosin II thick
filaments (lower, OG). Under ADP conditions, the bundles are wavy,
indicating a lack of tension. Upon the addition of ATP (t ¼ 0), the bundles
contract and myosin II self-organizes into distinct puncta (green arrows).
Of the bundles formed, 41% rupture (red arrows). Scale bar, 10 mm.
RESULTS
Assembly and contraction of reconstitutedbundles of actin and skeletal muscle myosin II
To examine mechanisms of organization in actomyosinassemblies, we reconstituted bundles of actin filamentsand skeletal muscle myosin II in vitro using the techniquedescribed previously for smooth muscle myosin II (22).After allowing avidin-decorated beads to bind to a bio-tinylated coverslip, partially biotinylated F-actin filamentsof length 6.5 5 4.0 mm (mean 5 SD, n ¼ 200) (22) wereperfused into the solution. These TMR-phalloidin-stabilizedactin filaments bound to the beads to form F-actin asters(Fig. 1 A, i and ii) that likely have random polarity (22).After wash steps, only a dilute F-actin background remainedin solution.
Thick filaments of Oregon Green (OG)-labeled rabbitskeletal muscle myosin II, estimated to be ~0.5 mm in length(Fig. S1), were then perfused into the flow chamber withconcentration 0.56 mM. Because nucleotides were absent,the myosin heads are bound with high affinity to F-actineither in rigor or with ADP (24). Over ~30 min, a branchednetwork of actomyosin bundles formed that was tetheredbetween beads (Fig. 1, A (iii) and B), after which the myosinremaining in solution was washed out. These bundles werewavy, indicating that they lacked tension (Fig. 1 B), andwere stable over periods of >1 h.
Upon addition of 100 mM ATP to initiate the catalyticactivity of myosin II, two dramatic changes occurred.First, the actomyosin bundles contracted and becametaut. The only exceptions were some bundles %6.5 mmlong, the length of the constituent actin filaments. Inmany cases, the bundles ruptured (41% of 379 totalbundles ruptured within 8 s of ATP perfusion), apparentlyunder their own tension (Fig. 1 B). Second, in 65% of the222 bundles that did not rupture, myosin II, initiallydistributed relatively uniformly along the bundles, self-organized into clearly distinct puncta flanked by regionswith background levels of fluorescence on either side(Fig. 1 B). The remaining 35% of bundles failed to formdistinct puncta (Fig. S2), although some of these neverthe-less developed an inhomogeneous distribution of myosin(Fig. S2).
Myosin II self-organizes into puncta after bundlecontraction
We next characterized the self-organization of skeletalmuscle myosin II into puncta. Before ATP perfusion,myosin II was distributed approximately uniformly alongthe bundle axis (Fig. 2, A–D). Upon perfusion of ATP,bundles rapidly contracted and became taut over ~2–8 s(Fig. 2, A and C). Concurrent with and after contraction,myosin evolved into distinct clusters over ~30 s, after whichthe myosin distribution was stable (Fig. 2, A, C, and D,and see Fig. 5 B). Thus, bundle contraction and myosinself-organization occurred on different timescales, and themyosin motions persisted for a considerable time after thebundles had become taut. With time, the actin became
Biophysical Journal 103(6) 1265–1274
D
1 23 4myod
t = 0
Skeletal Muscle Myosin-II
A5 μm
2 s
** *
1 2
E
Actin
Skeletal Muscle Myosin II
B
F
2 s
t = 2 st = 8 st = 14 s
C
1234
Skeletal Muscle Myosin II
t = 05 μm
2 s
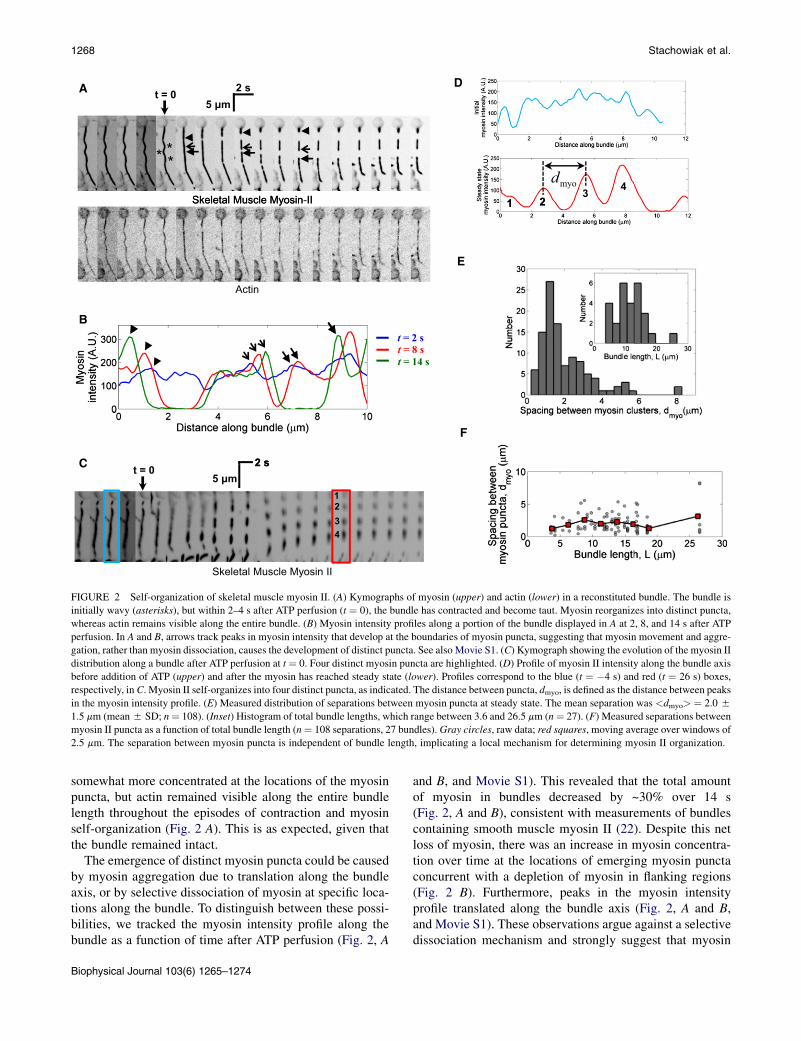
FIGURE 2 Self-organization of skeletal muscle myosin II. (A) Kymographs of myosin (upper) and actin (lower) in a reconstituted bundle. The bundle is
initially wavy (asterisks), but within 2–4 s after ATP perfusion (t ¼ 0), the bundle has contracted and become taut. Myosin reorganizes into distinct puncta,
whereas actin remains visible along the entire bundle. (B) Myosin intensity profiles along a portion of the bundle displayed in A at 2, 8, and 14 s after ATP
perfusion. In A and B, arrows track peaks in myosin intensity that develop at the boundaries of myosin puncta, suggesting that myosin movement and aggre-
gation, rather than myosin dissociation, causes the development of distinct puncta. See also Movie S1. (C) Kymograph showing the evolution of the myosin II
distribution along a bundle after ATP perfusion at t ¼ 0. Four distinct myosin puncta are highlighted. (D) Profile of myosin II intensity along the bundle axis
before addition of ATP (upper) and after the myosin has reached steady state (lower). Profiles correspond to the blue (t ¼ �4 s) and red (t ¼ 26 s) boxes,
respectively, in C. Myosin II self-organizes into four distinct puncta, as indicated. The distance between puncta, dmyo, is defined as the distance between peaks
in the myosin intensity profile. (E) Measured distribution of separations between myosin puncta at steady state. The mean separation was <dmyo> ¼ 2.0 5
1.5 mm (mean5 SD; n¼ 108). (Inset) Histogram of total bundle lengths, which range between 3.6 and 26.5 mm (n¼ 27). (F) Measured separations between
myosin II puncta as a function of total bundle length (n¼ 108 separations, 27 bundles). Gray circles, raw data; red squares, moving average over windows of
2.5 mm. The separation between myosin puncta is independent of bundle length, implicating a local mechanism for determining myosin II organization.
1268 Stachowiak et al.
somewhat more concentrated at the locations of the myosinpuncta, but actin remained visible along the entire bundlelength throughout the episodes of contraction and myosinself-organization (Fig. 2 A). This is as expected, given thatthe bundle remained intact.
The emergence of distinct myosin puncta could be causedby myosin aggregation due to translation along the bundleaxis, or by selective dissociation of myosin at specific loca-tions along the bundle. To distinguish between these possi-bilities, we tracked the myosin intensity profile along thebundle as a function of time after ATP perfusion (Fig. 2, A
Biophysical Journal 103(6) 1265–1274
and B, and Movie S1). This revealed that the total amountof myosin in bundles decreased by ~30% over 14 s(Fig. 2, A and B), consistent with measurements of bundlescontaining smooth muscle myosin II (22). Despite this netloss of myosin, there was an increase in myosin concentra-tion over time at the locations of emerging myosin punctaconcurrent with a depletion of myosin in flanking regions(Fig. 2 B). Furthermore, peaks in the myosin intensityprofile translated along the bundle axis (Fig. 2, A and B,and Movie S1). These observations argue against a selectivedissociation mechanism and strongly suggest that myosin
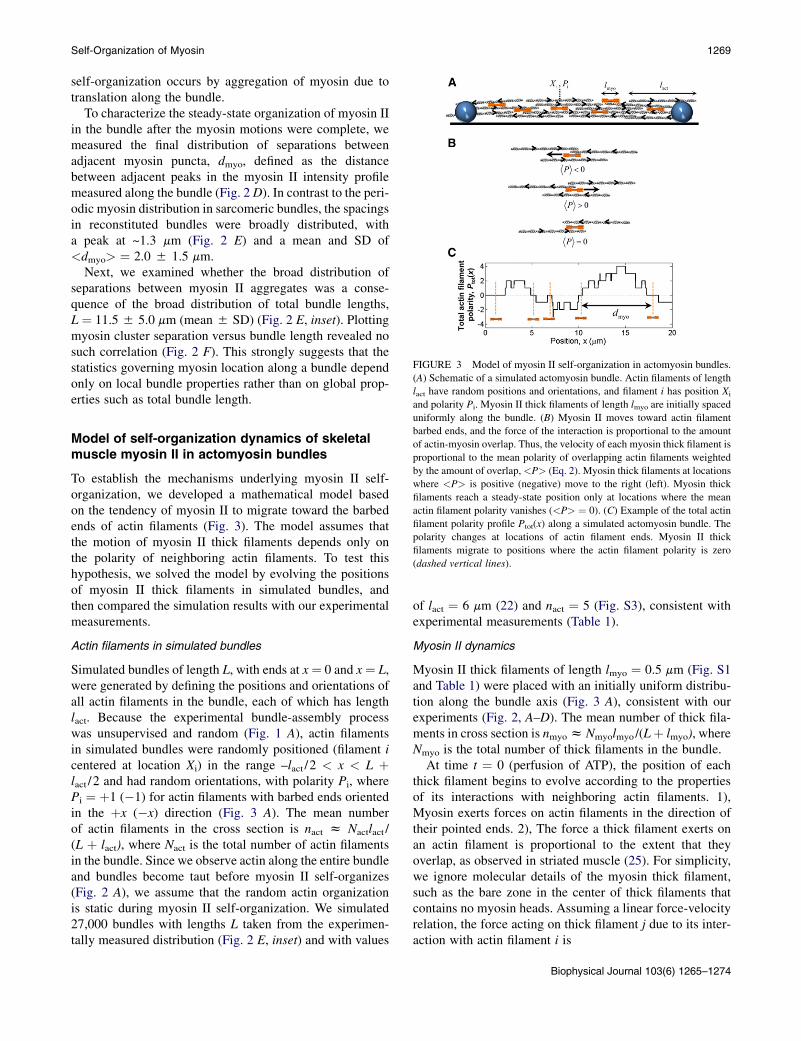
FIGURE 3 Model of myosin II self-organization in actomyosin bundles.
(A) Schematic of a simulated actomyosin bundle. Actin filaments of length
lact have random positions and orientations, and filament i has position Xi
and polarity Pi. Myosin II thick filaments of length lmyo are initially spaced
Self-Organization of Myosin 1269
self-organization occurs by aggregation of myosin due totranslation along the bundle.
To characterize the steady-state organization of myosin IIin the bundle after the myosin motions were complete, wemeasured the final distribution of separations betweenadjacent myosin puncta, dmyo, defined as the distancebetween adjacent peaks in the myosin II intensity profilemeasured along the bundle (Fig. 2D). In contrast to the peri-odic myosin distribution in sarcomeric bundles, the spacingsin reconstituted bundles were broadly distributed, witha peak at ~1.3 mm (Fig. 2 E) and a mean and SD of<dmyo> ¼ 2.0 5 1.5 mm.
Next, we examined whether the broad distribution ofseparations between myosin II aggregates was a conse-quence of the broad distribution of total bundle lengths,L ¼ 11.55 5.0 mm (mean 5 SD) (Fig. 2 E, inset). Plottingmyosin cluster separation versus bundle length revealed nosuch correlation (Fig. 2 F). This strongly suggests that thestatistics governing myosin location along a bundle dependonly on local bundle properties rather than on global prop-erties such as total bundle length.
uniformly along the bundle. (B) Myosin II moves toward actin filament
barbed ends, and the force of the interaction is proportional to the amount
of actin-myosin overlap. Thus, the velocity of each myosin thick filament is
proportional to the mean polarity of overlapping actin filaments weighted
by the amount of overlap,<P> (Eq. 2). Myosin thick filaments at locations
where <P> is positive (negative) move to the right (left). Myosin thick
filaments reach a steady-state position only at locations where the mean
actin filament polarity vanishes (<P> ¼ 0). (C) Example of the total actin
filament polarity profile Ptot(x) along a simulated actomyosin bundle. The
polarity changes at locations of actin filament ends. Myosin II thick
filaments migrate to positions where the actin filament polarity is zero
(dashed vertical lines).
Model of self-organization dynamics of skeletalmuscle myosin II in actomyosin bundles
To establish the mechanisms underlying myosin II self-organization, we developed a mathematical model basedon the tendency of myosin II to migrate toward the barbedends of actin filaments (Fig. 3). The model assumes thatthe motion of myosin II thick filaments depends only onthe polarity of neighboring actin filaments. To test thishypothesis, we solved the model by evolving the positionsof myosin II thick filaments in simulated bundles, andthen compared the simulation results with our experimentalmeasurements.
Actin filaments in simulated bundles
Simulated bundles of length L, with ends at x¼ 0 and x¼ L,were generated by defining the positions and orientations ofall actin filaments in the bundle, each of which has lengthlact. Because the experimental bundle-assembly processwas unsupervised and random (Fig. 1 A), actin filamentsin simulated bundles were randomly positioned (filament icentered at location Xi) in the range –lact /2 < x < L þlact /2 and had random orientations, with polarity Pi, wherePi ¼ þ1 (�1) for actin filaments with barbed ends orientedin the þx (�x) direction (Fig. 3 A). The mean numberof actin filaments in the cross section is nact z Nactlact /(L þ lact), where Nact is the total number of actin filamentsin the bundle. Since we observe actin along the entire bundleand bundles become taut before myosin II self-organizes(Fig. 2 A), we assume that the random actin organizationis static during myosin II self-organization. We simulated27,000 bundles with lengths L taken from the experimen-tally measured distribution (Fig. 2 E, inset) and with values
of lact ¼ 6 mm (22) and nact ¼ 5 (Fig. S3), consistent withexperimental measurements (Table 1).
Myosin II dynamics
Myosin II thick filaments of length lmyo ¼ 0.5 mm (Fig. S1and Table 1) were placed with an initially uniform distribu-tion along the bundle axis (Fig. 3 A), consistent with ourexperiments (Fig. 2, A–D). The mean number of thick fila-ments in cross section is nmyoz Nmyolmyo/(Lþ lmyo), whereNmyo is the total number of thick filaments in the bundle.
At time t ¼ 0 (perfusion of ATP), the position of eachthick filament begins to evolve according to the propertiesof its interactions with neighboring actin filaments. 1),Myosin exerts forces on actin filaments in the direction oftheir pointed ends. 2), The force a thick filament exerts onan actin filament is proportional to the extent that theyoverlap, as observed in striated muscle (25). For simplicity,we ignore molecular details of the myosin thick filament,such as the bare zone in the center of thick filaments thatcontains no myosin heads. Assuming a linear force-velocityrelation, the force acting on thick filament j due to its inter-action with actin filament i is
Biophysical Journal 103(6) 1265–1274
TABLE 1 Model parameter values
Symbol Meaning Value
lact* Length of the actin filaments 6 mm
lmyoy Length of reconstituted skeletal muscle
myosin II thick filaments
0.5 mm
nactz Mean number of actin filaments in cross section
(bundle thickness)
5
nmyox Mean number of myosin II thick filaments in
cross section
2
L{ Bundle length 3.6–26.5 mm
Fitting parameter
v0myok Unloaded velocity of skeletal muscle myosin II 1.1 mm/s
*Consistent with previous measurements by Thoresen et al. (22).yEstimated from fluorescence images of myosin puncta. The lower bound of
myosin puncta width sets the upper bound of thick filament length (Fig. S1).zQuantitative fluorescence imaging shows that bundles have ~1–6 actin fila-
ments in cross section (Fig. S3).xChosen to be >1 to be consistent with initial myosin staining along the
entire bundle (Fig. 2, A and C). Results are insensitive to the value of
nmyo for nmyo>1.{Measured in Fig. 2 E, inset. Simulations and numerical calculations were
performed on simulated bundles having the measured distribution of bundle
lengths.kUsed as fitting parameter so that the simulation matches the observed time-
scale for the myosin II distribution to reach steady state (Fig. 5 B).
1270 Stachowiak et al.
f ijmyo ¼ wij fs
Pi �
vjmyo
v0myo
!; (1)
where wij is the length of myosin-actin overlap, fs is themyosin stall force at full overlap, vjmyo is the velocity of thickfilament j, and v0myo is the unloaded sliding velocity ofskeletal muscle myosin II. As the actin bundles are thin(nact z 1–6; Table 1), we assume that a thick filament inter-acts equally with all actin filaments with which it overlapsand that it exerts a total force proportional to the numberof overlapping filaments. The sum of forces acting on a giventhick filament, due to interactions with all neighboring actinfilaments, must vanish,
Pi f
ijmyo ¼ 0. Applying this condi-
tion to Eq. 1 gives the following result for the myosin thickfilament velocity:
vjmyo ¼ v0myo
Pi
wijPiPi
wij
¼ v0myohPi: (2)
Here, <P> denotes the mean actin polarity experienced by
a myosin thick filament weighted by the amount of overlapwith each actin filament. Thus, the dynamics of each myosinII thick filament are determined only by its unloaded velocityand the polarities of neighboring actin filaments (Fig. 3 B).During the simulation, for each time step of duration Dt,the position of each myosin thick filament was updatedaccording to Eq. 2. We used Dt ¼ 0.067 s, so that duringone time step a myosin moves a maximum of v0myo Dt ¼75 nm (Table 1), much less than the relevant simulation
Biophysical Journal 103(6) 1265–1274
length scales L, lact, and the mean separation between actinfilament ends, lstep (see below). The myosin II profile alongthe bundle was determined by calculating the number ofthick filaments at each bundle location. To mimic imagingof the bundles in fluorescence microscopy (Fig. 2, Aand C), the 1D myosin density profile was then convolvedwith a Gaussian of SD 0.15 mm to represent the point spreadfunction.
The model predicts that myosin II migratesto zeros of actin polarity, and the steady-statedistribution of myosin II puncta separationsis a power law
The dynamical simulations described above follow the timeevolution of myosin II thick filament locations and capturethe entire self-organization process. However, the finalmyosin II distribution generated by the self-organizingdynamics can be directly computed by noting that in steadystate, myosin will be located at bundle positions where themean polarity vanishes, <P> ¼ 0, since at these locationsthe myosin velocity vanishes (see Eq. 2). Because myosinthick filaments are much shorter than the actin filaments(lmyo << lact), the mean actin polarity, <P>, experiencedby a myosin thick filament centered at some location x alongthe bundle is approximated by the mean polarity of all actinfilaments that intersect the bundle cross section at x, whichwe name p(x). Thus, p(x) ¼ Ptot(x)/Ntot(x), where Ptot(x) isthe sum of the polarities of all actin filaments that cross xand Ntot(x) is the number of such filaments. Then, to deter-mine the statistics of separation between adjacent myosinpuncta in steady state, we calculated the statistics of theseparations of adjacent zeros of Ptot(x) (Fig. 3 C).
For a range of myosin cluster separations, this leads toa power law distribution with an exponent of �3/2, asfollows. The total bundle polarity Ptot(x) changes only atthe locations of actin filament ends. Now a bundle of nactfilaments in parallel contains on average 2nact ends perlength lact, and the average spacing between actin filamentends is therefore lstep ¼ lact/2nact along the bundle axis,with lstep ¼ 0.6 mm from Table 1. Thus, after each distancelstep along the bundle, a new filament end is encountered andthe total polarity changes by 51, depending on the polarityof the actin filament and whether the end is barbed orpointed. Because the actin filament orientation is random,the polarity changes are random and the total polarity Ptot(x)follows a random walk as a function of x. Here, x is a time-like variable, and the polarity changes randomly aftera ‘‘time step’’ of duration lstep. This random walk behavioronly occurs over distances x < lact, because the polaritychanges caused by the two ends of a single filament arecorrelated. Thus, for length scales larger than the step sizex >> lstep, the polarity variation along the bundle axis ismathematically analogous to the positional variation ofa diffusing particle with diffusion constant 1/lstep. Hence,
Self-Organization of Myosin 1271
the probability distribution of the polarity at x, given thepolarity at x ¼ 0, is approximately Gaussian (26):
GðPtot; xjPtotð0ÞÞ ¼ 1ffiffiffiffiffiffiffiffiffiffiffiffiffiffiffiffiffi4px=lstep
p e�½Ptot�Ptotð0Þ�2=ð4x=lstepÞ;
ðlstep<x<lact�
(3)
The distribution of separations between adjacent zeros ofPtot(x), fzero(x), is the distribution of distances from onepolarity zero, Ptot(0) ¼ 0, to the next zero, Ptot(x) ¼ 0. Toobtain fzero(x), we first calculate the probability density,F(Ptot, x), that the polarity is Ptot after ‘‘time’’ x, giventhat it initially vanished, and given that the polarity wasnever zero during this period. This conditional probabilityis again the solution to a diffusion problem, but now withan absorbing boundary condition, F(0, x) ¼ 0. The solutionis related to the Gaussian of Eq. 3 but is now the sum of oneGaussian with Ptot(0) ¼ 0þ, and a second, negative mirror-image Gaussian with Ptot(0) ¼ 0� to enforce the boundarycondition at Ptot(0) ¼ 0 (26). This amounts to taking thederivative of the Gaussian with respect to Ptot, evaluatedat Ptot(0) ¼ 0. Integrating this result for F(Ptot, x) over allvalues of Ptot gives the total ‘‘survival probability’’ that nopolarity zero is encountered after distance x. Taking minusthe derivative of the survival probability with respect to xthen yields the desired result, the probability density thata second polarity zero is encountered after a distance x:
fzeroðxÞ ¼ C
lstep
�x
lstep
��3=2�lstep<x<lact
�; (4)
where the constant C fixes the normalization. This is thedistribution of separations between zeros in the actinpolarity. In addition to being valid only when x is muchlarger than the ‘‘time step’’ lstep, so that the continuous‘‘diffusion’’ limit is valid, it is only valid provided x ismuch less than the filament length, lact. This is because onscales of x > lact, the free Gaussian statistics of Eq. 3 areno longer valid, as the changes in polarity that occur atthe two ends of a given actin filament are correlated.Note that elsewhere we replace x with the notation dmyo torepresent separations between myosin puncta.
Thus, for separations less than the filament length, theprobability distribution of myosin separations follows apower law with exponent �3/2. This exponent is indepen-dent of model parameter values, and is the signature ofthe essential mechanism proposed by our model, namely,that myosin is driven to zeros of the total bundle polarity.Comparison of the predicted exponent to experiment thusconstitutes a stringent test of the model. To determine thecomplete distribution for all separations, including thosebeyond lact, and to account for finite bundle-size effectsand corrections due to the distribution in filament-endseparations (assumed above to be fixed and equal to lstep),
we simply measured the zeros in the actin distribution ofour simulated bundles (Fig. 3 C).
Model reproduces experimentally observedsteady-state myosin II distributions
To compute model-predicted probability distributions ofseparations between adjacent myosin II puncta, we evolvedour bundle simulation to steady state according to Eq. 2 andthen calculated the separations between peaks in the myosinintensity profile (Fig. 4 A), analogous to the procedure weused for our experimental measurements (Fig. 2 D). Usingthe parameter values in Table 1, model predictions were inremarkable agreement with the experimental observations,capturing the shape of the probability distribution with nofitting parameters (Fig. 4 B, red line).In particular, the experimental data were in close agree-
ment with the model’s predicted inverse 3/2 power-lawdecay for myosin separations greater than the small cutoffscale lstep (0.6 mm, using Table 1) but smaller than the fila-ment length lact (6mm, Table 1). To test this, we fitted a powerlaw to the experimental data for separations dmyo in the rangealstep < dmyo < lact/a, choosing the constant a ¼ 1.5 to begreater than unity, as the power law is an asymptotic pre-diction valid, in principle, only for scales well inside thewindow bounded by lstep and lact (Fig. 4 C, thick blue line).Within this window of 0.9 mm < dmyo < 4 mm, we founda best-fit exponent of �1.51 5 0.14 (5 SE) (Fig. 4 C).
We then confirmed that in our simulated bundles, thesteady-state myosin locations did indeed coincide withthe zeros in total actin filament polarity (locations wherePtot ¼ 0). We found that the distribution of separationsbetween zeros in Ptot from our simulations (Fig. 4 B, dashedgreen line) closely tracked the distribution of myosinseparations in the simulation (Fig. 4 B, solid red line) as ex-pected. The small differences between these two distribu-tions arise because 1), the simulation includes finite-sizemyosin II thick filaments, and 2), to mimic optical effects,the simulations include a point-spread function that smearsthe myosin distribution and obscures the smallest separa-tions between myosin clusters.
The organization of myosin II depends on bundlethickness and actin filament length
Next we used our model to predict how the spatial distribu-tion of myosin II clusters would vary as the properties of theactomyosin bundles are varied. We calculated the meandistance between adjacent myosin II puncta, given by loca-tions where the net actin polarity vanishes in simulatedbundles, as a function of both the mean number of actinfilaments in cross section, nact, and the actin filament length,lact (Fig. 4 D). From the distribution of myosin punctaseparations that we calculated exactly, Eq. 4, the mean sepa-ration is
Biophysical Journal 103(6) 1265–1274
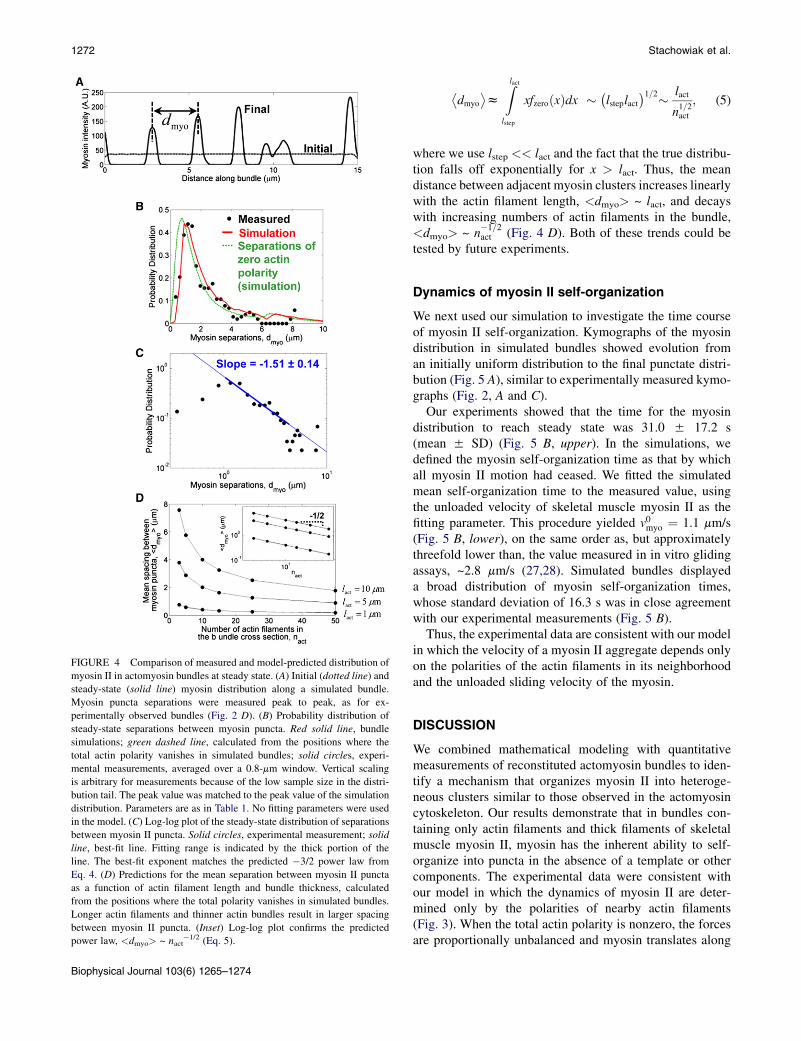
FIGURE 4 Comparison of measured and model-predicted distribution of
myosin II in actomyosin bundles at steady state. (A) Initial (dotted line) and
steady-state (solid line) myosin distribution along a simulated bundle.
Myosin puncta separations were measured peak to peak, as for ex-
perimentally observed bundles (Fig. 2 D). (B) Probability distribution of
steady-state separations between myosin puncta. Red solid line, bundle
simulations; green dashed line, calculated from the positions where the
total actin polarity vanishes in simulated bundles; solid circles, experi-
mental measurements, averaged over a 0.8-mm window. Vertical scaling
is arbitrary for measurements because of the low sample size in the distri-
bution tail. The peak value was matched to the peak value of the simulation
distribution. Parameters are as in Table 1. No fitting parameters were used
in the model. (C) Log-log plot of the steady-state distribution of separations
between myosin II puncta. Solid circles, experimental measurement; solid
line, best-fit line. Fitting range is indicated by the thick portion of the
line. The best-fit exponent matches the predicted �3/2 power law from
Eq. 4. (D) Predictions for the mean separation between myosin II puncta
as a function of actin filament length and bundle thickness, calculated
from the positions where the total polarity vanishes in simulated bundles.
Longer actin filaments and thinner actin bundles result in larger spacing
between myosin II puncta. (Inset) Log-log plot confirms the predicted
power law, <dmyo> ~ nact�1/2 (Eq. 5).
Biophysical Journal 103(6) 1265–1274
1272 Stachowiak et al.
�dmyo
�z
Zlactlstep
xfzeroðxÞdx � �lsteplact�1=2� lact
n1=2act
; (5)
where we use lstep << lact and the fact that the true distribu-tion falls off exponentially for x > lact. Thus, the meandistance between adjacent myosin clusters increases linearlywith the actin filament length, <dmyo> ~ lact, and decayswith increasing numbers of actin filaments in the bundle,<dmyo> ~ n
�1=2act (Fig. 4 D). Both of these trends could be
tested by future experiments.
Dynamics of myosin II self-organization
We next used our simulation to investigate the time courseof myosin II self-organization. Kymographs of the myosindistribution in simulated bundles showed evolution froman initially uniform distribution to the final punctate distri-bution (Fig. 5 A), similar to experimentally measured kymo-graphs (Fig. 2, A and C).
Our experiments showed that the time for the myosindistribution to reach steady state was 31.0 5 17.2 s(mean 5 SD) (Fig. 5 B, upper). In the simulations, wedefined the myosin self-organization time as that by whichall myosin II motion had ceased. We fitted the simulatedmean self-organization time to the measured value, usingthe unloaded velocity of skeletal muscle myosin II as thefitting parameter. This procedure yielded v0myo ¼ 1.1 mm/s(Fig. 5 B, lower), on the same order as, but approximatelythreefold lower than, the value measured in in vitro glidingassays, ~2.8 mm/s (27,28). Simulated bundles displayeda broad distribution of myosin self-organization times,whose standard deviation of 16.3 s was in close agreementwith our experimental measurements (Fig. 5 B).
Thus, the experimental data are consistent with our modelin which the velocity of a myosin II aggregate depends onlyon the polarities of the actin filaments in its neighborhoodand the unloaded sliding velocity of the myosin.
DISCUSSION
We combined mathematical modeling with quantitativemeasurements of reconstituted actomyosin bundles to iden-tify a mechanism that organizes myosin II into heteroge-neous clusters similar to those observed in the actomyosincytoskeleton. Our results demonstrate that in bundles con-taining only actin filaments and thick filaments of skeletalmuscle myosin II, myosin has the inherent ability to self-organize into puncta in the absence of a template or othercomponents. The experimental data were consistent withour model in which the dynamics of myosin II are deter-mined only by the polarities of nearby actin filaments(Fig. 3). When the total actin polarity is nonzero, the forcesare proportionally unbalanced and myosin translates along
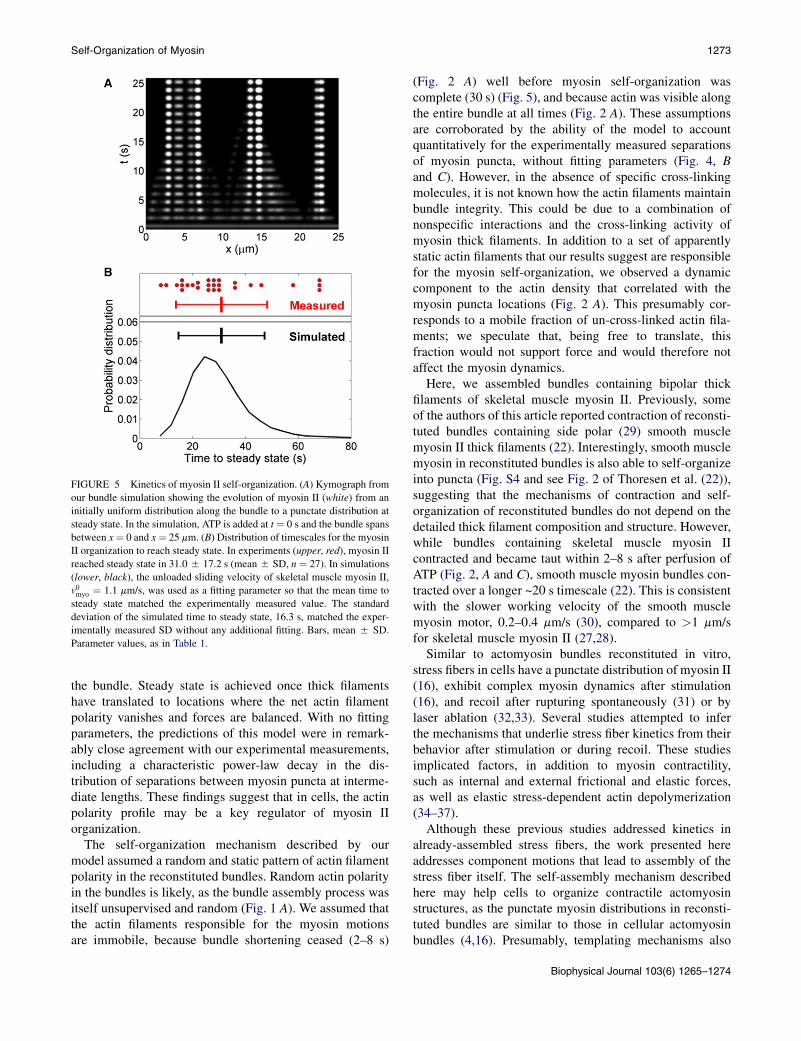
FIGURE 5 Kinetics of myosin II self-organization. (A) Kymograph from
our bundle simulation showing the evolution of myosin II (white) from an
initially uniform distribution along the bundle to a punctate distribution at
steady state. In the simulation, ATP is added at t ¼ 0 s and the bundle spans
between x¼ 0 and x¼ 25 mm. (B) Distribution of timescales for the myosin
II organization to reach steady state. In experiments (upper, red), myosin II
reached steady state in 31.05 17.2 s (mean5 SD, n ¼ 27). In simulations
(lower, black), the unloaded sliding velocity of skeletal muscle myosin II,
v0myo ¼ 1.1 mm/s, was used as a fitting parameter so that the mean time to
steady state matched the experimentally measured value. The standard
deviation of the simulated time to steady state, 16.3 s, matched the exper-
imentally measured SD without any additional fitting. Bars, mean 5 SD.
Parameter values, as in Table 1.
Self-Organization of Myosin 1273
the bundle. Steady state is achieved once thick filamentshave translated to locations where the net actin filamentpolarity vanishes and forces are balanced. With no fittingparameters, the predictions of this model were in remark-ably close agreement with our experimental measurements,including a characteristic power-law decay in the dis-tribution of separations between myosin puncta at interme-diate lengths. These findings suggest that in cells, the actinpolarity profile may be a key regulator of myosin IIorganization.
The self-organization mechanism described by ourmodel assumed a random and static pattern of actin filamentpolarity in the reconstituted bundles. Random actin polarityin the bundles is likely, as the bundle assembly process wasitself unsupervised and random (Fig. 1 A). We assumed thatthe actin filaments responsible for the myosin motionsare immobile, because bundle shortening ceased (2–8 s)
(Fig. 2 A) well before myosin self-organization wascomplete (30 s) (Fig. 5), and because actin was visible alongthe entire bundle at all times (Fig. 2 A). These assumptionsare corroborated by the ability of the model to accountquantitatively for the experimentally measured separationsof myosin puncta, without fitting parameters (Fig. 4, Band C). However, in the absence of specific cross-linkingmolecules, it is not known how the actin filaments maintainbundle integrity. This could be due to a combination ofnonspecific interactions and the cross-linking activity ofmyosin thick filaments. In addition to a set of apparentlystatic actin filaments that our results suggest are responsiblefor the myosin self-organization, we observed a dynamiccomponent to the actin density that correlated with themyosin puncta locations (Fig. 2 A). This presumably cor-responds to a mobile fraction of un-cross-linked actin fila-ments; we speculate that, being free to translate, thisfraction would not support force and would therefore notaffect the myosin dynamics.
Here, we assembled bundles containing bipolar thickfilaments of skeletal muscle myosin II. Previously, someof the authors of this article reported contraction of reconsti-tuted bundles containing side polar (29) smooth musclemyosin II thick filaments (22). Interestingly, smooth musclemyosin in reconstituted bundles is also able to self-organizeinto puncta (Fig. S4 and see Fig. 2 of Thoresen et al. (22)),suggesting that the mechanisms of contraction and self-organization of reconstituted bundles do not depend on thedetailed thick filament composition and structure. However,while bundles containing skeletal muscle myosin IIcontracted and became taut within 2–8 s after perfusion ofATP (Fig. 2, A and C), smooth muscle myosin bundles con-tracted over a longer ~20 s timescale (22). This is consistentwith the slower working velocity of the smooth musclemyosin motor, 0.2–0.4 mm/s (30), compared to >1 mm/sfor skeletal muscle myosin II (27,28).
Similar to actomyosin bundles reconstituted in vitro,stress fibers in cells have a punctate distribution of myosin II(16), exhibit complex myosin dynamics after stimulation(16), and recoil after rupturing spontaneously (31) or bylaser ablation (32,33). Several studies attempted to inferthe mechanisms that underlie stress fiber kinetics from theirbehavior after stimulation or during recoil. These studiesimplicated factors, in addition to myosin contractility,such as internal and external frictional and elastic forces,as well as elastic stress-dependent actin depolymerization(34–37).
Although these previous studies addressed kinetics inalready-assembled stress fibers, the work presented hereaddresses component motions that lead to assembly of thestress fiber itself. The self-assembly mechanism describedhere may help cells to organize contractile actomyosinstructures, as the punctate myosin distributions in reconsti-tuted bundles are similar to those in cellular actomyosinbundles (4,16). Presumably, templating mechanisms also
Biophysical Journal 103(6) 1265–1274
1274 Stachowiak et al.
contribute to organization in cells, as sarcomeric contractilestructures contain scaffolding molecules such as titin (21).The myosin distribution that we observed was more randomthan the tightly periodic distribution in striated muscle, witha broad distribution of spacings between myosin regions(Fig. 2 E) that is reminiscent of more disordered bundledarchitectures in the cell, such as the cytokinetic ring andrandomly organized stress fibers (15,17).
SUPPORTING MATERIAL
Four figures and one movie are available at http://www.biophysj.org/
biophysj/supplemental/S0006-3495(12)00921-6.
We thank David Kovar for supplying G-actin, and Michael Murrell for
supplying Oregon Green-labeled myosin.
This work was supported by National Institutes of Health grants GM086731
(B.O.) and DP10D00354 (M.L.G.).
REFERENCES
1. Fletcher, D. A., and R. D. Mullins. 2010. Cell mechanics and thecytoskeleton. Nature. 463:485–492.
2. Chhabra, E. S., and H. N. Higgs. 2007. The many faces of actin:matching assembly factors with cellular structures. Nat. Cell Biol.9:1110–1121.
3. Gardel, M. L., I. C. Schneider,., C. M. Waterman. 2010. Mechanicalintegration of actin and adhesion dynamics in cell migration. Annu.Rev. Cell Dev. Biol. 26:315–333.
4. Hotulainen, P., and P. Lappalainen. 2006. Stress fibers are generated bytwo distinct actin assembly mechanisms in motile cells. J. Cell Biol.173:383–394.
5. Vicente-Manzanares, M., X. F. Ma, ., A. R. Horwitz. 2009.Non-muscle myosin II takes centre stage in cell adhesion and migra-tion. Nat. Rev. Mol. Cell Biol. 10:778–790.
6. Huxley, A. F. 1974. Muscular contraction. J. Physiol. 243:1–43.
7. Pollard, T. D. 2010. Mechanics of cytokinesis in eukaryotes. Curr.Opin. Cell Biol. 22:50–56.
8. Vavylonis, D., J. Q. Wu,., T. D. Pollard. 2008. Assembly mechanismof the contractile ring for cytokinesis by fission yeast. Science.319:97–100.
9. Giannone, G., B. J. Dubin-Thaler, ., M. P. Sheetz. 2007. Lamellipo-dial actin mechanically links myosin activity with adhesion-site forma-tion. Cell. 128:561–575.
10. Vicente-Manzanares, M., J. Zareno, ., A. F. Horwitz. 2007. Regula-tion of protrusion, adhesion dynamics, and polarity by myosins IIAand IIB in migrating cells. J. Cell Biol. 176:573–580.
11. Martin, A. C., M. Kaschube, and E. F. Wieschaus. 2009. Pulsedcontractions of an actin-myosin network drive apical constriction.Nature. 457:495–499.
12. Lecuit, T., P.-F. Lenne, and E. Munro. 2011. Force generation, trans-mission, and integration during cell and tissue morphogenesis. Annu.Rev. Cell Dev. Biol. 27:157–184.
13. Verkhovsky, A. B., and G. G. Borisy. 1993. Non-sarcomeric mode ofmyosin II organization in the fibroblast lamellum. J. Cell Biol.123:637–652.
14. Svitkina, T. M., I. G. Surguchova, ., J. De Mey. 1989. Direct visual-ization of bipolar myosin filaments in stress fibers of culturedfibroblasts. Cell Motil. Cytoskeleton. 12:150–156.
Biophysical Journal 103(6) 1265–1274
15. Cramer, L. P., M. Siebert, and T. J. Mitchison. 1997. Identification ofnovel graded polarity actin filament bundles in locomoting heartfibroblasts: implications for the generation of motile force. J. CellBiol. 136:1287–1305.
16. Peterson, L. J., Z. Rajfur, ., K. Burridge. 2004. Simultaneousstretching and contraction of stress fibers in vivo. Mol. Biol. Cell.15:3497–3508.
17. Bezanilla, M., J. M. Wilson, and T. D. Pollard. 2000. Fission yeastmyosin-II isoforms assemble into contractile rings at distinct timesduring mitosis. Curr. Biol. 10:397–400.
18. Kamasaki, T., M. Osumi, and I. Mabuchi. 2007. Three-dimensionalarrangement of F-actin in the contractile ring of fission yeast. J. CellBiol. 178:765–771.
19. Endlich, N., C. A. Otey, ., K. Endlich. 2007. Movement of stressfibers away from focal adhesions identifies focal adhesions as sites ofstress fiber assembly in stationary cells. Cell Motil. Cytoskeleton.64:966–976.
20. Rossier, O. M., N. Gauthier,., M. P. Sheetz. 2010. Force generated byactomyosin contraction builds bridges between adhesive contacts.EMBO J. 29:1055–1068.
21. Kontrogianni-Konstantopoulos, A., M. A. Ackermann,., R. J. Bloch.2009. Muscle giants: molecular scaffolds in sarcomerogenesis. Physiol.Rev. 89:1217–1267.
22. Thoresen, T., M. Lenz, and M. L. Gardel. 2011. Reconstitution ofcontractile actomyosin bundles. Biophys. J. 100:2698–2705.
23. Sabass, B., M. L. Gardel, ., U. S. Schwarz. 2008. High resolutiontraction force microscopy based on experimental and computationaladvances. Biophys. J. 94:207–220.
24. Howard, J. 2001. Mechanisms of Motor Proteins and the Cytoskeleton.Sinauer Associates, Sunderland, MA.
25. Gordon, A. M., A. F. Huxley, and F. J. Julian. 1966. The variation inisometric tension with sarcomere length in vertebrate muscle fibres.J. Physiol. 184:170–192.
26. Redner, S. 2001. A Guide to First-Passage Processes. CambridgeUniversity Press, Cambridge, UK.
27. Lord, M., and T. D. Pollard. 2004. UCS protein Rng3p activates actinfilament gliding by fission yeast myosin-II. J. Cell Biol. 167:315–325.
28. Cheung, A., J. A. Dantzig, ., A. F. Straight. 2002. A small-moleculeinhibitor of skeletal muscle myosin II. Nat. Cell Biol. 4:83–88.
29. Xu, J. Q., B. A. Harder, ., R. Craig. 1996. Myosin filament structurein vertebrate smooth muscle. J. Cell Biol. 134:53–66.
30. Warshaw, D. M., J. M. Desrosiers, ., K. M. Trybus. 1990. Smoothmuscle myosin cross-bridge interactions modulate actin filamentsliding velocity in vitro. J. Cell Biol. 111:453–463.
31. Smith, M. A., E. Blankman, ., M. C. Beckerle. 2010. A zyxin-mediated mechanism for actin stress fiber maintenance and repair.Dev. Cell. 19:365–376.
32. Kumar, S., I. Z. Maxwell, ., D. E. Ingber. 2006. Viscoelastic retrac-tion of single living stress fibers and its impact on cell shape, cytoskel-etal organization, and extracellular matrix mechanics. Biophys. J.90:3762–3773.
33. Tanner, K., A. Boudreau,., S. Kumar. 2010. Dissecting regional vari-ations in stress fiber mechanics in living cells with laser nanosurgery.Biophys. J. 99:2775–2783.
34. Colombelli, J., A. Besser, ., E. H. Stelzer. 2009. Mechanosensing inactin stress fibers revealed by a close correlation between force andprotein localization. J. Cell Sci. 122:1665–1679.
35. Russell, R. J., S. L. Xia, ., T. P. Lele. 2009. Sarcomere mechanics incapillary endothelial cells. Biophys. J. 97:1578–1585.
36. Stachowiak, M. R., and B. O’Shaughnessy. 2009. Recoil after severingreveals stress fiber contraction mechanisms. Biophys. J. 97:462–471.
37. Stachowiak, M. R., and B. O’Shaughnessy. 2008. Kinetics of stressfibers. New J. Phys. 10:025002.


