Self-Healing Agent for Cementitious Materials Crack Repair
13
materials Article Ureolytic/Non-Ureolytic Bacteria Co-Cultured Self-Healing Agent for Cementitious Materials Crack Repair Hyeong Min Son, Ha Yeon Kim, Sol Moi Park ID and Haeng Ki Lee * Department of Civil and Environmental Engineering, Korea Advanced Institute of Science and Technology, 291 Daehak-ro, Yuseong-gu, Daejeon 34141, Korea; [email protected] (H.M.S.); [email protected] (H.Y.K.); [email protected] (S.M.P.) * Correspondence: [email protected]; Tel.: +82-42-350-3623 Received: 18 March 2018; Accepted: 4 May 2018; Published: 11 May 2018 Abstract: The present study investigated the CaCO 3 precipitation performance of ureolytic and non-ureolytic bacteria co-cultured as a self-healing agent for cementitious materials crack repair. Three different inoculum ratios of ureolytic Sporosarcina pasteurii and non-ureolytic Bacillus thuringiensis (10:0, 8:2, or 5:5) were used. The effect of coculturing ureolytic and non-ureolytic bacteria on microbial metabolism was investigated by measuring the rate of growth in urea-containing medium and the rate of NH 4 + and CaCO 3 production in urea–calcium lactate medium. The self-healing efficiency of co-cultured bacteria was examined by exposing cement mortar specimens with predefined cracks to media containing single urease-producing or co-cultured bacteria. The obtained results provide new findings, where CaCO 3 precipitation is improved by co-culturing ureolytic and non-ureolytic bacteria, owing to the relatively faster growth rate of non-ureolytic bacteria. The crack filling rate correlated with the width of crack, in particular, specimens with a smaller crack width showed the faster filling effect, indicating that the crack width can be a dominant factor influencing the CaCO 3 precipitation capacity of co-cultured bacteria. Keywords: ureolytic bacteria; non-ureolytic bacteria; co-cultured bacteria; CaCO 3 precipitation; self-healing agent 1. Introduction Concrete microcracks are a natural phenomenon and occur owing to many factors, such as changes in external force and drying shrinkage [1,2]. The formation of microcracks weakens the mechanical properties of concrete and makes the transport of moisture and chemicals through the matrix easier, accelerating concrete deterioration [3–7]. The durability performance of reinforced concrete structures is highly dictated by the ability to resist against such material transport. For example, sulfate ions penetrate through microcracks and cause internal pore expansion due to ettringite formation, known as sulfate attack [8,9], and chloride ions oxidize steel to accelerate the corrosion of steel bars embedded in concrete [10–12]. Repair work is mandatory to mitigate this problem and to extend the service life of concrete structures. While this often involves chemical repair materials (i.e., epoxy resins, polyesters, and polyurethane) [13,14], fundamental problems remain owing to difficulties in precisely locating microcracks, use of chemicals for healing microcracks being environmentally harmful, and the repair effect not being continuously maintained [15,16]. Against this backdrop, self-healing concrete has received significant attention over recent years owing to the potential of repair/maintenance-free concrete with the ability to heal microcracks, deemed as the main source of deterioration in concrete structures [17–23]. Bacteria incorporated in self-healing Materials 2018, 11, 782; doi:10.3390/ma11050782 www.mdpi.com/journal/materials
Transcript of Self-Healing Agent for Cementitious Materials Crack Repair
materials
Article
Ureolytic/Non-Ureolytic Bacteria Co-CulturedSelf-Healing Agent for Cementitious MaterialsCrack Repair
Hyeong Min Son, Ha Yeon Kim, Sol Moi Park ID and Haeng Ki Lee *
Department of Civil and Environmental Engineering, Korea Advanced Institute of Science and Technology,291 Daehak-ro, Yuseong-gu, Daejeon 34141, Korea; [email protected] (H.M.S.);[email protected] (H.Y.K.); [email protected] (S.M.P.)* Correspondence: [email protected]; Tel.: +82-42-350-3623
Received: 18 March 2018; Accepted: 4 May 2018; Published: 11 May 2018�����������������
Abstract: The present study investigated the CaCO3 precipitation performance of ureolytic andnon-ureolytic bacteria co-cultured as a self-healing agent for cementitious materials crack repair. Threedifferent inoculum ratios of ureolytic Sporosarcina pasteurii and non-ureolytic Bacillus thuringiensis(10:0, 8:2, or 5:5) were used. The effect of coculturing ureolytic and non-ureolytic bacteria on microbialmetabolism was investigated by measuring the rate of growth in urea-containing medium and therate of NH4
+ and CaCO3 production in urea–calcium lactate medium. The self-healing efficiency ofco-cultured bacteria was examined by exposing cement mortar specimens with predefined cracksto media containing single urease-producing or co-cultured bacteria. The obtained results providenew findings, where CaCO3 precipitation is improved by co-culturing ureolytic and non-ureolyticbacteria, owing to the relatively faster growth rate of non-ureolytic bacteria. The crack filling ratecorrelated with the width of crack, in particular, specimens with a smaller crack width showed thefaster filling effect, indicating that the crack width can be a dominant factor influencing the CaCO3
precipitation capacity of co-cultured bacteria.
Keywords: ureolytic bacteria; non-ureolytic bacteria; co-cultured bacteria; CaCO3 precipitation;self-healing agent
1. Introduction
Concrete microcracks are a natural phenomenon and occur owing to many factors, such as changesin external force and drying shrinkage [1,2]. The formation of microcracks weakens the mechanicalproperties of concrete and makes the transport of moisture and chemicals through the matrix easier,accelerating concrete deterioration [3–7]. The durability performance of reinforced concrete structuresis highly dictated by the ability to resist against such material transport. For example, sulfate ionspenetrate through microcracks and cause internal pore expansion due to ettringite formation, knownas sulfate attack [8,9], and chloride ions oxidize steel to accelerate the corrosion of steel bars embeddedin concrete [10–12]. Repair work is mandatory to mitigate this problem and to extend the service life ofconcrete structures. While this often involves chemical repair materials (i.e., epoxy resins, polyesters,and polyurethane) [13,14], fundamental problems remain owing to difficulties in precisely locatingmicrocracks, use of chemicals for healing microcracks being environmentally harmful, and the repaireffect not being continuously maintained [15,16].
Against this backdrop, self-healing concrete has received significant attention over recent yearsowing to the potential of repair/maintenance-free concrete with the ability to heal microcracks, deemedas the main source of deterioration in concrete structures [17–23]. Bacteria incorporated in self-healing
Materials 2018, 11, 782; doi:10.3390/ma11050782 www.mdpi.com/journal/materials
Materials 2018, 11, 782 2 of 13
concrete act as healing agents, healing by precipitating CaCO3 at the cracked zone [3,4,17–19,22,24–27].Self-healing concrete has a mechanism to heal cracks through forming CaCO3 by binding to CO3
2−
formed by urea decomposition of bacteria and Ca2+ in concrete [28]. As a result, urea decompositionperformance of bacteria is essential.
Accordingly, studies on self-healing concrete using bacteria preceded the employment of ureolyticbacteria as a self-healing organism [23]. For instance, Bang et al. reported that CaCO3 precipitatedby decomposition of urea by ureolytic bacteria was effective to improve the strength and to repairmicrocracks of concrete [29]. A similar result was obtained by Ghosh et al., who reported an increasein the strength of mortar specimens when Shewanella species were used [30]. The increased strengthof concrete induced by CaCO3 precipitation of Bacillus sphaericus, another known type of ureolyticbacteria, was also found to be accompanied by an enhancement in durability performance, comparedwith conventional treatment methods [31]. Self-healing induced by bacteria is not only limited toconventional concrete (i.e., those using Portland cement as a binder), but is also known to occur infly ash-based concrete. This was intensively investigated by Chahal et al. [32], which found thatcompressive strength, water absorption and chloride permeability were affected by the added amountof S. pasteurii. Another aspect of self-healing concrete being widely studied concerns enhancing thesurvival rate of bacteria in the cement matrix, since it is directly linked to the self-healing capacity. Oneway to achieve this is to incorporate bacterial spores directly into concrete during the mixing process,along with a calcium source and urea [19]. In addition, microcapsulation of bacterial spores was foundto be effective for ensuring the survival of the bacteria despite the internal pressure caused by concretehardening when the bacteria spore is incorporated [19,22].
Despite a considerable number of studies investigating various means to improve the self-healingperformance of bacteria, these studies used a single urease-producing bacterium, implying that thereremains plenty of room for improvement with regards to microbial metabolism. In addition, in aself-healing concrete with bacteria, the limitations of healing effects with respect to crack width andcrack generation time have been studied. In a self-healing concrete with bacteria, the limitations ofhealing effects with respect to crack width and crack generation time have been studied. Luo et al.reported that it is difficult to heal cracks of ≥0.8 mm and that it is hard to heal the crack as thecrack width increases [25]. In addition, they showed that the crack healing effect is highly reducedwhen crack generation time is more than 60 days [25]. Considering these limitations on the crackhealing performance with ureolytic bacteria, further studies are necessary to improve the crackhealing rate. To this end, the present study investigated the self-healing agent using co-culturedbacteria as an effective means to improve microbial metabolism, thereby enhancing the CaCO3
precipitation efficiency.
2. Experimental Procedure
2.1. Bacterial Strains and Growth Medium
Sporosarcina pasteurii (ATCC 11859) and Bacillus thuringiensis (ATCC 10792) were the bacteriaused in this study. S. pasteurii, a urease-producing organism, is known to survive in high alkalineenvironments of concrete [33], and decomposes urea (CH4N2O) into NH4
+ and HCO3− to precipitate
CaCO3 in the presence of Ca2+ [26]. B. thuringiensis, a non-urease producing organism, is agram-positive bacteria that has a negative charge on the outer cell wall and can absorb Ca2+ [34].However, this bacterial species cannot precipitate CaCO3 on its own because it does not decomposeurea. For the preculturing of bacteria, S. pasteurii (obtained from the Korean Collection for TypeCultures, Jeongeup, South Korea) was added to 30 g/L Tryptic Soy Broth (Soybean–Casein DigestMedium) (TSB, Becton Dickinson, Franklin Lakes, NJ, USA) supplemented with 2% urea (333 mM)and cultured at 30 ◦C by shaking at 200 rpm in 650 mL cell culture flasks (SPL Life Science, Pocheon,South Korea) sealed with filter caps for sterile gas exchange. TSB was autoclaved at 121 ◦C and 1.5 psifor 20 min for sterilization, and the urea was filtered with a 0.22 µm pore size filter to prevent urea
Materials 2018, 11, 782 3 of 13
decomposition at high temperatures. B. thuringiensis (obtained from the Korea Collection for TypeCultures, Jeongeup, South Korea) was shake-cultured in 650 mL cell culture flasks (SPL Life Science,Pocheon, South Korea) sealed with filter caps for sterile gas exchange at 30 ◦C and 200 rpm in sterilized25 g/L Miller’s Luria–Bertani broth (LB broth, Becton Dickinson, Franklin Lakes, NJ, USA).
2.2. Experimental Details
Three different inoculum ratios were employed to investigate the effect of co-culture. S. pasteuriialone was used as a control, and S. pasteurii and B. thuringiensis were inoculated at a ratio of 8:2 and 5:5,respectively. These ratios are hereinafter referred to as A, B, and C, respectively, for simplicity (Table 1).S. pasteurii and B. thuringiensis, having reached the exponential phase in the preculture, were inoculatedat 0.5% in medium at A, B, and C ratios. Optical Density (OD) was measured using the Genesystm 30Visible Spectrophotometer (Thermo Fisher Scientific, Waltham, MA, USA) at a wavelength of 600 nmto determine the growth pattern of the two species according to the inoculation ratios of A, B, and C.To observe the growth curve of bacteria at the tested inoculum ratios, the medium comprised 30 g/LTSB supplemented with 2% urea (333 mM) and was cultured in 650 mL cell culture flasks (SPL LifeScience, Pocheon, South Korea) sealed with filter caps for sterile gas exchange at 30 ◦C with shaking at200 rpm. Extraction of 1 mL of aqueous phase was performed every 4 h during 100 h across A, B, and Cratios. S. pasteurii and B. thuringiensis were incubated with Urea–TSB solid medium containing 3% TSB,2% Urea, Urea agar base medium consisting of 1.8% Urea agar base and 1.8% agar for 1 day to confirmthe antagonistic activity of the two bacteria. The crossing points of S. pasteurii and B. thuringiensisdrawn in “M” and “=” shapes on the same medium were analyzed to investigate the effect of eachbacteria on the growth of other bacteria.
Table 1. Microbial inoculation ratio by volume ratio.
Media Code S. pasteurii B. thuringiensis
A 10 0B 8 2C 5 5
The urea–calcium lactate medium was prepared for production of CaCO3. This medium contained6 g/L Nutrient Broth (NB, Becton Dickinson, Franklin Lakes, NJ, USA) for the inclusion of variousbasic nutrient minerals, 333 mM urea (2%) for HCO3
− production, and 91.7 mM calcium lactate for thesupply of Ca2+. NB was autoclaved, and the urea and calcium lactate were sterilized using a 0.22 µmpore size filter. The inoculum of S. pasteurii and B. thuringiensis was added to urea–calcium lactatemedium in 650 mL cell culture flasks (SPL Life Science, Pocheon, South Korea) sealed with filter capsfor sterile gas exchange at ratios of A, B, and C and was incubated at 30 ◦C by shaking at 200 rpm.
To compare the ureolytic activity and the degree of Ca2+ consumption in CaCO3 production,the concentration of NH4
+ produced by the urease expressed by S. pasteurii and the concentrationof Ca2+ used in the production of calcium carbonate were measured. The concentration of NH4
+
and Ca2+ dissolved in the aqueous phase in the culture solutions was measured using Metrohm 930Compact IC Flex (Metrohm, Riverview, Herisau, Switzeland) and a cation exchange column. Fivemilliliters of the aqueous phase were extracted at an interval of 11 h for each of the tested ratios.Sampling was conducted until no further change in the NH4
+ and Ca2+ concentration was observed.The supernatants of the extracted samples were obtained using a High Speed Refrigerated CentrifugeSUPRA 22K (Hanil Science Medical, Daejeon, South Korea) at 4800× g, 4 ◦C and then the NH4
+ andCa2+ concentration was analyzed.
Changes in the pH of the culture medium due to NH4+ production from urea hydrolysis in
S. pasteurii were measured using a SevenGo Portable pH meter (Mettler Tolredo, Columbus, OH,USA). Four milliliters of aqueous phase were extracted at an interval of 4 h for A, B, and C ratios inurea–calcium lactate medium. The initial pH of each culture was kept identical at 7.5.
Materials 2018, 11, 782 4 of 13
The charge of microbial cell surface upon precipitation of calcium carbonate was investigatedby zeta potential measurement. The bacterial species were incubated in urea–lactate medium at aco-culture ratio of A, B, and C, and 5 mL of aqueous phase was extracted after 11 h, 22 h, and 33 h.Each sample was diluted 10-fold and a well dispersed sample was measured on a Nano ZSP/ZEN5602(Malvern Instrument, Malvern, UK).
The amount of CaCO3 produced with the different S. pasteurii: B. thuringiensis ratios was measuredto compare the difference in production for different ratios. CaCO3 was recovered and quantifiedafter shake-incubating in urea–calcium lactate medium at 30 ◦C and 200 rpm for 33 h. For CaCO3
quantitation, the culture broth was collected on Whatman filter paper No. 2. The remaining cells andculture medium were removed by washing the filter paper with distilled water, followed by drying at105 ◦C for 2 h before measuring the weight.
To compare the self-filling capacity of ratios A, B, and C, mortar specimens were prepared. Mortarspecimens were fabricated with a water-to-cement ratio of 0.4 using a 5 × 5 × 5 cm3 mold. The mortarspecimens were sealed with a plastic wrap after casting and were cured at room temperature for theinitial 24 h to prevent water evaporation during setting, then cracks were introduced in the mortarspecimens. Both the mortar specimens with predefined cracks and the culture container were sterilizedby spraying with 70% ethanol. The sterile urea–calcium lactate medium for producing CaCO3 wasplaced in a culture vessel together with the mortar specimen, and the two species that reached theexponential phase were exposed to the culture vessel at ratios A, B, and C. The self-filling of crackswas observed at 500 magnification on a Digibird USB microscope ORT-500 (Digibird, Goyang, Korea)after 1 and 3 days of incubation at 30 ◦C. For comparing the effect of crack filling by co-culture withthat of control, a bacteria-free urea–calcium lactate medium was prepared to cure mortar specimens ascontrol. The other experimental procedures are the same except for the medium conditions.
The morphology of the co-cultured species and the precipitate formed around the bacteria wereobserved using a scanning electron microscope JSM-6300 (SEM, JEOL LTD, Akishima, Tokyo, Japan).Three samples with different co-culture ratios of the two species were shake-incubated in urea–calciumlactate medium for 33 h at 30 ◦C and 200 rpm. The precipitated CaCO3 was filtered through Whatmanfilter paper No. 2, collected, and dried at 105 ◦C in an oven to prepare powder samples for SEM(JEOL LTD, Akishima, Tokyo, Japan) and XRD (Rigaku, Tokyo, Japan) analyses. The XRD analysis wasconducted using Rigaku D/MAX-2500 (Rigaku, Tokyo, Japan) with Cu-Kα radiation at a scan range of5◦–65◦ 2θ and a scan speed of 0.5◦/min.
3. Results
3.1. Culture Growth
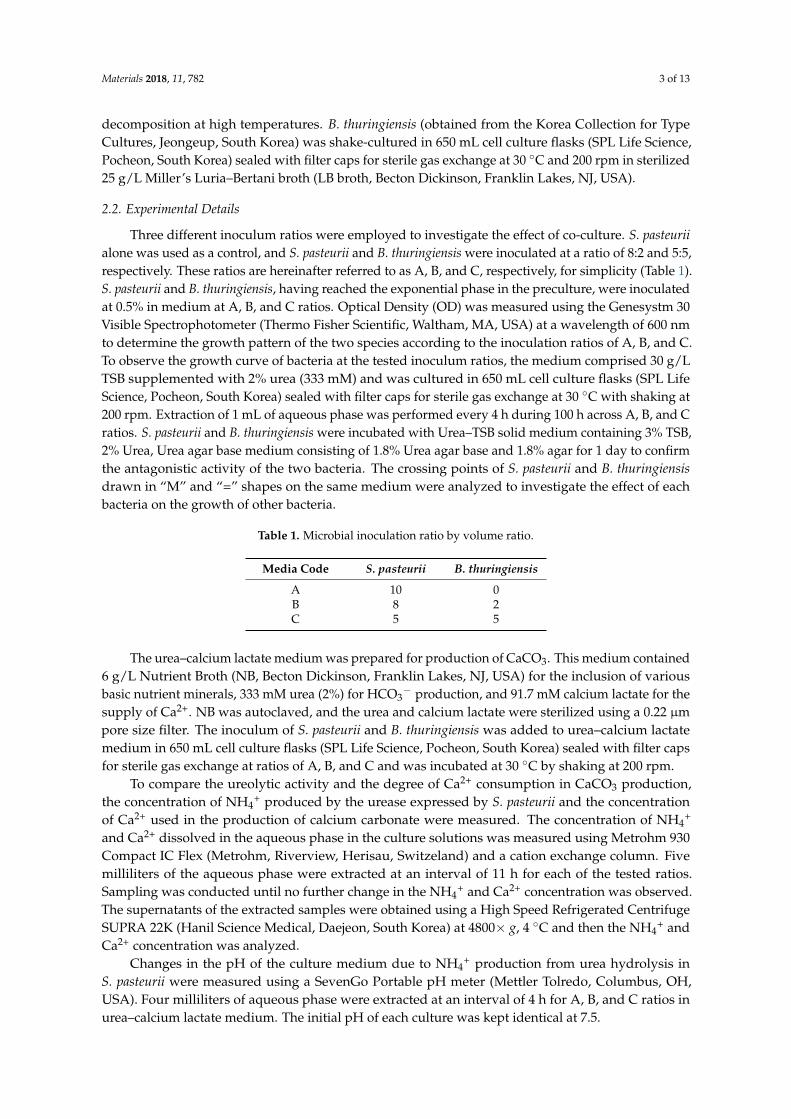
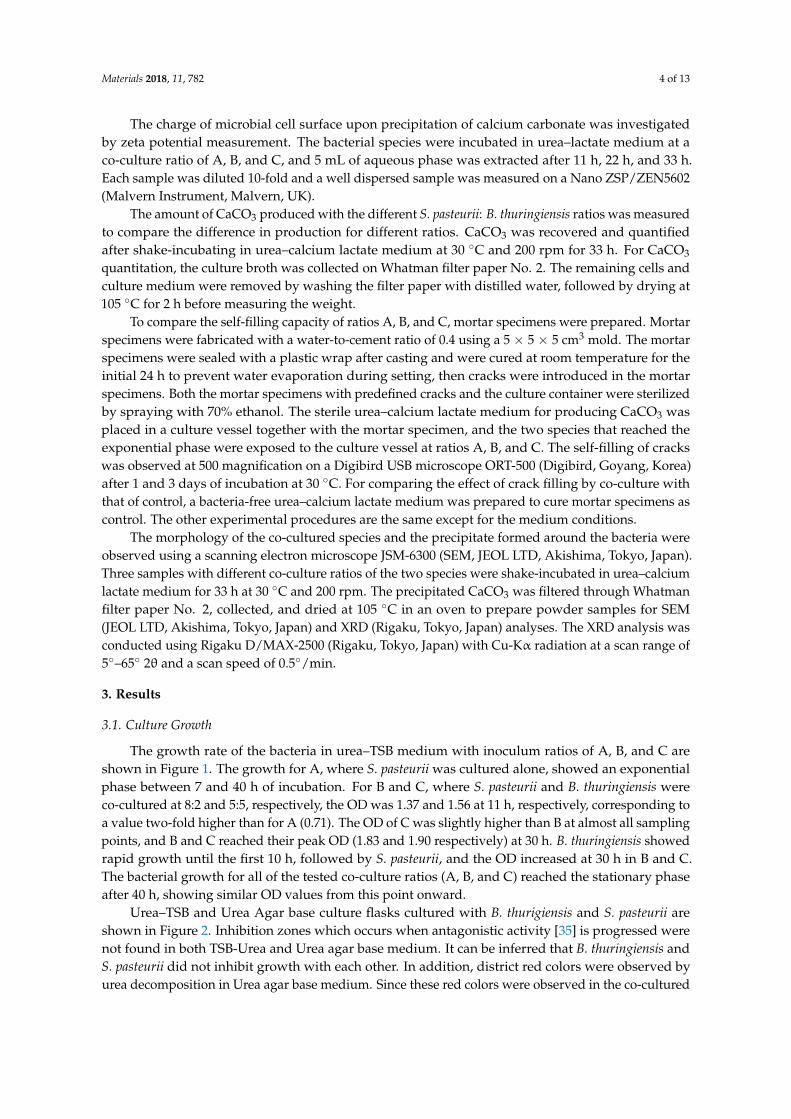
The growth rate of the bacteria in urea–TSB medium with inoculum ratios of A, B, and C areshown in Figure 1. The growth for A, where S. pasteurii was cultured alone, showed an exponentialphase between 7 and 40 h of incubation. For B and C, where S. pasteurii and B. thuringiensis wereco-cultured at 8:2 and 5:5, respectively, the OD was 1.37 and 1.56 at 11 h, respectively, corresponding toa value two-fold higher than for A (0.71). The OD of C was slightly higher than B at almost all samplingpoints, and B and C reached their peak OD (1.83 and 1.90 respectively) at 30 h. B. thuringiensis showedrapid growth until the first 10 h, followed by S. pasteurii, and the OD increased at 30 h in B and C.The bacterial growth for all of the tested co-culture ratios (A, B, and C) reached the stationary phaseafter 40 h, showing similar OD values from this point onward.
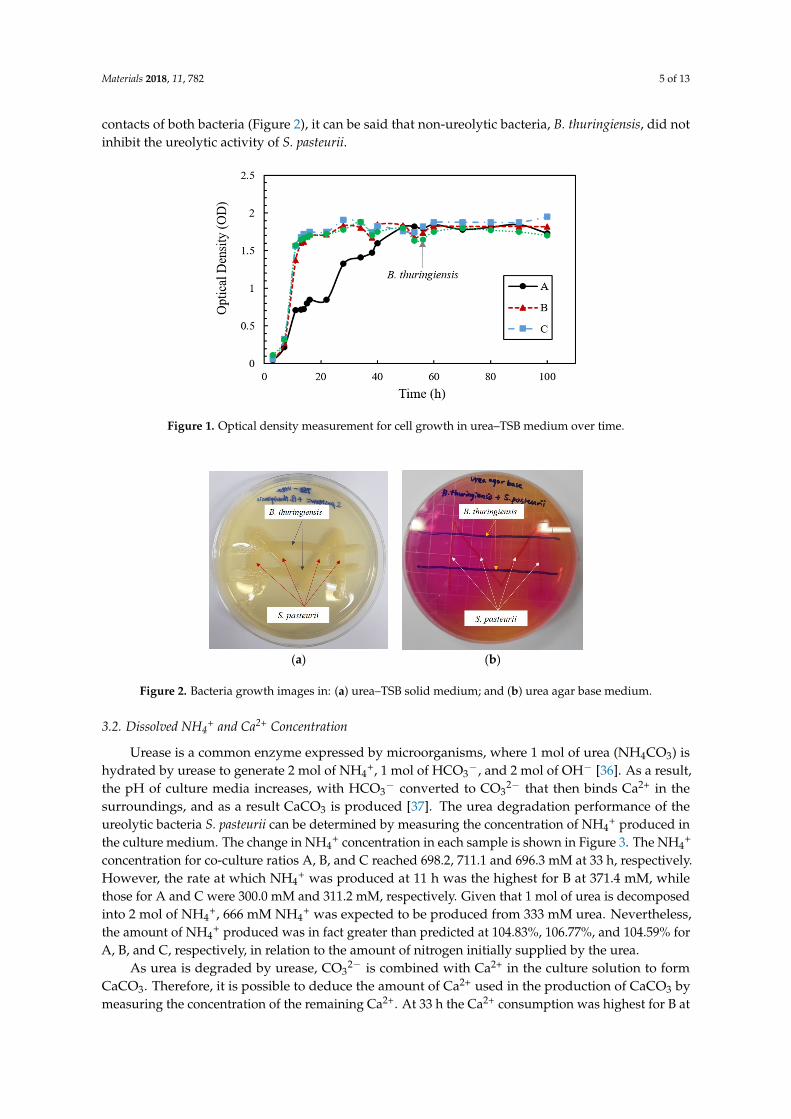
Urea–TSB and Urea Agar base culture flasks cultured with B. thurigiensis and S. pasteurii areshown in Figure 2. Inhibition zones which occurs when antagonistic activity [35] is progressed werenot found in both TSB-Urea and Urea agar base medium. It can be inferred that B. thuringiensis andS. pasteurii did not inhibit growth with each other. In addition, district red colors were observed byurea decomposition in Urea agar base medium. Since these red colors were observed in the co-cultured
Materials 2018, 11, 782 5 of 13
contacts of both bacteria (Figure 2), it can be said that non-ureolytic bacteria, B. thuringiensis, did notinhibit the ureolytic activity of S. pasteurii.Materials 2018, 11, x FOR PEER REVIEW 5 of 13
Figure 1. Optical density measurement for cell growth in urea–TSB medium over time.
(a) (b)
Figure 2. Bacteria growth images in: (a) urea–TSB solid medium; and (b) urea agar base medium.
3.2. Dissolved NH4+ and Ca2+ Concentration
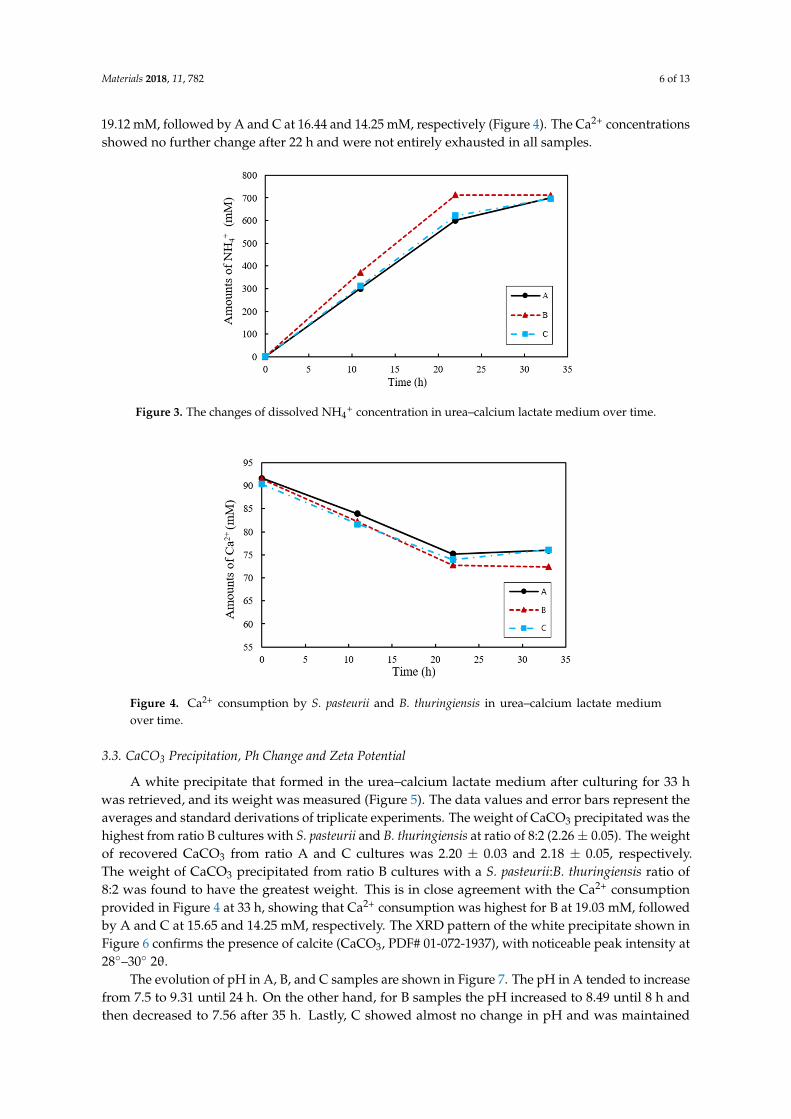
Urease is a common enzyme expressed by microorganisms, where 1 mol of urea (NH4CO3) is hydrated by urease to generate 2 mol of NH4+, 1 mol of HCO3−, and 2 mol of OH− [36]. As a result, the pH of culture media increases, with HCO3− converted to CO32− that then binds Ca2+ in the surroundings, and as a result CaCO3 is produced [37]. The urea degradation performance of the ureolytic bacteria S. pasteurii can be determined by measuring the concentration of NH4+ produced in the culture medium. The change in NH4+ concentration in each sample is shown in Figure 3. The NH4+ concentration for co-culture ratios A, B, and C reached 698.2, 711.1 and 696.3 mM at 33 h, respectively. However, the rate at which NH4+ was produced at 11 h was the highest for B at 371.4 mM, while those for A and C were 300.0 mM and 311.2 mM, respectively. Given that 1 mol of urea is decomposed into 2 mol of NH4+, 666 mM NH4+ was expected to be produced from 333 mM urea. Nevertheless, the amount of NH4+ produced was in fact greater than predicted at 104.83%, 106.77%, and 104.59% for A, B, and C, respectively, in relation to the amount of nitrogen initially supplied by the urea.
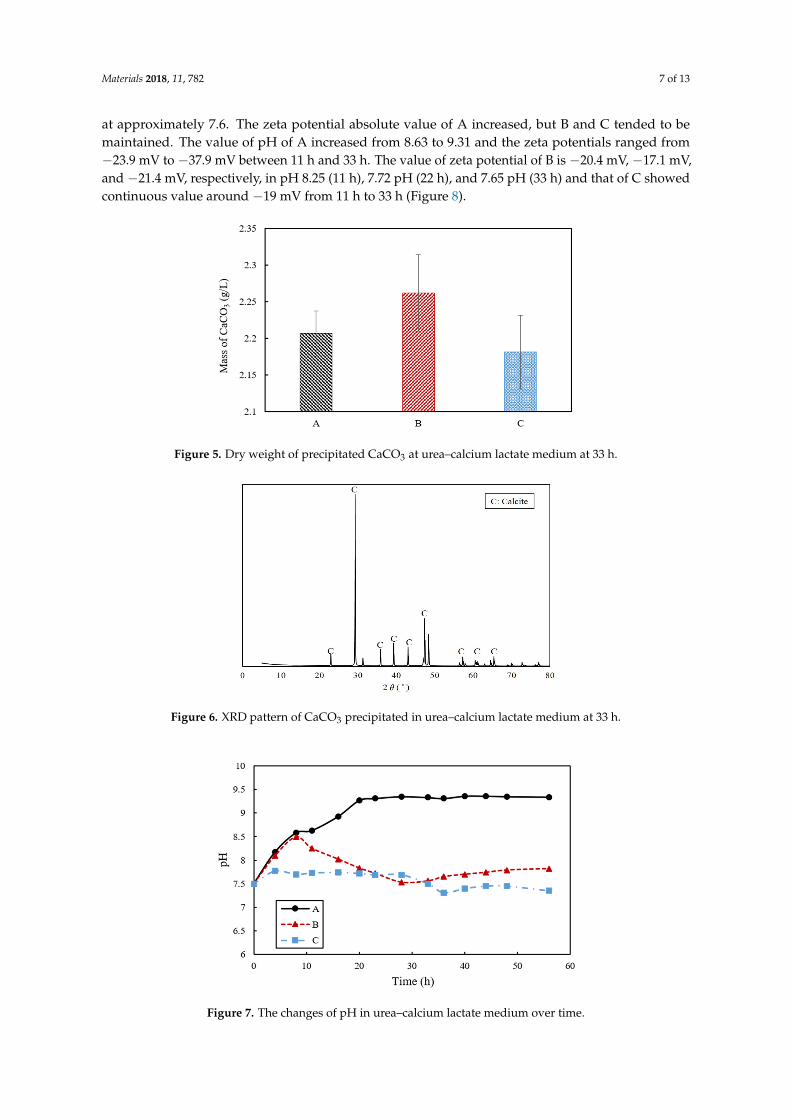
As urea is degraded by urease, CO32− is combined with Ca2+ in the culture solution to form CaCO3. Therefore, it is possible to deduce the amount of Ca2+ used in the production of CaCO3 by measuring the concentration of the remaining Ca2+. At 33 h the Ca2+ consumption was highest for B at 19.12 mM, followed by A and C at 16.44 and 14.25 mM, respectively (Figure 4). The Ca2+ concentrations showed no further change after 22 h and were not entirely exhausted in all samples.
Figure 1. Optical density measurement for cell growth in urea–TSB medium over time.
Materials 2018, 11, x FOR PEER REVIEW 5 of 13
Figure 1. Optical density measurement for cell growth in urea–TSB medium over time.
(a) (b)
Figure 2. Bacteria growth images in: (a) urea–TSB solid medium; and (b) urea agar base medium.
3.2. Dissolved NH4+ and Ca2+ Concentration
Urease is a common enzyme expressed by microorganisms, where 1 mol of urea (NH4CO3) is hydrated by urease to generate 2 mol of NH4+, 1 mol of HCO3−, and 2 mol of OH− [36]. As a result, the pH of culture media increases, with HCO3− converted to CO32− that then binds Ca2+ in the surroundings, and as a result CaCO3 is produced [37]. The urea degradation performance of the ureolytic bacteria S. pasteurii can be determined by measuring the concentration of NH4+ produced in the culture medium. The change in NH4+ concentration in each sample is shown in Figure 3. The NH4+ concentration for co-culture ratios A, B, and C reached 698.2, 711.1 and 696.3 mM at 33 h, respectively. However, the rate at which NH4+ was produced at 11 h was the highest for B at 371.4 mM, while those for A and C were 300.0 mM and 311.2 mM, respectively. Given that 1 mol of urea is decomposed into 2 mol of NH4+, 666 mM NH4+ was expected to be produced from 333 mM urea. Nevertheless, the amount of NH4+ produced was in fact greater than predicted at 104.83%, 106.77%, and 104.59% for A, B, and C, respectively, in relation to the amount of nitrogen initially supplied by the urea.
As urea is degraded by urease, CO32− is combined with Ca2+ in the culture solution to form CaCO3. Therefore, it is possible to deduce the amount of Ca2+ used in the production of CaCO3 by measuring the concentration of the remaining Ca2+. At 33 h the Ca2+ consumption was highest for B at 19.12 mM, followed by A and C at 16.44 and 14.25 mM, respectively (Figure 4). The Ca2+ concentrations showed no further change after 22 h and were not entirely exhausted in all samples.
Figure 2. Bacteria growth images in: (a) urea–TSB solid medium; and (b) urea agar base medium.
3.2. Dissolved NH4+ and Ca2+ Concentration
Urease is a common enzyme expressed by microorganisms, where 1 mol of urea (NH4CO3) ishydrated by urease to generate 2 mol of NH4
+, 1 mol of HCO3−, and 2 mol of OH− [36]. As a result,
the pH of culture media increases, with HCO3− converted to CO3
2− that then binds Ca2+ in thesurroundings, and as a result CaCO3 is produced [37]. The urea degradation performance of theureolytic bacteria S. pasteurii can be determined by measuring the concentration of NH4
+ produced inthe culture medium. The change in NH4
+ concentration in each sample is shown in Figure 3. The NH4+
concentration for co-culture ratios A, B, and C reached 698.2, 711.1 and 696.3 mM at 33 h, respectively.However, the rate at which NH4
+ was produced at 11 h was the highest for B at 371.4 mM, whilethose for A and C were 300.0 mM and 311.2 mM, respectively. Given that 1 mol of urea is decomposedinto 2 mol of NH4
+, 666 mM NH4+ was expected to be produced from 333 mM urea. Nevertheless,
the amount of NH4+ produced was in fact greater than predicted at 104.83%, 106.77%, and 104.59% for
A, B, and C, respectively, in relation to the amount of nitrogen initially supplied by the urea.As urea is degraded by urease, CO3
2− is combined with Ca2+ in the culture solution to formCaCO3. Therefore, it is possible to deduce the amount of Ca2+ used in the production of CaCO3 bymeasuring the concentration of the remaining Ca2+. At 33 h the Ca2+ consumption was highest for B at
Materials 2018, 11, 782 6 of 13
19.12 mM, followed by A and C at 16.44 and 14.25 mM, respectively (Figure 4). The Ca2+ concentrationsshowed no further change after 22 h and were not entirely exhausted in all samples.Materials 2018, 11, x FOR PEER REVIEW 6 of 13
Figure 3. The changes of dissolved NH4+ concentration in urea–calcium lactate medium over time.
Figure 4. Ca2+ consumption by S. pasteurii and B. thuringiensis in urea–calcium lactate medium over time.
3.3. CaCO3 Precipitation, Ph Change and Zeta Potential
A white precipitate that formed in the urea–calcium lactate medium after culturing for 33 h was retrieved, and its weight was measured (Figure 5). The data values and error bars represent the averages and standard derivations of triplicate experiments. The weight of CaCO3 precipitated was the highest from ratio B cultures with S. pasteurii and B. thuringiensis at ratio of 8:2 (2.26 ± 0.05). The weight of recovered CaCO3 from ratio A and C cultures was 2.20 ± 0.03 and 2.18 ± 0.05, respectively. The weight of CaCO3 precipitated from ratio B cultures with a S. pasteurii:B. thuringiensis ratio of 8:2 was found to have the greatest weight. This is in close agreement with the Ca2+ consumption provided in Figure 4 at 33 h, showing that Ca2+ consumption was highest for B at 19.03 mM, followed by A and C at 15.65 and 14.25 mM, respectively. The XRD pattern of the white precipitate shown in Figure 6 confirms the presence of calcite (CaCO3, PDF# 01-072-1937), with noticeable peak intensity at 28°–30° 2θ.
The evolution of pH in A, B, and C samples are shown in Figure 7. The pH in A tended to increase from 7.5 to 9.31 until 24 h. On the other hand, for B samples the pH increased to 8.49 until 8 h and then decreased to 7.56 after 35 h. Lastly, C showed almost no change in pH and was maintained at approximately 7.6. The zeta potential absolute value of A increased, but B and C tended to be maintained. The value of pH of A increased from 8.63 to 9.31 and the zeta potentials ranged from −23.9 mV to −37.9 mV between 11 h and 33 h. The value of zeta potential of B is −20.4 mV, −17.1 mV, and −21.4 mV, respectively, in pH 8.25 (11 h), 7.72 pH (22 h), and 7.65 pH (33 h) and that of C showed continuous value around −19 mV from 11 h to 33 h (Figure 8).
Figure 3. The changes of dissolved NH4+ concentration in urea–calcium lactate medium over time.
Materials 2018, 11, x FOR PEER REVIEW 6 of 13
Figure 3. The changes of dissolved NH4+ concentration in urea–calcium lactate medium over time.
Figure 4. Ca2+ consumption by S. pasteurii and B. thuringiensis in urea–calcium lactate medium over time.
3.3. CaCO3 Precipitation, Ph Change and Zeta Potential
A white precipitate that formed in the urea–calcium lactate medium after culturing for 33 h was retrieved, and its weight was measured (Figure 5). The data values and error bars represent the averages and standard derivations of triplicate experiments. The weight of CaCO3 precipitated was the highest from ratio B cultures with S. pasteurii and B. thuringiensis at ratio of 8:2 (2.26 ± 0.05). The weight of recovered CaCO3 from ratio A and C cultures was 2.20 ± 0.03 and 2.18 ± 0.05, respectively. The weight of CaCO3 precipitated from ratio B cultures with a S. pasteurii:B. thuringiensis ratio of 8:2 was found to have the greatest weight. This is in close agreement with the Ca2+ consumption provided in Figure 4 at 33 h, showing that Ca2+ consumption was highest for B at 19.03 mM, followed by A and C at 15.65 and 14.25 mM, respectively. The XRD pattern of the white precipitate shown in Figure 6 confirms the presence of calcite (CaCO3, PDF# 01-072-1937), with noticeable peak intensity at 28°–30° 2θ.
The evolution of pH in A, B, and C samples are shown in Figure 7. The pH in A tended to increase from 7.5 to 9.31 until 24 h. On the other hand, for B samples the pH increased to 8.49 until 8 h and then decreased to 7.56 after 35 h. Lastly, C showed almost no change in pH and was maintained at approximately 7.6. The zeta potential absolute value of A increased, but B and C tended to be maintained. The value of pH of A increased from 8.63 to 9.31 and the zeta potentials ranged from −23.9 mV to −37.9 mV between 11 h and 33 h. The value of zeta potential of B is −20.4 mV, −17.1 mV, and −21.4 mV, respectively, in pH 8.25 (11 h), 7.72 pH (22 h), and 7.65 pH (33 h) and that of C showed continuous value around −19 mV from 11 h to 33 h (Figure 8).
Figure 4. Ca2+ consumption by S. pasteurii and B. thuringiensis in urea–calcium lactate mediumover time.
3.3. CaCO3 Precipitation, Ph Change and Zeta Potential
A white precipitate that formed in the urea–calcium lactate medium after culturing for 33 hwas retrieved, and its weight was measured (Figure 5). The data values and error bars represent theaverages and standard derivations of triplicate experiments. The weight of CaCO3 precipitated was thehighest from ratio B cultures with S. pasteurii and B. thuringiensis at ratio of 8:2 (2.26 ± 0.05). The weightof recovered CaCO3 from ratio A and C cultures was 2.20 ± 0.03 and 2.18 ± 0.05, respectively.The weight of CaCO3 precipitated from ratio B cultures with a S. pasteurii:B. thuringiensis ratio of8:2 was found to have the greatest weight. This is in close agreement with the Ca2+ consumptionprovided in Figure 4 at 33 h, showing that Ca2+ consumption was highest for B at 19.03 mM, followedby A and C at 15.65 and 14.25 mM, respectively. The XRD pattern of the white precipitate shown inFigure 6 confirms the presence of calcite (CaCO3, PDF# 01-072-1937), with noticeable peak intensity at28◦–30◦ 2θ.
The evolution of pH in A, B, and C samples are shown in Figure 7. The pH in A tended to increasefrom 7.5 to 9.31 until 24 h. On the other hand, for B samples the pH increased to 8.49 until 8 h andthen decreased to 7.56 after 35 h. Lastly, C showed almost no change in pH and was maintained
Materials 2018, 11, 782 7 of 13
at approximately 7.6. The zeta potential absolute value of A increased, but B and C tended to bemaintained. The value of pH of A increased from 8.63 to 9.31 and the zeta potentials ranged from−23.9 mV to −37.9 mV between 11 h and 33 h. The value of zeta potential of B is −20.4 mV, −17.1 mV,and −21.4 mV, respectively, in pH 8.25 (11 h), 7.72 pH (22 h), and 7.65 pH (33 h) and that of C showedcontinuous value around −19 mV from 11 h to 33 h (Figure 8).Materials 2018, 11, x FOR PEER REVIEW 7 of 13
Figure 5. Dry weight of precipitated CaCO3 at urea–calcium lactate medium at 33 h.
Figure 6. XRD pattern of CaCO3 precipitated in urea–calcium lactate medium at 33 h.
Figure 7. The changes of pH in urea–calcium lactate medium over time.
Figure 5. Dry weight of precipitated CaCO3 at urea–calcium lactate medium at 33 h.
Materials 2018, 11, x FOR PEER REVIEW 7 of 13
Figure 5. Dry weight of precipitated CaCO3 at urea–calcium lactate medium at 33 h.
Figure 6. XRD pattern of CaCO3 precipitated in urea–calcium lactate medium at 33 h.
Figure 7. The changes of pH in urea–calcium lactate medium over time.
Figure 6. XRD pattern of CaCO3 precipitated in urea–calcium lactate medium at 33 h.
Materials 2018, 11, x FOR PEER REVIEW 7 of 13
Figure 5. Dry weight of precipitated CaCO3 at urea–calcium lactate medium at 33 h.
Figure 6. XRD pattern of CaCO3 precipitated in urea–calcium lactate medium at 33 h.
Figure 7. The changes of pH in urea–calcium lactate medium over time. Figure 7. The changes of pH in urea–calcium lactate medium over time.

Materials 2018, 11, 782 8 of 13Materials 2018, 11, x FOR PEER REVIEW 8 of 13
Figure 8. The changes of zeta potential in urea–calcium lactate medium over time.
SEM images of CaCO3 precipitated upon decomposition of urea by the bacteria are shown in Figure 9. A hexagonal crystalline phase and amorphous phase coexisted, and the crystal phase was tightly bonded (Figure 9a) and the hexagonal calcite crystals were clearly observable (Figure 9b).
(a)
(b)
Figure 9. SEM images of calcite precipitated in the co-culture medium at magnification of: (a) 30,000; and (b) 7000.
3.4. Effect of CaCO3 Precipitation in Crack on Cementitious Materials
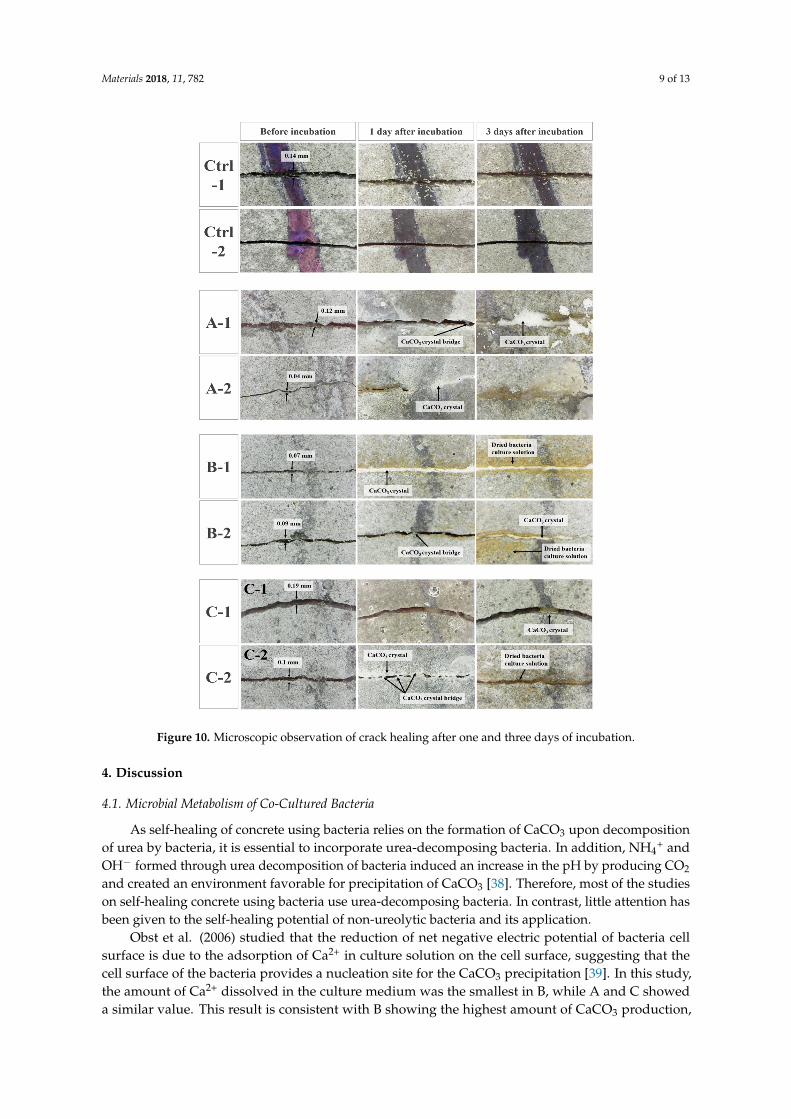
The CaCO3 precipitation process in crack for the mortar specimens with predefined cracks in A, B, and C cultures is shown in Figure 10. It was observed that not only the composition ratio of the culture medium but also the shape of the cracks had a significant influence on the filling rate. For culture A-1 with a crack width of 0.12 mm, a CaCO3 precipitate was observed after three days of incubation. On the other hand, A-2 with a crack width of 0.04 mm showed the formation of CaCO3 and the crack filling even as early as one day of incubation. Similarly, B-1 showed complete crack filling performance after one day of incubation, and the dried bacteria and culture solution appeared prominently around the crack after three days of incubation. Meanwhile, the 0.19 mm wide crack combined with the C culture had the slowest rate of crack filling, showing scarce distribution of CaCO3 precipitates after three days of incubation. However, in the case of the C-2 mortar specimen with a 0.1 mm crack, filling of the crack had occurred due to deposition of CaCO3 after one day of incubation, with complete filling of the crack observed after three days of incubation. On the other hand, cracks in mortar specimens that was cured in bacteria-free urea–calcium lactate medium as control did not heal after one and three days.
Figure 8. The changes of zeta potential in urea–calcium lactate medium over time.
SEM images of CaCO3 precipitated upon decomposition of urea by the bacteria are shown inFigure 9. A hexagonal crystalline phase and amorphous phase coexisted, and the crystal phase wastightly bonded (Figure 9a) and the hexagonal calcite crystals were clearly observable (Figure 9b).
Materials 2018, 11, x FOR PEER REVIEW 8 of 13
Figure 8. The changes of zeta potential in urea–calcium lactate medium over time.
SEM images of CaCO3 precipitated upon decomposition of urea by the bacteria are shown in Figure 9. A hexagonal crystalline phase and amorphous phase coexisted, and the crystal phase was tightly bonded (Figure 9a) and the hexagonal calcite crystals were clearly observable (Figure 9b).
(a)
(b)
Figure 9. SEM images of calcite precipitated in the co-culture medium at magnification of: (a) 30,000; and (b) 7000.
3.4. Effect of CaCO3 Precipitation in Crack on Cementitious Materials
The CaCO3 precipitation process in crack for the mortar specimens with predefined cracks in A, B, and C cultures is shown in Figure 10. It was observed that not only the composition ratio of the culture medium but also the shape of the cracks had a significant influence on the filling rate. For culture A-1 with a crack width of 0.12 mm, a CaCO3 precipitate was observed after three days of incubation. On the other hand, A-2 with a crack width of 0.04 mm showed the formation of CaCO3 and the crack filling even as early as one day of incubation. Similarly, B-1 showed complete crack filling performance after one day of incubation, and the dried bacteria and culture solution appeared prominently around the crack after three days of incubation. Meanwhile, the 0.19 mm wide crack combined with the C culture had the slowest rate of crack filling, showing scarce distribution of CaCO3 precipitates after three days of incubation. However, in the case of the C-2 mortar specimen with a 0.1 mm crack, filling of the crack had occurred due to deposition of CaCO3 after one day of incubation, with complete filling of the crack observed after three days of incubation. On the other hand, cracks in mortar specimens that was cured in bacteria-free urea–calcium lactate medium as control did not heal after one and three days.
Figure 9. SEM images of calcite precipitated in the co-culture medium at magnification of: (a) 30,000;and (b) 7000.
3.4. Effect of CaCO3 Precipitation in Crack on Cementitious Materials
The CaCO3 precipitation process in crack for the mortar specimens with predefined cracks in A, B,and C cultures is shown in Figure 10. It was observed that not only the composition ratio of the culturemedium but also the shape of the cracks had a significant influence on the filling rate. For cultureA-1 with a crack width of 0.12 mm, a CaCO3 precipitate was observed after three days of incubation.On the other hand, A-2 with a crack width of 0.04 mm showed the formation of CaCO3 and the crackfilling even as early as one day of incubation. Similarly, B-1 showed complete crack filling performanceafter one day of incubation, and the dried bacteria and culture solution appeared prominently aroundthe crack after three days of incubation. Meanwhile, the 0.19 mm wide crack combined with the Cculture had the slowest rate of crack filling, showing scarce distribution of CaCO3 precipitates afterthree days of incubation. However, in the case of the C-2 mortar specimen with a 0.1 mm crack, fillingof the crack had occurred due to deposition of CaCO3 after one day of incubation, with complete fillingof the crack observed after three days of incubation. On the other hand, cracks in mortar specimensthat was cured in bacteria-free urea–calcium lactate medium as control did not heal after one andthree days.
Materials 2018, 11, 782 9 of 13
Materials 2018, 11, x FOR PEER REVIEW 9 of 13
Figure 10. Microscopic observation of crack healing after one and three days of incubation.
4. Discussion
4.1. Microbial Metabolism of Co-Cultured Bacteria
As self-healing of concrete using bacteria relies on the formation of CaCO3 upon decomposition of urea by bacteria, it is essential to incorporate urea-decomposing bacteria. In addition, NH4+ and OH− formed through urea decomposition of bacteria induced an increase in the pH by producing CO2 and created an environment favorable for precipitation of CaCO3 [38]. Therefore, most of the studies on self-healing concrete using bacteria use urea-decomposing bacteria. In contrast, little attention has been given to the self-healing potential of non-ureolytic bacteria and its application.
Obst et al. (2006) studied that the reduction of net negative electric potential of bacteria cell surface is due to the adsorption of Ca2+ in culture solution on the cell surface, suggesting that the cell surface of the bacteria provides a nucleation site for the CaCO3 precipitation [39]. In this study, the amount of Ca2+ dissolved in the culture medium was the smallest in B, while A and C showed a similar value. This result is consistent with B showing the highest amount of CaCO3 production, as indicated by weight measurements of the precipitated CaCO3. Both results show that cocultivation of S. pasteurii and B. thuringiensis has a synergetic effect on CaCO3 precipitation, attributed to the
Figure 10. Microscopic observation of crack healing after one and three days of incubation.
4. Discussion
4.1. Microbial Metabolism of Co-Cultured Bacteria
As self-healing of concrete using bacteria relies on the formation of CaCO3 upon decompositionof urea by bacteria, it is essential to incorporate urea-decomposing bacteria. In addition, NH4
+ andOH− formed through urea decomposition of bacteria induced an increase in the pH by producing CO2
and created an environment favorable for precipitation of CaCO3 [38]. Therefore, most of the studieson self-healing concrete using bacteria use urea-decomposing bacteria. In contrast, little attention hasbeen given to the self-healing potential of non-ureolytic bacteria and its application.
Obst et al. (2006) studied that the reduction of net negative electric potential of bacteria cellsurface is due to the adsorption of Ca2+ in culture solution on the cell surface, suggesting that thecell surface of the bacteria provides a nucleation site for the CaCO3 precipitation [39]. In this study,the amount of Ca2+ dissolved in the culture medium was the smallest in B, while A and C showeda similar value. This result is consistent with B showing the highest amount of CaCO3 production,
Materials 2018, 11, 782 10 of 13
as indicated by weight measurements of the precipitated CaCO3. Both results show that cocultivationof S. pasteurii and B. thuringiensis has a synergetic effect on CaCO3 precipitation, attributed to thepresence of more nucleation sites. High cell density during the hydrolysis of urea was effective inincreasing the diversity and size of CaCO3 crystals.
As S. pasteurii is a gram-positive bacteria, the surface of the cell wall is negatively charged byteichoic acid bound with phosphate, and Ca2+ in the culture solution is attracted to saturation aroundthe cell wall [40]. Therefore, CaCO3 is produced as the Ca2+ present around bacteria reacts withCO3
2− formed upon urea degradation by the release of urease into the culture medium by S. pasteurii.However, as CaCO3 is formed around the cell membrane, the surface of S. pasteurii is saturated owingto continuous CaCO3 precipitation, effectively making it difficult for Ca2+ and urea to reach the surfaceof the bacteria. Consequently, the bacterial CaCO3 production activity is lowered. B. thuringiensiswith a relatively faster growth rate may possess an enhanced binding capacity for Ca2+ and CO3
2− byproviding additional nucleation sites outside of those provided by S. pasteurii embedded in CaCO3.
When B. thuringiensis and S. pasteurii are co-cultured, the concentrations of NH4+ and Ca2+ for
CaCO3 precipitation were expected to vary according to urea degradation performance of bacteria.Since S. pasteurii was the only species capable of decomposing urea in this study, it was anticipated thatthe cultures that solely consist of S. pasteurii would display the highest concentration of NH4
+ amongthe samples. However, the highest amount of NH4
+ was observed in the B cultures at all samplingpoints during the measurement of NH4
+ concentration. As shown in the OD results, B. thuringiensishad a relatively faster growth rate in comparison with S. pasteurii, more rapidly decomposing NB andthereby releasing additional NH4
+. Consequently, the highest concentration of NH4+ was achieved in
B cultures, where the amount of NH4+ was further increased by decomposition of NB as well as urea.
S. pasteurii and B. thuringiensis were inoculated into the culture medium at a ratio of A, B, andC, but the ratio of the two species in a culture medium after incubation is different from the initialinoculation ratio because of the different growth rates of each bacterium. However, rapid and highproduction of CaCO3 is linked to the initial inoculation ratio, and it may be reasonable to assume thatthe change in the ratio of two bacteria after co-culturing does not affect the outcome of the rapid effectof crack healing. In Figure 1, the optical density value of sample A cultured with only S. pasteurii wastwice as low as that of B. thuringiensis-cultured sample. However, although a difference was observedin NH4
+ production between each sample inoculated at ratios of A, B, and C, there was no significantdifference in NH4
+ production in each sample with respect to the difference in OD value. In addition,despite of the slow growth rate, S. pasteurii provided sufficient CO3
2− by degrading urea, and thenucleation site increased owing to the rapid growth of B. thuringiensis. Therefore, ratio B cultureproduced higher amount of CaCO3 in a short time (Figures 3 and 4). Hence, to increase the effect ofcrack healing, co-cultivation of S. pasteurii and B. thuringiensis at a ratio of 8:2 is more effective.
The evolution of pH was also observed to be different according to the samples used. For instance,the pH in A and B was increased to 8.5 within 10 h of incubation, probably due to the increasedconcentrations of NH4
+ and OH− that were produced by the hydrolysis of urea. However, the pH in Bshowed a sharp decrease after 10 h, presumably attributed to CaCO3 precipitation, where by wateris released. Despite the decomposition of urea, the facultative anaerobic organism B. thuringiensisreduces culture medium pH due to the respiration process when oxygen is present, hence, the pHremained stationary and relatively unchanged in B and C that contained B. thuringiensis with a highergrowth rate than S. pasteurii. It is interesting to note that the pH in C was constant from the beginning;even though the pH can be increased by increased OH− concentration from the ureolytic process,this can be compensated by the breathing of CO2 and production of CaCO3 by B. thuringiensis. Theseresults are also closely related to the zeta potential change of each sample. This implied that increasingdegradation of urea had an effect on increasing pH, indicating that increasing the degree of dispersionresult in increasing zeta potential absolute value.
Materials 2018, 11, 782 11 of 13
4.2. Morphology of CaCO3 Precipitated by Co-Cultured Bacteria
SEM results showed various crystal phases that formed around the nucleation site of the bacteria.In addition, the crystal phases of calcite with a hexagonal shape and other phases with spherical shapewere observed. It should be noted that the size and crystallinity of the crystal phase are affected bythe concentration of urea and CaCO3 in the culture medium; as the concentration of urea and calciumincreases, the crystal size and crystallinity becomes lower [40]. This led to the formation of calcite,as well as a variety of other phases that were amorphous in nature.
4.3. Crack-Filling Efficiency of Co-Cultured Bacteria
Numerous studies have been performed to determine the performance of self-healing concretewith respect to the healing time and crack width variable, and it has been shown that the healing ratereduces as crack width and healing time increase. In addition, because crack healing performanceis influenced by the change in bacterial species and healing environment conditions, crack widthand healing time should be investigated in crack healing by co-culturing, as reported in this study.The crack filling process of mortar specimens with predefined cracks via CaCO3 precipitation in culturemedia showed different rates of filling. The smaller the width of the crack, the faster the observedcrack filling was. Similarly, crack filling was less apparent even after three days of exposure to theculture medium, when the width of the crack was sufficiently large. The results indicate that the crackwidth is an important factor in crack filling via CaCO3 precipitation. A similar result was found in aprevious study that reported that the maximum crack filling capacity achieved in a mortar specimenexposed to medium containing 5% B. sphaericus spores was in the range of 330–400 nm [22].
In this study, CaCO3 precipitation and the effect of self-filling in the mortar by the coculturingof ureolytic and non-ureolytic bacteria were investigated. As a result, it might be assumed thatthe increase of the quantity of CaCO3 precipitation and the crack filling effect can be improved byco-culture. However, in this experiment, although the possibility of co-culture to increase precipitationof CaCO3 was investigated, incorporating bacteria spore and urea in the cementitious materials for theself-healing concrete production was not achieved. Thus, further work should therefore include toapply spore cultures as well as bacterial co-culture to the exploration of potential applications.
5. Conclusions
The present study investigated the effect of coculturing ureolytic and non-ureolytic bacteria onthe self-filling of cement mortar. To this aim, urea–calcium lactate media containing S. pasteurii andB. thuringiensis were prepared at an inoculation ratio of 10:0, 8:2, or 5:5, to which mortar specimenswith predefined cracks were exposed. The obtained results indicate enhanced CaCO3 precipitationby coculturing ureolytic and non-ureolytic bacteria and elucidate the principles involved in suchphenomena. The findings of this study can be summarized as below:
(1) The urea–calcium lactate medium in which B. thuringiensis and S. pasteurii were co-culturedshowed enhanced consumption of Ca2+, thereby leading to a higher extent of CaCO3 precipitationin comparison cultures solely containing S. pasteurii.
(2) The faster growth rate of the non-ureolytic organism B. thuringiensis compared to the ureolyticbacteria led to more rapid respiration producing CO2 which decrease pH and provided nucleationsite that effectively enhanced CaCO3 precipitation.
(3) The rapid growth of B. thuringiensis was also effective for NB decomposition, as evidenced by thehigher concentration of NH4
+ in the coculturing medium, whereby production of CO32− and
CaCO3 were significantly increased.(4) The performance of the bacteria for crack filling in mortar specimens was largely dictated by
the width of crack. Even though a higher amount of CaCO3 precipitation was achieved in theco-cultured medium, the rate of crack filling was found to be more dependent on the crack widththan the co-culture ratios.

Materials 2018, 11, 782 12 of 13
Author Contributions: H.M.S. and H.Y.K. came up with main conceptual idea, performed the plannedexperiments and wrote the manuscript with support from S.M.P. and H.K.L. All of them contributed to theimplementation of the paper, to discussion of the results and to the preparing of the figures, tables andthe manuscript.
Acknowledgments: This research was supported by the National Research Foundation (NRF) of the Koreangovernment funded by the Korean government (Ministry of Science, ICT & Future Planning) (2015R1A2A1A10055694).
Conflicts of Interest: The authors declare no conflict of interest.
References
1. Benboudjema, F.; Meftah, F.; Torrenti, J.M. Interaction between drying, shrinkage, creep and crackingphenomena in concrete. Eng. Struct. 2005, 27, 239–250. [CrossRef]
2. Cusson, D.; Hoogeveen, T. Internal curing of high-performance concrete with pre-soaked fine lightweightaggregate for prevention of autogenous shrinkage cracking. Cem. Concr. Res. 2008, 38, 757–765. [CrossRef]
3. Jonkers, H.M. Self healing concrete: A biological approach. In Self Healing Materials; Springer: Dordrecht,The Netherlands, 2007; pp. 195–204.
4. Van Tittelboom, K.; De Belie, N.; De Muynck, W.; Verstraete, W. Use of bacteria to repair cracks in concrete.Cem. Concr. Res. 2010, 40, 157–166. [CrossRef]
5. Sahmaran, M.; Li, V.C. Influence of microcracking on water absorption and sorptivity of ECC. Mater. Struct.2009, 42, 593–603. [CrossRef]
6. Jang, J.G.; Park, S.M.; Lee, H.K. Physical barrier effect of geopolymeric waste form on diffusivity of cesiumand strontium. J. Hazard. Mater. 2016, 318, 339–346. [CrossRef] [PubMed]
7. Zhong, W.; Yao, W. Influence of damage degree on self-healing of concrete. Constr. Build. Mater. 2008, 22,1137–1142. [CrossRef]
8. Zhang, M.; Chen, J.; Lv, Y.; Wang, D.; Ye, J. Study on the expansion of concrete under attack of sulfate andsulfate–chloride ions. Constr. Build. Mater. 2013, 39, 26–32. [CrossRef]
9. Basista, M.; Weglewski, W. Micromechanical modeling of sulphate corrosion in concrete: Influence ofettringite forming reaction. Theor. Appl. Mech. 2008, 35, 29–52. [CrossRef]
10. De Anna, P.L. The effects of water and chloride ions on the electrochemical behaviour of iron and 304Lstainless steel in alcohols. Corros. Sci. 1985, 25, 43–53. [CrossRef]
11. Ma, Y.; Li, Y.; Wang, F. Corrosion of low carbon steel in atmospheric environments of different chloridecontent. Corros. Sci. 2009, 51, 997–1006. [CrossRef]
12. Lee, N.K.; Lee, H.K. Influence of the slag content on the chloride and sulfuric acid resistances ofalkali-activated fly ash/slag paste. Cem. Concr. Compos. 2016, 72, 168–179. [CrossRef]
13. Wong, T.S.; Kang, S.H.; Tang, S.K.; Smythe, E.J.; Hatton, B.D.; Grinthal, A.; Aizenberg, J. Bioinspiredself-repairing slippery surfaces with pressure-stable omniphobicity. Nature 2011, 477, 443. [CrossRef][PubMed]
14. Morgan, D.R. Compatibility of concrete repair materials and systems. Constr. Build. Mater. 1996, 10, 57–67.[CrossRef]
15. Basheer, L.; Cleland, D.J. Freeze–thaw resistance of concretes treated with pore liners. Constr. Build. Mater.2006, 20, 990–998. [CrossRef]
16. Ibrahim, M.; Al-Gahtani, A.S.; Maslehuddin, M.; Almusallam, A.A. Effectiveness of concrete surfacetreatmentmaterials in reducing chloride-induced reinforcement corrosion. Constr. Build. Mater. 1997,11, 443–451. [CrossRef]
17. Wiktor, V.; Jonkers, H.M. Quantification of crack-healing in novel bacteria-based self-healing concrete.Cem. Concr. Compos. 2011, 33, 763–770. [CrossRef]
18. Wang, J.; Van Tittelboom, K.; De Belie, N.; Verstraete, W. Use of silica gel or polyurethane immobilizedbacteria for self-healing concrete. Constr. Build. Mater. 2012, 26, 532–540. [CrossRef]
19. Jonkers, H.M.; Thijssen, A.; Muyzer, G.; Copuroglu, O.; Schlangen, E. Application of bacteria as self-healingagent for the development of sustainable concrete. Ecol. Eng. 2010, 36, 230–235. [CrossRef]
20. Wang, J.Y.; De Belie, N.; Verstraete, W. Diatomaceous earth as a protective vehicle for bacteria applied forself-healing concrete. J. Ind. Microbiol. Biotechnol. 2012, 39, 567–577. [CrossRef] [PubMed]
Materials 2018, 11, 782 13 of 13
21. Reinhardt, H.W.; Jooss, M. Permeability and self-healing of cracked concrete as a function of temperatureand crack width. Cem. Concr. Res. 2003, 33, 981–985. [CrossRef]
22. Wang, J.Y.; Soens, H.; Verstraete, W.; De Belie, N. Self-healing concrete by use of microencapsulated bacterialspores. Cem. Concr. Res. 2014, 56, 139–152. [CrossRef]
23. Kim, H.K.; Park, S.J.; Han, J.I.; Lee, H.K. Microbially mediated calcium carbonate precipitation on normaland lightweight concrete. Constr. Build. Mater. 2013, 38, 1073–1082. [CrossRef]
24. Wang, J. Self-Healing Concrete by Means of Immobilized Carbonate Precipitating Bacteria. Ph.D. Thesis,Ghent University, Ghent, Belgium, 2013.
25. Luo, M.; Qian, C.X.; Li, R.Y. Factors affecting crack repairing capacity of bacteria-based self-healing concrete.Constr. Build. Mater. 2015, 87, 1–7. [CrossRef]
26. Achal, V.; Mukherjee, A.; Basu, P.C.; Reddy, M.S. Strain improvement of Sporosarcina pasteurii for enhancedurease and calcite production. J. Ind. Microbiol. Biotechnol. 2009, 36, 981–988. [CrossRef] [PubMed]
27. Achal, V.; Mukerjee, A.; Reddy, M.S. Biogenic treatment improves the durability and remediates the cracksof concrete structures. Constr. Build. Mater. 2013, 48, 1–5. [CrossRef]
28. Mobley, H.L.; Hausinger, R.P. Microbial ureases: Significance, regulation, and molecular characterization.Microbiol. Rev. 1989, 53, 85–108. [PubMed]
29. Bang, S.S.; Galinat, J.K.; Ramakrishnan, V. Calcite precipitation induced by polyurethane-immobilizedBacillus pasteurii. Enzym. Microb. Technol. 2001, 28, 404–409. [CrossRef]
30. Ghosh, S.; Biswas, M.; Chattopadhyay, B.D.; Mandal, S. Microbial activity on the microstructure of bacteriamodified mortar. Cem. Concr. Compos. 2009, 31, 93–98. [CrossRef]
31. De Muynck, W.; Debrouwer, D.; De Belie, N.; Verstraete, W. Bacterial carbonate precipitation improves thedurability of cementitious materials. Cem. Concr. Res. 2008, 38, 1005–1014. [CrossRef]
32. Chahal, N.; Siddique, R.; Rajor, A. Influence of bacteria on the compressive strength, water absorption andrapid chloride permeability of fly ash concrete. Constr. Build. Mater. 2012, 28, 351–356. [CrossRef]
33. Tiwari, P.K.; Joshi, K.; Rehman, R.; Bhardwaj, V.; Shamsudheen, K.V.; Sivasubbu, S.; Scaria, V. Draft genomesequence of urease-producing Sporosarcina pasteurii with potential application in biocement production.Genome Announc. 2014, 2, e01256-13. [CrossRef] [PubMed]
34. Schnepf, E.; Crickmore, N.V.; Van Rie, J.; Lereclus, D.; Baum, J.; Feitelson, J.; Zeigler, D.; Dean, D.H.Bacillus thuringiensis and its pesticidal crystal proteins. Microbiol. Mol. Biol. Rev. 1998, 62, 775–806. [PubMed]
35. Živkovic, S.; Stojanovic, S.; Ivanovic, Ž.; Gavrilovic, V.; Popovic, T.; Balaž, J. Screening of antagonistic activityof microorganisms against Colletotrichum acutatum and Colletotrichum gloeosporioides. Arch. Biol. Sci.2010, 62, 611–623. [CrossRef]
36. Li, M.; Cheng, X.; Guo, H. Heavy metal removal by biomineralization of urease producing bacteria isolatedfrom soil. Int. Biodeterior. Biodegrad. 2013, 76, 81–85. [CrossRef]
37. Achal, V.; Mukherjee, A.; Reddy, M.S. Biocalcification by Sporosarcina pasteurii using corn steep liquor as thenutrient source. Ind. Biotechnol. 2010, 6, 170–174. [CrossRef]
38. Kim, H.J.; Eom, H.J.; Park, C.; Jung, J.; Shin, B.; Kim, W.; Kim, W.; Chung, N.; Choi, I.L.; Park, W. Calciumcarbonate precipitation by Bacillus and Sporosarcina strains isolated from concrete and analysis of the bacterialcommunity of concrete. J. Microbiol. Biotechnol. 2016, 26, 540–548. [CrossRef] [PubMed]
39. Obst, M.; Dittrich, M.; Kuehn, H. Calcium adsorption and changes of the surface microtopography ofcyanobacteria studied by AFM, CFM, and TEM with respect to biogenic calcite nucleation. Geochem. Geophys.Geosyst. 2006, 7, Q06011. [CrossRef]
40. De Muynck, W.; Verbeken, K.; De Belie, N.; Verstraete, W. Influence of urea and calcium dosage on theeffectiveness of bacterially induced carbonate precipitation on limestone. Ecol. Eng. 2010, 36, 99–111.[CrossRef]
© 2018 by the authors. Licensee MDPI, Basel, Switzerland. This article is an open accessarticle distributed under the terms and conditions of the Creative Commons Attribution(CC BY) license (http://creativecommons.org/licenses/by/4.0/).