Self-Assessment, Self-Enhancement, and the Choice of...
41
Organizational Social Comparison – Page 1 Self-Assessment, Self-Enhancement, and the Choice of Comparison Organizations for Evaluating Organizational Performance Pino G. Audia* Dartmouth College Sebastien Brion IESE Business School Henrich R. Greve INSEAD * Correspondence should be sent to: Pino Audia Tuck School of Business at Dartmouth 100 Tuck Hall Hanover, NH 03755 USA (603) 646-0527 [email protected]
Transcript of Self-Assessment, Self-Enhancement, and the Choice of...

Organizational Social Comparison – Page 1
Self-Assessment, Self-Enhancement, and the Choice of Comparison
Organizations for Evaluating Organizational Performance
Pino G. Audia*
Dartmouth College
Sebastien Brion
IESE Business School
Henrich R. Greve
INSEAD
* Correspondence should be sent to:
Pino Audia
Tuck School of Business
at Dartmouth
100 Tuck Hall
Hanover, NH 03755 USA
(603) 646-0527

Organizational Social Comparison – Page 2
Self-Assessment, Self-Enhancement, and the Choice of Comparison
Organizations for Evaluating Organizational Performance
Abstract
We examine the influence of the self-assessment and self-enhancement motives on the choice of
comparison organizations. Study 1 shows that: (1) self-assessment generally prevailed over self-
enhancement, guiding decision-makers to choose organizations that were more similar and had better
performance; (2) self-enhancement was more pronounced under conditions of low performance, leading
participants to more frequently choose organizations that were less similar and had lower performance;
and, (3) self-enhancing comparisons inhibited perceptions of failure and the propensity to make changes.
Study 2 extends the results of Study 1 by showing that participants were more likely to choose
comparison organizations that had lower performance and were less similar when they were in a self-
enhancement mindset than when they were in a self-assessment mindset. The combined effects of self-
assessment and self-enhancement on the choice of comparison organizations are discussed in relation to
the broader organizational literature on learning from performance feedback.
Keywords: social comparison, organizational performance feedback theory

Organizational Social Comparison – Page 3
SELF-ASSESSMENT, SELF-ENHANCEMENT, AND THE CHOICE OF COMPARISON
ORGANIZATIONS FOR EVALUATING ORGANIZATIONAL PERFORMANCE
Perhaps no topic in research on organizational learning is more prominent than learning
from performance feedback (Cyert & March, 1963; Huber, 1991; Levitt & March, 1988; March
& Shapira, 1992; Greve, 2003). Yet in this ever-growing literature, there is a curious deficit. The
theory recognizes that subjective interpretations of organizational performance prompt a wide
range of behavioral responses and that these interpretations are often based on comparisons with
organizations facing similar business environments. Yet very little empirical research examines
the prerequisite question of how comparison organizations are chosen to evaluate performance.
Researchers examining the impact of performance on change, risky investments, and
innovative efforts usually assume that decision makers rely on judgments of similarity as the
primary basis of choosing comparison organizations (e.g., Audia, Locke, & Smith, 2000;
Haleblian, Kim, & Rajagopalan, 2006; Westphal & Bednar, 2005). Executives in the railroad
industry, for example, are assumed to compare their performance to the performance of other
railroad companies (Desai, 2008) and executives in the radio industry are assumed to evaluate
their performance in relation to the performance of other radio organizations (Greve, 1998), and
within-industry comparisons are assumed also in multi-industry panel studies (e.g., Fiegenbaum
& Thomas, 1988). This assumption is rooted in the view, articulated by Festinger (1954) and
incorporated in normative models of strategic management (e.g., Peteraf & Bergen, 2003), that
the primary motive guiding the choice of comparable organizations is the desire to be accurate,
what social psychologists have called self-assessment (Sedikides & Strube, 1997). Consider for
Organizational Social Comparison – Page 4
example a decision maker who wants to evaluate the performance of a car manufacturer. By this
view comparisons to the performance of other car manufacturers are thought to give a more
accurate evaluation of the performance of the focal organization than comparisons to less similar
organizations, such as for example, a broad array of transportation equipment manufacturers
including manufacturers of cars but also manufacturers of airplanes and trains. Greater similarity
between the focal organization and comparison organizations in terms of products and resources
employed is thought to increase the quality of the inferences one can draw from the comparison.
Although decision makers are expected to choose comparison organizations on the basis
of similarity and to be driven by the desire to be accurate, there is evidence that suggests that
they often deviate from this pattern. Specifically organizational research on the justification of
executive pay (Porac, Wade, & Pollock, 1999) and on responses to identity threats (Elsbach &
Kramer, 1996) finds that decision makers often alter the boundaries of social comparison groups
in ways that help them project positive perceptions of their organizations. This work on
externally directed impression management tactics offers insights that can help advance current
understanding of how evaluations of organizational performance in relation to comparison
organizations may be conducted. First, this work suggests that shared cognitive categories such
as industry classifications generally provide the basis for making apples to apples comparisons,
but that there is still the need to know more about the frequency with which decision makers use
comparisons that relax the criterion of similarity. How often and when do decision makers
choose comparison organizations that deviate from the expected tendency to compare apples to
apples? How does the choice of dissimilar comparison organizations impact the decision making
process?

Organizational Social Comparison – Page 5
Second, research on externally directed impression management tactics suggests that we
can gain a more complete picture of how decision makers make choices of comparison
organizations by broadening consideration of the motives guiding their evaluations beyond self-
assessment. Decision maker’s choice of comparison organizations may also be influenced by
self-enhancement (the desire to see themselves in a positive light; e.g. Sedikides & Strube,
1997), self-improvement (the desire to improve oneself for the future; e.g., Sedikides & Strube,
1997), and self-verification (the desire to confirm pre-existing self-evaluations; e.g., Swann,
1981). Keeping in mind that the choice of comparison firms may reflect the combined effect of
various motives, here we take a step toward recognizing these complex effects by focusing on
the tension generated by the competing influences of the self-assessment and self-enhancement
motives. We think this is a useful starting point because the self-assessment motive is seen as
the predominant motive in the organizational literature on performance feedback (Greve, 2003)
and because the self-enhancement motive may cause important distortions in the performance
assessment process, hindering, for example, decision makers’ ability to recognize failure (Audia
& Brion, 2007). Both self-enhancement and self-assessment motives are likely to influence the
criteria by which comparison organizations are chosen. Whereas decision makers motivated by
self-assessment tend to view similarity as the key criterion to choose comparison organizations,
decision makers motivated by self-enhancement tend to view favorability as the key criterion to
choose comparison organizations. By inducing decision-makers to choose comparison
organizations that provide a more favorable comparison (i.e., choose worse performing
organizations), self-enhancement may inflate their perception of organizational performance.
In this study we are interested in examining real world dilemmas in which decision
makers charged with the task of selecting comparison organizations need to choose between

Organizational Social Comparison – Page 6
satisfying the self-assessment motive or the self-enhancement motive. Specifically, we address
the following questions: When the available options of social categories for performance
evaluations pit the desire to be accurate against the desire to self-enhance, how frequently do
decision makers make choices of comparison organizations that are based more on favorability
than on similarity? Are there conditions that increase the probability that options that satisfy the
desire to self-enhance will be chosen at the expense of options that satisfy the desire for self-
assessment? Does self-enhancement in the choice of comparison organizations affect low
performing decision makers’ perceptions of failure and propensity to continue using the current
strategy? Does the extent to which decision makers are in self-enhancing or self-assessing
mindsets influence such choices?
The few empirical studies that shed light on how decision makers use social categories in
response to threats or to justify organizational actions use field data (Porac et al., 1999; Elsbach
& Kramer, 1996; Still & Strang, 2009). Here we investigate the choice of comparison
organizations for the evaluation of organizational performance in an experimental setting. There
are three primary reasons that make the choice of an experimental design desirable. First, this
design allows us to present decision makers with options that pit favorability against similarity as
the key criterion for the choice of comparison organizations, thereby making it possible to detect
the influence of these motives in the process of comparison. Second, compared to field data,
experimental data allows more direct observation of the actual choices of comparison
organizations made to conduct evaluations of performance. Letters to shareholders and other
public documents provide a useful source of field data, but it is unclear whether they are
representative of how managerial evaluations of performance that prompt behavioral responses
are made. For instance, research suggests that decision makers use different sets of comparable

Organizational Social Comparison – Page 7
organizations for different purposes (Bizjak, Lemmon, & Naveen, 2008), a finding that is
confirmed in the broader literature on social comparisons (e.g., Wheeler & Miyake, 1992). Third,
an experimental design controls for the availability of information about comparison
organizations, a condition likely to influence the choice of comparisons (Marsden & Friedkin,
1993). By holding information availability constant, we can make stronger inferences regarding
the impact of the self-assessment and self-enhancement motives on the choice of comparison
organizations, the primary focus of our investigation.
Social comparison and the evaluation of organizational performance
A cornerstone of organizational research on performance feedback is that performance
information alone is not sufficient to establish whether a given performance level can be
classified a success or a failure (Cyert & March, 1963; Greve, 2003). Performance feedback
theory holds that performance needs to be compared to an aspiration level. When the
performance meets or exceeds the aspiration level it will be perceived as a success. Failure is
inferred from performance levels that fall below an aspiration level. Whether decision makers
classify organizational performance as success or failure then affects a broad range of
organizational behaviors, including change, risky actions, and search (e.g., Greve, 1998).
Given that perceptions of success and failure influence organizational behaviors and
given that aspirations are critical to classifying performance into these two categories of
outcomes, how decision makers form aspirations is a central component of performance
feedback theory. According to the theory the two types of aspiration levels most frequently used
are historical aspiration levels and social aspiration levels. Historical aspiration levels are
formed using information about past performance whereas social aspiration levels are formed
using information about comparison organizations. The theory suggests that decision makers

Organizational Social Comparison – Page 8
may use both types of aspiration levels to evaluate performance, assigning varying weights to
each type depending on conditions that affect their informative value (Cyert & March, 1963;
Levinthal & March, 1981). Social aspiration levels are seen as more informative when the
organization has undergone important changes or when the environment in which it operates has
undergone important changes (Greve, 2003). Under high levels of organizational and
environmental changes, historical aspirations are less useful as the basis for evaluating the future
performance. When an organization changes in important ways the resource base reflected in the
past performance may be dramatically different. Therefore past performance becomes a weaker
indicator of an organization’s performance possibilities. Likewise, when the environment
changes, the capabilities that drove past performance may no longer be relevant.
Because change is a ubiquitous feature in many organizational settings and in many
industries, social aspiration levels are often more informative for organizations, especially for
larger and older firms (Short & Palmer, 2003). The greater informative value that social
aspiration levels have compared to historical aspiration levels, however, comes at the cost of
greater complexity involved in forming social aspirations. While the information necessary to
form historical aspiration levels is easily available because it can be found inside the
organization, the information necessary to form social aspiration levels is often difficult to
acquire because other organizations keep valuable information regarding their internal operations
and market performance confidential. Even when information about other organizations is
available, forming social aspiration levels requires tackling the preliminary step of determining
the boundaries of the social comparison group, that is, determining which organizations decision
makers should select as comparisons to determine organizational performance.
Organizational Social Comparison – Page 9
Despite the fact that the way in which the boundaries of social comparison groups are
drawn can greatly affect the evaluations of organizational performance, very little research
examines how decision makers select comparison organizations to evaluate their performance.
Greve (2003) in his in-depth review of the literature on performance aspirations suggests that the
primary motive that guides the choice of comparison organizations is self-assessment. The
theoretical rationale for self-assessment is generally traced to Festinger’s (1954) social
comparison theory. According to Festinger, peoples’ choices of comparison others are guided by
the desire to either accurately assess their abilities, or accurately assess whether their opinions
are correct. This self-assessment motive is dominant, he suggests, because “the holding of
incorrect opinions and/or inaccurate appraisals of one’s abilities can be punishing or even fatal in
many situations” (Festinger, 1954, p. 117). People generally satisfy this self-assessment motive
by gathering objective information. However, when such information is not available or is
insufficient to evaluate ability levels people compare themselves with similar others. Festinger
uses the example of a runner who can count how many seconds it takes her to run a certain
distance, but who ultimately requires information about the performance of others to determine
whether she is a fast or slow runner.
According to Festinger, people prefer to compare themselves to similar others because
similar others are the most diagnostic sources of information. Using the runner’s example, a
twenty year-old runner would learn more about her running abilities if she compared herself to
runners in their twenties than if she compared herself to runners in their fifties. Focusing on
similar others allows the evaluator to take into account influences common to all people included
in the comparison group. For the runner seeking to evaluate her ability, age is a major factor
impacting performance that is likely to confound the assessment of ability.

Organizational Social Comparison – Page 10
Empirical evidence indicates that individuals in organizations commonly use similar
others as comparisons to evaluate their pay, job, complexity, and workplace status (e.g., Adams,
1965; Oldham, Kulik, Ambrose, Stepina, & Brand, 1986; for a review see: Goodman & Haisley,
2007). Less studied is how decision makers choose comparison organizations to evaluate the
performance of their organization. Researchers examining the impact of performance on change,
risky investments, and innovative efforts typically assume that managers form social aspiration
levels by focusing on the average performance of organizations in the industry under study
(Audia et al., 2000; Desai, 2008; Greve, 1998; Haleblian et al., 2006; Westphal & Bednar, 2005).
This assumption is consistent with Festinger’s social comparison theory because the use of
organizations in the same industry is believed to offer the most similar comparison organizations
on which to base social aspiration levels.
However, the assumption that organizational actors use industry classifications as the
basis for determining social aspiration levels remains largely untested. The best available
evidence documenting whether decision makers base the choice of comparison organizations on
familiar industry categories comes from research on externally directed accounts of
organizational behaviors, especially those advanced to justify top executives’ compensation.
These accounts do not focus on the evaluation of firm performance, but rather on where the pay
of a firm’s top executive stands in relation to the pay of top executives in other organizations.
Porac, et al., (1999) investigated proxy statements which, in compliance with SEC reporting
regulations, must outline the criteria used by the board of directors to set CEO compensation
including explicit performance comparisons to organizations selected on the basis of “line-of-
business” similarities. Although organizations had latitude in the choices they made and there
was considerable variation in the care taken to report on these issues, these researchers found that
Organizational Social Comparison – Page 11
similarity was the dominant criterion used to choose comparison organizations. Sixty-nine
percent of a company’s chosen comparison organizations belonged to that company’s 2-digit SIC
industry. Further, forty-one percent of the organizations chose all of the comparison
organizations from within the same industry and eleven percent chose all but one comparison
firm from within the same industry. Similarly, Bizjak, Lemmon, and Nguyen (2008) found a
strikingly consistent pattern in a more recent analysis of proxy statements. In their study sixty-
two percent of the comparison organizations chosen to justify executives’ compensation came
from the same industry as the reporting company.
Although these findings clearly point to the importance of similarity as a criterion
guiding the choices of comparison organizations that boards of directors make to justify
executive compensation, they are insufficient to establish whether self-assessment is the primary
motive guiding the choice of comparison organizations for the evaluation of organizational
performance. Indeed, much research suggests that decision-makers are driven by multiple
motives (Sedikides & Strube 1997), including not only self-assessment, but self-enhancement as
well. Social psychologists have long regarded self-enhancement - people’s desire to see
themselves in a positive light – as a fundamental drive influencing thoughts and behaviors
(Allport, 1937; Fiske, 2004), especially in Western cultures (Heine, et al., 1999). Taylor and
Brown’s (1988) theory of positive illusions supports the self-enhancing nature of self-perception,
arguing that people have a disproportionate interest in and recall of positive self-relevant
information, are more likely to take credit for good outcomes than failures (Miller & Ross,
1975), tend to see themselves more positively than others see them (Kruger & Dunning, 1999),
and tend to perceive themselves as better than peers on a number of qualities (Alicke, 1985).
Organizational Social Comparison – Page 12
The most sustained line of research pointing to self-enhancing comparisons focuses on
the contrast between downward and upward comparisons (Bandura & Jourdan, 1991; Gibbons et
al., 2002; Taylor & Lobel, 1989; Wills, 1981). In the dominant “rank-order paradigm” (Wheeler,
1966) used in most social comparison studies equally similar people are ranked along a given
dimension and then the choices of comparison others on the basis of rank are examined
(for a review see: Suls & Wheeler, 2000). This literature shows that people often use self-
enhancing strategies in social comparison by picking comparisons people who are worse off
rather than people who are better off, and that these downward social comparisons enhance
subjective well-being (Wills, 1981) and are used especially when self-enhancement is salient
(Collins, 1996). However, studies in which participants are given the option of choosing among
comparison others that vary both in terms of favorability (i.e. downward and upward targets) and
similarity are rare. Recent work examines the impact of social comparison information that
varies in terms of favorability and similarity on self-evaluations (Stapel & Johnson, 2007; Stapel
& Schwinghammer, 2004). But in these studies participants do not choose comparison others.
They are randomly assigned different kinds of social comparison information.
Some evidence regarding choices in which decision makers trade similarity for
favorability comes from organizational research on externally directed accounts of executive
pay. As we noted above, Porac et al. (1999) found that most organizations justified executive
compensation by choosing comparisons organizations in the same industry, but they also found
that a considerable number of organizations included in an organization’s set of peers – thirty-
one percent - were from other industries. Moreover, these less similar peers were not randomly
selected; rather they appeared to have performance that was lower than the performance of the
focal firm – a feature that offered a more favorable comparison for the focal firm. A similar

Organizational Social Comparison – Page 13
pattern of trading similarity for favorability was reported by Bizjak et al. (2008) who found that
the less similar organizations chosen as comparisons had higher executive compensation than the
most similar organizations chosen as comparisons, a feature that in addition to allowing
justifying the focal firm’s executive compensation also laid the foundation for subsequent
compensation increases.
If decision makers are affected not only by the self-assessment motive, as the theory of
performance feedback generally assumes, but also by the self-enhancement motive, then an
important question is “when is the influence of the self-enhancement motive more pronounced”?
Psychological research suggests and finds that the self-enhancement motive is more common
when people’s positive self-views are put in jeopardy, and performance failure is a particular
instance of self-threat that has been found to increase individuals’ propensity to make efforts to
elevate their self-image (Aspinwall & Taylor, 1993; Greenberg & Pyszczynski, 1985; Wills,
1981; Wood et al., 1985). This suggests that a pattern of opting for favorability at the expense of
similarity in the choice of comparison firms may be more pronounced under conditions of threat
to the image of the organization and its decision makers. This literature then implies that
declining levels of organizational performance – current performance that falls below past levels
of performance - may constitute a threat to which decision makers respond by increasing their
propensity to choose less similar but more favorable comparisons as opposed to more similar but
less favorable comparisons. Porac et al. (1999) found some evidence consistent with this
prediction. In their study, a firm’s low stock returns increased the probability of including peers
from outside the industry though they did not find the same effect for accounting returns.
We can now formulate four predictions regarding the tension between the self-assessment
and self-enhancement motives in the choice of comparison organizations used to evaluate

Organizational Social Comparison – Page 14
organizational performance. Drawing from the performance feedback literature and the
psychological research on social comparisons, we begin by predicting that when the available
options of social categories for performance evaluations pit the self-assessment motive against
the self-enhancement motive, the self-assessment motive will generally prevail, leading decision
makers to choose comparison organizations on the basis of similarity rather than on the basis of
favorability.
Hypothesis 1: Confronted with the choice of more similar and better performing
organizations and less similar and worse performing organizations, decision makers
generally choose to evaluate their organizational performance in relation to the
performance of the more similar and better performing organizations.
Although the self-assessment motive may generally prevail over the self-enhancement
motive in guiding the choice of comparison organizations, the self-enhancement literature
suggests that, given that low performance is generally threatening, the self-enhancement motive
is stronger when performance is low than when performance is high. In other words, decision
makers respond to low performance and the resulting threat to their self-image by elevating their
tendency to choose comparison organizations on the basis of favorability rather than similarity.
Hypothesis 2: Confronted with the choice of more similar and better performing
organizations and less similar and worse performing organizations, decision makers
facing low performance are more likely to evaluate their organizational performance
focusing on the less similar and worse performing organizations than decision makers
facing high performance.
Variations in the extent to which decision makers rely on similarity as the criterion
guiding the choice of comparison organizations may have important ramifications in the decision

Organizational Social Comparison – Page 15
making process. Decision makers experiencing the same level of low performance should vary
in their overall evaluation of performance and propensity to change the current strategy as a
function of the comparison organizations they have chosen. Decision makers focusing on
comparison organizations that are more similar and better performing should form less favorable
evaluations of performance than decision makers who relax the criterion of similarity to select
more favorable comparisons. The theory also holds that perceptions of failure spur change
(Cyert & March, 1963; Greve, 2003). Therefore another likely consequence of variations in the
choice of comparison organizations when performance is low is that decision makers who
choose comparison organizations that are more similar and better performing may recognize the
need to change the current strategy to a greater extent than those who relax the criterion of
similarity to select more favorable comparisons.
Hypothesis 3: Low performing decision makers who evaluate their organizational
performance focusing on the more similar and better performing organizations compared
to low performing decision makers focusing on less similar and more favorable
comparison options are more likely (1) to evaluate organizational performance as poor
and (2) to recognize the need to change the current strategy.
Through Hypotheses 1 and 2 we seek to infer self-enhancement and self-assessment from
whether individuals choose comparison organizations on the basis of similarity or favorability
and from whether people’s choices of comparison organizations are affected by low
performance. However, the hypothesized relationships may also stem from the influence of
other motives. One could argue, for example, that, because most people have positive self-views
(Diener & Diener, 1995), the desire to verify a positive self-image may account for a tendency to
choose comparable organizations that are dissimilar and worse performing (Kwan, John, Robins,

Organizational Social Comparison – Page 16
& Kuang, 2008; Kwang & Swann, 2010), To conduct an additional test of the extent to which
self-assessment and self-enhancement influence the choice of comparison organizations, we
manipulate participants’ mindsets regarding the importance of these motives. Past research
using priming techniques has shown that when a goal or construct is activated, associated
perceptual and behavioral tendencies are also activated (e.g., Brewer & Gardner, 1996; Kuhnen
& Oyserman, 2002), and this has been shown to be true for manipulations of self-enhancement
and self-assessment (Wilson & Ross, 2000). Participants in a self-enhancement mindset
condition can be primed to think that there are benefits in maintaining a positive self-image and
that selecting information that describes them in the most positive light is an important way to
achieve this goal. Analogously, participants in a self-assessment mindset condition can be
primed to think that there are benefits in evaluating themselves as accurately as possible and that
selecting information that is most relevant for making a precise assessment of themselves is an
important way to achieve this goal. Following research that has shown that these motives can be
primed experimentally, we expect that compared to participants given a self-assessment prime
participants given a self-enhancement prime are more likely to select comparison organizations
on the basis of favorability than on the basis of similarity.
Hypothesis 4: Confronted with the choice of more similar and better performing
organizations and less similar and worse performing organizations, decision makers
primed for a self-enhancement mindset are more likely to evaluate their organizational
performance focusing on the less similar and worse performing organizations than
decision makers primed for a self-assessment mindset.
We test these hypotheses in two studies. The first study tests hypotheses 1, 2, and 3,
examining the extent to which self-assessment and self-enhancing motives impact the choice of

Organizational Social Comparison – Page 17
comparison firms in a decision-making scenario and the consequences of these choices on the
evaluation of performance and the perceived need to make changes. The second study tests
hypothesis 4, examining the extent to which manipulated self-enhancement and self-assessment
mindsets impact the choice of comparison firms.
Study 1
METHOD
Participants
Participants were eighty-nine undergraduate students attending a West Coast university
who participated in the study in partial fulfillment of course credit.
Procedure
All materials were presented using a web-based script on Windows-based computers.
Participants were seated at semi-private workstations. Acting as the Chief Executive Officer
(CEO) of a firm, participants were told that they would be asked to make a number of strategy
decisions based on the information provided to them and that it is therefore essential that they
formed a complete assessment of the firm’s performance.
Participants were given background information on a fictional firm, Allied Waste
Industries, which included a summary of the firm’s founding and other miscellaneous
background information intended to add realism to the case. Upon reading the background
information, participants were provided with information about the firm’s growth strategy. The
firm was described as having implemented a rapid growth strategy that led to the acquisition of a
number of organizations, more than tripling its customer base. Participants were then informed

Organizational Social Comparison – Page 18
that this strategy had either led to positive or negative outcomes for the firm, depending on
condition.
In the ‘high performance’ condition, participants were informed that: (1) revenues had
increased from 5362.00 (in millions) in 1997 to 5734.80 in 2005, a 6.9% increase, (2) operating
income had increased from 886.4 in 1997 to 915.5 in 2005, and (3) return on sales (i.e., operating
income divided by revenue) had increased from 12.2% in 1997 to 20.6% in 2005. In the ‘low
performance’ condition, participants were informed that (1) revenues had decreased from
5362.00 (in millions) in 1997 to 4989.20 in 2005, a 6.9% decrease, (2) operating income had
decreased from 886.4 in 1997 to 857.30 in 2005, and (3) return on sales (i.e., operating income
divided by revenue) had decreased from 12.2% in 1997 to 3.8% in 2005.
Following the manipulation of performance, participants were informed that while
historical performance information provides important details on a firm’s performance, “to
accurately assess the performance of the organization, it is also important to consider the
performance of Allied Waste in relation to the performance of organizations that operate in the
same environment. Historical performance is often affected by external circumstances that are
not specific to a particular firm. Having a grasp on the performance of one’s competitors is
essential to making informed strategic decisions.”
Participants were given the opportunity to review basic information about four groups of
organizations that were competitors of Allied Waste. They were told that they would first review
information on all four groups, and then would be asked to select one of these groups to use as a
comparison to Allied Waste. The four groups of organizations varied along two dimensions:
similarity and favorability. Drawing on the approach used by Porac et al. (1999) to discern the
degree of similarity of comparison firms, we use standard industry classification (SIC) codes to

Organizational Social Comparison – Page 19
establish an objective measure of similarity. Participants were told that Allied Wastes is a solid
wastes company and that,
“According to the Standard Industry Classification (SIC) system, Allied Waste is part of
the “Electric, Gas, And Sanitary Services” group (SIC code: 49). The SIC system also
classifies firms within more specific categories, adding an additional number to the SIC
code with each specification. Allied Waste is part of the 3-digit SIC group, “Sanitary
Services” (SIC code: 495) and, more specifically, the 4-digit SIC group, “Solid Wastes
Services & Recycling” group (SIC code: 4953).”
Participants were then asked to assess four groups of comparison firm presented to them
in random order. The most similar group had a SIC code of 4953, ‘Solid Wastes Services &
Recycling’ (within Allied Waste’s four digit SIC code). The least similar group had a SIC code
of 4, “Transportation, Communications, Electric, Gas, And Sanitary Services”. The other two
SIC codes were
495, ‘Sanitary Services’, and 49, ‘Electric, Gas, And Sanitary Services.’
For each group, participants were given the SIC code, as well as qualitative information
about the SIC grouping. In the most similar group, SIC 4953, participants were told that, “This
group includes companies primarily engaged in the collection and disposal of refuse by
processing or destruction or in the operation of incinerators, waste treatment plants, landfills, or
other sites for disposal of such materials. Establishments primarily engaged in collecting and
transporting refuse without such disposal are classified in Transportation, Industry 4212”. In the
least similar group, SIC 4, participants were told that, “this group includes companies providing,
to the general public or to other business enterprises, passenger and freight transportation,

Organizational Social Comparison – Page 20
communications services, or electricity, gas, steam, water or sanitary services, and all
establishments of the United States Postal Service.”
The groups of organizations also varied in their performance in comparison to Allied
waste. The performance of companies in SIC 4953 was described as having an average ROS
between 1997 and 2005 that was 40% higher than Allied Waste – the least favorable comparison.
The performance of companies in SIC 495 was described as 20% higher. The performance of
companies in SIC 49 was described as 20% lower. Finally, the performance of companies in SIC
4 was described as 40% lower than Allied Waste – the most favorable comparison. After
viewing information on each of the four groups, participants were asked a number of questions
related to Allied Waste’s performance and strategy. These included: ranking the four groups in
order of appropriateness as a target of comparison with Allied Waste (1= Most appropriate, 4=
Least appropriate); assessing the performance of Allied Waste on a 7-point scale (1=Very Poor,
7=Very Good); and, evaluating whether they would be likely to continue on the same strategy
(1=Unlikely, 7=Likely).
RESULTS
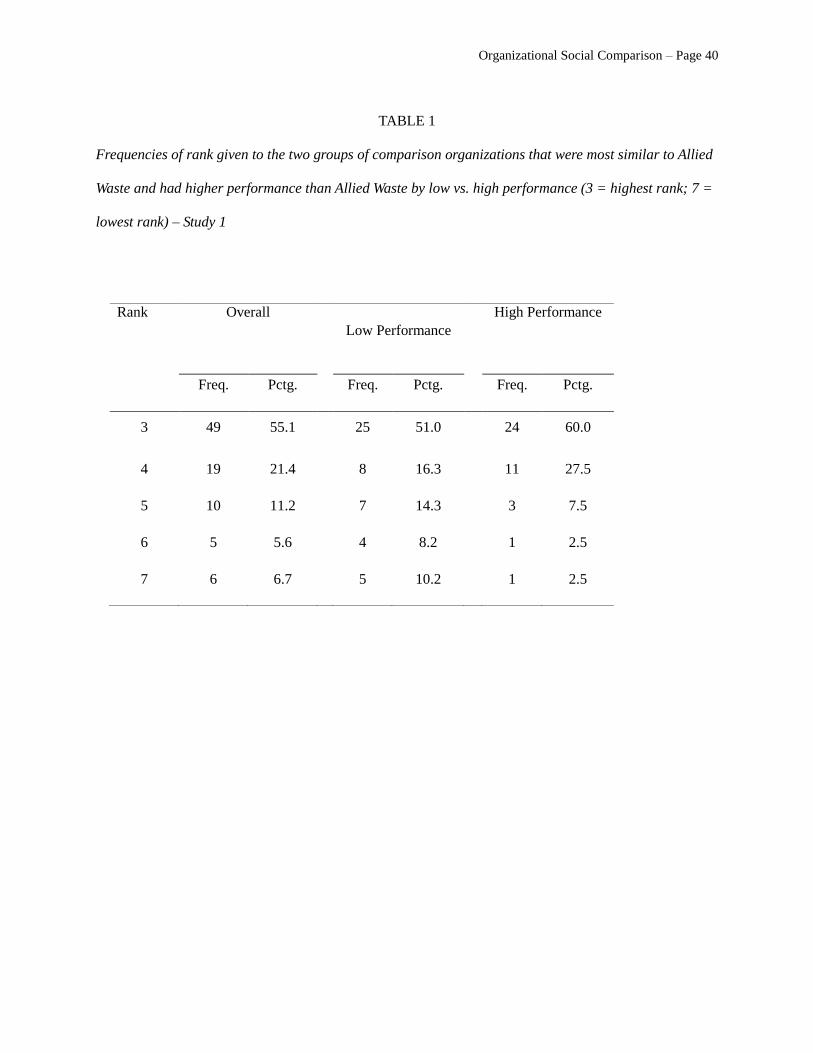
Table 1 reports the frequencies of the rank given to the two groups of organizations that
were most similar to Allied Waste and had higher performance than Allied Waste. A rank of 3
means that participants ranked the two groups that were most similar and had higher
performance than Allied Waste as the most appropriate target for comparison, whereas a rank of
7 indicates that participants ranked the groups that were least similar to Allied Waste and had
lower performance than Allied Waste as the most appropriate target for comparison. The mean
of the rank variable was 3.87 (SD = 1.22) and it was significantly different from an hypothesized
mean of 5 that would be obtained if the available ranking options received equal frequencies, t =

Organizational Social Comparison – Page 21
-8.73, p < .01. Giving the highest rank to the two most similar but least favorable groups was the
most frequent choice of comparison with a fifty-five percent frequency. Giving the highest rank
to the two most dissimilar but most favorable groups had a considerably smaller frequency with
a 6.74 percent frequency. Thus, the choices of comparison organizations made by participants in
our sample were generally guided by the self-assessment motive, as predicted in Hypothesis 1.
---------------------------------------------
Insert Table 1 about here
---------------------------------------------
To test Hypothesis 2 we turned our attention to the impact of performance on the choice
of comparison organizations. First, to confirm whether participants correctly encoded the
performance manipulation we examined how they evaluated the overall performance of Allied
Waste. As expected, participants in the low performance condition rated the overall performance
lower than participants in the high performance condition, Plow = 3.69 vs. Phigh = 5, t = -6.45, p <
.01. Next we conducted a one-way (performance condition: low performance versus high
performance) analysis of variance including as covariates the order in which the four available
options of comparison organizations were shown to participants and whether participants were
native English speakers (fifty-three were native English speakers and thirty-six were non-native
English speakers). Participants in the low performance condition gave lower rankings to the
most similar and least favorable groups of comparison organizations than participants in the high
performance condition, Plow = 4.10 vs. Phigh = 3.69, F (1,88) = 4.80, p < .01, lending support to
Hypothesis 2. The two covariates were not significant.

Organizational Social Comparison – Page 22
In addition to the total rank given to the two most similar groups reported above, another
way to discern the impact of low performance on the choice of comparison is to focus on the
cases in which participants evaluated as most appropriate for comparison the two least similar
but most favorable groups of organizations. These are the cases in which the most similar but
least favorable group of organizations received a total rank of 7, as reported in Table 1. Only 2.5
% of the participants in the high performance condition gave the highest rank of appropriateness
to the least similar but most favorable groups of organizations. But when performance was low
this frequency was four times larger as 10.20 % of participants selected as most appropriate
target for comparison the least similar most favorable groups. So the impact of low performance
is quite considerable given that participants internalized performance simply by assuming the
role of the Chief Executive Officer of a fictional company. We would expect stronger effects of
low performance in real organizations where the threat to the self-image brought by low
performance is likely to be more salient and more consequential.
To test Hypothesis 3 we examined the impact of the choice of comparison groups on
participants’ ratings of overall performance and their propensity to continue the current strategy.
The evaluations made by low performing decision makers who gave the highest rank to the two
most similar but better performing groups of comparison organizations (total rank = 3; N = 25)
were compared to the low performing decision makers who gave lower ranks to the most similar
and better performing groups of comparison organizations (rank > 3; N = 24). Decision makers
who assigned the highest rank to the most similar comparison organizations evaluated overall
performance significantly lower, Prank=3 = 3.4 vs. Prank>3 = 4.0, t (1,47) = 2.46, p < .01, and were
significantly less likely to continue with the same strategy, Crank=3 = 2.72 vs. Rrank>3 = 3.38, t
(1,47) = 1.84, p < .05, than decision makers who gave lower ranks to the most similar

Organizational Social Comparison – Page 23
comparison organizations. We report one-tailed significance levels because these were
directional predictions.
Together the findings from Study I support our first three predictions: Participants’
rankings of comparison generally followed a self-assessment motive (Hypothesis 1), but their
rankings were impacted by the performance of their organization, such that participants who
represented low performing organizations were more likely to view as appropriate target for
comparison less similar but lower performing organizations, thereby following a self-
enhancement motive (Hypothesis 2). Furthermore, self-enhancing choices of comparison
organizations under conditions of low performance impacted the decision making process by
inhibiting perceptions of failure and the propensity to change the current strategy (Hypothesis 3).
Study 2
METHOD
Participants
Participants were seventy-six undergraduate students attending a West Coast university
who participated in the study in partial fulfillment of course credit.
Procedure
The procedure was virtually identical to that of Study 1, with the addition of a
manipulation of self-enhancing or self-assessing mindsets that preceded the Allied Waste Case.
This resulted in a 2 (Performance: Low v High) x 2 (Mindset: Self-enhancement v Self-
assessment) between subjects design.
In the experimental session, participants were informed that they would be completing
two unrelated exercises: a brief questionnaire about their beliefs, which contained the

Organizational Social Comparison – Page 24
manipulation of mindset, and a decision-making exercise. The prime, adapted from Wilson and
Ross (2000), manipulated whether participants were in a self-enhancing or self-assessing
mindset. In the self-enhancing condition, participants were told,
“Depending on our goals and situations, we may describe ourselves in different ways.
Sometimes we want to describe ourselves in a way that makes us feel particularly good
about ourselves. We select the information that makes us feel best and describe ourselves
in the most positive light. The ability to sometimes describe ourselves in this positive
way may be important for maintaining a positive self-image and good mental health.
Please describe yourself in a way that makes you feel particularly good about yourself on
the following attributes. Please only report truthful information, but you may selectively
present whatever kinds of information that best accomplishes this goal.”
In the self-assessing condition, participants were told,
“Depending on our goals and situations, we may describe ourselves in different ways.
Sometimes we want to evaluate ourselves as accurately as possible. We select the
information that we feel is most useful and relevant for making a precise assessment of
ourselves. The ability to sometimes describe ourselves in this evaluative way may be
important for correctly understanding our abilities and guiding our approach to many
tasks. Please describe yourself in a way that provides the most accurate assessment of
yourself on the following attributes. Please only report truthful information, but you may
selectively present whatever kinds of information that best accomplishes this goal.”
In both conditions, participants described themselves on the following four attributes:
social skills, self-confidence, analytical abilities, and business acumen.

Organizational Social Comparison – Page 25
To account for possible mood effects from the manipulation (cf., Wheeler and Miyake
1992), following the prime, participants completed the positive and negative affect scale
(PANAS) (Watson, Clark, & Tellegen, 1988). Participants were instructed to indicate their
feelings “at the present moment”. The remainder of the experiment follows the procedures of
Study 1.
RESULTS
Table 2 reports the frequencies of the ranks given to the four available options of
comparison organizations. As in study 1, with sixty percent, the most frequent choice of
comparison organizations was giving the highest ranks to the two groups that were most similar
to Allied Waste and had better performance than Allied Waste. In contrast, with nearly seven
percent, the choice of giving the highest ranks to the two groups that were least similar to Allied
Waste and had lower performance than Allied Waste was relatively rare. The mean of the total
rank variable was 3.78 (SD = 1.21).
---------------------------------------------
Insert Table 2 about here
---------------------------------------------
A 2 (performance condition: low vs. high) X 2 (mindset: self-assessment vs. self-
enhancement) analysis of variance revealed a significant main effect for motive condition, F (1,
75) = 4.41, p < .05, and a marginal effect for performance condition, F (1,75) = 3.03, p = .08,
whereas the interaction between performance condition and motive condition was not significant.
We also included as covariates the order in which the four groups were displayed to participants
and participants’ number of years in which they lived in the U.S. as a proxy for their fluency in
the English language (mean = 16.72, std. dev. = 6.59) but neither covariates were significant. As
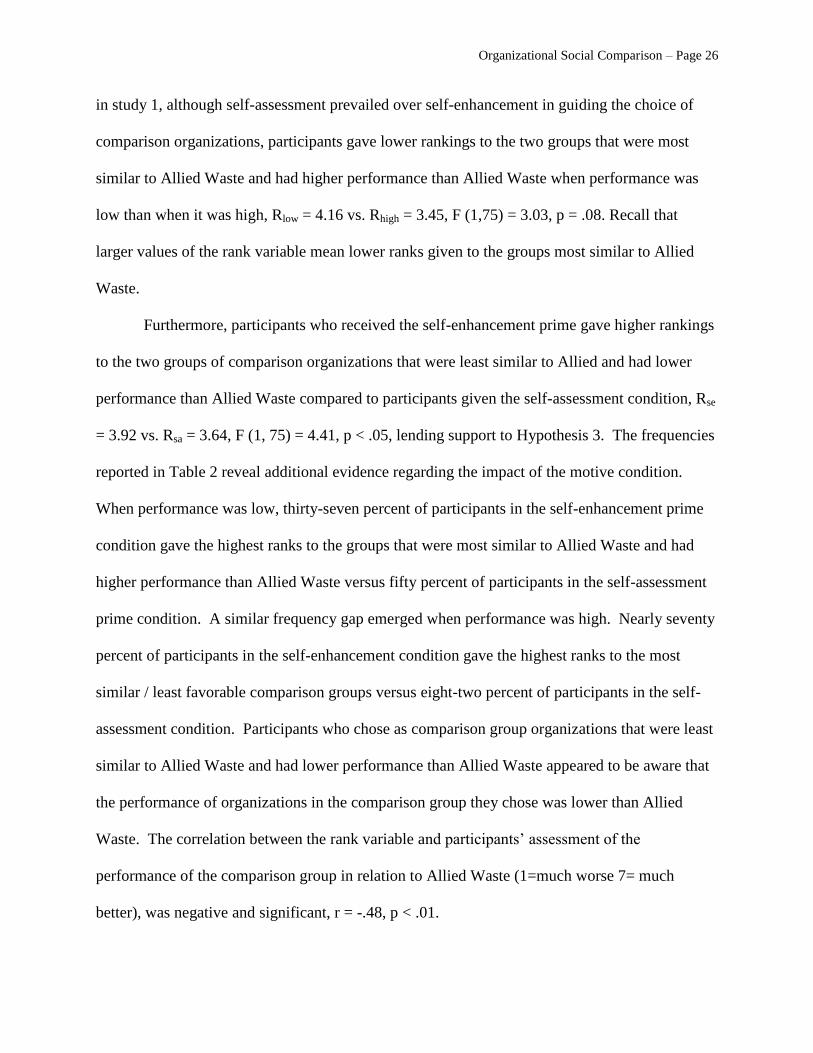
Organizational Social Comparison – Page 26
in study 1, although self-assessment prevailed over self-enhancement in guiding the choice of
comparison organizations, participants gave lower rankings to the two groups that were most
similar to Allied Waste and had higher performance than Allied Waste when performance was
low than when it was high, Rlow = 4.16 vs. Rhigh = 3.45, F (1,75) = 3.03, p = .08. Recall that
larger values of the rank variable mean lower ranks given to the groups most similar to Allied
Waste.
Furthermore, participants who received the self-enhancement prime gave higher rankings
to the two groups of comparison organizations that were least similar to Allied and had lower
performance than Allied Waste compared to participants given the self-assessment condition, Rse
= 3.92 vs. Rsa = 3.64, F (1, 75) = 4.41, p < .05, lending support to Hypothesis 3. The frequencies
reported in Table 2 reveal additional evidence regarding the impact of the motive condition.
When performance was low, thirty-seven percent of participants in the self-enhancement prime
condition gave the highest ranks to the groups that were most similar to Allied Waste and had
higher performance than Allied Waste versus fifty percent of participants in the self-assessment
prime condition. A similar frequency gap emerged when performance was high. Nearly seventy
percent of participants in the self-enhancement condition gave the highest ranks to the most
similar / least favorable comparison groups versus eight-two percent of participants in the self-
assessment condition. Participants who chose as comparison group organizations that were least
similar to Allied Waste and had lower performance than Allied Waste appeared to be aware that
the performance of organizations in the comparison group they chose was lower than Allied
Waste. The correlation between the rank variable and participants’ assessment of the
performance of the comparison group in relation to Allied Waste (1=much worse 7= much
better), was negative and significant, r = -.48, p < .01.

Organizational Social Comparison – Page 27
Comparing the frequencies in study 2 to the frequencies reported in study 1, it appears
that participants in the self-assessment condition did not act much differently than participants
who received no motive manipulation in study 1. This may be because a self-assessment mindset
is, as assumed in the theory of performance feedback, the default condition with which
participants approach the evaluation of comparison organizations. Self-assessing mind set
manipulations may therefore be redundant in such settings. The self-enhancement prime,
however, altered participants’ choice of comparison organizations in significant ways. These
effects of the motive manipulations do not appear to stem from variations in participants’ mood
inadvertently induced in the lab. Neither positive affect (PAsa = 2.74; PAse = 2.90; t = -.96, ns)
nor negative affect (NAsa = 1.48; NAse = 1.56; t = -.53, ns) displayed significant differences
across motive conditions.
By employing a mindset priming task in which participants were put in either a self-
assessment or self-enhancement mindset, Study 2 provides additional evidence that the self-
enhancement motive competes with the self-assessment motive in guiding the choice of
comparison organizations. These results suggests that both low performance as well as
situational cues that influence decision makers’ motives may lead to self-enhancing mindsets that
bias decision-makers’ choices of comparison firms.
DISCUSSION
Subjective evaluations of whether an organization is performing well or poorly often
require making comparisons among organizations. Although these subjective evaluations are a
critical component of organizational research on performance feedback, studies that examine
which firms are chosen for these comparisons are surprisingly rare. In this paper we addressed
this gap by examining how these choices are made. Specifically, we examined in two

Organizational Social Comparison – Page 28
experimental studies the extent to which these choices were guided by self-assessment and self-
enhancement - two motives that have been identified as having important influences in the social
comparison process. We found that the self-assessment motive generally prevailed over the self-
enhancement motive, guiding decision-makers to choose firms that were most similar to their
organization, even when those firms were performing better. However, low performance
strengthened the impact of self-enhancement in the choice of comparison firms as it increased
the tendency to select comparison firms that were less similar but worse performing.
Importantly, this greater propensity to self-enhance under conditions of low performance
impacted decision makers’ response to low performance, dampening perceptions of failure and
the propensity to change the current strategy. We also found additional evidence linking the self-
enhancement motive to the choice of comparison firms as participants were more likely to
choose comparison firms that were less similar and more favorable when they were primed to
think that there are benefits in maintaining a positive self-image than when they were primed
think that there are benefits in evaluating themselves as accurately as possible.
These results suggest that an understanding of how comparison firms are chosen benefits
from simultaneously considering the self-assessment and the self-enhancement motives. The
results support the assumption guiding much empirical research on performance feedback that
self-assessment is the primary motive guiding people’s evaluations. At the same time, however,
the results highlight the need to consider contingencies that can alter this motivational orientation
and activate the self-enhancement motive. Low performance is an important contingency
because it activates self-enhancement and because a key prediction of performance feedback
theory is that it increases the propensity to make changes (e.g., Greve, 2003). When performance
is low organizational members’ greater reliance on favorability than on similarity when selecting

Organizational Social Comparison – Page 29
comparison organizations may induce them to form rosier evaluations of low performance than it
is often assumed. Consequently, as our findings suggest, decision makers engaging in these
subjective and self-enhancing choices of comparison organizations may not respond to declining
performance by initiating change or, at least, they may not exhibit the sense of urgency that
outside observers would expect. This does not contradict the theory of performance feedback
because the theory recognizes that subjective evaluations of performance motivate behavioral
change, but it casts in a different light the results of studies that infer subjective evaluations of
performance from objective indicators. Decision-makers’ reluctance to initiate change when low
performance signals that change is necessary may reflect a failure to perceive low performance,
as decision-makers choose self-enhancing comparisons to other organizations.
Much work remains to be done to incorporate in the theory the recognition that
boundedly rational decision makers are motivated not only by self-assessment or accuracy
motives, as is often assumed, but also by other motives. We think that the self-enhancement
literature provides additional opportunities to advance the understanding of the way in which
decision-makers evaluate performance. For example, whereas performance feedback research
tends to assume that individuals evaluate performance primarily by making comparisons with
real outcomes, whether in the form of historical aspiration levels or in the form of social
aspiration levels (for a notable exception see: March, Sproull, & Tamuz, 1991), research on self-
enhancement points to the possibility that decision makers in dire need of favorable comparisons
may conjure up hypothetical outcomes. Specifically, experimental studies suggest that the desire
to self-enhance may prompt the generation of downward counterfactuals (White & Lehman,
2005), catastrophic outcomes that would have happened had individuals taken different actions.
From the perspective of individuals motivated by the desire to see themselves in a positive light,

Organizational Social Comparison – Page 30
these are desirable comparisons; objectively low levels of performance can be perceived as less
negative when they are compared to worse imagined outcomes. Future studies could further
integrate the organizational literature on performance feedback and the literature on self-
enhancement by examining whether and when organizational members invoke these downward
counterfactuals for the evaluation of performance.
While the literature on self-enhancement offers fruitful opportunities to enrich the theory
of performance feedback, self-enhancement is not the only self-evaluative motive worthy of
additional attention. Self-improvement and self-verification are examples of other motives likely
to influence the choice of comparison organizations. For example, the scenario we used in our
studies could be adapted to examine whether and when decision makers make choices of
comparison organizations that reflect self-improvement. Participants could be presented with
options of comparison firms that are equally similar but vary in performance - average
performance, above average performance and below average performance. Choices of similar
organizations that are performing above average would be evidence of self-improvement. An
integrative question that could guide this kind of research on the interplay of self-assessment and
other motives in the choice of comparison organizations is under what conditions each of these
motives weakens self-assessment as the predominant influence in the social comparison process
and how.
We noted in the introduction that the literature on externally directed impression
management tactics suggests that decision makers are more opportunistic and adaptive in the
choice of comparison organizations than it is often assumed in the theory of performance
feedback. Our results show that opportunism in the choice of comparison firms is not confined
to externally directed accounts. Participants in our studies were not asked to report their

Organizational Social Comparison – Page 31
evaluations of comparison organizations to an audience, but they still showed a greater
propensity to choose comparison firms that were less similar and more favorable when their self-
image was threatened by low performance and when their desire to self-enhance was elevated by
the prime manipulation. Internally oriented motivations appear to have been sufficient to
generate the tension between the desire to be accurate and the desire to appear in a positive light.
The usual cautionary note regarding limits to the generalizability of our findings to real
organization applies here. For example, there are obvious demographic differences between our
participants and decision makers in real organizations that may influence the relationships we
studied. We should not discount, however, that there are also features of real organizations that
may strengthen our results. Self-enhancing tendencies hinge on the perception that evaluations of
the consequences of people’s actions impact their self-images. Participants in our studies
internalized the performance of a fictional organization by taking the role of Chief Executive
Officer in a decision making exercise. This link between evaluations and self-image is likely to
be considerably stronger for organizational decision makers and consequently the self-enhancing
tendencies that emerged in the lab should be considerably stronger in real organizations. In
addition to operating in settings where performance evaluation is often clearly linked to their
self-image, organizational decision makers are also exposed to accountability pressures that are
known to promote self-enhancement. In fact, a voluminous literature indicates that the self-
enhancement motive is activated when individuals have to explain, defend, or justify actions to
audiences whose evaluations can strongly affect their future (Tetlock, 1985; Lerner & Tetlock,
1999), and these accountability pressures are common inside organizations where superiors or
investors are often perceived as threatening audiences.
Organizational Social Comparison – Page 32
Recognizing that self-enhancing tendencies may be stronger in real organizations than in
the lab should provide additional impetus for extending the study of the choice of social
comparisons and its antecedents to field settings. Drawing on the literature on self-enhancement
a possible extension would be to study whether organizational features likely to promote self-
enhancement influence the social comparison process. Another interesting direction would be to
examine the impact of other sources of threat to managers’ self-image. Managers of public
companies, for example, are likely to be highly sensitive to how they are portrayed in the press
and press coverage is often independent from performance evaluation (Hayward, Rindova, &
Pollock, 2004; Desai, 2008). Recognizing that decision makers are subject to the competing
influences of self-assessment, self-enhancement, and other motives opens up new and exciting
avenues for organizational research on the choice of comparison organizations and the theory of
performance feedback more broadly.

Organizational Social Comparison – Page 33
REFERENCES
Adams, J. S. 1965. Inequity in social exchange. In L. Berkowitz, Ed., Advances in Experimental
Psychology, 267-300. New York: Academic Press.
Alicke, M. D. 1985. Global Self-Evaluation as Determined by the Desirability and
Controllability of Trait Adjectives. Journal of Personality and Social Psychology, 49:
1621-1630.
Allport, G.W. 1937. Personality: A psychological interpretation. New York: Holt, Rinehart, &
Winston.
Aspinwall, L. G., & Taylor, S. E. 1993. Effects of social-comparison direction, threat, and self-
esteem on affect, self-evaluation, and expected success. Journal of Personality and Social
Psychology, 64: 708-722.
Audia, P. G., & Brion, S. 2007. Reluctant to change: Self-enhancing responses to diverging
performance measures. Organizational Behavior & Human Decision Processes, 102:
255-269.
Audia, P.G., Locke, E.A., Smith, K.G. 2000. The paradox of success: An archival and
laboratory study of strategic persistence following radical environmental change.
Academy of Management Journal. 43: 837-854.
Bandura, A., & Jourden, F. J. 1991. Self-regulatory mechanisms governing the impact of social-
comparison on complex decision-making. Journal of Personality and Social Psychology,
60: 941-951.
Bizjak, J. M., Lemmon, M. L., & Naveen, L. 2008. Does the use of peer groups contribute to
higher pay and less efficient compensation? Journal of Financial Economics, 90: 152-
168.

Organizational Social Comparison – Page 34
Brewer, M. B., & Gardner, W. 1996. Who is this ''we''? Levels of collective identity and self
representations. Journal of Personality and Social Psychology, 71: 83-93.
Collins, R. L. 1996. For better or worse: The impact of upward social comparison on self-
evaluations. Psychological Bulletin, 119: 51-69.
Cyert, R. M., & March, J. G. 1963. A behavioral theory of the firm. New York: Prentice Hall.
Desai, V. M. 2008. Constrained growth: How experience, legitimacy, and age influence risk
taking in organizations. Organization Science, 19: 594-608.
Diener, E., & Diener, M. 1995. Cross-cultural correlates of life satisfaction and self-esteem.
Journal of Personality and Social Psychology, 68: 653-663.
Elsbach, K. D., & Kramer, R. M. 1996. Members' responses to organizational identity threats:
Encountering and countering the Business Week rankings. Administrative Science
Quarterly, 41: 442-476.
Festinger, L. 1954. A theory of social comparison processes. Human Relations, 7: 117-140.
Fiegenbaum, A., & Thomas, H. 1988. Attitudes toward risk and the risk-return paradox -
prospect-theory explanations. Academy of Management Journal, 31: 85-106.
Fiske, S.T. 2004. Social beings: a core motives approach to social psychology. New York:
Wiley.
Gibbons, F. X., Lane, D. J., Gerrard, M., Reis-Bergan, M., Lautrup, C. L., Pexa, N. A., et al.
2002. Comparison-level preferences after performance: Is downward comparison theory
still useful? Journal of Personality and Social Psychology, 83: 865-880.
Goodman, P.S., & Haisley, E. 2007. Social comparison processes in an organizational context:
New directions. Organizational Behavior and Human Decision Processes, 102: 109-125.

Organizational Social Comparison – Page 35
Greenberg, J., Pyszczynski, T. A., & Solomon, S. 1982. The self-serving attributional bias:
Beyond self-presentation. Journal of Experimental Social Psychology, 18: 56-67.
Greve, H. R. 1998. Performance, aspirations and risky organizational change. Administrative
Science Quarterly, 43: 58-86.
Greve, H. R. 2003. A behavioral theory of R&D expenditures and innovations: Evidence from
shipbuilding. Academy of Management Journal, 46: 685-702.
Greve, H. R. 2008. A behavioral theory of firm growth: Sequential attention to size and
performance goals. Academy of Management Journal, 51: 476-494.
Haleblian, J., Kim J.-Y., & Rajagopalan, N. 2006. The influence of acquisition experience and
performance on acquisition behavior: Evidence from the U.S. commercial banking
industry. Academy of Management Journal, 49: 357-370.
Hayward, M. L. A., Rindova, V. P., & Pollock, T. G. 2004. Believing one's own press: The
causes and consequences of CEO celebrity. Strategic Management Journal, 25: 637-653.
Heine, S. J., Lehman, D. R., Markus, H. R., & Kitayama, S. 1999. Is there a universal need for
positive self-regard? Psychological Review, 106: 766-794.
Huber, G. P. 1991. Organizational learning: The contributing processes and the literatures.
Organization Science, 2: 81-115.
Kruger, J., & Dunning, D. 1999. Unskilled and unaware of it: How difficulties in recognizing
one's own incompetence lead to inflated self-assessments. Journal of Personality &
Social Psychology, 77: 1121-1134.
Kuhnen, U., & Oyserman, D. 2002. Thinking about the self-influences thinking in general:
Cognitive consequences of salient self-concept. Journal of Experimental Social
Psychology, 38: 492-499.

Organizational Social Comparison – Page 36
Kwan, V. S., John, O. P., Robins, R. W., & Kuang, L. L. 2008. Conceptualizing and assessing
self-enhancement bias: A com- ponential approach. Journal of Personality and Social
Psychology, 94: 1062-1077.
Kwang, T., & Swann, W. B. 2010. Do people embrace praise even when they feel unworthy? A
review of critical tests of self-enhancement versus self-verification. Personality and
Social Psychology Review, 14: 263-280.
Lerner, J. S., & Tetlock, P. E. 1999. Accounting for the effects of accountability. Psychological
Bulletin, 125: 255-275.
Levinthal, D., & March, J. G. 1981. A model of adaptive organizational search. Journal of
Economic Behavior & Organization, 2: 307-333.
Levitt, B., & March, J. G. 1988. Organizational learning. Annual Review of Sociology, 14: 319-
340.
March, J. G., & Shapira, Z. 1992. Variable risk preferences and the focus of attention.
Psychological Review, 99: 172-183.
March, J. G., Sproull, L. S., & Tamuz, M. 2003. Learning from samples of one or fewer
(Reprinted from Organization Science, vol 2, pg 1-13, 1991 ). Quality & Safety in Health
Care, 12: 465-471.
Marsden, P. V., & Friedkin, N. E. 1993. Network studies of social-influence. Sociological
Methods & Research, 22: 127-151.
Miller, D. T., & Ross, M. 1975. Self-serving biases in the attribution of causality: Fact or
fiction? Psychological Bulletin, 82: 213-225.

Organizational Social Comparison – Page 37
Oldham, G. R., Kulik, C. T., Ambrose, M. L., Stepina, L. P., & Brand, J. F. 1986. Relations
between job facet comparisons and employee reactions. Organizational Behavior and
Human Decision Processes, 38: 28-47.
Peteraf, M.A., & Bergen, M.E. 2003. Scanning competitive landscapes: A market-based and
resource-based framework. Strategic Management Journal, 24: 1027-1041.
Porac, J. F., Wade, J. B., & Pollock, T. G. 1999. Industry categories and the politics of the
comparable firm in CEO compensation. Administrative Science Quarterly, 44: 112-144.
Sedikides, C., & Strube, M. J. 1995. The multiply motivated self. Personality and Social
Psychology Bulletin, 21: 1330-1335.
Short, J. C., & Palmer, T. B. 2003. Organizational performance referents: An empirical
examination of their content and influences. Organizational Behavior and Human
Decision Processes, 90: 209-224.
Stapel, D.A., & Johnson, C.S. 2007. When nothing compares to me: How defensive motivations
and similarity shape social comparisons. European Journal of Social Psychology, 37:
824-838.
Stapel, D.A., & Schwinghammer, S.A. 2004. Defensive social comparisons and the constraints
of reality. Social Cognition, 22: 147-167.
Still, M. C., & Strang, D. 2009. Who does an elite organization emulate? Administrative Science
Quarterly, 54: 58-89.
Suls, J. H., & Wheeler, L. 2000. A selective history of classic and neo-social comparison theory.
In J.H. Suls & L. Wheeler (Eds.), Handbook of social comparison: Theory and research,
3-22. New York: Plenum Publishers.

Organizational Social Comparison – Page 38
Swann, W. B., & Read, S. J. 1981. Self-verification processes—How we sustain our self-
conceptions. Journal of Experimental Social Psychology, 17: 351-372.
Taylor, S. E., & Brown, J. D. 1988. Illusion and well-being: A social psychological perspective
on mental health. Psychological Bulletin, 103: 193-210.
Taylor, S. E., & Lobel, M. 1989. Social comparison activity under threat: Downward evaluation
and upward contacts. Psychological Review, 96: 569-575.
Tetlock, P. E. 1985. Accountability: The neglected social context of judgment and choice.
Research in Organizational Behavior, 7: 297-332.
Watson, D., Clark, L. A., & Tellegen, A. 1988. Development and validation of brief measures of
positive and negative affect—The PANAS scales. Journal of Personality and Social
Psychology, 54: 1063-1070.
Westphal, J.D., & Bednar M.K. 2005. Pluralistic ignorance in corporate boards and firms;
strategic persistence in response to low performance. Administrative Science Quarterly,
50: 262-298.
Wheeler, L. 1966. Motivation as a determinant of upward comparison. Journal of Experimental
Social Psychology, 2: 27-31.
Wheeler, L., & Miyake, K. 1992. Social-comparison in everyday life. Journal of Personality
and Social Psychology, 62: 760-773.
White, K., & Lehman, D. R. 2005. Culture and social comparison seeking: The role of self-
motives. Personality and Social Psychology Bulletin, 31: 232-242.
Wills, T. A. 1981. Downward comparison principles in social psychology. Psychological
Bulletin, 90: 245-271.
Organizational Social Comparison – Page 39
Wilson, A. E., & Ross, M. 2000. The frequency of temporal-self and social comparisons in
people's personal appraisals. Journal of Personality and Social Psychology, 78: 928-942.
Wood, J. V., Taylor, S. E., & Lichtman, R. R. 1985. Social-comparison in adjustment to breast-
cancer. Journal of Personality and Social Psychology, 49: 1169-1183.
Organizational Social Comparison – Page 40
TABLE 1
Frequencies of rank given to the two groups of comparison organizations that were most similar to Allied
Waste and had higher performance than Allied Waste by low vs. high performance (3 = highest rank; 7 =
lowest rank) – Study 1
Rank Overall
Low Performance
High Performance
Freq. Pctg. Freq. Pctg. Freq. Pctg.
3 49 55.1 25 51.0 24 60.0
4 19 21.4 8 16.3 11 27.5
5 10 11.2 7 14.3 3 7.5
6 5 5.6 4 8.2 1 2.5
7 6 6.7 5 10.2 1 2.5

Organizational Social Comparison – Page 41
TABLE 2
Frequencies of rank given to the two groups of comparison organizations that were most similar to Allied
Waste and had higher performance than Allies Waste by low vs. high performance and by self-assessment
vs. self-enhancement prime (3 = highest rank; 7 = lowest rank) – Study 2
Conditions Rank
3 4 5 6 7
Low Performance
N = 36
Self-assessment
N = 20
Freq. 10 5 2 1 2
Pctg. 50.0 25.0 10.0 5.0 10.0
Self-enhancement
N = 16
Freq. 6 3 4 1 2
Pctg. 37.5 18.8 25 6.3 12.5
Overall
Freq. 16 8 6 2 4
Pctg. 44.4 22.2 16.7 5.6 11.1
High Performance
N = 40
Self-assessment
N = 17
Freq. 14 2 1 0 0
Pctg. 82.4 11.8 5.9 0 0
Self-enhancement
N = 23
Freq. 16 4 0 2 1
Pctg. 69.6 17.4 0 8.7 4.4
Overall Freq. 30 6 1 2 1
Pctg. 75.0 15.0 2.5 5.0 2.5
Overall
N = 76
Freq. 46 14 7 4 5
Pctg. 60.5 18.4 9.2 5.3 6.6


![PROFESSIONAL AUDIO SYSTEMSc353616.r16.cf1.rackcdn.com/Biamp_Audia-Nexia_Catalog... · 2015. 7. 1. · AUDIA® [4-6] Biamp’s revolutionary Audia® Digital Audio Platform seamlessly](https://static.fdocuments.in/doc/165x107/5fdaaa49898f6450647cdfc4/professional-audio-systemsc353616r16cf1-2015-7-1-audia-4-6-biampas.jpg)