Selenium status and hair mercury levels in riverine children from Rondônia, Amazonia
25
Accepted Manuscript Selenium Status and Hair Mercury Levels in riverine children from Rondonia - Amazonia Ariana Vieira Rocha, Bárbara Rita Cardoso, Cristiane Cominetti, Rafael Barofaldi Bueno, Maritsa Carla de Bortoli, Luciana Aparecida Farias, Déborah Inês Teixeira Favaro, Luís Marcelo Aranha Camargo, Silvia Maria Franciscato Cozzolino PII: S0899-9007(14)00147-6 DOI: 10.1016/j.nut.2014.03.013 Reference: NUT 9260 To appear in: Nutrition Received Date: 26 November 2013 Revised Date: 28 February 2014 Accepted Date: 17 March 2014 Please cite this article as: Rocha AV, Cardoso BR, Cominetti C, Bueno RB, de Bortoli MC, Farias LA, Favaro DIT, Camargo LMA, Cozzolino SMF, Selenium Status and Hair Mercury Levels in riverine children from Rondonia - Amazonia, Nutrition (2014), doi: 10.1016/j.nut.2014.03.013. This is a PDF file of an unedited manuscript that has been accepted for publication. As a service to our customers we are providing this early version of the manuscript. The manuscript will undergo copyediting, typesetting, and review of the resulting proof before it is published in its final form. Please note that during the production process errors may be discovered which could affect the content, and all legal disclaimers that apply to the journal pertain.
-
Upload
silvia-maria -
Category
Documents
-
view
213 -
download
0
Transcript of Selenium status and hair mercury levels in riverine children from Rondônia, Amazonia

Accepted Manuscript
Selenium Status and Hair Mercury Levels in riverine children from Rondonia -Amazonia
Ariana Vieira Rocha, Bárbara Rita Cardoso, Cristiane Cominetti, Rafael BarofaldiBueno, Maritsa Carla de Bortoli, Luciana Aparecida Farias, Déborah Inês TeixeiraFavaro, Luís Marcelo Aranha Camargo, Silvia Maria Franciscato Cozzolino
PII: S0899-9007(14)00147-6
DOI: 10.1016/j.nut.2014.03.013
Reference: NUT 9260
To appear in: Nutrition
Received Date: 26 November 2013
Revised Date: 28 February 2014
Accepted Date: 17 March 2014
Please cite this article as: Rocha AV, Cardoso BR, Cominetti C, Bueno RB, de Bortoli MC, Farias LA,Favaro DIT, Camargo LMA, Cozzolino SMF, Selenium Status and Hair Mercury Levels in riverinechildren from Rondonia - Amazonia, Nutrition (2014), doi: 10.1016/j.nut.2014.03.013.
This is a PDF file of an unedited manuscript that has been accepted for publication. As a service toour customers we are providing this early version of the manuscript. The manuscript will undergocopyediting, typesetting, and review of the resulting proof before it is published in its final form. Pleasenote that during the production process errors may be discovered which could affect the content, and alllegal disclaimers that apply to the journal pertain.

MANUSCRIP
T
ACCEPTED
ACCEPTED MANUSCRIPT
1
Selenium Status and Hair Mercury Levels in riverine children from 1
Rondonia - Amazonia 2
Ariana Vieira Rocha1, Bárbara Rita Cardoso1, Cristiane Cominetti2, Rafael Barofaldi Bueno1, 3
Maritsa Carla de Bortoli1, Luciana Aparecida Farias3, Déborah Inês Teixeira Favaro3, Luís 4
Marcelo Aranha Camargo4, Silvia Maria Franciscato Cozzolino1. 5
6
¹ Departamento de Alimentos e Nutrição Experimental, Faculdade de Ciências Farmcêuticas, 7
Universidade de São Paulo, São Paulo, São Paulo, Brasil. 8
2 Faculdade de Nutrição, Universidade Federal de Goiás, Goiânia, Goiás, Brasil. 9
3 Instituto de Energia e Pesquisas Nucleares/Comissão Nacional de Energia Nuclear 10
(IPEN/CNEN-SP), Laboratório de Análise de Ativação Neutrônica, São Paulo, São Paulo, 11
Brasil. 12
4 Instituto de Ciências Biomédicas, Departamento de Parasitologia, Universidade de São Paulo, 13
São Paulo, São Paulo, Brasil. 14
15
Running head: Selenium and mercury status in riverine children 16
Word count: 4809 17
Number of tables: 5 18
Number of figures: 1 19
Statement of Author´s Contributions to Manuscript 20
AVR, LMAC and SMFC: designed research; AVR and RBB: conducted research; AVR, BRC, 21
RBB, LAF, MCB, CC and SMFC: analyzed data; AVR, BRC and CC: wrote the manuscript; 22
DITF: provided essential materials. All authors read and approved the final manuscript. 23
This study was supported by CNPq (Conselho Nacional de Desenvolvimento Científico e 24
Tecnológico), process number 478551/2008-8. 25

MANUSCRIP
T
ACCEPTED
ACCEPTED MANUSCRIPT
2
26
Corresponding author: Bárbara Rita Cardoso 27
Faculdade de Ciências Farmacêuticas 28
Universidade de São Paulo 29
Av. Prof. Lineu Prestes 580, Bloco. 14, Butantã 30
05508-000, São Paulo, SP, Brasil 31
Tel.: +55 11 30913625 32
Fax: +55 11 38154410 33
E-mail: [email protected] / [email protected] 34
35

MANUSCRIP
T
ACCEPTED
ACCEPTED MANUSCRIPT
3
Abstract 36
Objective: Riverine communities in Rondônia State are exposed to high selenium (Se) content 37
in the diet because of the seleniferous soils identified in Amazon. However, the Amazonian 38
population has a high mercury (Hg) exposure because this metal accumulates in the soil. 39
Because children are more vulnerable to Hg toxicity, we aimed to evaluate and to correlate Se 40
status and hair Hg levels in riverine children (aged 3 to 9 years) living in two different 41
locations in Rondônia State: Demarcação (DA) and Gleba do Rio Preto (GRP). 42
Methods: Se levels were assessed using hydride generation quartz tube atomic absorption 43
spectroscopy (HGQTAAS); total hair Hg levels were assessed using cold vapor atomic 44
absorption spectrometry (CV AAS). Dietary intake was evaluated through a 24-hour food 45
record and a Food Frequency Questionnaire. 46
Results: Forty-two children participated in this study. Eighty-four percent of the children from 47
DA showed low plasma Se. Conversely, all children from GRP presented plasma Se levels 48
above the reference values. Forty-five percent of the children from DA presented low 49
erythrocyte levels, and 55% of the children from GRP showed concentration in erythrocyte 50
above the reference values. The mean Se intake was 41.8 µg/day in DA and 179.0 µg/day in 51
GRP. High hair Hg levels were observed in children from both localities (3.57±1.86 and 52
6.24±5.89, respectively). 53
Conclusions: Children from both riverine communities are likely to present altered Se status 54
according to their dietary intake. Additionally, these children are highly exposed to Hg, mainly 55
through fish consumption, and the toxicity of this metal may cause metabolic damage. 56
57
Key-words: Brazil; Children; Mercury; Nutritional Status; Selenium. 58
59

MANUSCRIP
T
ACCEPTED
ACCEPTED MANUSCRIPT
4
Introduction 60
Selenium (Se) is an essential nutrient in the diet because it is necessary to make the 61
selenocysteine found in some selenoproteins. Several physiological functions are attributed to 62
Se, such as antioxidant properties, immune system potentiation and heavy metal detoxification 63
(1-3). It is believed that Se is able to delay Hg-intoxication symptoms by forming an inert 64
complex with Hg (4). 65
The northern and northeastern regions of Brazil are considered to have the most Se-rich 66
in the country (5,6), and they are among the leading producers of the richest Se food source, 67
the Brazil nut (Bertholletia excelsa, H.B.K.) (7,8). Studies show that the Se status of riverine 68
populations ranges from normal to very high and it is directly related to the consumption of 69
large amounts of Brazil nuts (9,10). 70
However, Amazonian populations also have the highest reported mercury (Hg) 71
exposure in the world. This metal is accumulated and trapped in the soils along the geological 72
foundation of the basin, and it also comes from exogenous sources related to gold mining or 73
industrial uses (11,12). In this way, Amazonian people who consume local fish as their main 74
dietary protein source may be seriously threatened by Hg contamination (13). Several studies 75
have shown that Se may protect against the toxic effects of Hg, as the interactions between Hg 76
and Se are normally antagonistic (14,15). 77
The levels of Se and Hg in children are of particular interest because an adequate intake 78
of Se is of great importance for the proper development and functioning of the body throughout 79
childhood and because children have a greater vulnerability to Hg, which has important toxic 80
effects on developing systems (particularly the cardiovascular, neurodevelopmental and 81
immune systems) that may persist throughout later life (16). 82
Given the expected variation in selenium intake and mercury exposition between the 83
two populations, we aimed to characterize the Se status in children who live in two riverine 84
communities in Rondônia State, Brazil and to correlate this data with Hg status. 85

MANUSCRIP
T
ACCEPTED
ACCEPTED MANUSCRIPT
5
86
Material and Methods 87
This study included children living in the Demarcação area (DA) and in Gleba do Rio 88
Preto (GRP). DA is located within the municipality of Porto Velho on the right border of 89
Machado River, approximately 30 km upstream of its confluence with the Madeira River, 90
geographically located at S 8 ° 10 '16:20' W 62 ° 46 '45.30", 140 km from the city of Porto 91
Velho, Rondônia State. GRP is formed by approximately 20 families of approximately 100 92
people who do not form a housing project because they are spread throughout an 93
approximately 30-km space along the Preto River. The targeted communities were selected to 94
represent different characteristics of lifestyle. DA is closer to the most developed community in 95
the region and has easy access to products coming from outside the community. GRP presents 96
a typical subsistence lifestyle because it is isolated from other communities which limits the 97
access to industrialized foods. 98
All of the children between the ages 3 and 9 years old who were living in these 99
communities and were followed in our hospital boat between December 2006 and March 2007 100
were included in the study. We excluded children who were receiving or had received vitamin 101
and mineral supplementation and those who presented acute inflammation, infection, fever, 102
diarrhea, cancer, diabetes or autoimmune disease. 103
Blood and hair samples and a 24-hour food record were collected, and anthropometric 104
evaluations were conducted. These assessments were performed in an outpatient clinic on a 105
hospital boat. 106
This study was conducted according to the guidelines laid down in the Declaration of 107
Helsinki, and all procedures involving human subjects/patients were approved by Ethics 108
Committee of the Faculty of Pharmaceutical Sciences at the University of São Paulo. Written 109
informed consent was obtained from the children’s parents. 110
Anthropometric evaluation 111

MANUSCRIP
T
ACCEPTED
ACCEPTED MANUSCRIPT
6
The children were measured while wearing light clothing and no shoes. Body weight 112
was measured with a Filizola weighing scale to the nearest 0.1 kg, while height was measured 113
with a portable stadiometer Sanny (São Paulo, SP, Brasil) to the nearest 0.1 cm. 114
Anthropometric status was classified according to WHO growth standards for weight-115
for-age, height-for-age and weight-for-height. The software Anthro v3.2.2 and AnthroPlus 116
v1.0.4 were used to determine z-scores. The cut-off values for wasting, stunting and thinness 117
were −2 SD; the cut-off values for overweight and obesity were 2 SD. 118
Dietary intake 119
The Se intake was evaluated using 24-hour dietary recall. The dietary recall interview 120
was conducted on the day of blood collection, and it collected detailed information about the 121
entire dietary intake on the previous day. The dietary intake was also assessed using the Food 122
Frequency Questionnaire. Because fish, peach palm (Bactris gasipaes H. B. K.) and Brazil nuts 123
(Bertholletia excelsa) were the main foods consumed in the regions of study, we have analyzed 124
the Se concentrations in these foods using hydride generation quartz tube atomic absorption 125
spectroscopy (HGQTAAS) (17). Additionally, the fishes were analyzed in relation to Hg 126
concentration using cold vapor atomic absorption spectrometry (CV AAS) (18,19). To evaluate 127
the micronutrients in the fishes, they were fried with soy oil according to the manner in which 128
these fish are prepared and consumed in the studied communities. 129
The 24-hour recall data were analyzed using the software NutWin (Escola Paulista de 130
Medicina/UNIFESP/Brazil), which was supplemented with the data obtained by analysis. 131
Biochemical assays 132
Fasting morning blood samples were collected by venipuncture in EDTA evacuated 133
tubes to determine the Se concentration in plasma and erythrocytes. Plasma was separated by 134
centrifugation at 3000 x g for 15 min at 4 °C. The erythrocyte pellet that was obtained from the 135
whole blood by centrifugation was washed three times with 5 mL of sterile 9 g/L NaCl 136
solution, slowly homogenized by inversion and centrifuged at 10000 x g for 10 minutes at 4°C, 137

MANUSCRIP
T
ACCEPTED
ACCEPTED MANUSCRIPT
7
and the supernatant was discarded. Se determination in biological material was performed 138
using HGQTAAS (17). The method reproductivity was achieved by analyzing the samples in 139
triplicate (technical replicates to average out the technical variation) and performing readings 140
in triplicate (a total of 9 readings per person), and SERONORM (SERO®)-certified material was 141
adopted as a reference to serve as a control for the methodology. All reagents received 142
analytical grade or higher purity from Merck. Nanopure water was used to prepare all of the 143
solutions and to dilute the samples. 144
Hair Hg level was determined in a sample of 10 children from each locality. In these 145
children, a hair sample was cut from the back of the head (occipital area) close to the scalp. 146
The hairs of each sample were bundled together and placed in a labeled envelope. The total Hg 147
level was determined using CV AAS (18,19). The methodology validation for total hair Hg 148
was performed by analyzing reference material a with certified value (Human Hair – IAEA 149
085). 150
Statistical analysis 151
A descriptive analysis was performed, and the results are shown as the mean ± standard 152
deviation (SD) for continuous variables. The Shapiro-Wilk W test was performed to verify data 153
normality. When normal distribution was present, data from both communities were compared 154
using the unpaired Student’s t-test; the Mann–Whitney U test was used when the data were 155
skewed. 156
Se intake was adjusted for energy to describe the relationship between aspects of food 157
consumption and biochemical characteristics independent of energy intake. This procedure was 158
performed according to the residual method (20). 159
Analyses were performed using the statistical software package GraphPad Prism 160
Version 5.0. The level of significance was established at p<0.05 for all tests. 161
162
Results 163

MANUSCRIP
T
ACCEPTED
ACCEPTED MANUSCRIPT
8
All thirty four of the children living in the DA and all fifteen living in GRP met the 164
inclusion criteria; however, the parents of three children from the DA and four from GRP did 165
not allow them to participate in the study. Nonetheless, the scope of the study was significant, 166
because 91% of the children from the DA and 73% from GRP were included. The mean age of 167
the participants from the DA was 5.5 ± 1.6, and the mean age of those from GRP was 6.0 ± 2.1 168
years; there was no significant difference between the communities (Table 1). 169
No differences regarding weight or height between communities were observed (Table 170
1). Our data showed that regarding weight-for-age (WA), height-for-age (HA) and weight-for-171
height (WH), most of the children were eutrophic. WH reflects body weight in proportion to 172
attained growth in height, and in our study we observed that although most of children were 173
eutrophic, 12% had a WH ≥2 z-score, which indicated overweight. The Food Frequency 174
Questionnaire and 24-hour dietary recall showed that children from both communities 175
experience food monotony, and the main foods they consumed were fish, rice, manioc flour, 176
coffee and sugar. Children from the DA reported higher consumption of sweet popcorn, 177
snacks, chewing gum, biscuits, artificial juices and soft drinks. We also observed that 36% of 178
the children from GRP ate Brazil nuts weekly, while 41% of children from the DA used to eat 179
Brazil nuts rarely. Together with fish, Brazil nuts are a good source of Se, while the peach 180
palm has a low concentration of this mineral (Table 3). 181
Regarding Se intake, the children from GRP showed a higher Se intake compared with 182
those from the DA (Table 4). In general, most of the children from both areas showed Se 183
intakes varying between the recommended dietary allowance (RDA) (20 µg/d for 1-3 years; 30 184
µg/d for 4-8 years; 40 µg/d for 9-13 years) and the tolerable upper intake levels (UL) (90 µg/d 185
for 1-3 years; 150 µg/d for 4-8 years; 280 µg/d for 9-13 years) (21). Twenty-one percent of the 186
children from the DA had Se intake lower than the estimated average requirement (EAR) and 187
18% of the children from GRP showed an intake higher than the UL. 188

MANUSCRIP
T
ACCEPTED
ACCEPTED MANUSCRIPT
9
Table 4 illustrates the Se levels (µg/L) in the plasma and erythrocytes of riverine 189
children from the DA and GRP. All of the children from GRP presented high plasma Se levels 190
that surpassed reference values (>84–100 µg/L) (22). The children from the DA presented 191
mean plasma Se levels within the reference range; however, 84% of them showed deficient 192
levels. Regarding to erythrocyte Se level, 55% of children from DA presented adequate 193
concentration and 45% were deficient, while 55% of children from GRP showed concentration 194
that exceeded reference values (90–190 µg/L) and no one presented deficient level (1). 195
Table 5 shows the Hg levels in the main consumed fishes and in the hair of the children 196
from the DA and GRP. Children living in GRP showed significantly higher Hg levels 197
compared with participants from the DA. Only one child from the DA (10%) and three from 198
GRP (27%) showed Hg values below 2 mg/kg, which is the reference value (23). The 199
remaining children presented high hair Hg levels, with the highest concentrations found in the 200
children living in GRP (6.2±5.9 mg/kg) compared with the DA participants (3.6±1.9 mg/kg). 201
There was a positive correlation between erythrocyte Se levels and hair Hg levels in the 202
children from GRP and no other significant correlations were observed (Figure 1). 203
204
Discussion 205
This study is the first to analyze Se nutritional status and Hg levels in riverine children 206
in this specific Amazonian region. We showed that these children face a threatening nutritional 207
risk from either deficiency or excess of Se and from high Hg levels. 208
The Food Frequency Questionnaire and 24-hour dietary recall revealed that children 209
from both communities consume a monotonous diet containing few vegetables and fruits, as 210
observed by Araújo (24). On the other hand, the children from the DA consumed more 211
processed foods, a finding that can be explained by the fact that DA is closer to Calama, the 212
most developed community in the region, which gives the DA easy access to beverages and 213
processed foods. The presence of processed foods on the diet of children from DA may be 214
MANUSCRIP
T
ACCEPTED
ACCEPTED MANUSCRIPT
10
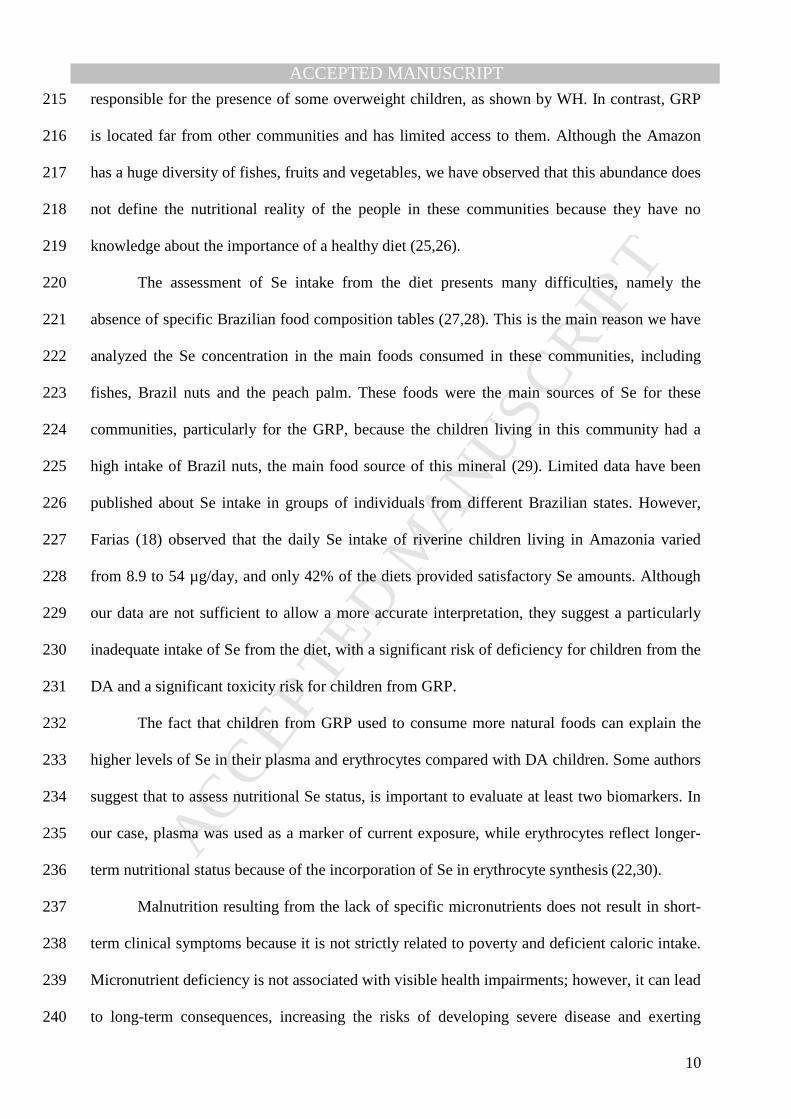
responsible for the presence of some overweight children, as shown by WH. In contrast, GRP 215
is located far from other communities and has limited access to them. Although the Amazon 216
has a huge diversity of fishes, fruits and vegetables, we have observed that this abundance does 217
not define the nutritional reality of the people in these communities because they have no 218
knowledge about the importance of a healthy diet (25,26). 219
The assessment of Se intake from the diet presents many difficulties, namely the 220
absence of specific Brazilian food composition tables (27,28). This is the main reason we have 221
analyzed the Se concentration in the main foods consumed in these communities, including 222
fishes, Brazil nuts and the peach palm. These foods were the main sources of Se for these 223
communities, particularly for the GRP, because the children living in this community had a 224
high intake of Brazil nuts, the main food source of this mineral (29). Limited data have been 225
published about Se intake in groups of individuals from different Brazilian states. However, 226
Farias (18) observed that the daily Se intake of riverine children living in Amazonia varied 227
from 8.9 to 54 µg/day, and only 42% of the diets provided satisfactory Se amounts. Although 228
our data are not sufficient to allow a more accurate interpretation, they suggest a particularly 229
inadequate intake of Se from the diet, with a significant risk of deficiency for children from the 230
DA and a significant toxicity risk for children from GRP. 231
The fact that children from GRP used to consume more natural foods can explain the 232
higher levels of Se in their plasma and erythrocytes compared with DA children. Some authors 233
suggest that to assess nutritional Se status, is important to evaluate at least two biomarkers. In 234
our case, plasma was used as a marker of current exposure, while erythrocytes reflect longer-235
term nutritional status because of the incorporation of Se in erythrocyte synthesis (22,30). 236
Malnutrition resulting from the lack of specific micronutrients does not result in short-237
term clinical symptoms because it is not strictly related to poverty and deficient caloric intake. 238
Micronutrient deficiency is not associated with visible health impairments; however, it can lead 239
to long-term consequences, increasing the risks of developing severe disease and exerting 240

MANUSCRIP
T
ACCEPTED
ACCEPTED MANUSCRIPT
11
harmful effects on the quality of life (31). This observation can be applied to the children from 241
the DA, who presented adequate levels of growth and development based on anthropometric 242
data despite presenting some level of Se deficiency. The children from GRP also presented 243
adequate levels of growth and development; however, we encourage the monitoring of Se 244
levels in this population to avoid possible risks of adverse effects. It is important to mention 245
that Se toxicity does not usually cause dermal signs or sentinel symptoms, but it is related to 246
cardio metabolic perturbations (insulin resistance, hyperglycemia, hypertension, 247
hypercholesterolemia and cardiovascular diseases) (32). 248
Blood Hg levels reflect Hg exposure in both organic and inorganic forms, which can be 249
biased by Hg-contaminated food intake. Hg remains in the blood stream for only a few days 250
after exposure. Therefore, analyses must be performed quickly to detect recent exposure. In 251
contrast, hair Hg levels are proportional to blood Hg concentrations. Because this metal is 252
incorporated into the hair, its level is not modified (23). Consequently, hair analysis reflects 253
sustained exposure to Hg, which enables the assessment of Hg levels over longer periods of 254
time (33). A limitation of this study was that we did not measure Hg in all children and, in our 255
case, recruitment was based on a convenience sampling procedure. 256
One explanation for the high Hg hair levels found in our study could be the frequent 257
fish consumption, most notably by the children from GRP. However, despite the high fish 258
consumption by the population from Manaus/AM, researchers found children in this area to 259
present hair Hg levels below the recommended values (2.0 mg/kg) (23). Hair Hg and 260
methylmercury (MeHg) levels were lower than 10 mg/kg in all evaluated districts, which 261
indicated a low risk of Hg adverse effects on child development (18,33). Children from Jaú 262
National Park (Amazon Region) had values ranging from 0.60 to 42.2 mg/kg (18). Likewise, 263
children from two communities in Pará state (Brasília Legal and São Luiz do Tapajós) had high 264
Hg hair levels. In the first community, the mean levels were 5.84±4.91 mg/kg; in the second 265
one, the mean Hg hair levels were even higher (21.06±14.38 mg/kg) (28). Children <15 years 266

MANUSCRIP
T
ACCEPTED
ACCEPTED MANUSCRIPT
12
old from Rio Negro in Amazonia also showed high mean hair Hg levels (18.52±10.04 mg/kg) 267
(34). 268
Researchers have been trying to find an explanation for the absence of evident clinical 269
symptoms in Amazonian populations who present high Hg levels. The presence of natural Se 270
in the region has been considered a possible contributor to the apparent tolerance for chronic 271
Hg intoxication (35-38). Some studies suggested that an adequate Se intake might provide 272
effective protection against Hg and its toxic compounds (39). It is believed that when Se is 273
combined with other metals, it can produce inert compounds (40,41). The interaction between 274
Se and Hg forms the selenite-dimethylmercury (SDM) complex, which is unstable in blood and 275
in other tissues (42). The protective effect of Se has been associated with higher Hg retention 276
rather than higher Hg excretion (43). In comparison, in vitro and in vivo studies have shown 277
that Hg compounds inhibit the activity of some selenoenzymes, such as thioredoxin reductases 278
and glutathione peroxidases. These enzymes have an essential antioxidant role, and decreases 279
in their activity are related to metabolic diseases (44-46). 280
Although there were some limitations, such as the small sample size and the collection 281
of only one 24-hour diet record, this research allowed us to conclude that our results are 282
considerably relevant. Certainly, studies including larger populations are necessary to confirm 283
our results. 284
In summary, we can conclude that the children from both of the studied riverine 285
communities are likely to present an altered Se status, represented either by a deficiency or 286
excess of blood Se levels and dietary Se intake. Environmental factors, such as Hg 287
contamination, may influence Se levels and present serious health risks to this population. It is 288
urgent that public policies be adopted to improve the living conditions of these populations, 289
which also includes dietary interventions to improve the nutritional Se status. 290
291

MANUSCRIP
T
ACCEPTED
ACCEPTED MANUSCRIPT
13
FIGURE 1. Correlations between selenium levels in plasma and erythrocyte and mercury hair 292
concentration in children from DA and GRP. Se: selenium; Hg: mercury; A and C: Children 293
from DA; B and D: Children from GRP. 294
295

MANUSCRIP
T
ACCEPTED
ACCEPTED MANUSCRIPT
14
References 296
1. Ortuño J, Ros G, Periago MJ, Martinez C, Lopez G, Rodrigo J. Importância nutricional del 297
selenio. Arch Latinoam Nutr. 1997;47:6-13. 298
2. Romero DC, Blanco LF, Sánchez PH, Rodríguez E, Majem L. Serum selenium 299
concentration in a representative sample of the canarian population. Sci Total Environ. 300
2001;269:65-73. 301
3. Davis CD, Uthus EO. Dietary selenite and azadeoxycytidine treatments affect 302
dimethilhidrazine-induced aberrant crypt formation in rat colon and DNA methylation in HT – 303
29 cells. J Nutr. 2002;132:292-7. 304
4. Muntau AC, Streiter M, Kappler M, Roschinger W, Schmid I, Rehnert A, et al. Age-related 305
reference values for serum selenium concentrations in infants and children. Clin Chem. 306
2002;48:555-60. 307
5. Cintra RMGC, Cozzolino SMF. Selenium bioavailability in a regional diet of São Paulo. Int 308
J Food Sci Nutr. 1993;44:167-73. 309
6. Fávaro DIT, Hui MLT, Maihara VA, Armelin MJA, Vasconcellos MB, Yuyama LK, et al. 310
Determination of various nutrients and toxic elements in different Brazilian regional diets by 311
neutron activation analysis. J Trace Elem Med Biol. 1997;11:129-36. 312
7. Müller CH, Figueiredo FJC, Kato AK, Carvalho JEU. A cultura da castanha-do-Brasil, 313
Coleção Plantar, 23. Brasília: EMBRAPA/SPI; 1995. 314
8. Souza ML, Menezes HC. Processamentos de amêndoa e torta de castanha–do–Brasil e 315
farinha de mandioca: parâmetros de qualidade. Ciênc Tecnol Aliment. 2004;24:120-8. 316
9. Lemire M, Mergler D, Fillion M, Passos CJS, Guimarães JRD, Davidson R, et al. Elevated 317
blood selenium levels in the Brazilian Amazon. Sci Total Environ. 2006, 366:101-11. 318
10. Lemire M, Mergler D, Huel G, Passos CJS, Fillion M, Philibert A, et al . Biomarkers of 319
selenium status in the amazonian context: blood, urine and sequential hair segments. J 320
Exposure Sci Environ Epidemiol. 2009, 19:213-22. 321

MANUSCRIP
T
ACCEPTED
ACCEPTED MANUSCRIPT
15
11. Miretzky P, Bisinoti MC, Jardim WF. Absorption of mercury (II) in Amazon soils from 322
column studies. Chemosphere. 2005;60:1583-9. 323
12. Pouilly M, Rejas D, Pérez T, Duprey JL, Molina CI, Hubas C, et al. Trophic structure and 324
mercury biomagnification in tropical fish assemblages, Iténez River, Bolivia. PLoS One. 2013; 325
31;8:65054. 326
13. Boischio AAP, Barbosa A. Exposure to organic mercury in riparin populations on the 327
upper Madeira river, Rondônia, Brazil, 1991: preliminary results. Cad Saude Publica. 328
1993;9:155-60. 329
14. Raymond LJ, Ralston NVC. Selenium′s importance in regulatory issues regarding 330
mercury. Fuel Process Technol. 2009, 90:1333-8. 331
15. Dang F, Wang WX. Antagonistic Interaction of Mercury and Selenium in a Marine Fish Is 332
Dependent on Their Chemical Species. Environ Sci Technol. 2011, 45:3116. 333
16. World Health Organization. Children´s exposure to mercury compounds. Geneva, 2010. 334
17. Hao D, Xie G, Zhang Y, Tian G. Determination of serum selenium by hydride generation 335
flame atomic absorption spectrometry. Talanta. 1996;43:595-600. 336
18. Farias LA, Fávaro DIT, Maihara VA, Vasconcelos MBA, Yuyama LK, Aguiar JPL, et al. 337
Assessment of daily dietary intake of Hg and some essential elements in diets of children from 338
the Amazon region. J Radioanal Nucl Chem. 2006;270:217-23. 339
19. Farias LA, Santos NR, Favaro DI, Braga ES. Mercúrio total em cabelo de crianças de uma 340
população costeira, Cananéia, São Paulo, Brasil. Cad Saude Publica. 2008;24:2249-56. 341
20. Willet WC. Issues in analysis and presentation of dietary data (Monographs in 342
epidemiology and biostatistics, 30). Nutritional epidemiology, 2th ed. New York: Oxford 343
University Press; 1998. 344
21. Food and Nutrition Board of the Institute of Medicine. Dietary reference intakes for 345
vitamin C, vitamin E, selenium and carotenoids. Washington, DC: National Academy Press; 346
2000. 347

MANUSCRIP
T
ACCEPTED
ACCEPTED MANUSCRIPT
16
22. Thomson CD. Assessment of requirements for selenium and adequacy of selenium status: a 348
review. Eur J Clin Nutr. 2004;58:391-402. 349
23. World Health Organization. Methylmercury in Environmental Health Criteria. Geneva: 350
World Health Organization; 1990. 351
24. Araújo R. Estudo de parasitoses, anemia, ingestão de ferro e desnutrição em população 352
escolar de Tabajara. Rondônia, 2005. Federal Universty of Rondonia. 353
25. Rodrigues AF, Escobar AL, Santos RS Análise espacial e determinação de áreas para o 354
controle da malária no Estado de Rondônia. Revista da Sociedade Brasileira de Medicina 355
Tropical. 2008; 41:55-64. 356
26. BRASIL. Ministério da Saúde. Secretaria de Vigilância em Saúde. Departamento de 357
Análise da Situação de Saúde. Saúde Brasil 2004: uma análise da situação de saúde. Brasília: 358
Ministério da Saúde, 2004. 359
27. Combs GF. Selenium in global food systems. Br J Nutr. 2007, 85:517-547. 360
28. Al-Saleh I, El-Doush I, Billedo G, Mohamed Gel-D, Yosef G. Status of selenium, vitamin 361
E, and vitamin A among saudi adults: potential links with common endemic diseases. J 362
Environ Pathol Toxicol Oncol. 2007, 26: 221-243. 363
29. Lemire M, Fillion M, Barbosa Jr F, Guimarães JR, Mergler D. Elevated levels of selenium 364
in the typical diet of Amazonian riverside populations. Sci Total Environ.2010, 408: 4076-84. 365
30. Navarro-Alarcon M, Cabrera-Vique C. Selenium in food and the human body: A review. 366
Sci Total Environ.2008, 400:115-41. 367
31. Fisberg M. Sedentarismo e hábitos alimentares inadequados aumentam o risco de 368
obesidade infantil em São Paulo. Nutrição em Pauta. 2005;74:6-10. 369
32. Lemire M, Philibert A, Fillion M, Passos CJ, Guimarães JR, Barbosa F Jr et al. No 370
evidence of selenosis from a selenium-rich diet in the Brazilian Amazon. Environment 371
International. 2012, 40:128-36. 372

MANUSCRIP
T
ACCEPTED
ACCEPTED MANUSCRIPT
17
33. Pascalicchio AAE. Contaminação por metais pesados: saúde pública e medicina 373
ortomolecular, São Paulo: Annablume; 2002. 374
34. Barbosa AC, Souza J, Dórea JG, Jardim WR, Fadini PS. Mercury biomagnification in a 375
Tropical Black Water, Rio Negro, Brazil. Environ Contam Toxicol. 2003;45:235-46. 376
35. Campos MS, Sarkis JES, Muller RCS, Brabo ES, Santos EO. Correlation between mercury 377
and selenium concentrations in Indian hair from Rondônia State, Amazon region, Brazil. Sci 378
Total Environ. 2002;287:155-61. 379
36. Watanabe C. Modification of mercury toxicity by selenium: practical importance? Tohoku 380
J Exp Med. 2002;196:71-7. 381
37. Passos CJ, Mergler D, Gaspar E, Morais S, Lucott M, Larribe F, et al. Eating tropical fruit 382
reduces mercury exposure from fish consumption in the Brazilian Amazon. Environ Res. 383
2003;93:123-30. 384
38. Raymond LJ, Ralston NVC. Mercury: selenium interactions and health implications. SMDJ 385
Seychelles Med Dental J. 2004;7:72-7. 386
39. Pinheiro MCN, Muller RCS, Sarkis JE, Vieira JLF, Oikawa T, Gomes MSV, et al. Mercury 387
and selenium concentrations in hair samples of women in fertile age from Amazon riverside 388
communities. Sci Total Environ. 2005;349:284-8. 389
40. Yoneda AS, Suzuky KT. Detoxication of mercury by selenium by binding of equimolar 390
Hg-Se complex to a specific plasma protein. Toxicol Appl Pharmacol. 1997;143:274-80. 391
41. Carvalho CML, Lu J, Zhang X, Arnér ES, Holmgren A. Effects of selenite and chelating 392
agents on mammalian thioredoxin reductase inhibited by mercury: implications for treatment 393
of mercury poisoning. FASEB J. 2011, 25:370-381. 394
42. Naganuma AA, Imura N. Mode of interaction of mercury with selenite to from high-395
molecular weight substance in rabbitt blood in vitro. Chem Biol Interact. 1983,43:271. 396
43. US. Department of Health and Human Services. Agency for Toxic Substances and Disease 397
Registry (ATSDR). Toxicological Profile for Mercury. Atlanta: ATSDR; 1999. 676 p. 398

MANUSCRIP
T
ACCEPTED
ACCEPTED MANUSCRIPT
18
44. Carvalho CML, Chew E, Hashemy SI, Lu J, Holmgren A. Inhibition of human thioredoxin 399
system: a molecular mechanism of mercury toxicity. J Biol Chem. 2008, 283:11913-23. 400
45. Branco V, Canário J, Holmgren A, Carvalho C. Inhibition of the thioredoxin system in the 401
brain and liver of zebra-seabreams exposed to waterborne methylmercury. Toxicol Appl 402
Pharmacol. 2011, 251:95-103. 403
46. Branco V, Canário J, Lu J, Holmgren A, Carvalho C. Mercury and selenium interactionin 404
vivo: Effects on thioredoxin reductase and glutathione peroxidase. Free Radical Biology & 405
Medicine. 2012, 52: 781-793. 406

MANUSCRIP
T
ACCEPTED
ACCEPTED MANUSCRIPTTABLE 1. The characteristics of the participants.
Parameters Demarcação area (n=31) Gleba do Rio Preto
(n=11)
Age (years) 5.5 ± 1.6 6.0 ± 2.1
Weight (kg) 21.0 ± 5.4 19.9 ± 5.4
Height (m) 1.14 ± 0.1 1.13 ± 0.1
Gender
Male (%) 55 70
Female (%) 45 30
All data are given as mean±SD

MANUSCRIP
T
ACCEPTED
ACCEPTED MANUSCRIPT
TABLE 2. Nutritional status of the children from DA and GRP according to z-score.
z-score Demarcação (n=31) Gleba do Rio Preto
(n=11)
W/A W/H H/A W/A W/H H/A
z<-2 3 0 2 0 0 0
z -2 a +2 27 27 29 10 10 10
z>2 1 4 0 1 1 1

MANUSCRIP
T
ACCEPTED
ACCEPTED MANUSCRIPT
TABLE 3. Centesimal composition and Se content (µg/g) of food samples collected in
the DA and GRP.
* Machado River, **Preto River
Foods Energy
(kcal /100g)
Protein
(g/100g)
Lipid
(g/100g)
Carbohydrate
(g/100g)
Se
(µg/g)
Brazil nuts
Peach palm
692.49
302.10
15.94
19.10
65.33
69.00
10.19
214.10
5.83
0.03
Fishes
Pacu (Piaractus brachypomus)*
490.10
36.80
38.10
0.00 0.31
Traíra (Hoplias malabaricus)* 449.90 33.50 35.10 0.00 0.62
Jatuarana (Bricon cephalus)** 504.40 38.80 38.80 0.00 0.12
Cachorro (Hydrolycus scomberoídes)** 478.40 35.90 37.20 0.00 0.83
Piau (Leporinus steindachneri)** 435.00 32.70 33.80 0.00 0.48
Pacu (Piaractus brachypomus)** 493.30 42.10 36.10 0.00 0.65

MANUSCRIP
T
ACCEPTED
ACCEPTED MANUSCRIPT
TABLE 4. The biochemical parameters and intake of Se among the participants.
Parameters Demarcação (n=31)
mean±SD (min-max)
Gleba do Rio Preto (n=11)
mean±SD (min-max)
Plasma Se (µg/L) 41.9±18.7 (16.1-84.4) 189.1±58.7* (96.3-278.5)
Erythrocyte Se (µg/L) 97.6±26.3 (58.8-165.4) 235.0±105.6** (117.4-474.4)
Se dietary intake (µg/day) 41.8±33.4 (0.0-146.0) 179.0±207.0** (27.5-767.0)
All data are given as mean±SD
* Significantly different from DA, P < 0.05 (Student’s t-test).
** Significantly different from DA, P < 0.05 (Mann-Whitney U test).

MANUSCRIP
T
ACCEPTED
ACCEPTED MANUSCRIPT
TABLE 5. Hg concentration in fishes and in children from the DA and GRP.
Hg concentration (mg/kg)
Demarcação – Machado River
Pacu (Piaractus brachypomus) 0.02
Traíra (Hoplias malabaricus) 2.61
Children´s hair (n=10) 3.57±1.86
Gleba do Rio Preto – Preto River
Jatuarana (Bricon cephalus) 1.73
Cachorro (Hydrolycus scomberoídes) 0.42
Piau (Leporinus steindachneri) 0.11
Pacu (Piaractus brachypomus) 0.03
Children´s hair (n=10) 6.24 ± 5.89

MANUSCRIP
T
ACCEPTED
ACCEPTED MANUSCRIPT