Selective Insurance Group, Inc.March 2016 Selective Insurance Group, Inc. Investor Presentation...
33
Selective Insurance Group, Inc. Selective Insurance Group, Inc. March 2016 Selective Insurance Group, Inc. Selective Insurance Group, Inc. Investor Presentation
Transcript of Selective Insurance Group, Inc.March 2016 Selective Insurance Group, Inc. Investor Presentation...

Selective Insurance Group, Inc. Selective Insurance Group, Inc.
March 2016
Selective Insurance Group, Inc.
Selective Insurance Group, Inc.
Investor Presentation

2 Selective Insurance Group, Inc.
Forward Looking Statements
Certain statements in this report, including information incorporated by reference, are “forward-looking statements” as that
term is defined in the Private Securities Litigation Reform Act of 1995 (“PSLRA”). The PSLRA provides a safe harbor under
the Securities Act of 1933 and the Securities Exchange Act of 1934 for forward-looking statements. These statements relate
to our intentions, beliefs, projections, estimations or forecasts of future events or our future financial performance and
involve known and unknown risks, uncertainties and other factors that may cause our or our industry's actual results, levels
of activity, or performance to be materially different from those expressed or implied by the forward-looking statements. In
some cases, you can identify forward-looking statements by use of words such as "may," "will," "could," "would," "should,"
"expect," "plan," "anticipate," "target," "project," "intend," "believe," "estimate," "predict," "potential," "pro forma," "seek,"
"likely" or "continue" or other comparable terminology. These statements are only predictions, and we can give no
assurance that such expectations will prove to be correct. We undertake no obligation, other than as may be required under
the federal securities laws, to publicly update or revise any forward-looking statements, whether as a result of new
information, future events or otherwise.
Factors, that could cause our actual results to differ materially from those projected, forecasted or estimated by us in
forward-looking statements are discussed in further detail in Selective’s public filings with the United States Securities and
Exchange Commission. These risk factors may not be exhaustive. We operate in a continually changing business
environment, and new risk factors emerge from time-to-time. We can neither predict such new risk factors nor can we
assess the impact, if any, of such new risk factors on our businesses or the extent to which any factor or combination of
factors may cause actual results to differ materially from those expressed or implied in any forward-looking statements in
this report. In light of these risks, uncertainties and assumptions, the forward-looking events discussed in this report might
not occur.

3 Selective Insurance Group, Inc.
Strategic Overview
Greg Murphy Chairman and Chief Executive Officer

Selective Insurance Group, Inc.
Best Super-Regional Company
Standard Commercial
Lines
Standard Personal
Lines
14% Excess &
Surplus Lines
9%
► Super-regional P&C carrier with long history of financial strength,
superior execution and disciplined growth in these lines of business:
Standard Commercial
Standard Personal
Excess & Surplus
► Sustainable Competitive Advantages:
True franchise value with network of quality distribution partners
Unique field model coupled with sophisticated underwriting and
claims tools
Superior customer experience
► Profitable growth by increasing share of wallet with existing agents
and adding agents in areas with strong new business opportunities to
increase agency market share
4
2015
NPW 77%
Standard Commercial Lines
14% Standard Personal Lines
9% Excess &
Surplus Lines

Selective Insurance Group, Inc.
► High franchise value:
Standard Commercial: 1,100 agents in 22 states
Standard Personal: 700 agents in 13 states
Excess & Surplus: 80 wholesale brokers in 50
states
► Standard lines NPW per agent of $1.7 million
► Agent relationships strong with all levels of Selective
management
► Agent survey scores averaged 8.6 out of 10 for past three
years
► We generate success through our unique field model
True Franchise Value with Distribution Partners
16% 8%
5
From Agent Survey:
“Selective is our ‘go to’ company. We constantly speak of how great a company
Selective is to our customers.”
Selective Insurance Group, Inc.
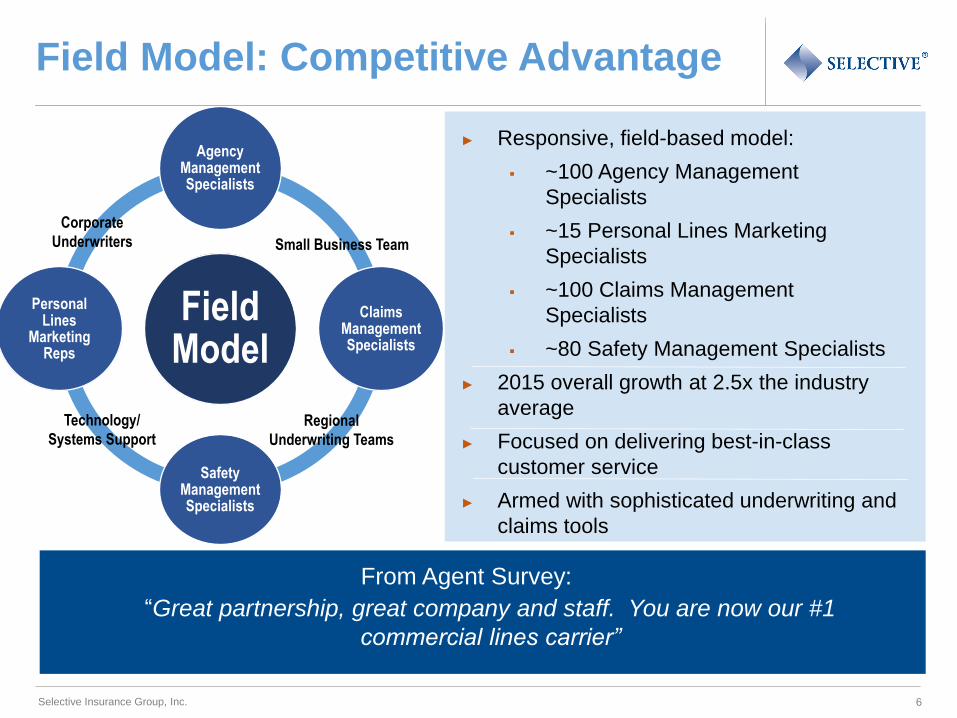
Field Model
Agency Management Specialists
Claims Management Specialists
Safety Management Specialists
Personal Lines
Marketing Reps
16% 8%
► Responsive, field-based model:
~100 Agency Management
Specialists
~15 Personal Lines Marketing
Specialists
~100 Claims Management
Specialists
~80 Safety Management Specialists
► 2015 overall growth at 2.5x the industry
average
► Focused on delivering best-in-class
customer service
► Armed with sophisticated underwriting and
claims tools
6
Field Model: Competitive Advantage
Small Business Team
Corporate
Underwriters
Technology/
Systems Support
Regional
Underwriting Teams
“Great partnership, great company and staff. You are now our #1
commercial lines carrier”
From Agent Survey:

Selective Insurance Group, Inc.
► Vertical integration allows for
nimble execution
► Inside underwriters receive
credit for non-renewal of lower
performing accounts
► 3rd generation models
deployed
Commercial Lines Renewal Premium
75%
76%
77%
78%
79%
80%
81%
82%
83%
84%
85%
$0.5
$0.6
$0.7
$0.8
$0.9
$1.0
$1.1
$1.2
$1.3
$1.4
$1.5
2011 2012 2013 2014 2015
Ove
rall R
ete
ntio
n
Dir
ec
t R
en
ew
al P
rem
ium
(in
bil
lio
ns)
Commercial
Renewal
Pure Price 2.8% 6.2% 7.6% 5.6% 3.0%
7
February 2016 YTD Commercial Lines renewal pure price increase of 2.9%

Selective Insurance Group, Inc.
Sophisticated Pricing Tools
Selective’s pricing tools allow the Company to analyze and price business on a very granular level–a key advantage–
that has enabled outperformance
8
65%
75%
85%
95%
0%
2%
4%
6%
8%
10%
12%
AboveAverage
Average BelowAverage
Low Very Low
Ren
ew
al P
ure
Pri
ce
Commercial Lines Pricing by Retention Group Po
int o
f Ren
ew
al R
ete
ntio
n
% of
Premium 53.0% 26.0% 11.3% 6.3% 3.4%

Selective Insurance Group, Inc.
Profitable Growth
Positioned to grow by increasing share of wallet within existing agency plant from 7% to 12%
Growth drivers:
► Unique field model
► True franchise value
► Increased capacity through:
Small Business teams
Agency Management
Specialists
Additional agents
► The Selective Edge® for Personal
Lines
► Excess & Surplus Lines
9
0
50
100
150
200
250
300
350
400
450
500
2011* 2012 2013 2014 2015
Dir
ec
t N
ew
Bu
sin
es
s (
$in
mil
lio
ns
)
Commercial Personal Excess & Surplus
*New E&S premiums of $24.1 million in 2011 were in association with our renewal
rights purchase in August 2011

Selective Insurance Group, Inc.
2015: Selective’s Most Profitable Year
16% 8%
► Generated 89.4% combined ratio, excluding catastrophes
► Achieved operating ROE goal of 300 bps above WACC at 11.8%
► In 2016, expect to outpace claim inflation through the following actions:
Rate increases in all three insurance segments
Claims and underwriting improvements
Overall Statutory Combined Ratio
10
98.4%
97.3%
94.8%
92.5%
89.4%
2011 2012 2013 2014 2015
Statutory Combined Ratio (Ex-CAT)
2014 2015
3.3 pts 92.4% 95.7%
Improvement
Original
Guidance 101.0% -
102.0% 101.5% 96.0% 92.0% 91.0%

Selective Insurance Group, Inc.
► Commercial lines price increases met or
exceeded claims inflation for 25 consecutive
quarters
► Executing on our small business strategy
through redefined Small Business teams rolled
out in 2015
► New business production from the addition of
Agency Management Specialists
► Adding agents in areas where there is strong
new business opportunity
Commercial Lines
16% 8% Selective has the right tools, technology and team in place to continue driving
profitable growth in standard commercial lines
11
$1.2 $1.3
$1.4 $1.4
$1.6
80%
85%
90%
95%
100%
105%
110%
$-
$0.5
$1.0
$1.5
$2.0
2011 2012 2013 2014 2015
NPW Combined Ratio($ in billions)

Selective Insurance Group, Inc.
46.6%
12.9%
40.5%
2015
Low Hazard Accounts
Medium Hazard Accounts
High Hazard Accounts
Claims Management: Significant Improvements in Workers Compensation
16% 8%
► Centralized handling of Workers
Compensation claims
► Strategic case management and
escalation model
► Fraud detection and recovery model
12
39.4%
15.1%
45.5%
2013
Focus on Lower Hazard Mix
Improvement
16% 8% 2013 2014
Workers Comp Combined Ratios 120.6% 110.1% 88.2%
2015

Selective Insurance Group, Inc.
8%
Excess & Surplus Lines
► Robust new business growth of 23% in
2015
► Achieved overall 4.6% increase in rate
adequacy in 2015 for our casualty
lines
► Improving margins through a mix of
business shift, claims improvements
and targeted pricing increases
13
Opportunity for Profitable Growth
Personal Lines
► Goal to produce a Homeowners 90%
combined ratio in a normal CAT year
► The Selective Edge® product targets
the consultative buyer for home and
auto
► Flood provides natural hedge against
catastrophe exposure

Selective Insurance Group, Inc.
Investing in Omni-Channel Experience
► Game changer in an industry that has been slow to
adopt change
► Providing customers with 24-by-7 access to
transactional capabilities and information
► Drive increased customer loyalty and retention
► Our ability to drive agency adoption is the franchise
value we have with distribution partners
14

Selective Insurance Group, Inc.
Investment Proposition
► Long track record of financial strength, superior execution
and disciplined growth
► Unique operating model combining local underwriting
authority with true franchise value with quality distribution
partners
► Investing in technology to deliver best in-class omni-
channel customer experience
► Focused on continued profitable growth through agency
expansion, strategic underwriting and claims initiatives
► Well-positioned for increased growth opportunities across
all lines
15
Selective delivers high-tech, high-touch insurance solutions while deploying
appropriate leverage to deliver long-term value for shareholders

16 Selective Insurance Group, Inc.
Risk Profile and Financial Strength

Selective Insurance Group, Inc.
Robust Risk and Return Strategy
Low to Medium Hazard Writer
17

Selective Insurance Group, Inc.
Equities
4.1%
Alternatives
1.5%
Short-term
3.8%
Fixed Income
90.6%
As of
12/31/2015
Conservative Investment Portfolio
► “AA-” average credit quality
► Investment ROE: yield of 2.0%
x leverage of 3.64 = 7.3%
► 3.7 year duration (incl. short-
term)
► 2016 expected after-tax new
money rate of 1.78%
► 2016 expected after-tax net
investment income of
approximately $100 million
18
Guidance as of February 4, 2016

Selective Insurance Group, Inc.
8%
26%
5% 4%
Median Max 2014 2015
% of Equity at Risk 1 in 250 Year Event
Reduced gross PML through CAT
management actions
Exhausts at approximately 1-in-
274 year event
Average reinsurer rating “A+”
$201 million
collateralized
2016 Property Catastrophe
Treaty
Renewed January 1, 2016
$685M in excess of $40M retention
Selective** Insurer
Composite* *Source: Aon Benfield
Conservative Reinsurance Program
19
**Blended model results (RMS & AIR)

Selective Insurance Group, Inc.
16% 8%
► Disciplined reserving practices
► Quarterly actuarial reserve reviews
► 10 Consecutive years of favorable
development
► 2 reviews per year by independent
actuary
► 2015 favorable casualty
development of $67 million, or 3.4
point benefit on the combined ratio
► Reserve position is 12 points
above the mid-point of the range
Significantly stronger reserve position and premium to surplus ratio, with much less
volatility, compared to peers
Reserve Strength
1.4%
3.6%
Selective
PeerAverage*
Standard Deviation (2005 – 2014) of
Reserve Development Points on the
Combined Ratio
*Source: SNL Financial, Statutory Filings
Peers include CINF, THG, STFC, UFCS, CNA, HIG, TRV, and WRB
20

Selective Insurance Group, Inc.
$17.87
$18.82
$15.81
$17.80
$18.97 $19.45 $19.77
$20.63
$22.54
$24.37
$0.44
$0.49
$0.52
$0.52
$0.52 $0.52
$0.52 $0.52
$0.53
$0.57
$10
$15
$20
$25
Book Value Per Share Dividend Per Share
Generating Long-Term Shareholder Value
Selective has a long track-record of creating shareholder value
21

Selective Insurance Group, Inc.
Total Return as of December 31, 2015
26.0%
22.9%
15.9%
5.0%
1.4%
15.1%
12.6%
7.3%
9.5%
20.6%
16.0%
5.8%
-5
5
15
25
35 SIGI S&P 500 S&P Prop/Cas%
1 Year 3 Years 5 Years 10 Years
Selective’s success in 2015 reflects its continued ability to drive sustainable and
profitable growth while delivering shareholder value
Total Shareholder Returns
22

Selective Insurance Group, Inc.
16% 8%
► True franchise value with network of quality
distribution partners
► Unique field model coupled with sophisticated
underwriting and claims tools
► Superior customer experience
Sustainable Competitive Advantages
Driving long-term success
23

Selective Insurance Group, Inc. Selective Insurance Group, Inc.
March 2016
Selective Insurance Group, Inc.
Selective Insurance Group, Inc.
Investor Presentation

Selective Insurance Group, Inc.
Financial Highlights 2011 - 2015
2011 2012 2013 2014 2015
Statutory NPW Growth 7.0% 12.2% 8.7% 4.1% 9.8%
Operating EPS* $0.38 $0.58 $1.65 $2.17 $2.70
Net Income per Share* $0.40 $0.68 $1.87 $2.47 $2.85
Dividend per Share $0.52 $0.52 $0.52 $0.53 $0.57
Book Value per Share* $19.45 $19.77 $20.63 $22.54 $24.37
Statutory Premiums to Surplus 1.4x 1.6x 1.4x 1.4x 1.5x
Invested Assets/Stockholder’s Equity* 3.89 3.97 3.97 3.77 3.64
Return on Average Equity* 2.1% 3.5% 9.5% 11.7% 12.4%
Operating Return on Average Equity* 2.0% 3.0% 8.4% 10.3% 11.8%
Statutory Combined Ratio - Total 106.7% 103.5% 97.5% 95.7% 92.4%
- Standard Commercial Lines 103.9% 103.0% 97.1% 95.5% 89.2%
- Standard Personal Lines 117.3% 100.7% 96.9% 94.5% 99.9%
- Excess and Surplus Lines 131.3% 118.8% 102.9% 99.2% 108.4%
GAAP Combined Ratio - Total* 107.2% 104.0% 97.8% 95.8% 92.5%
- Standard Commercial Lines* 104.3% 103.3% 97.4% 95.7% 89.2%
- Standard Personal Lines* 117.8% 101.3% 97.1% 94.4% 99.5%
- Excess and Surplus Lines* 270.2% 124.7% 103.0% 99.7% 109.8%
*Historical values (2011) have been restated to reflect impact of deferred policy acquisition cost accounting change

Selective Insurance Group, Inc.
$123
$227
$336
$233
$382
40
90
140
190
240
290
340
390
440
2011 2012 2013 2014 2015
($ in millions)
8%
14%
Cash Flow as % of NPW
19%
18%
12%
Net Operating Cash Flow

Selective Insurance Group, Inc.
$111
$100 $101 $104
$94
40
50
60
70
80
90
100
110
120
2011 2012 2013 2014 2015
($ in millions)
Investment Income – After-tax

Selective Insurance Group, Inc.
$761
$791
$842
$908 $908
$979
30
31
32
33
34
35
400
600
800
1,000
2010 2011* 2012 2013 2014** 2015
NPW per Employee Statutory Expense Ratio
Insurance Operations Productivity
($ in 000s)
*Excludes Excess & Surplus Lines **Expense ratio excludes 0.4 point benefit from self-insured group sale

Selective Insurance Group, Inc.
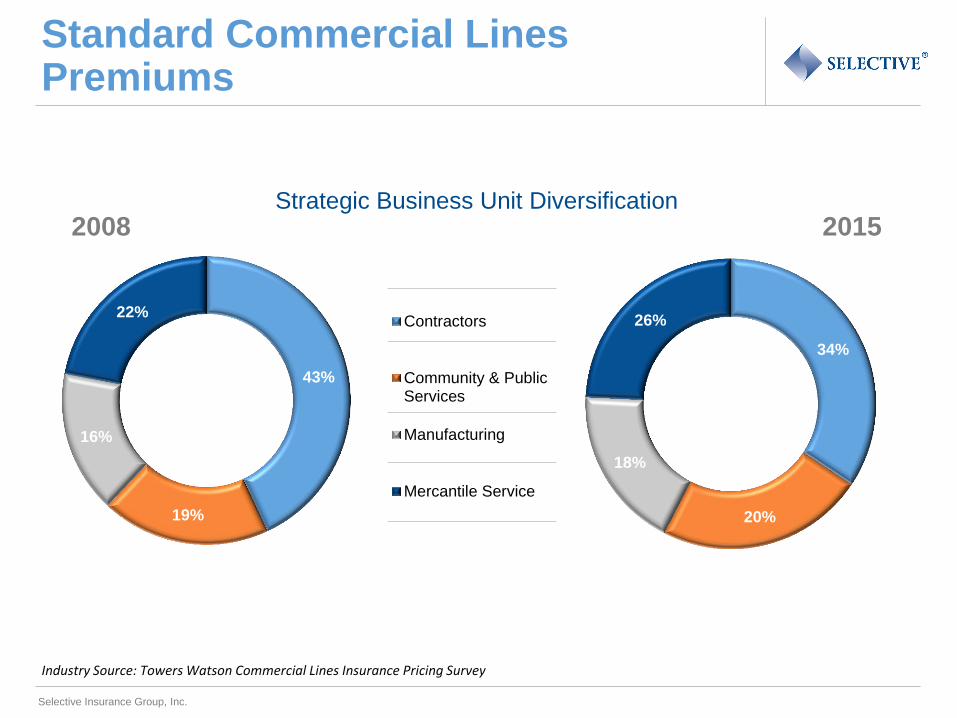
Industry Source: Towers Watson Commercial Lines Insurance Pricing Survey
Standard Commercial Lines Pricing
-1.5%
-0.5%
0.5%
1.5%
2.5%
3.5%
4.5%
5.5%
6.5%
7.5%
Q2 Q3 Q4 Q1 Q2 Q3 Q4 Q1 Q2 Q3 Q4 Q1 Q2 Q3 Q4 Q1 Q2 Q3 Q4 Q1 Q2 Q3 Q4 Q1 Q2 Q3 Q4
2009 2010 2011 2012 2013 2014 2015
Re
new
al P
ure
Pri
ce
Selective CLIPS

Selective Insurance Group, Inc.
93.8 95.0
96.4
99.3
99.3 97.5 98.0
95.3
92.8
87.0
1.2 0.9
2.1
0.5 3.3
6.4 5.0
1.7
2.7
2.2
80
85
90
95
100
105
% 103.9
Impact of Catastrophe Losses Combined Ratio excluding CATS
Statutory Combined Ratios
95.0 95.9
98.5
99.8 100.8
103.0
*Includes impact of reinstatement premium on catastrophe reinsurance program as a result of Hurricane Sandy Some amounts may not foot due to rounding
97.1
95.5
89.2
Standard Commercial Lines Profitability
Selective Insurance Group, Inc.
Industry Source: Towers Watson Commercial Lines Insurance Pricing Survey
43%
19%
16%
22% Contractors
Community & PublicServices
Manufacturing
Mercantile Service
34%
20%
18%
26%
2015 2008 Strategic Business Unit Diversification
Standard Commercial Lines Premiums
Selective Insurance Group, Inc.
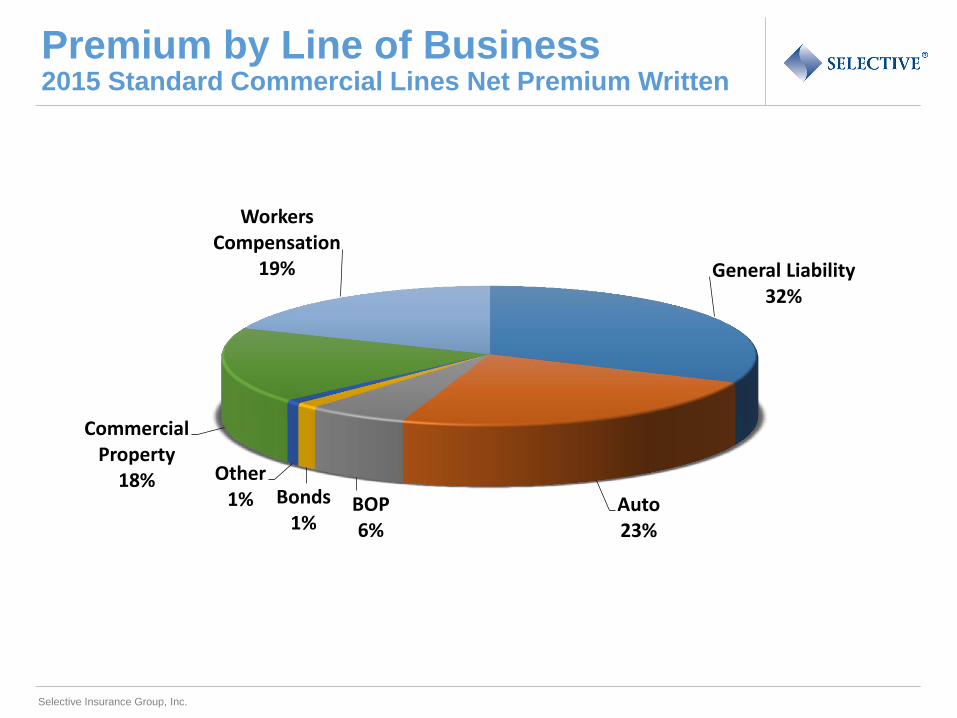
General Liability 32%
Auto 23%
BOP 6%
Bonds 1%
Other 1%
Commercial Property
18%
Workers Compensation
19%
Premium by Line of Business 2015 Standard Commercial Lines Net Premium Written

Selective Insurance Group, Inc.
Long-Term Shareholder Value Creation
$16.44
$17.87 $18.82
$15.81
$17.80 $18.97 $19.45 $19.77
$20.63
$22.54
$24.37
$0.40
$0.44 $0.49
$0.52
$0.52 $0.52 $0.52 $0.52
$0.52
$0.53
$0.57
$0
$5
$10
$15
$20
$25
2005 2006 2007 2008 2009 2010 2011 2012 2013 2014 2015
Book Value Dividend
Note: Book value restated for change in deferred policy acquisition costs (2005-2006 Estimated)