Selection of Environmentally Conscious Manufacturing ...textroad.com/pdf/JAEBS/J. Appl. Environ....
11
J. Appl. Environ. Biol. Sci., 4(8)135-145, 2014 © 2014, TextRoad Publication ISSN: 2090-4274 Journal of Applied Environmental and Biological Sciences www.textroad.com Corresponding Author: Mortaza, Honarmande Azimi, PhD Student of Industrial Management, Department of Management, College of Management, Economics & Accounting, Tabriz Branch, Islamic Azad University, Tabriz, Iran. Selection of Environmentally Conscious Manufacturing Programs Using the MADM Methods Houshang, Taghizadeh 1 , Nasser, Fegh-hi Farahmand 2 , Jafar, Pourmahmoud 3 , Mortaza, Honarmande Azimi 4 1,2 Associate Professor, Department of Management, College of Management, Economics & Accounting, Tabriz Branch, Islamic Azad University, Tabriz, Iran 3 Assistant Professor, Department of Applied Mathematics, Azarbaijan Shahid Madani University, Tabriz, Iran 4 PhD Student of Industrial Management, Department of Management, College of Management, Economics & Accounting, Tabriz Branch, Islamic Azad University, Tabriz, Iran Received: April 13, 2014 Accepted: July 6, 2014 ABSTRACT Nowadays, Environmentally Conscious Manufacturing (ECM) programs have been considered by many organizations from a strategic and competitive advantage point of view. Selection of ECM programs from the several proposed alternatives is a very important and difficult task. Decision makers are not limited to one Multi-attribute Decision Making method in critical conditions and several methods have been proposed for solving this problem. This study presents Polygons Area Method as a Multi-attribute Decision Making method for solving the ECM selection problem. The results of this method have been compared with other typical multiple attribute decision-making methods by giving an example. To find similarity in ranking given by different methods, Spearman’s rank correlation coefficients are obtained for different pairs of these methods. It was observed that the introduced method is in good agreement with other well-known multi-attribute decision making methods in the Environmentally Conscious Manufacturing program selection problem. KEYWORDS: Environmentally Conscious Manufacturing (ECM) Selection, Multi-attribute Decision Making (MADM), Polygons Area Method (PAM) 1. INTRODUCTION Environmentally Conscious Manufacturing (ECM) is a methodical attitude toward process and product design, where environmental criteria are considered a primary objective or prospect, and not a constraint [1]. To this end, environmental problems are in high priority, and green products have become a significant concern for manufacturers and producers due to government and environmental regulations and market pressure toward environmentally friendly solutions to production and manufacturing [2].The issue with environmental destruction has been one of the main problems in recent times [3] and concerns about the sustainability and the protection of the natural environment have become increasingly significant issues among regulators, environmentalists and society in many countries [4]. ECM is a novel approach toward thinking about manufacturing that emphasizes on design for disassembly, product life-cycle analysis, ISO 14000 certification, green supply chains, environmental total quality management, remanufacturing, and minimizing adversarial effects on workers and the environment [5].Four main objectives exist for the enactment of ECM including material management, waste reduction, pollution prevention, and product enhancement [6]. In the other words, environmentally friendly product and manufacturing system helps organization to reduce use of material and enhance the business competitiveness [7]. Multiple Criteria Decision Making (MCDM) refers to making decisions in situations in which there are different and usually conflicting criteria. These methods are divided into two general Multiple Objective Decision Making (MODM) and Multiple Attribute Decision Making (MADM) categories. MODM has decision variables in the form of a continuous variable or an integer. MODM can have one or multiple alternatives, which the selected alternative is the one, which fulfills the constraints of the problem and satisfaction of the decision-maker [8]. Most MODM methods employ mathematical programming in some way. These methods are not easily compatible with problems of the manufacturing environment due to their specific mathematical difficulties. Although many applications and programs have been presented for these methods, lack of simplicity of understanding the theories placed behind them made them an unattractive option for users. 135
Transcript of Selection of Environmentally Conscious Manufacturing ...textroad.com/pdf/JAEBS/J. Appl. Environ....

J. Appl. Environ. Biol. Sci., 4(8)135-145, 2014
© 2014, TextRoad Publication
ISSN: 2090-4274 Journal of Applied Environmental
and Biological Sciences www.textroad.com
Corresponding Author: Mortaza, Honarmande Azimi, PhD Student of Industrial Management, Department of Management, College of Management, Economics & Accounting, Tabriz Branch, Islamic Azad University, Tabriz, Iran.
Selection of Environmentally Conscious Manufacturing Programs Using the MADM Methods
Houshang, Taghizadeh1, Nasser, Fegh-hi Farahmand2, Jafar, Pourmahmoud3,
Mortaza, Honarmande Azimi4
1,2Associate Professor, Department of Management, College of Management, Economics &
Accounting, Tabriz Branch, Islamic Azad University, Tabriz, Iran 3Assistant Professor, Department of Applied Mathematics, Azarbaijan Shahid Madani University,
Tabriz, Iran 4PhD Student of Industrial Management, Department of Management, College of Management,
Economics & Accounting, Tabriz Branch, Islamic Azad University, Tabriz, Iran Received: April 13, 2014
Accepted: July 6, 2014
ABSTRACT
Nowadays, Environmentally Conscious Manufacturing (ECM) programs have been considered by many organizations from a strategic and competitive advantage point of view. Selection of ECM programs from the several proposed alternatives is a very important and difficult task. Decision makers are not limited to one Multi-attribute Decision Making method in critical conditions and several methods have been proposed for solving this problem. This study presents Polygons Area Method as a Multi-attribute Decision Making method for solving the ECM selection problem. The results of this method have been compared with other typical multiple attribute decision-making methods by giving an example. To find similarity in ranking given by different methods, Spearman’s rank correlation coefficients are obtained for different pairs of these methods. It was observed that the introduced method is in good agreement with other well-known multi-attribute decision making methods in the Environmentally Conscious Manufacturing program selection problem. KEYWORDS: Environmentally Conscious Manufacturing (ECM) Selection, Multi-attribute Decision
Making (MADM), Polygons Area Method (PAM)
1. INTRODUCTION Environmentally Conscious Manufacturing (ECM) is a methodical attitude toward process and
product design, where environmental criteria are considered a primary objective or prospect, and not a constraint [1]. To this end, environmental problems are in high priority, and green products have become a significant concern for manufacturers and producers due to government and environmental regulations and market pressure toward environmentally friendly solutions to production and manufacturing [2].The issue with environmental destruction has been one of the main problems in recent times [3] and concerns about the sustainability and the protection of the natural environment have become increasingly significant issues among regulators, environmentalists and society in many countries [4].
ECM is a novel approach toward thinking about manufacturing that emphasizes on design for disassembly, product life-cycle analysis, ISO 14000 certification, green supply chains, environmental total quality management, remanufacturing, and minimizing adversarial effects on workers and the environment [5].Four main objectives exist for the enactment of ECM including material management, waste reduction, pollution prevention, and product enhancement [6]. In the other words, environmentally friendly product and manufacturing system helps organization to reduce use of material and enhance the business competitiveness [7].
Multiple Criteria Decision Making (MCDM) refers to making decisions in situations in which there are different and usually conflicting criteria. These methods are divided into two general Multiple Objective Decision Making (MODM) and Multiple Attribute Decision Making (MADM) categories. MODM has decision variables in the form of a continuous variable or an integer. MODM can have one or multiple alternatives, which the selected alternative is the one, which fulfills the constraints of the problem and satisfaction of the decision-maker [8].
Most MODM methods employ mathematical programming in some way. These methods are not easily compatible with problems of the manufacturing environment due to their specific mathematical difficulties. Although many applications and programs have been presented for these methods, lack of simplicity of understanding the theories placed behind them made them an unattractive option for users.
135

Taghizadeh et al., 2014
MADM methods are widely used for real world problems [9]; [5]; [10]; [11]. Methods such as the Technique for Order Preference by Similarity to Ideal Solution (TOPSIS), Simple Additive Weighting (SAW) or weighted sum model (WSM), Weighted Product Method (WPM) or Multiplicative Exponent Weighting (MEW), Analytic Hierarchy Process (AHP), ELimination Et Choix Traduisant la REalité (ELECTRE), Vise Kriterijumska Optimizacija Kompromisno Resenje (VIKOR), and Linear Assignment are widely used methods. However, these methods have their own advantages and disadvantages [9].
This study presents the polygons area method for the ECM selection problem. In this method, the maximum polygons area obtained from the attributes of an alternative ECM program on the radar chart is introduced as a decision-making criterion [12].
An advantage of the presented method is simplicity of the algorithm and primary calculations required for finding a decision criterion. The required calculations in this method are easily performed by four basic operations. In addition, the decision-making criterion is obtained based on a concrete and extremely precise method with proven experimental and mathematical formulas. Another advantage of this method is the sound agreement of the results from this method with other major MADM methods. The simplicity of learning and training is another advantage of this method[13].
To show the applicability of this method in ECM program selection, an example already studied by other researchers with other MADM methods have been proposed. To demonstrate the high correlation of the results from this method with main MADM methods, Spearman’s correlation coefficient has been employed [5].
2. LITERATURE REVIEW Studies which used MADM methods are presented for ECM program selection in the literature
(Table 1). As seen in Table 1, MADM methods are the most common approach type applied for ranking ECM programs.
Table 1 literature review of ECM program selection N0. Name of the authors Year Method for ECM program selection 1 Sarkis [14] 1999 ANP & DEA 2 Sarkis & Weinrach [15] 2001 DEA 3 Khan et al.[16] 2002 Fuzzy composite programming & AHP 4 Madu et al. [17] 2002 AHP 5 Rao R.V. [18] 2004 Digraph and matrix method 6 Ravi et al. [19] 2005 ANP 7 Kuo et al. [20] 2006 Fuzzy MADM 8 Rao R.V. [21] 2008 AHP, TOPSIS, modified TOPSIS 9 Ravi et al.[22] 2008 ANP & goal programming 10 Rao R.V. [23] 2009 Improved VIKOR 11 Rao&Patal [24] 2010 PROMETHEE 12 Sutapa &Panjaitan [25] 2011 AHP, TOPSIS, modified TOPSIS 13 Rao [5] 2013 Improved PROMETHEE, Improved AHP 14 Dou et al.[26] 2014 Grey analytical network process-based (grey ANP-based)
Their major deficiency of MADM is that in a single problem, different methods present different
results for selection or ranking. To solve this problem, some methods have been introduced [27]; [28]; [5] known as “aggregation methods”. In this method, a problem with several MADM methods is ranked, and then, the final selection may be made on the basis of an aggregation of the results of those methods that have better Spearman’s rank correlation coefficients. Another way of deciding is choosing an alternative that is suggested by the “majority” of the MADM methods applied [5].
Based on MADM literature, the reason that researchers seek new methods for decision-making is to enhance selection confidence or ranking, methods which perform the selection or ranking of alternatives easily and reliably, in addition to previous methods.
Considering availability of many MADM methods, we have utilized SAW, WPM, TOPSIS, and VIKOR methods for our study. The basis of our selection lies in the fact that these methods are the more common and widely used methods in this regard [9]; [29]. The chief assumptions in SAW and WPM are "additive and multiplicative weighted preferences in an interval scale" [8]. On the other hand, SAW was nominated as the foundation for comparing the other methods. The reason for this rests behind the fact that SAW's minimalism and simplicity makes it an attractive and sought after choice for experts, to an extent that some researchers maintain that SAW should be considered as the standard for such assessments [30].
136
J. Appl. Environ. Biol. Sci., 4(8)135-145, 2014
The VIKOR and TOPSIS methods are based on an aggregating function representing "closeness to the ideal" choice [8]; [31]. VIKOR utilizes linear normalization, while TOPSIS employs vector normalization.
The primary principle behind TOPSIS is that the proposed solution to the problem should be in the shortest distance from the ideal solution on one hand, and furthermost distance from the negative-ideal (opposite) solution on the other hand. Conversely, it does not contemplate the relative importance of the aforementioned points [11].
3. MADM METHODS
In this study, we attempt to focus on deterministic MADM methods where there exists only a
single decision maker. Nowadays, SAW, VIKOR, TOPSIS, WPM, and AHP methods are commonly employed in decision-making problems. These methods are considered sound rational decision-making methodologies, and have a higher prospective of solving decision-making problems in different conditions, especially in manufacturing environments [9].
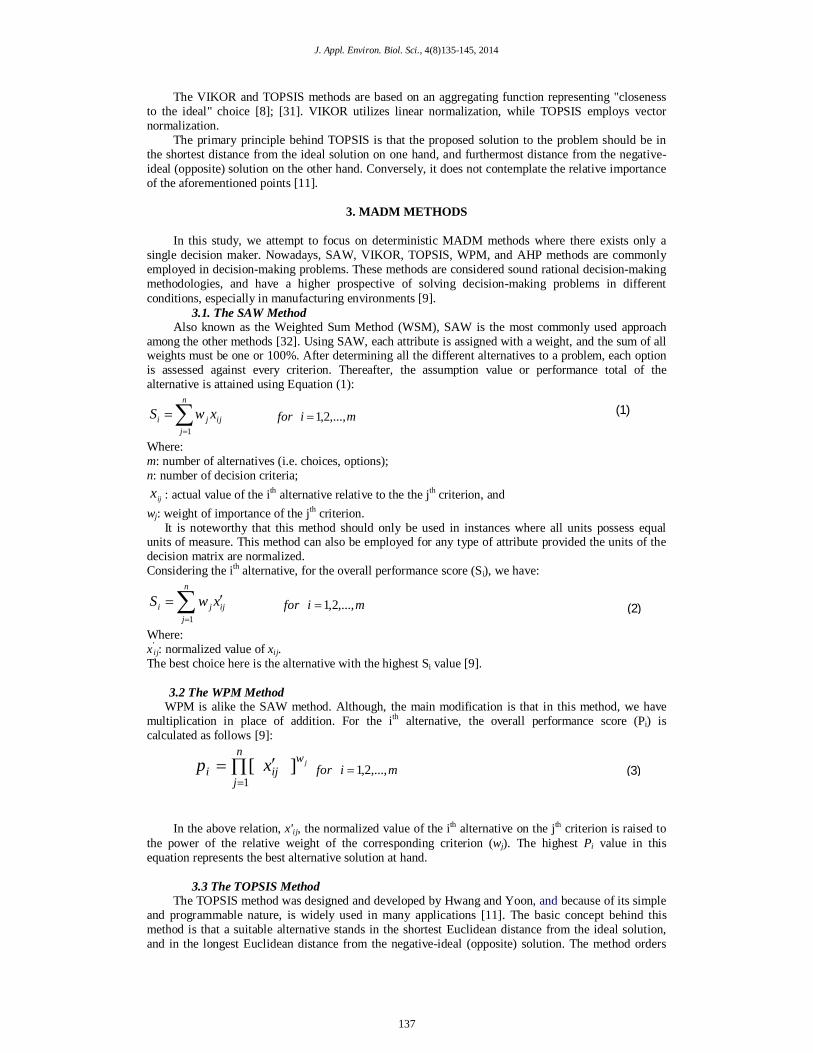
3.1. The SAW Method Also known as the Weighted Sum Method (WSM), SAW is the most commonly used approach
among the other methods [32]. Using SAW, each attribute is assigned with a weight, and the sum of all weights must be one or 100%. After determining all the different alternatives to a problem, each option is assessed against every criterion. Thereafter, the assumption value or performance total of the alternative is attained using Equation (1):
ij
n
jji xwS
1
mifor ,...,2,1
Where: m: number of alternatives (i.e. choices, options); n: number of decision criteria;
ijx : actual value of the ith alternative relative to the the jth criterion, and wj: weight of importance of the jth criterion.
It is noteworthy that this method should only be used in instances where all units possess equal units of measure. This method can also be employed for any type of attribute provided the units of the decision matrix are normalized. Considering the ith alternative, for the overall performance score (Si), we have:
ij
n
jji xwS
1mifor ,...,2,1
Where: x'
ij: normalized value of xij. The best choice here is the alternative with the highest Si value [9].
3.2 The WPM Method WPM is alike the SAW method. Although, the main modification is that in this method, we have
multiplication in place of addition. For the ith alternative, the overall performance score (Pi) is calculated as follows [9]:
][1
jwn
jiji xp
mifor ,...,2,1
In the above relation, x'ij, the normalized value of the ith alternative on the jth criterion is raised to the power of the relative weight of the corresponding criterion (wj). The highest Pi value in this equation represents the best alternative solution at hand.
3.3 The TOPSIS Method The TOPSIS method was designed and developed by Hwang and Yoon, and because of its simple
and programmable nature, is widely used in many applications [11]. The basic concept behind this method is that a suitable alternative stands in the shortest Euclidean distance from the ideal solution, and in the longest Euclidean distance from the negative-ideal (opposite) solution. The method orders
(1)
(2)
(3)
137
Taghizadeh et al., 2014
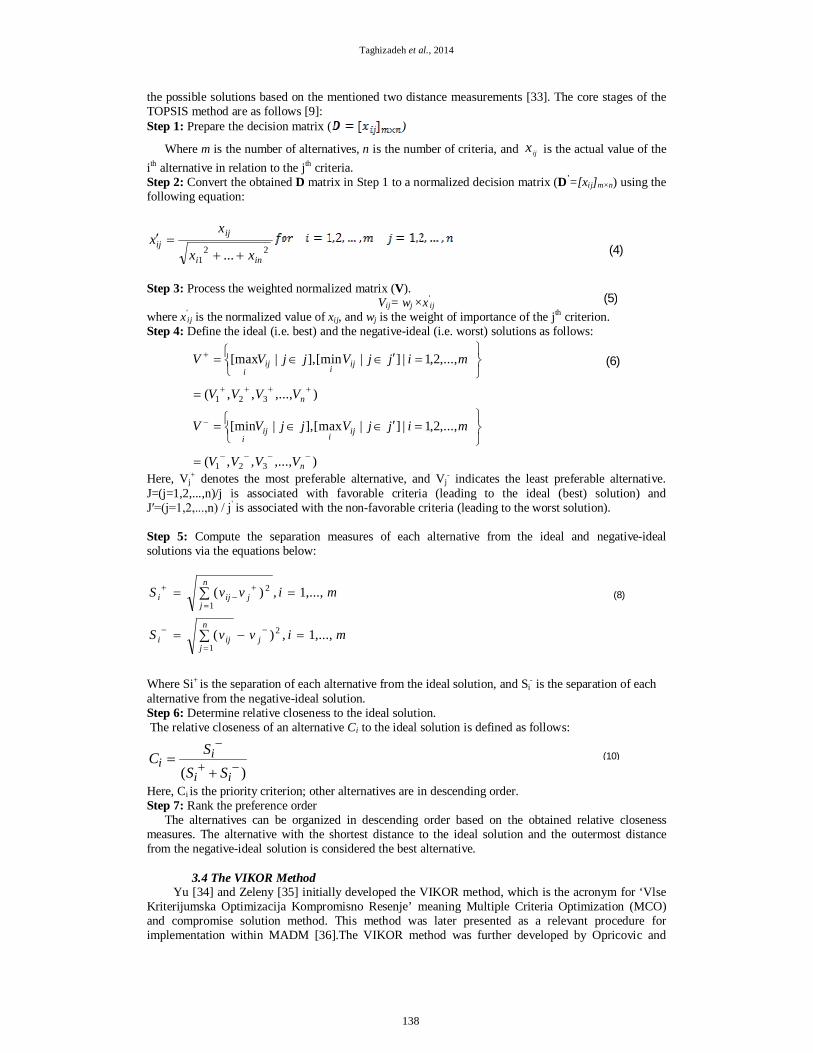
the possible solutions based on the mentioned two distance measurements [33]. The core stages of the TOPSIS method are as follows [9]: Step 1: Prepare the decision matrix ( )
Where m is the number of alternatives, n is the number of criteria, and ijx is the actual value of the ith alternative in relation to the jth criteria. Step 2: Convert the obtained D matrix in Step 1 to a normalized decision matrix (D'=[xij]m×n) using the following equation:
221 ... ini
ijij
xx
xx
Step 3: Process the weighted normalized matrix (V).
Vij= wj ×x'ij
where x'ij is the normalized value of xij, and wj is the weight of importance of the jth criterion.
Step 4: Define the ideal (i.e. best) and the negative-ideal (i.e. worst) solutions as follows:
),...,,,(
,...,2,1|]|max[],|[min
),...,,,(
,...,2,1|]|min[],|[max
321
321
n
ijiiji
n
ijiiji
VVVV
mijjVjjVV
VVVV
mijjVjjVV
Here, Vj+ denotes the most preferable alternative, and Vj
- indicates the least preferable alternative. J=(j=1,2,...,n)/j is associated with favorable criteria (leading to the ideal (best) solution) and J′=(j=1,2,...,n) / j' is associated with the non-favorable criteria (leading to the worst solution). Step 5: Compute the separation measures of each alternative from the ideal and negative-ideal solutions via the equations below:
mivvS
mivvS
j
n
jiji
n
jjiji
,...,1,)(
,...,1,)(
2
1
1
2
Where Si+ is the separation of each alternative from the ideal solution, and Si- is the separation of each
alternative from the negative-ideal solution. Step 6: Determine relative closeness to the ideal solution. The relative closeness of an alternative Ci to the ideal solution is defined as follows:
)(
ii
ii
SSSC
Here, Ci is the priority criterion; other alternatives are in descending order. Step 7: Rank the preference order
The alternatives can be organized in descending order based on the obtained relative closeness measures. The alternative with the shortest distance to the ideal solution and the outermost distance from the negative-ideal solution is considered the best alternative.
3.4 The VIKOR Method
Yu [34] and Zeleny [35] initially developed the VIKOR method, which is the acronym for ‘Vlse Kriterijumska Optimizacija Kompromisno Resenje’ meaning Multiple Criteria Optimization (MCO) and compromise solution method. This method was later presented as a relevant procedure for implementation within MADM [36].The VIKOR method was further developed by Opricovic and
(4)
(6)
(5)
(8)
(10)
138

J. Appl. Environ. Biol. Sci., 4(8)135-145, 2014
Tzeng [31]; [37] as an MADM method. This technique emphases ranking and selecting within a set of alternative options manifested by conflicting criteria.
The VIKOR method begins with a form of LP- metric [31]:
1≤p≤∞ i= 1, 2, …, m
Assuming the jth criteria representing a benefit and
The alternative options are signified as a1, a2, a3, …, am, and as before, wj is the weight of the jth criterion, where j=1, 2, …, n, and xij is the obtained performance score of the jth criterion for ai. The routine steps for the VIKOR method are [31]: Step 1: Formulate the decision matrix. Step 2:
a) Define best, and worst, values of all criterion functions, j=1, 2,…, n
b) Compute Si and Ri values. m
j=1, …,n For non-beneficial criteria , xj
* and xj- can be amended as:
and c) Calculate the value of Qi
(14) where
vis presented as weight of the strategy of ‘the majority of attributes’ (or ‘the maximum group
utility’). The value of vis in the range of 0 to 1. Generally, the default value for this variable is taken as 0.5. Nonetheless, any value between 0 to 1 is allowable.
d) According to the values of Qi, Ri, and Si, organize the alternatives in ascending order. The alternative with minimum Qi value is the best choice.
Condition 1: Acceptable advantage: Q(a")-Q(a')≥ DQ
Where a" is the second-ranked alternative in the ranking list by Q; DQ=1/ (m -1), and m is the number of alternatives. Condition 2: Acceptable stability in decision-making: a' should also be the best-ranked alternative by S or/and R. If one of the conditions is not fulfilled, then a set of settlement solutions are offered. These include:
Alternatives a' and a" only if C2is not satisfied, or Alternatives a', a",…, am if C1is not satisfied; and am is determined by the below relation for
maximum m. Q(am)-Q(a')<DQ
The alternative that has the minimum value of Q in this case is the best choice. According to Opricovic and Tzen"the core ranking result is the compromise-ranking list of alternatives and the compromise solution with the advantage rate" [31].
3.5 Aggregate Method
Considering that different possible MADM methods achieve diverse results, therefore, decision makers are not limited by one MADM method in critical conditions. Various methods known as "aggregate methods" have been introduced to remedy this situation. These methods comprise Rank Average, Borda, and Copeland methods [28].
The Average method ranks alternatives based on the average of their calculated ranks obtained via computation of different MADM methods.
Every MADM method is responsible for ranking all present alternatives. Assume there are m alternatives. In this case, each alternative obtains (m-1) points for the first choice, and (m –2) points for the second choice etc. In the Borda method, the alternative with the highest points is declared winner. On the other hand, the Copeland Method commences its operation at the end of the Borda method. Calculating the number of losses for all alternatives and subtracting them from the number of wins determines the reputation and ranking of each alternative [27].
We can reach consensus "by considering ranking strategies (i.e. Rank Average, Borda, and Copeland methods) and through creating one Partially Ordered Set (POSET)"[28].
(12)
(11)
(15)
(16)
(13)
139

Taghizadeh et al., 2014
3.6 The Proposed Method: Polygons Area Method (PAM) The Radar (Spider) chart is one of the most commonly used charts in management problems and
real-world situations. This chart as well as portraying general overall performance, shows areas of relative strengths and relative weaknesses in a graphical manner. In the case of MADM problems, performance of each alternative is shown by a polygon on the radar chart. In this study, we calculated the maximum number of polygon areas attained as a decision criterion on the radar chart.
Our systematic procedure of the proposed method is as follows [12]: Step 1: Prepare decision matrix (D). Assuming ‘m’ alternatives and ‘n’ attributes, the general form of the decision matrix (D) in an MADM problem is depicted as follows:
nmmnmim
iniji
nj
xxx
xxx
xxx
D
.....................
.....................
......
1
1
1111
These attributes may be objective, subjective, or a combination of both. Step 2: Normalization/Normalized decision matrix (D') Many normalization procedures exist in decision-making science. The linear normalization procedure is adopted in our proposed method [9]. Let x'
ij for attribute j compare with alternative i as follows:
)max( ijxijx
ijx ; If attribute is beneficial
; If attribute is non-beneficial For this method, the decision matrix will transform into the following using linear normalization (Rao, 2007; Singh & Rao, 2011).
퐷′ = [푥푖푗′ ]푚×푛
Step 3: Relative importance of attributes (Wj) In the case of MADM methods, defining the priority weight (wj) of each criterion such that the sum
of weights for all criteria equals one is essential. AHP or entropy methods are a good way of determining these priority weights [9].A pair wise comparison matrix is created using a scale of relative importance. Decisions are input using the fundamental scale of the AHP [38]. Step 4: Forming the weighted normalized decision matrix (V), we have:
Where wj is the weight of the jth criteria. Step 5: Calculating maximum area of polygon on the radar chart
The attributes have been considered to form the radar (spider) chart. The attributes are plotted on the axes, and each alternative will form a polygon. From a different set of attributes, different polygons can be obtained, which seems to be unacceptable in reality. Hence, the polygon with maximum area is considered as a decision criterion. The polygon with maximum area is obtained using the following algorithm if n≥4: a) In weighted decision matrix (V), for alternative i, attributes are ranked from the largest to the smallest in order. b) An attribute with first raking is introduced over the base axis of the chart. c) Attributes with even rankings, each having vij in length and n/2 angle of its previous attribute, are placed clockwise on the chart in a descending order. d) Attributes with odd rankings are also placed counter clockwise similar to the previous step. e) Connecting the points obtained from the two previous steps; draw the irregular polygon on the radar chart. f) Represent the apexes of irregular polygon by beginning from the first ranking and moving counter clockwise by v'
ij. g) The area of triangle (S∆) given SAS (Side, Angle, Side) for example (a, θ, b) is calculated as follows [39]:
S∆ =1/2ab sin θ
ijx
)ij(x
ijxmin
(21)
(17)
(18)
(19)
(20)
(22)
140

J. Appl. Environ. Biol. Sci., 4(8)135-145, 2014
Divide polygon into n triangle(s) and calculate the area of each one as follows:
nSinvvS jiij
221
)1(
h) The area of an irregular polygon is obtained from the sum of the areas of these triangles, and is calculated as follows[39]:
)...(221
1)1(3221 iininniiiiipi VVVVVVVVn
SinS
where Spi is the area of polygon for the ith alternative on the chart. Step 6: Selecting the best alternative the purpose of this step is selecting the best alternative, which is performed with the help of calculated areas of the irregular polygon of Spi s. In this formula, all Spis is a common (1/2sin2π/n)value, which can be relinquished from all comparisons.
Shifting the priority criterion from Spi to Ci s, in which Cis are calculated as follows:
a) If the number of attributes n≥4; the overall performance score (Ci) is calculated as Eq. (26). b) If the number of attributes N=3, Ci is calculated from the V matrix as follows:
Ci=vi1 vi2+ vi2 vi3+vi3 vi1 i=1,…,m The best alternative is the one having the highest Ci value. Figure 1shows the framework of decision making in this paper.
Fig. 1: Framework of decision making
4. EXAMPLES& FINDINGS Sarkis [14] and Rao [9, 11] introduced a problem for assessing ECM programs in an industrial
application. The addressed attributes were "Costs involved (C, USD), Quality (Q, percent of defects), Recyclability (R, percent of recyclable material), Process Waste Reduction (PWR, percent), Packaging waste Reduction (PGR, percent), and Regulatory Compliance (RC, percent of reduction in violations)".
They had gathered data from six attributes for some fifteen alternative ECM programs. The mentioned problem is demonstrated in Table 2.
(24)
(23)
(26)
(25)
(27)
Prepare the decision matrix
Select the widely used MADM methods and solve the problem with these methods
and PAM method
Prepare the table of rank of alternatives And find the ranks from aggregated methods
(Average, Borda, Copeland)
Calculate the spearman's correlation coefficient between rankings, obtained using
methods PAM and aggregated methods
Identify the validity of PAM method
141

Taghizadeh et al., 2014
Attributes C and Q are non-beneficial considering percentage of defects (lower values are better). Here, R, PWR, PGR, and RC are favorable attributes (higher values are preferred).
Table 2 Matrix (D)
C Q R PWR PGR RC ECM P1 706967 2 29 17 0 51 ECM P2 181278 3 5 14 7 45 ECM P3 543399 4 5 3 7 71 ECM P4 932027 7 15 10 17 57 ECM P5 651411 4 19 7 0 21 ECM P6 714917 5 15 6 19 5 ECM P7 409744 1 8 17 1 35 ECM P8 310013 6 23 15 18 32 ECM P9 846595 2 28 16 19 24
ECM P10 625402 3 21 16 7 34 ECM P11 285869 2 1 13 12 54 ECM P12 730637 3 3 4 1 12 ECM P13 794656 5 27 14 14 65 ECM P14 528001 1 6 5 9 41 ECM P15 804090 2 26 6 5 70
The normalization of attribute data is carried out using Eq. (18), (19) and the normalized decision
matrix (D') is given in Table 3.
Table 3 ECM Pi C Q R PWR PGR RC ECM P1 0.2564 0.5 1 1 0 0.7183 ECM P2 1 0.3333 0.1724 0.8235 0.3684 0.6338 ECM P3 0.3336 0.25 0.1724 0.1765 0.3684 1 ECM P4 0.1945 0.1429 0.5172 0.5882 0.8947 0.8028 ECM P5 0.2783 0.25 0.6552 0.4118 0 0.2958 ECM P6 0.2536 0.2 0.5172 0.3529 1 0.0704 ECM P7 0.4424 1 0.2759 1 0.0526 0.493 ECM P8 0.5847 0.1667 0.7931 0.8823 0.9474 0.4507 ECM P9 0.2141 0.5 0.9655 0.9412 1 0.338 ECM P10 0.2899 0.3333 0.7241 0.9412 0.3684 0.4789 ECM P11 0.6344 0.5 0.0345 0.7647 0.6316 0.7606 ECM P12 0.2481 0.3333 0.1034 0.2353 0.0526 0.169 ECM P13 0.2281 0.2 0.931 0.8235 0.7368 0.9155 ECM P14 0.3433 1 0.2069 0.2941 0.4737 0.5775 ECM P15 0.2254 0.5 0.8965 0.353 0.2631 0.9859
The judgments made by decision makers or relative importance of attributes are given in Table 4.
Table 4
Attributes C Q R PWR PGR RC C 1 3 2 1 2 3 Q 1/3 1 1/3 1/4 1/3 1 R 1/2 3 1 1/2 1/2 2
PWR 1 4 2 1 2 4 PGR 1/2 3 2 1/2 1 2 RC 1/3 1 1/2 1/4 1/2 1
The normalized weight of each attribute is obtained from Super Decision software, which are
wC=0.26, wQ=0.066, wR=0.014, wPWR=0.29, wPGR=0.17, wRC=0.075 and consistency ratio (CR) is 0.018 which is much less than the allowed CR value of 0.1. Multiplying the (D') by weight matrix, the weighted normalized matrix (V) is given in Table 5.
Table 5
ECM Pi C Q R PWR PGR RC ECM P1 0.0667 0.0330 0.1400 0.2900 0.0000 0.0539 ECM P2 0.2600 0.0220 0.0241 0.2388 0.0626 0.0475 ECM P3 0.0867 0.0165 0.0241 0.0512 0.0626 0.0750 ECM P4 0.0506 0.0094 0.0724 0.1706 0.1521 0.0602 ECM P5 0.0724 0.0165 0.0917 0.1194 0.0000 0.0222
142

J. Appl. Environ. Biol. Sci., 4(8)135-145, 2014
ECM P6 0.0659 0.0132 0.0724 0.1023 0.1700 0.0053 ECM P7 0.1150 0.0660 0.0386 0.2900 0.0089 0.0370 ECM P8 0.1520 0.0110 0.1110 0.2559 0.1611 0.0338 ECM P9 0.0557 0.0330 0.1352 0.2729 0.1700 0.0254 ECM P10 0.0754 0.0220 0.1014 0.2729 0.0626 0.0359 ECM P11 0.1649 0.0330 0.0048 0.2218 0.1074 0.0570 ECM P12 0.0645 0.0220 0.0145 0.0682 0.0089 0.0127 ECM P13 0.0593 0.0132 0.1303 0.2388 0.1253 0.0687 ECM P14 0.0893 0.0660 0.0290 0.0853 0.0805 0.0433 ECM P15 0.0586 0.0330 0.1255 0.1024 0.0447 0.0739
Now the proposed PAM method, SAW, WPM, TOPSIS and VIKOR methods are applied to this
problem as explained before. Comparison of rankings obtained by these methods for ECM program selection example is given in Table 6.
Table 6
ECM SAW WPM* TOPSIS VIKOR PAM Average** Borda*** Copeland ECM P1 6 13 8 6 6 8 8 8 ECM P2 3 2 4 2 3 2 2 3 ECM P3 14 12 13 14 14 14 14 14 ECM P4 9 7 9 12 9 9 8 9 ECM P5 13 14 14 11 13 13 13 13 ECM P6 11 11 10 10 10 11 10 10 ECM P7 8 8 7 5 7 7 7 7 ECM P8 1 1 1 1 1 1 1 1 ECM P9 2 5 2 7 2 3 2 2 ECM P10 7 4 6 4 8 5 6 6 ECM P11 5 6 3 3 5 4 4 4 ECM P12 15 15 15 15 15 15 15 15 ECM P13 4 3 5 8 4 6 4 4 ECM P14 12 10 11 13 12 12 12 12 ECM P15 10 9 12 9 11 9 10 11
* ECMP1=0 in WPM because D'15=0 ; We replaced D'15 =Min(D'
i5)/10 ; Min(D'i5)= .05 then D'
15= 0.05 **Average of SAW; WPM; TOPSIS and VIKOR methods ranks
***Borda & Copeland methods for SAW; WPM; TOPSIS and VIKOR methods ranks POSET:P8>(P2,P9)>(P11,P13)>P10>P7>(P1,P4)>(P6,P15)>P14>P5>P3>P12
From the ranking of ECM programs, it is clear that the ECM program 8 is the best choice among the alternative ECM programs considered. To find similarity in rankings given by different methods, Spearman's rank correlation coefficients [40]; [41]; [42]; [11] were obtained for different pairs of the five MADM methods and aggregate methods using SPSS software. Table 7 shows the Spearman’s rank correlation coefficients.
Table 7 Method SAW WPM TOPSIS VIKOR PAM SAW 1 .850* 0.964* 0.857* 0.993*
WPM 1 0.871* 0.743** 0.829*
TOPSIS 1 0.854* 0.968*
VIKOR 1 0.850*
PAM 1 Average .958*
Borda .979*
Copeland .985*
*sig. = 0.000 Correlation is significant at the 0.01 level (2 tailed) **sig. = 0.002 Correlation is significant at the 0.01 level (2 tailed)
5. DISCUSSION
The values of Spearman’s rank correlation coefficients (Table 7) show that there is a perfect
agreement between the introduced method (PAM) and other typical MADM methods. The rank order of ECM programs obtained using PAM (Table 6) is: 8- 9- 2- 13- 11- 1- 7- 10- 4- 6- 15- 14- 5- 3- 12. The rank order of ECM programs given by Rao [5] using improved AHP and improved PROMETHEE methods were: 8-9-2-13-11-1-10-7-4-15-6-14-5-3-12 and 8-7-1-9-2-10-11-13-14-6-15-4-3-5-12 respectively. The rank order given by Sarkis [14] using RCCR DEA and RCCR/AR DEA models were: 8-2-11-9-7-14-1-15-13-10-3-6-5-4-12 and 11-8-9-7-2-1-15-10-14-13-6-3-4-5-12 respectively. The best and worst alternative ECM programs obtained using PAM method are same as given by Rao using
143

Taghizadeh et al., 2014
(AHP and PROMETHEE) and Sarkis using RCCR DEA. This result confirms that the suggested ECM program selection method, is comparatively novel and applicable method, and hence, may be employed for any type of decision-making circumstances.
6. CONCLUSION
Recently, companies pay more attention to environment and environmental issues have become a
key determinant of performance in the marketplace. Selecting the best ECM program is an important problem in the industrial environment considering various multiple performance attributes. This paper presents the PAM method using polygons area for solving the ECM program selection problem. A numerical ECM program selection example was presented to indicate the validity and advantages of the proposed method in comparison with the four well-known MADM methods. Spearman’s rank correlation coefficient was obtained for different pairs of MADM methods. Observations showed that the proposed method is in good agreement with the other methods.
The ECM selection example shows that the PAM method can derive quite acceptable ranking results to assist decision makers in devising appropriate decisions. This confirms use of the suggested method for decision-making conditions in manufacturing environments, and can act as a comprehensive solution for other decision-making conditions. PAM can also be employed for other types of decision-making problems. It is a simple and logical instrument when compared with alternative MADM methods. We suggest that future studies contemplate and analytically compare other MADM methods.To rank fuzzy data, fuzzy model of the proposed method can be investigated by researchers in future studies.
REFERENCES
1. Billatos, S. (2004).‘ Green Technology and Design for the Environment’. Oregon: Taylor and Francis, Ltd.
2. Hessami, H., Golsefid-Alavi, M., Madan Shekaf, S. and Kiani, R.(2012). ‘Evaluation of Success Factors of ISO 14001- Based EMS Implementation and Ranking the Cement Industry Using the TOPSIS Method’ Journal of Applied Environmental and Biological Sciences, 2(10), 523-530.
3. Da Silva, Gisele Cristina and De Medeiros, Denise Dumke, (2004), ‘Environmental management in Brazilian companies, Management of Environmental Quality’: An International Journal,15( 4), 380-388.
4. Ribeiro, Veronica P. Lima and Aibar-Guzman, Cristina, (2010). “Determinants of environmental accounting practices in local entities: evidence from Portugal”, social responsibility journal, 6(3), 404-419.
5. Rao R.V. (2013).‘Decision making in the manufacturing environment using graph theory and fuzzy multiple attribute decision making methods’. 2 London: Springer-Verlag.
6. Gupta, S. (2008).‘ Environment Conscious Manufacturing’. Oregon: Taylor and Francis, Ltd. 7. Houshyar N. A., Hoshyar N. A, and Suleiman B. S. (2014) ‘Review Paper on Sustainability in
Manufacturing System’ Journal of Applied Environmental and Biological Sciences, 4(4)7-11. 8. Zanakis, S.H.; Solomon, A.; Wishart, N. and Dublish, S. (1998). ‘Multi-attribute decision making: A
simulation comparison of select methods’. European Journal of Operational Research, 107, 507-529. 9. Rao, R.V. (2007). ‘Decision making in the manufacturing environment using graph theory and fuzzy
multiple attribute decision making methods’. London: Springer-Verlag. 10. Fendel, G. and Spronk, J. (1983). ‘Multiple Criteria Decision Methods and Applications’. New York:
Spring-Verlag. 11. Hwang, C. L. and Yoon, K. (1981). ‘Multiple attributes decision making methods and applications’. New
York: Springer. 12. Honarmande Azimi, M. and Pourmahmoud, J. (2012). ‘A new multiple attribute decision making method’
The 5th International Conference of Iranian Operations Research Society, Tabriz, Iran, 65-67. 13.HonarmandeAzimi, M.;Taghizadeh, H.; Fegh-hi Farahmand, N. and Pourmahmoud, J. (2014). ‘Selection
of industrial robots using the Polygons area method’. International Journal of Industrial Engineering Computations, 5(4), doi: 10.5267/j.ijiec.2014.6.001.
14. Sarkis, J. (1999). ‘A methodological framework for evaluating environmentally conscious manufacturing programs’. Computers & Industrial Engineering, 36, 793–810.
15. Sarkis J. and Weinrach J. (2001). ‘Using data envelopment analysis to evaluate environmentally conscious waste treatment technology’. Journal of Cleaner Production, 9, 417–427.
16. Khan, F. I.; Sadiq, R. and Husain, T. (2002). ‘Green Pro-I: a risk based life cycle assessment decision-making methodology for process plant design’. Environment Modeling and Software, 17, 669–692.
17. Madu, C. N.; Kuei, C. and Ifeanyi, E. (2002). ‘A hierarchic metric approach for integration of green issues in manufacturing: a paper recycling application’. Journal of Environmental Management, 64, 261–272.
144

J. Appl. Environ. Biol. Sci., 4(8)135-145, 2014
18. Rao RV (2004) Digraph and matrix methods for evaluating environmentally conscious manufacturing programs. International Journal of Environmentally Conscious Design and Manufacturing 12, 23–33.
19. Ravi, V.; Shankar, R.and Tiwari, M.K. (2005). ‘Analyzing alternatives in reverse logistics for end-of-life computers: ANP and balanced scorecard approach’. Computers &Industrial Engineering 48, 327–356.
20. Kuo, T. C.; Chang, S. H. and Huang, S. H. (2006). ‘Environmentally conscious design by using fuzzy multi-attribute decision-making’. International Journal of Advanced Manufacturing Technology, 29, 209–215.
21. Rao, R. V. (2008). ‘Evaluation of environmentally conscious manufacturing programs using multiple attribute decision-making methods’. Journal of engineering manufacture, 441-452.
22. Ravi, V.; Shankar, R.; Tiwari, M.K. (2008). ‘Selection of a reverse logistics project for end-of-life computers: ANP and goal programing approach’. International Journal of Production Research 46,4849–4870.
23.Rao R.V. (2009). ‘An improved compromise ranking method for evaluation of environmentally conscious manufacturing programs’. International Journal of Production Research, 47(16), 4399-4412.
24.Rao R.V. and Patel B.K.(2010).‘Decision making in the manufacturing environment using an improved PROMETHEE method’. International Journal of Production Research, 48(16), 4665-4682.
25. Sutapa, I.N. and Panjaintan, T.W.S.(2011).‘Selection of environmentally conscious manufacturing’s program using multi-criteria decision making: a case study in electronic company’. Industrial Engineering and Management Sciences 10(2), 123-127.
26. Dou, Y.; Zhu, Q. and Sarkis J. (2014).‘Evaluating green supplier development programs with a grey-analytical network process-based methodology’. European Journal of Operational research, 233 (2), 420-431.
27. Wang, Y.M.; Yanga, J.B. and Xu, D.L (2005). ‘A preference aggregation method through the estimation of utility Intervals’. Computers & Operations Research, 32, 2027–2049.
28. Momeni, M. (2007). ‘New topics in operations research’. Tehran: University of Tehran publication, 2nd Ed.
29. Behzadian, M.; Khanmohammadi Otaghsara S.; Yazdani M. and Ignatius J.(2012).‘A state-of the-art survey of TOPSIS applications’. Expert Systems with Applications, 39, 13051–13069.
30. Triantaphyllou, E. and Mann, S.H. (1989). ‘An examination of the effectiveness of multi-dimensional decision-making methods: A decision-making paradox’. Decision Support Systems,5, 303-312.
31. Opricovic, S. and Tzeng, G. H. (2004). ‘Compromise Solution by MCDM Methods: A Comparative Analysis of VIKOR and TOPSIS’. European Journal of Operational Research, 156, 445-455.
32. Triantaphyllou, E. (1998). ‘Multi-criteria Decision Making Methods: An Operation Research Approach’. Encyclopedia of Electrical and Electronic, 15, 175-186.
33. Yoon, K. P.; Wang and Hwang C.L. (1995). ‘Multiple Attribute Decision Making: An Introduction’. Sage University Papers.
34. Yu, P.L. (1973).‘A class of solutions for group decision problems’. Management Science,19 (8), 936–946.
35. Zeleny, M. (2002). ‘Multiple Criteria Decision Making’. New York: McGraw Hill. 36. Opricovic, S. (1998). ‘Multicriteria Optimization of Civil Engineering Systems’. Faculty of Civil
Engineering, Belgrade. 37. Opricovic, S. and Tzeng, G. H. (2007). ‘Extended VIKOR Method in Comparison with Outranking
Methods’. European Journal of Operational Research, 178, 514-529. 38. Saaty, T.L. (1980). ‘The analytic hierarchy processes. New York: McGraw-Hill. 39. Murray R. S. (1968).‘Schaum's Outline of Mathematical Handbook of Formulas and Tables’. Schaum
Publishing Co 1st.ed. 40. Sheskin, D.J. (2004).‘Handbook of parametric and nonparametric statistical procedures. Chapman and
Hall /CRC. 41. Myers, J. L. and Well, A. D. (2003).‘Research Design and Statistical Analysis (2nd Ed.)’.Lawrence
Erlbaum. 42. Yurdakul M. and İç Y.T. (2009).‘Application of correlation test to criteria selection for Multi criteria
decision making (MCDM) models’. International Journal of Manufacturing Technology,40 (3-4):403-412.
145