SELECTION OF DNA APTAMERS TO HUMAN RED...
58
SELECTION OF DNA APTAMERS TO HUMAN RED BLOOD CELLS FOR DRUG DELIVERY Zerin Mahzabin Khan Research report submitted to the Department of Biochemistry, Microbiology and Immunology in partial fulfilment of the requirements for the course BCH 4040 University of Ottawa Ottawa, Ontario, Canada April 2016
-
Upload
truongkien -
Category
Documents
-
view
216 -
download
0
Transcript of SELECTION OF DNA APTAMERS TO HUMAN RED...
SELECTION OF DNA APTAMERS TO HUMAN RED BLOOD CELLS
FOR DRUG DELIVERY
Zerin Mahzabin Khan
Research report submitted to the Department of
Biochemistry, Microbiology and Immunology
in partial fulfilment of the requirements
for the course BCH 4040
University of Ottawa
Ottawa, Ontario, Canada
April 2016
ii
Abstract
Drug delivery systems have limitations that can be addressed by an appropriate drug
carrier. Red blood cells (RBC) can be drug carriers by coupling drugs to RBC surface using
affinity ligands like antibodies. Since antibodies have limitations in vivo, aptamers could replace
antibodies. Aptamers binding malaria infected RBC at room temperature (RT) have already been
identified for diagnostics. Our group previously developed DNA aptamers binding normal RBC
at RT for cell purification. Hence, there exists a need to develop aptamers binding RBC under
physiological conditions for in vivo applications. This study optimized and employed cell-
SELEX to identify aptamers binding RBC at 37°C. It was proposed these aptamers bind with
higher affinity at 37°C than RT. Optimization results revealed phire II polymerase, 15 cycles of
PCR, and eliminating a gel purification step for recovered aptamer pool after selection were all
optimal for isolating and enriching bound aptamers successfully. This study used the aptamer
pool with known binding to RBC at RT and subjected it to three rounds of cell-SELEX
comprising selection, amplification, exonuclease digestion, and gel purification to narrow the
pool further and isolate aptamers which also bind RBC at 37°C. The three pools were screened
for binding RBC with flow cytometry, and preliminary results showed second and third rounds
had a higher propensity to bind at 37°C than round one, indicating the original pool’s affinity for
binding at RT was changed. Since binding affinities at 37°C were only 0.01 relative fluorescence
units above autofluorescence of plain RBC and overlapped with binding affinities from the
negative control of randomized aptamer library sequences, the binding affinities of these
aptamers were deemed low. Thus, the protocol would need to be further optimized for a higher
aptamer yield. This improved cell-SELEX protocol can be employed for more rounds of cell-
SELEX to develop aptamers binding RBC at 37°C with higher affinities, which could be
conjugated to drugs and coupled to RBC for aptamer facilitated drug delivery by RBC. This new
intravascular drug delivery system may address limitations set forth by other drug delivery
systems, such as low blood residence times and off-target effects.

iii
Acknowledgments My sincerest gratitude to Dr. Maxim V. Berezovski for providing me with this opportunity to do my honors research project in his lab. This research opportunity was truly life changing, as it made me realize how much I wanted to continue doing research in a science/engineering field for my future career. I would also like to thank him for his guidance throughout the project and for answering my many questions. Many thanks are in order for Evan Bushnik (MSc Candidate) for his mentorship, input, and guidance. His support and encouragement motivated me as I completed my project. I would also like to thank him for sharing all of his reagents, for training me in lab equipment, and teaching technical skills which were invaluable for my project. I would also like to thank Shahrokh Ghobadloo (PhD Candidate) for his help with using the flow cytometer and also for providing advice whenever I needed it. Thank you also to Dr. Christopher Clouthier for his helpful suggestions for improving my project and protocol and for being kind enough to share his reagents. Many thanks to Ana Gargaun (PhD Candidate), Thao Nguyen (MSc Candidate), and the other members of the Berezovski Lab for their support, encouragement, and various advice. Thank you for being so welcoming, for making this experience memorable, and for providing comic relief when things became a little stressful. Finally, I am eternally grateful to my family for their love and support. I would like to thank my mom, Dr. Rukhsana Ahmed, and my dad, Dr. Zahirul Hasan Khan, for their encouragement as I pursued this endeavor and also for allowing me to express my distress whenever my experiments went awry. Of course they were right – most things work out in the end. Thank you also to my grandfather, Dr. Momtaz Uddin Ahmed, and to my grandmother, Mrs. Momena Ahmed, for their encouragement and support, even though we are separated by several thousand miles. And of course, thank you to my cat, Pancakes, who kept me company as I spent long hours alone working to complete this thesis.
iv
Table of Contents
Abstract ........................................................................................................................................................ ii
Acknowledgments ...................................................................................................................................... iii
Table of Contents ....................................................................................................................................... iv
List of Figures .............................................................................................................................................. v
Statement of Contribution ........................................................................................................................ vi
1. Introduction ............................................................................................................................................. 1
1.1 Red Blood Cells as a Drug Delivery System ................................................................................... 1
1.2 DNA Aptamers Rival Antibodies for In Vivo Applications ........................................................... 3
1.3 In Vitro Selection of DNA Aptamers by Cell-SELEX Method...................................................... 4
1.4 DNA Aptamers for In Vivo Applications ........................................................................................ 6
1.5 DNA Aptamers against Red Blood Cells for In Vivo Applications ............................................... 8
2. Methods .................................................................................................................................................. 10
2.1 Optimization of Cell-SELEX and Purification of 7th Round Aptamer Pool .............................. 10
2.2 Overview of Cell-SELEX Procedure ............................................................................................. 11
2.3 Selection of DNA Aptamers against Red Blood Cells .................................................................. 12
2.4 Enriching Aptamer Pool by Symmetric PCR ............................................................................... 13
2.5 Digestion of dsDNA Aptamers by Lambda Exonuclease into ssDNA Aptamers ...................... 14
2.6 Purification by Agarose Gel Electrophoresis ............................................................................... 15
2.7 Preparing DNA Aptamers from Cell-SELEX for Flow Cytometry Analysis ............................ 15
2.8 PCR and Digestion Verifications ................................................................................................... 17
3. Results .................................................................................................................................................... 18
3.1 Optimal PCR Amplification Protocol and Purification in Cell-SELEX .................................... 18
3.2 Three Rounds of Cell-SELEX for Aptamers against RBC Binding at 37°C ............................. 23
3.3 Binding Affinities from Flow Cytometry after Three Rounds of Cell-SELEX ......................... 24
3.4 Binding Affinity from Flow Cytometry for 100 nM Aptamer Library ...................................... 26
4. Discussion............................................................................................................................................... 27
5. References .............................................................................................................................................. 41
6. Appendix ................................................................................................................................................ 47
6.1 Supplementary Figures .................................................................................................................. 47
v
List of Figures
Figure 1. Direct encapsulation of therapeutic agents inside RBC. ......................................................... 2 Figure 2. Schematic representation of aptamer binding to its target. .................................................... 4 Figure 3. The general in vitro SELEX procedure used to develop aptamers that bind a target with high affinity and specificity ........................................................................................................................ 5 Figure 4. Schematic representation of aptamer-drug conjugates........................................................... 8 Figure 5. Schematic diagram of modified cell-SELEX procedure used to isolate aptamers binding to RBC at room temperature and 37°C....................................................................................................... 12 Figure 6. Gated population of plain RBC used for flow cytometry. ..................................................... 17 Figure 7. Post digestion gel electrophoresis results with two different polymerases.. ........................ 18 Figure 8. Round 1 post selection gel electrophoresis of aptamer pool amplified with GC rich polymerase.. ............................................................................................................................................... 19 Figure 9. PCR verification for amplification with GC rich polymerase.. ............................................ 20 Figure 10. Round 1 post digest gel electrophoresis of aptamer pool amplified with phire II polymerase.. ............................................................................................................................................... 21 Figure 11. PCR and digestion verifications with agarose gel electrophoresis. .................................... 22 Figure 12. Post digest gel electrophoresis for rounds 1 to 3 of cell-SELEX ......................................... 24 Figure 13. Flow cytometry results for binding affinities of the aptamer pools from rounds 1 to 3 and the negative controls. ................................................................................................................................ 25 Figure 14. Flow cytometry results for binding affinities of 100 nM aptamer library. ........................ 26 Figure S1. R7 post digest gel electrophoresis with phire II polymerase.. ............................................ 47 Figure S2 Post digest gel electrophoresis for rounds 1 to 3 of cell-SELEX. ........................................ 48 Figure S3. Flow cytometry results for binding affinities of the aptamer pools from rounds 1 and 3 and the negative controls. ......................................................................................................................... 49 Figure S4. Flow cytometry for 10 rounds of cell-SELEX for aptamers binding RBC at RT.. .......... 50 Figure S5. DNA aptamer elutions from R7 post digest gel purification. ............................................. 51 Figure S6. DNA aptamers remaining in agarose gel after elution with PBS buffer. .......................... 51 Figure S7. Separation of RBC and buffer after incubation. ................................................................. 52

vi
Statement of Contribution
Conception:
Shahrokh Ghobadloo (PhD Candidate) and Dr. Maxim V. Berezovski originated the idea and
developed the cell-SELEX protocol for isolating aptamers against normal human white blood
cells for binding at room temperature. Evan Bushnik (MSc Candidate) and Dr. Maxim V.
Berezovski originated the idea for modifying the cell-SELEX protocol to develop aptamers
against normal human red blood cells binding at room temperature.
Zerin Mahzabin Khan originated the idea for modifying the existing cell-SELEX protocol to
develop DNA aptamers that can bind to red blood cells under physiological conditions, such as
binding at 37°C. Zerin Mahzabin Khan, Evan Bushnik, and Dr. Maxim V. Berezovksi all
contributed to modifying the experimental design for isolating aptamers that can bind to red
blood cells at 37°C. Dr. Christopher Clouthier also contributed to improve the modified protocol
for better yield of DNA aptamers binding to RBC at 37°C.
Experimental:
The 7th round aptamer pool with high binding affinity to red blood cells at room temperature
shown in Figure S4 in the Appendix was developed by Evan Bushnik and used to start the cell-
SELEX procedure in this study and. All of the optimization experiments, the three rounds of
cell-SELEX for developing aptamers against RBC binding at 37°C, and preparation of the
samples for flow cytometry were conducted by Zerin Mahzabin Khan. All of the flow cytometry
results were generated by Zerin Mahzabin Khan in association with Shahrokh Ghobadloo and
Evan Bushnik.
Writing:
This thesis was originally written and edited by Zerin Mahzabin Khan.
1
1. Introduction 1.1 Red Blood Cells as a Drug Delivery System
Current drug delivery systems have several limitations, which can be addressed by choosing
an appropriate drug carrier for efficient delivery and release of therapeutic agents in the body.
Therapeutic efficacy can be improved by improving the drug delivery system in order to reduce any
undesired immune responses, side effects, premature inactivation, degradation, or elimination of the
drug from the body (Biagiotti et al, 2011). Some drug carriers already used in delivery systems
include liposomes, lipoproteins, polymers, and red blood cells (RBC), and among these carriers, drug
delivery by RBC presents a safe and advantageous option (Biagiotti et al, 2011).
Drug delivery systems with autologous RBC are particularly advantageous due to their non-
immunogenicity and biocompatibility (Magnani et al, 2002). RBC have an extensive circulatory
system and travel through a large area of the body with a long circulatory half-life of 120 days (Shi et
al, 2014). Although free floating drugs can stay in the bloodstream for a few hours to a day and
coupling drugs to nanoparticles and carriers can prolong the drugs’ presence to several days, using
RBC as carriers can prolong a drug’s stay in bloodstream to several weeks (Borman, 2014),
especially since compared to synthetic carriers, RBC have a much longer lifespan in circulation.
Since drug delivery of therapeutic agents like genes, peptides, and oligonucleotides is challenging
due to their instability in biofluids (Magnani et al, 2002), using RBC as carriers can solve this
problem. RBC are also biodegradable, and the natural elimination of RBC also make them an
attractive drug carrier, since they have a built-in mechanism to eliminate the drug (Muzykantov,
2010).
Research into using RBC as drug carriers began in the 1970s (Ihler et al, 1973), with much
progress made in designing various RBC facilitated drug delivery strategies since then. Since RBC
already act as natural carriers by encapsulating oxygen bound by hemoglobin, one strategy is direct
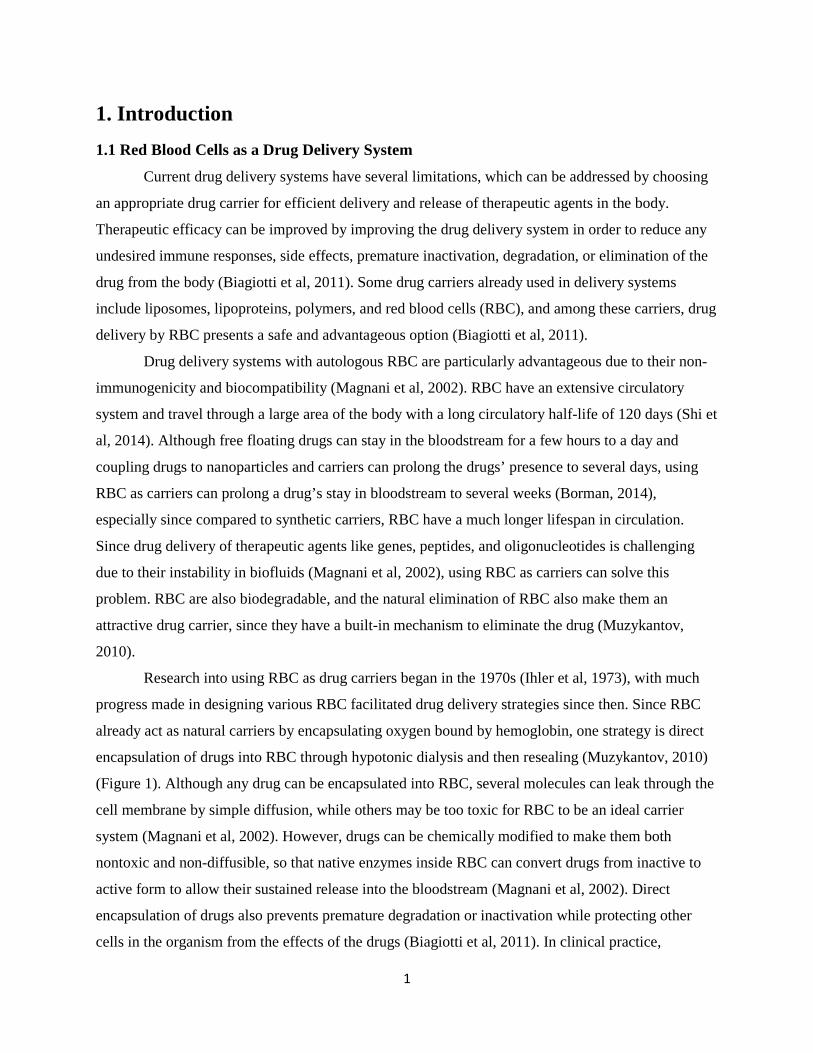
encapsulation of drugs into RBC through hypotonic dialysis and then resealing (Muzykantov, 2010)
(Figure 1). Although any drug can be encapsulated into RBC, several molecules can leak through the
cell membrane by simple diffusion, while others may be too toxic for RBC to be an ideal carrier
system (Magnani et al, 2002). However, drugs can be chemically modified to make them both
nontoxic and non-diffusible, so that native enzymes inside RBC can convert drugs from inactive to
active form to allow their sustained release into the bloodstream (Magnani et al, 2002). Direct
encapsulation of drugs also prevents premature degradation or inactivation while protecting other
cells in the organism from the effects of the drugs (Biagiotti et al, 2011). In clinical practice,
2
glucocorticoids like dexamethasone have been successfully delivered through encapsulation inside
RBC, since these drugs need to be released in low and effective doses over a long period of time to
treat diseases such as chronic obstructive pulmonary disease (Rossi et al, 2001). On the other hand,
encapsulation of drugs disrupts the integrity of the plasma membrane, which reduces the circulatory
half-life of these modified RBC (Murciano et al, 2003; Zaitsev et al, 2010) and affects their
biocompatibility (Alvarez et al, 1996).
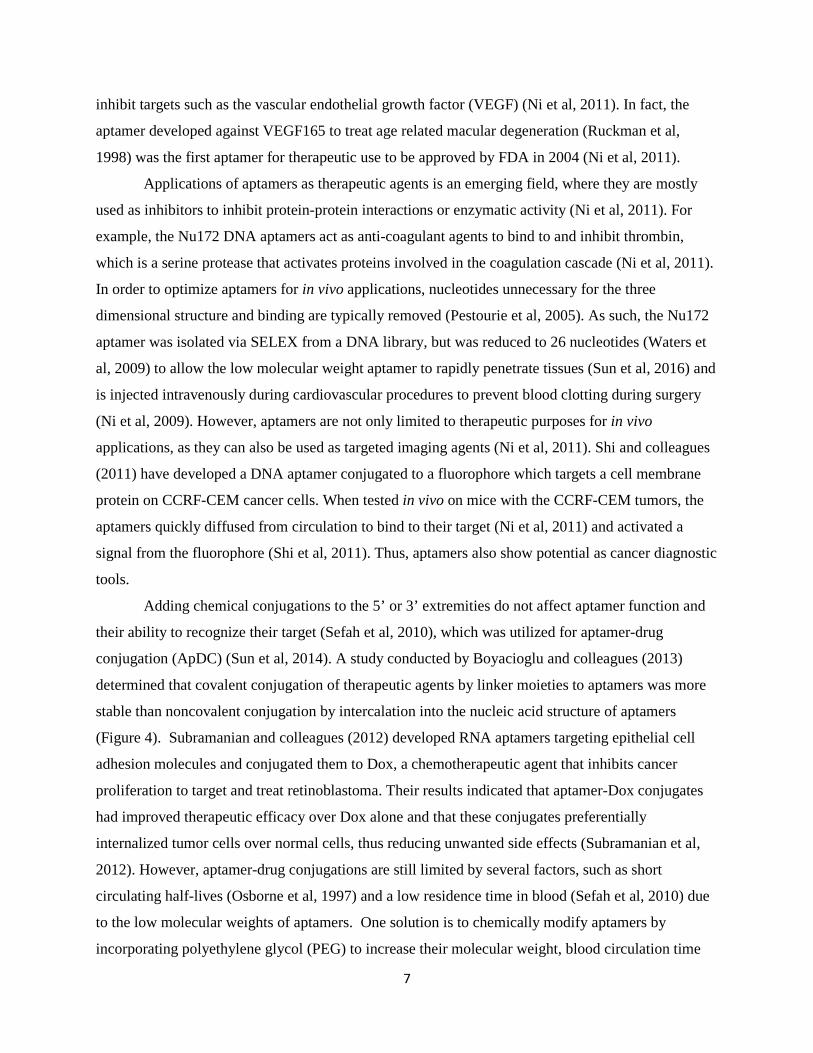
Figure 1. Direct encapsulation of therapeutic agents inside RBC (Magnani et al, 2002). The RBC pores are opened by dialysis with a saline solution to allow drugs to pass through. Membrane pores are resealed by restoring the osmolarity, and the cells are subsequently washed to eliminate any drugs that were not encapsulated inside.
The disadvantages associated with direct encapsulation of drugs into RBC can be
circumvented by using an alternative method for drug loading. RBC have a large surface area of 140
µM2 (Shi et al, 2014), which can be used to anchor therapeutic molecules without compromising
either the integrity or biocompatibility of RBC (Muzykantov, 2010). Therapeutic agents like
enzymes are more active when bound to the cell surface than when they are inside the RBC
(Magnani et al, 1992). Drugs can be loaded by either chemically coupling them to the RBC surface
by noncovalent/covalent means or by coupling the agents to receptors on the surface membrane
(Muzykantov, 2010). Shi and colleagues (2014) have recently engineered RBC with sortase
modifiable proteins on the plasma membrane, which can carry drugs by a sortase-mediated site
specific covalent attachment of payloads to these specific proteins on the RBC surface. This new
technology is currently in the process of being commercialized by the biotechnology firm Rubius
(Borman, 2014). The sortase method of coupling drugs onto RBC still poses several problems,
namely that genetically engineered RBC are not natural and issues with biocompatibility may arise.
Additionally, the therapeutic agent can detach from the RBC while the RBC is circulating through
the body (Muzykantov, 2010).

3
These problems can be addressed by using an alternative method for anchoring drugs onto
RBC surface: by conjugating therapeutic agents to affinity ligands attached to the surface of RBC
(Muzykantov, 2010). Several proof-of-principle studies have proposed using antibodies conjugated
to RBC surface to anchor therapeutic agents as cargoes and deliver them to intravascular targets
(Smirnov et al, 1996; Muzykantov et al, 1987). In the last decade, antibodies conjugated to RBC for
drug delivery have not been further investigated, since ex vivo modifications on RBC are required to
be able to conjugate the antibodies to the RBC surface (Muzykantov, 2010). Additionally, using
protein antibodies for in vivo applications are hindered by several factors, such as their thermal
instability, high immunogenicity, high production costs, and the laborious methods required to
chemically modify them (Sun et al, 2014). Antibodies are also sensitive to temperature and can
irreversibly denature, leading to a limited shelf life (Jayasena, 1999). Although antibodies are
currently used for molecular recognition and diagnostic testing in clinical practice, in the last two
decades aptamers have emerged as an advantageous alternative to antibodies for therapeutics (Sun
and Zhu, 2015).
1.2 DNA Aptamers Rival Antibodies for In Vivo Applications
Aptamers are short, synthetic single stranded DNA or RNA (ssDNA/ssRNA)
oligonucleotides which can form unique secondary or tertiary structures to bind specifically to target
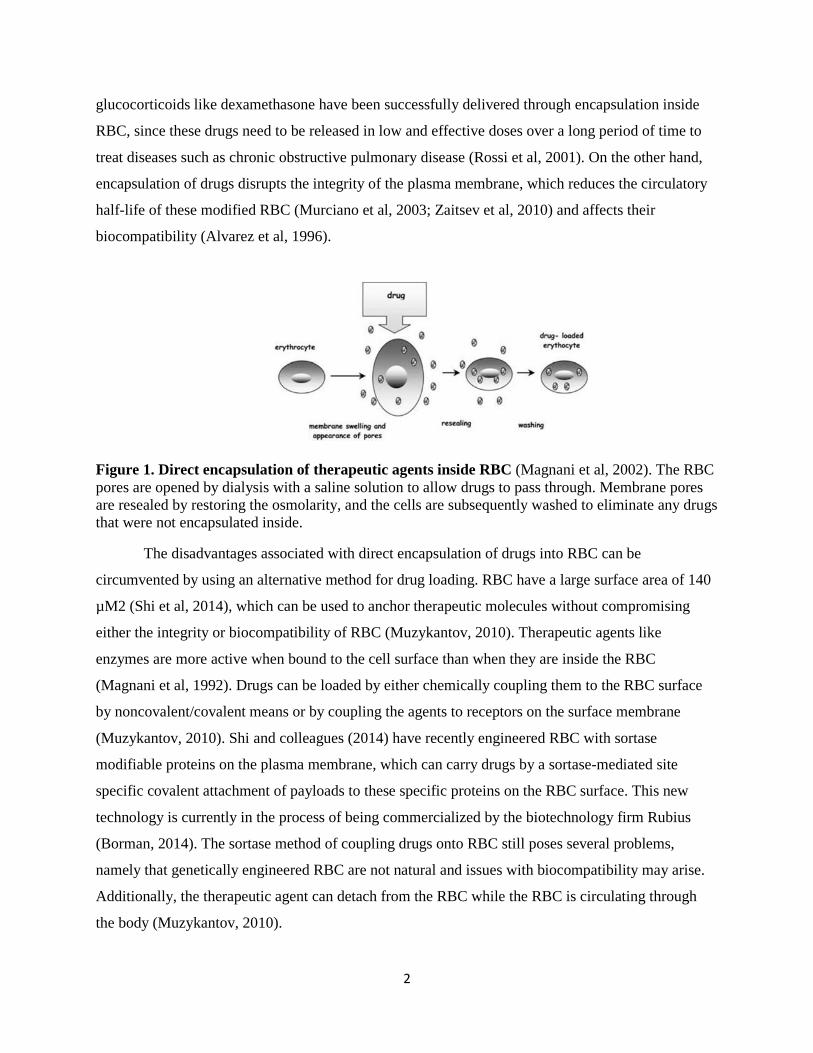
molecules (Ni et al, 2011). Unlike other nucleic acid molecular probes, aptamers use structural
recognition to bind to and interact with their target by folding into specific three dimensional
structures (Figure 2) with dissociation constants in the picomolar and nanomolar range (Nimjee et al,
2005), an affinity similar to antibodies (Sun et al, 2016). Aptamers were coined from the Latin word
aptus, meaning “to fit”, since they bind to their targets with such a high affinity and specificity, like a
key fitting into a lock (Ellington and Szostak, 1990). In fact, aptamer specificity can be higher than
antibodies (Jenison et al, 1994), because their smaller size allows them to distinguish between
different functional groups in similar structure molecules (Jo et al, 2011). For example, aptamers
have been developed to distinguish between the presence and absence of a methyl group on
theophylline (Jenison et al, 1994). Aptamers can bind to a variety of targets, ranging from large
molecules such as nucleic acid structures and proteins, to small molecules like antibiotics and amino
acids (Pestourie et al, 2005). Compared to antibodies, aptamers are more thermally stable with a
higher shelf life, and their denaturation/renaturation can be controlled (Jayasena, 1999). Since
aptamers can be chemically synthesized and modified according to their desired targets and
applications (Ni et al, 2011), they are rendered the name “chemical antibodies” (Sun et al, 2016).
4
Most importantly, the non-immunogenicity of aptamers (Ni et al, 2001) make them ideal alternatives
to antibodies for in vivo applications.
Figure 2. Schematic representation of an aptamer binding to its target (Sun et al, 2014). Aptamers use structural recognition to bind specifically to their target by folding into unique three dimensional secondary and tertiary structures.
Even though there is no difference in affinity between DNA or RNA aptamers to their targets
(Breaker, 1997), DNA aptamers are preferred over RNA for their stability (Marimuthu et al, 2012).
RNA aptamers form more stable three dimensional structures due to strong intrastrand RNA-RNA
interactions (Ni et al, 2011), yet the 2’ hydroxyl increases their reactivity, which can lead to
formation of cyclic-2’,3’-phosphate and result in their degradation by nucleases (Wiegand et al,
1996). Thus, RNA aptamers are more costly, since they require modified nucleotides to ensure
stability (Ni et al, 2011). In contrast, DNA aptamers have better thermodynamic and chemical
stability, especially due to the beta form of the helix structure (Ni et al, 2011). Only ssDNA can be
used as aptamers, as opposed to double stranded DNA (dsDNA). Single stranded DNA can form a
variety of structures for binding to different target molecules, because they have unpaired sites and
can form stable secondary structures like pseudoknots, hairpin structures, and quadruplex structures
with G-quartets (Tuerk et al, 1992; Jing et al, 1997). These conformations are needed for DNA
aptamers to be able to recognize and interact with molecules on the target (Patel et al, 1997), but
dsDNA cannot adopt these conformations, as they do not possess unpaired regions due to their
double helix formation (Marimuthu et al, 2012).
1.3 In Vitro Selection of DNA Aptamers by Cell-SELEX Method
DNA aptamers are selected by Systematic Evolution of Ligands by Exponential Enrichment
(SELEX), a method that was independently developed by two groups (Ellington and Szostak, 1990;
Tuerk and Gold, 1990) to isolate nucleic acid species that bind specific ligands from a pool of
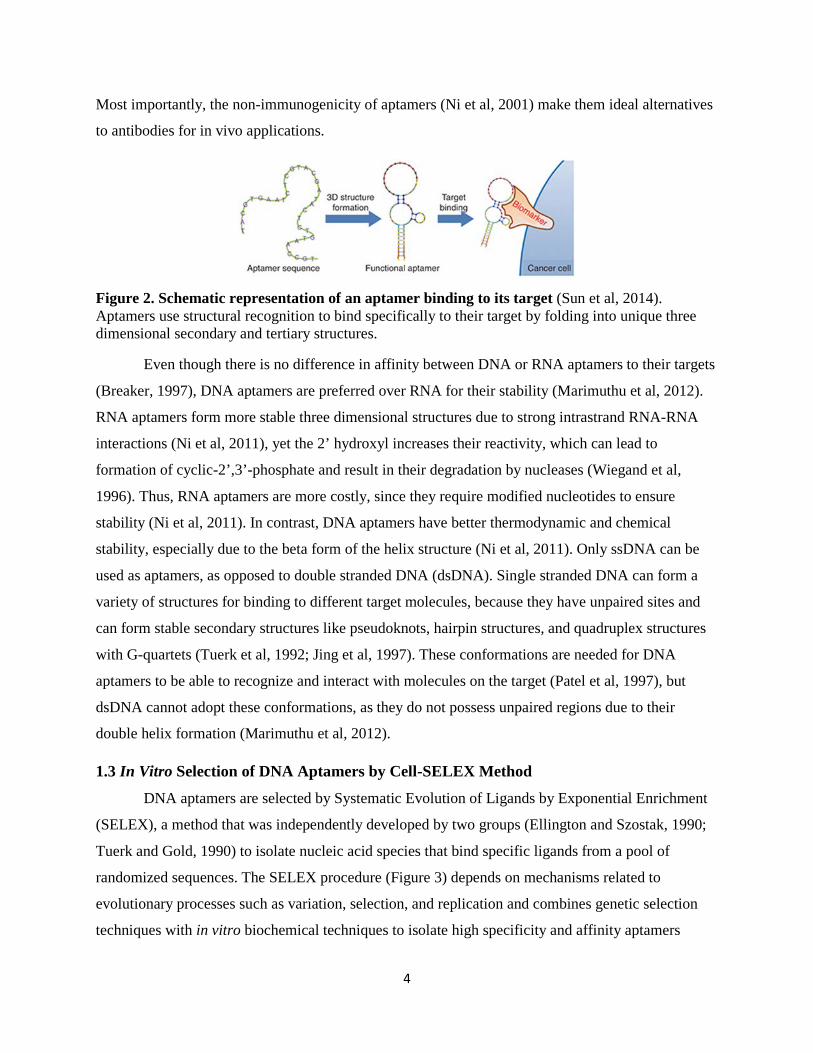
randomized sequences. The SELEX procedure (Figure 3) depends on mechanisms related to
evolutionary processes such as variation, selection, and replication and combines genetic selection
techniques with in vitro biochemical techniques to isolate high specificity and affinity aptamers
5
against their target (Tuerk and Gold, 1990). SELEX for DNA aptamers begins with ssDNA library
containing randomized sequences with 20 – 100 nucleotides, which are capped with a constant
sequence on both ends for primer hybridization (Ni et al, 2011). A typical aptamer library has a
complexity of 1014 to 1015 different sequences that can fold into a variety of structures (Pestourie et
al, 2005) and this random pool of aptamers are exposed to the target to allow some of the aptamers to
fold in such a way so that they bind specifically to the target (Ni et al, 2011). Findings from Ellington
and Szostak (1990) indicated that about one RNA sequence in a library with 1010 random sequences
fold in such a way so as to have specific binding to the target ligand. After incubation with the target,
aptamers that did not bind are removed, while the aptamers that did bind are selected and enriched
through PCR amplification to have a pool large enough to expose to the target again and repeat the
process (Ellington and Szostak, 1990). Multiple rounds of SELEX allow an enrichment with
exponential increase in the best binding aptamers until the pool converges to specific sequences with
the highest affinity to the target (Tuerk and Gold, 1990). The aptamers in libraries can be conjugated
with small fluorophores that do not affect their binding to allow flow cytometry to be used to assess
the binding affinity of the aptamers against their targets (Jayasena, 1999). The enriched pool is then
sequenced, and specific aptamer candidates are tested against the target to determine their binding
affinities and dissociation constants (Sefah et al, 2010).
Figure 3. The general in vitro SELEX procedure used to develop aptamers that bind a target with high affinity and specificity (Ni et al, 2011). An aptamer library of randomized sequences are incubated with a target, and the bound aptamers are subsequently separated from the unbound aptamers and amplified, after which point the enriched aptamer pool is subjected to another round. Individual SELEX procedures can be modified and the selection conditions can be altered to develop aptamers for particular applications, but general SELEX protocols involve repeated steps of selection and enrichment of target aptamers.

6
Even though SELEX is typically performed against a purified target molecule, Vant-Hull and
colleagues (1998) had proposed that complex heterogeneous targets can also be used for selecting
specific aptamers. This theory was proven to be correct when aptamers were selected against human
RBC membrane ghosts consisting of lysed RBC with membrane proteins (Morris et al, 1998). They
were able to use SELEX to generate aptamers which could bind to a complex mixture with multiple
targets with a similar affinity to aptamers that bind to specific protein targets (Morris et al, 1998).
Thus, the findings from this research eventually led to the identification of aptamers against live
African trypanosomes (Homann and Goringer, 1999) and paved the way for cell-SELEX, which
isolates aptamers against whole live cells for target recognition of the complex extracellular surface
(Sefah et al, 2010). Aptamers selected against whole live cells offer numerous advantages over
aptamers selected against specific purified extracellular targets. Prior knowledge of the aptamer
target need not be known and purified for selection (Sefah et al, 2010), and since aptamer pools with
many different sequences are used instead of individual aptamer clones, multiple aptamers can be
isolated against different targets on the cell (Berezovski et al, 2008). The cell membrane surface is
complex with multiple molecules, each of which can potentially be a target (Sefah et al, 2010) and
thus rendering the cell-SELEX method as a multiple set of simultaneous selections, where the
competition of aptamers binding to one target site is independent of competition of aptamers binding
to another target site (Morris et al, 1998). Most importantly, cell-SELEX conserves the membrane
proteins of cells (Pestourie et al, 2005) and allows the aptamers to adopt natural folding structures to
bind to the native state of molecules on the cell surface, similar to conditions in vivo (Sefah et al,
2010).
1.4 DNA Aptamers for In Vivo Applications
Aptamers are synthetic and developed through in vitro techniques, yet in nature there exists
in vivo “natural aptamers” in the form of riboswitches, which are components of an mRNA
transcript that regulate transcription by binding to ligands (Mironov et al, 2002). Riboswitches
contain an aptamer domain that allows them to adopt a three dimensional fold to scaffold and bind to
the ligand with high affinity (Winkler and Breaker, 2003). When aptamers with high affinity bind to
proteins, they often can inhibit the function of the protein, as the aptamer interaction may overlap
with the binding site of the natural ligand (Morris et al, 1998). Tuerk and Gold (1990) had proposed
that this ability of aptamers can be used to inhibit replicative proteins of infections to stop the spread
of infections. Since its discovery in the 1990s, aptamers have been investigated for applications in
diseases, and more recently in the last two decades, aptamers have been clinically developed to
7
inhibit targets such as the vascular endothelial growth factor (VEGF) (Ni et al, 2011). In fact, the
aptamer developed against VEGF165 to treat age related macular degeneration (Ruckman et al,
1998) was the first aptamer for therapeutic use to be approved by FDA in 2004 (Ni et al, 2011).
Applications of aptamers as therapeutic agents is an emerging field, where they are mostly
used as inhibitors to inhibit protein-protein interactions or enzymatic activity (Ni et al, 2011). For
example, the Nu172 DNA aptamers act as anti-coagulant agents to bind to and inhibit thrombin,
which is a serine protease that activates proteins involved in the coagulation cascade (Ni et al, 2011).
In order to optimize aptamers for in vivo applications, nucleotides unnecessary for the three
dimensional structure and binding are typically removed (Pestourie et al, 2005). As such, the Nu172
aptamer was isolated via SELEX from a DNA library, but was reduced to 26 nucleotides (Waters et
al, 2009) to allow the low molecular weight aptamer to rapidly penetrate tissues (Sun et al, 2016) and
is injected intravenously during cardiovascular procedures to prevent blood clotting during surgery
(Ni et al, 2009). However, aptamers are not only limited to therapeutic purposes for in vivo
applications, as they can also be used as targeted imaging agents (Ni et al, 2011). Shi and colleagues
(2011) have developed a DNA aptamer conjugated to a fluorophore which targets a cell membrane
protein on CCRF-CEM cancer cells. When tested in vivo on mice with the CCRF-CEM tumors, the
aptamers quickly diffused from circulation to bind to their target (Ni et al, 2011) and activated a
signal from the fluorophore (Shi et al, 2011). Thus, aptamers also show potential as cancer diagnostic
tools.
Adding chemical conjugations to the 5’ or 3’ extremities do not affect aptamer function and
their ability to recognize their target (Sefah et al, 2010), which was utilized for aptamer-drug
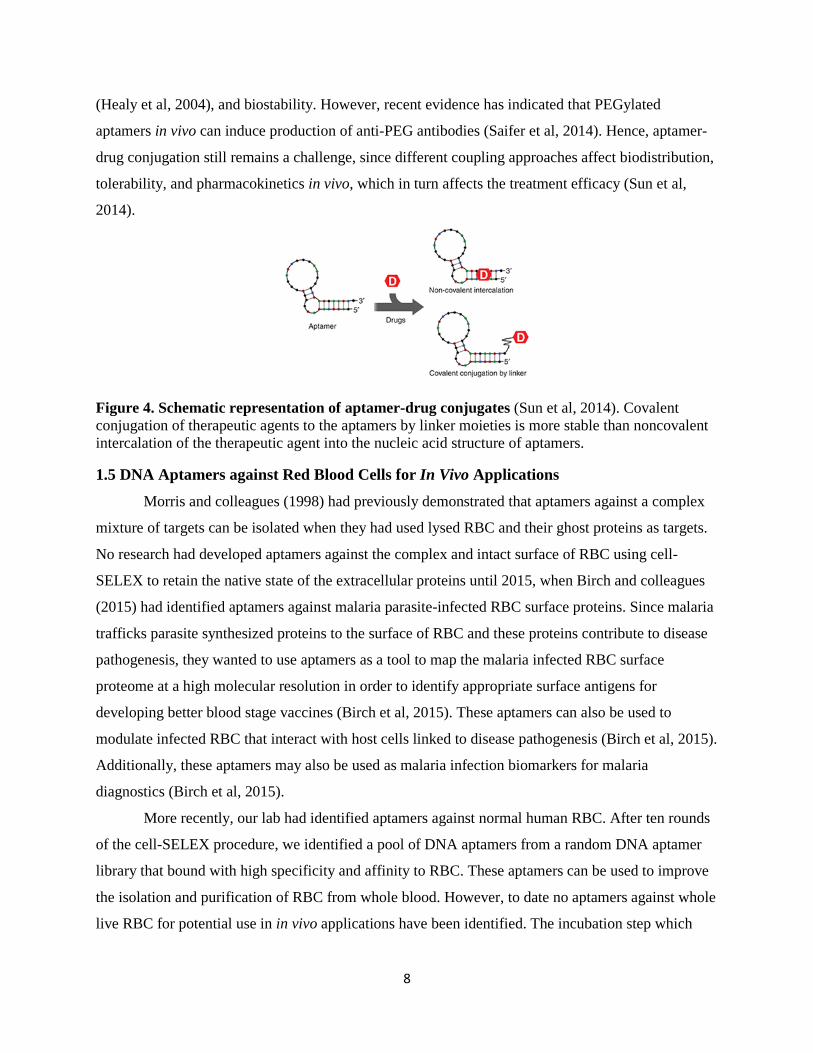
conjugation (ApDC) (Sun et al, 2014). A study conducted by Boyacioglu and colleagues (2013)
determined that covalent conjugation of therapeutic agents by linker moieties to aptamers was more
stable than noncovalent conjugation by intercalation into the nucleic acid structure of aptamers
(Figure 4). Subramanian and colleagues (2012) developed RNA aptamers targeting epithelial cell
adhesion molecules and conjugated them to Dox, a chemotherapeutic agent that inhibits cancer
proliferation to target and treat retinoblastoma. Their results indicated that aptamer-Dox conjugates
had improved therapeutic efficacy over Dox alone and that these conjugates preferentially
internalized tumor cells over normal cells, thus reducing unwanted side effects (Subramanian et al,
2012). However, aptamer-drug conjugations are still limited by several factors, such as short
circulating half-lives (Osborne et al, 1997) and a low residence time in blood (Sefah et al, 2010) due
to the low molecular weights of aptamers. One solution is to chemically modify aptamers by
incorporating polyethylene glycol (PEG) to increase their molecular weight, blood circulation time
8
(Healy et al, 2004), and biostability. However, recent evidence has indicated that PEGylated
aptamers in vivo can induce production of anti-PEG antibodies (Saifer et al, 2014). Hence, aptamer-
drug conjugation still remains a challenge, since different coupling approaches affect biodistribution,
tolerability, and pharmacokinetics in vivo, which in turn affects the treatment efficacy (Sun et al,
2014).
Figure 4. Schematic representation of aptamer-drug conjugates (Sun et al, 2014). Covalent conjugation of therapeutic agents to the aptamers by linker moieties is more stable than noncovalent intercalation of the therapeutic agent into the nucleic acid structure of aptamers.
1.5 DNA Aptamers against Red Blood Cells for In Vivo Applications
Morris and colleagues (1998) had previously demonstrated that aptamers against a complex
mixture of targets can be isolated when they had used lysed RBC and their ghost proteins as targets.
No research had developed aptamers against the complex and intact surface of RBC using cell-
SELEX to retain the native state of the extracellular proteins until 2015, when Birch and colleagues
(2015) had identified aptamers against malaria parasite-infected RBC surface proteins. Since malaria
trafficks parasite synthesized proteins to the surface of RBC and these proteins contribute to disease
pathogenesis, they wanted to use aptamers as a tool to map the malaria infected RBC surface
proteome at a high molecular resolution in order to identify appropriate surface antigens for
developing better blood stage vaccines (Birch et al, 2015). These aptamers can also be used to
modulate infected RBC that interact with host cells linked to disease pathogenesis (Birch et al, 2015).
Additionally, these aptamers may also be used as malaria infection biomarkers for malaria
diagnostics (Birch et al, 2015).
More recently, our lab had identified aptamers against normal human RBC. After ten rounds
of the cell-SELEX procedure, we identified a pool of DNA aptamers from a random DNA aptamer
library that bound with high specificity and affinity to RBC. These aptamers can be used to improve
the isolation and purification of RBC from whole blood. However, to date no aptamers against whole
live RBC for potential use in in vivo applications have been identified. The incubation step which

9
allows aptamers to bind to the RBC was performed at room temperature for both identifying the
aptamers against malaria infected RBC (Birch et al, 2015) and the aptamers our lab had identified
against normal RBC. Nucleic acid folding is sensitive to several factors, including pH, divalent
cations, salt, and temperature (Jayasena, 1999). Hence, it is important to conduct the incubation step
of cell-SELEX under physiological conditions when isolating aptamers that need to be able to bind to
the target in vivo. As such, this project aims to mitigate this gap by identifying aptamers which can
bind to normal human RBC under physiological conditions for potential use in in vivo applications,
such as for aptamer facilitated drug delivery by RBC.
As outlined before, simple aptamer-drug conjugates have several limitations, such as short
circulating half-lives. Increasing the circulating half-lives by PEGylation introduces other undesired
side effects, such as PEG-antibodies. Coupling RBC to an aptamer already conjugated to a drug can
increase the blood residence time of the drug without any immunogenic effects, which would
especially be useful for inflammatory diseases, such as thrombin (Borman, 2014). The aptamer
facilitated drug delivery system with RBC can also be dynamic and help deliver complex
therapeutics like enzymes, which need to be delivered to a precise target for localization
(Muzykantov, 2010). For example, bi-specific aptamers which can target different cells have recently
been developed by using a dsDNA linker to conjugate two different DNA aptamers (Zhu et al, 2012).
The Dox drug was intercalated into the dsDNA linker, and the bi-specific aptamer was able to
recognize both cell targets with the same affinity and specificity (Zhu et al, 2012). This knowledge
can be harnessed to optimize the aptamer facilitated drug delivery system by developing a bi-specific
aptamer in which one aptamer binds to the RBC and anchors the drug, while the other aptamer
targets a particular cell to localize the drug. Using such a drug delivery system with RBC as carriers
has numerous advantages. RBC typically do not undergo extravasation from circulation into tissues,
and this system can deliver therapeutic agents to intravascular targets (Muzykantov, 2010) with high
specificity and optimal localization can be further achieved with bi-specific aptamers.
Although this study does not design the drug delivery system with aptamer-drug conjugated
to RBC, it does focus on developing the aptamer that can bind to the RBC to anchor the other
components of the delivery system to the RBC carrier. The goal of this study was to take the pool of
DNA aptamers known binding to RBC at room temperature and further narrow the pool to aptamers
that can also bind under the physiological temperature of 37°C. It is proposed that the aptamers can
indeed bind at 37°C to the RBC, since an aptamer had previously been FDA approved for treating
macular degeneration in vivo and is known to bind at 37°C. However, it is also proposed that not all
the aptamers that bind to the RBC at room temperature will also be able to bind at 37°C, since

10
lowering the temperature of the buffer during aptamer binding allows the formation of complex
motifs like junctions, loops, and bulges that are otherwise unstable at higher temperatures (Tinoco
and Bustamante, 1999). Thus, if successful, the aptamers isolated from this study can bind to normal
human RBC at both room temperature and the physiological temperature. These aptamers can then
be used for aptamer facilitated drug delivery by RBC, as it is particularly important that the aptamers
are able to bind at room temperature for facilitating the conjugation of the aptamer to the RBC ex
vivo, then ensuring the aptamers remain bound to RBC at 37°C when the drug delivery system is
injected into the body in vivo.
2. Methods 2.1 Optimization of Cell-SELEX and Purification of 7th Round Aptamer Pool
In our research group, ten rounds of positive selection of cell-SELEX as described by Sefah
and colleagues (2010) was performed by Evan Bushnik to isolate DNA aptamers that bind to red
blood cells (RBC) at room temperature (RT). The binding affinity for each aptamer pool was verified
using flow cytometry (Figure S4A in Appendix) and the results indicated that the 7th round aptamer
pool bound to the RBC with the highest affinity. This 7th round DNA aptamer pool was evolved
from a library of ssDNA aptamers (Integrated DNA Technologies) with length of 80 nucleotides. The
40 nucleotides in the middle of the sequence were randomized and conferred the unique structure in
binding for each aptamer, while the 5’ and 3’ ends were flanked by primer hybridization consensus
sequences of 20 nucleotides each. Cy-5 fluorophore was also conjugated to the 5’ end of each
aptamer. Thus, the general sequences of the library were: 5’-/5Cy5/CTC CTC TGA CTG TAA CCA
CG(N1)[(N1) x 39] GCA TAG GTA GTC CAG AAG GC-3’. The 7th round aptamer pool was used
to optimize the cell-SELEX procedure prior to using this pool to identify aptamers which can also
bind to RBC at 37°C.
The optimal polymerase for PCR was first determined by comparing amplification of the
aptamer pool with both phire II polymerase (Thermo Scientific) and Accuprime GC Rich DNA
polymerase (Invitrogen). The PCR protocol used for phire II polymerase was as described in section
2.4, except the number of PCR cycles was 30 in this case. The GC rich polymerase PCR reaction
mixture (Thermo Scientific) containing the following reagents in their final concentrations were used
for amplification: 1X GC rich reaction buffer (300-mM Tris-HCl (pH 9.2), MgSO4 at 10 mM, 1 mM
dNTP, 150 mM NaCl), 0.4 µM of the Cy-5 labelled forward primers, 0.4 µM of the reverse primers,
and 2U of GC rich DNA polymerase. For each 50 µL PCR reaction, 45 µL of this reaction mixture
11
was combined with 5µL of DNA template consisting of the 7th round DNA aptamer pool. Total four
reaction tubes were prepared for amplification and the samples were run with the following
thermocycler (Eppendorf) program: initial denaturing for 3 minutes at 95°C, then followed by 30
cycles of denaturing at 95°C for 30 seconds + annealing for 30 seconds at 58°C + extending for 15
seconds at 72°C, then final extension at 72°C for 3 minutes, and ending with cooling to 4°C. The
amplified products from both polymerases were digested by lambda exonuclease as described by
section 2.5. The ssDNA aptamer bands were visualized by agarose gel electrophoresis as described
by section 2.6. Band densitometries were calculated using Alphaview software to determine the band
intensities. Each band was extracted and purified according to the protocol described in section 2.6.
The purified aptamer pool was subjected to selection against RBC as described in section 2.3.
For the aptamers amplified by phire II polymerase, the cell-SELEX was performed as described by
sections 2.4 to 2.6. For the aptamers amplified with GC rich polymerase, an additional gel
electrophoresis step as described by section 2.6 was performed immediately after selection. The only
modification to this gel electrophoresis step was that 2% agarose gel was used. The optimal number
of PCR cycles with phire II polymerase was determined by running a PCR verification step, as
described in section 2.8. One set of PCR verification was conducted with 15 cycles of PCR, while the
other was conducted with 30 cycles of PCR. Once the optimal polymerase, optimal number of PCR
cycles, and whether presence or absence of the extra gel purification step after selection were optimal
was determined, the 7th round aptamer pool was purified with the optimized procedure. The 7th
round aptamer pool was therefore first amplified as described in section 2.4, then digested with
lambda exonuclease as described in section 2.5, and then agarose gel electrophoresis, extraction, and
purification of the sample was performed as described in section 2.6. The sample was then run
through the cell-SELEX procedure as described in section 2.2.
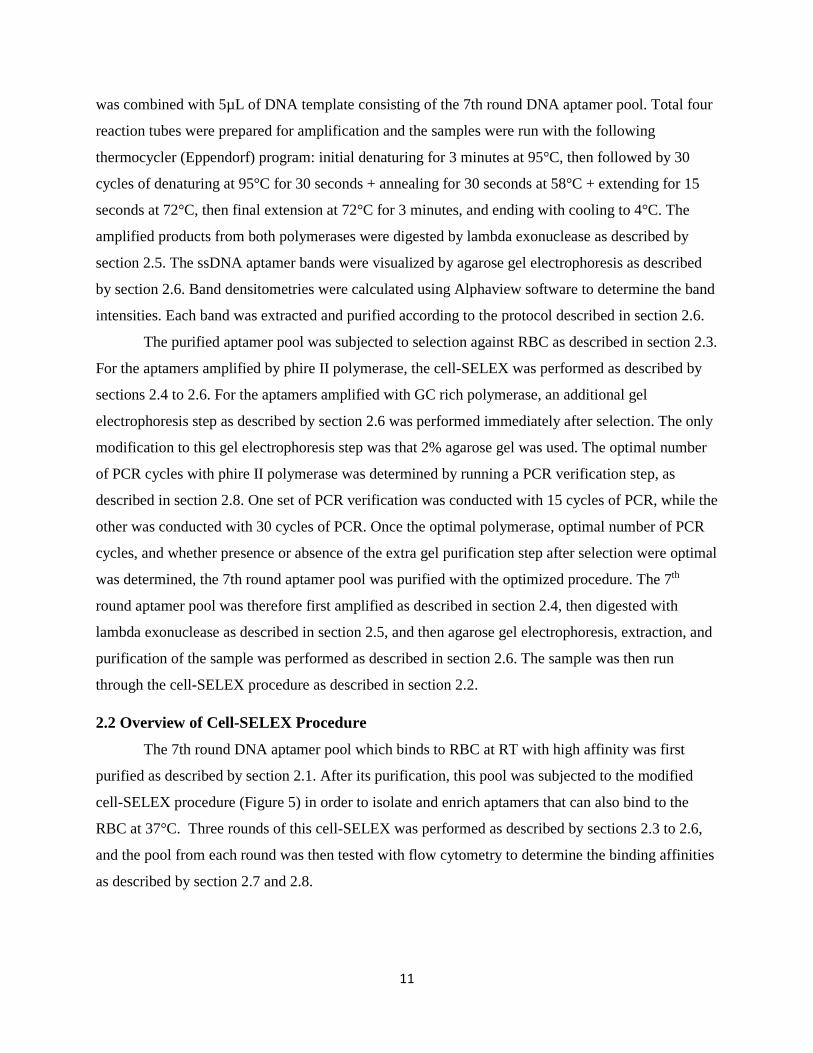
2.2 Overview of Cell-SELEX Procedure
The 7th round DNA aptamer pool which binds to RBC at RT with high affinity was first
purified as described by section 2.1. After its purification, this pool was subjected to the modified
cell-SELEX procedure (Figure 5) in order to isolate and enrich aptamers that can also bind to the
RBC at 37°C. Three rounds of this cell-SELEX was performed as described by sections 2.3 to 2.6,
and the pool from each round was then tested with flow cytometry to determine the binding affinities
as described by section 2.7 and 2.8.
12
Figure 5. Schematic diagram of modified cell-SELEX procedure used to isolate aptamers binding to RBC at room temperature and 37°C. The original DNA aptamer pool (1) used for the first round of selection was a 7th round cell-SELEX pool of 80 nucleotide DNA aptamers evolved previously to bind to RBC at room temperature. This pool was amplified, digested, and purified before being subjected to first round of selection against RBC for binding at 37°C (2). The mixture of aptamers and RBC (2) was incubated with PBS buffer in order to mimic the physiological pH and salinity. A total of three rounds of this cell-SELEX was performed, after which the binding of each round was verified with flow cytometry.
2.3 Selection of DNA Aptamers against Red Blood Cells
Human whole blood type O, (provided by the Berezovski Lab) with a concentration of 10
million cells/mL, as measured by Moflo Astrios EQ Flow Cytometer System (Beckman Coulter),
was gently centrifuged (Sigma) at 200g for 5 min in order to separate the white blood cells from
RBC. The top layer containing white blood cells were removed by aspiration. The remaining layers
of RBC and plasma were stored together at 4°C prior to each use. 700 ng of the purified 7th round
ssDNA aptamer pool previously isolated to bind to RBC at RT was diluted to 500 µL with 1X PBS
buffer (Hyclone) containing Ca2+/Mg2+. Magnesium and calcium ions chelate ssDNA to allow the
aptamers to form more rigid structures for better binding to target (Nomura et al, 2010). Specifically,
these ions bind to the negatively charged phosphate groups on the nucleic acids and help stabilize the
nucleic acid structure (Hackl et al, 2005). The diluted aptamer pool was heated to 95°C for five
minutes in an incubator (Eppendorf Thermomixer) to denature the aptamers and then rapidly cooled
to 4°C for ten minutes to renature the aptamers. This rapid denaturation and renaturation procedure

13
allowed the aptamer sequences to form unique secondary structures prior to binding to their target.
Additionally, denaturation and then subsequent renaturation ensured aptamers were in an open
conformation without folding in on themselves. 500 µL of the RBC, 500 µL of the diluted DNA
aptamers, and 1150 µL of 1X PBS buffer with Ca2+/Mg2+ were separately incubated at 37°C for
minutes to reach this equilibrium temperature. The RBC and aptamer pools were combined together
and mixed gently by 1 mL pipette tip and incubated at 37°C for one hour, while the PBS buffer
continued to be maintained at a temperature of 37°C.
The aptamers were in excess to the RBC to ensure there was competition for binding to the
target, in order to only allow the best binders to be selected (Tuerk and Gold, 1990). After
incubation, 500 µL of PBS buffer at 37°C suspended the sample of RBC and aptamers to wash away
aptamers that did not bind to RBC. The mixture was centrifuged (Eppendorf) at 200g for 5 minutes at
room temperature and the supernatant containing unbound aptamers was discarded. The sample of
bound aptamers and RBC were incubated at 37°C for 10 minutes to re-equilibrate the temperature to
physiological temperature. A second washing step with 500 µL PBS at 37°C was performed to
resuspend the RBC-aptamer complex and the supernatant containing unbound aptamers was removed
after centrifuging at 200g for 5 minutes at room temperature to separate the bound aptamer-RBC
complex from the unbound aptamers. 50 µL of the PBS at 37°C was added to the sample of bound
aptamers-RBC complex. The bound aptamers to cells were recovered by heating the aptamer-cell
complex to 95°C. The high temperature denatured proteins on the cell surface, so that the interaction
of DNA and proteins were interrupted and DNA folded structures were disrupted to allow their
release from the complex (Sefah et al, 2010). The sample was then centrifuged at 15000g for 5
minutes to pellet the lysed RBC and the supernatant containing only aptamers that had bound to the
RBC was collected (approximately 100 µL – 250 µL). The concentrations of the aptamer pools after
selection ranged from 277 pM to 357 pM, as determined by using a plate reader (Biotek Cytation 3)
for detecting Cy-5 relative fluorescence.
2.4 Enriching Aptamer Pool by Symmetric PCR
Symmetric PCR was used to enrich and amplify the DNA aptamer pool recovered from
selection, since the aptamer pool at this point had a low concentration. Although asymmetric PCR is
widely used for generating ssDNA because it is not as tedious and it is more economical (Marimuthu
et al, 2012), it is generally less efficient than symmetric PCR. Asymmetric PCR has efficiencies in
the range from 60% - 70%, while symmetric PCR is usually 90% efficient (McCabe, 1999;
Gyllensten and Allen, 1993). Asymmetric PCR also requires rigorous optimization for proper
14
number of amplification cycles and primer ratios (Sanchez et al, 2003). The forward primer
(Integrated DNA Technologies) was labelled with Cy-5 fluorophore and had the following sequence:
5’-/5Cy5/CTC CTC TGA CTG TAA CCA CG-3’, while the reverse primer (Integrated DNA
Technologies) was 5-CG TAT CCA TCA GGT CTT CGG-3’. An optimized PCR reaction mixture
(Thermo Scientific) containing the followed reagents in their final concentrations was used for
amplification: 7% DMSO, 1X phire reaction buffer with 1.5 mM MgCl2, 200 µM dNTP, 0.4 µM of
the Cy-5 labelled forward primer, 0.4 µL of the reverse primers, and 0.02U/µL of Hot Start Phire II
DNA polymerase (Thermo Scientific). This reaction mixture was optimal for 50 µL per reaction and
therefore consisted of 45 µL of the reaction mixture. The other 5µL for each reaction tube consisted
of the DNA aptamer pool after selection. The remainder of the aptamer pools after selection were
stored at -20°C for use later for determining binding affinities with flow cytometry. Total four
reaction tubes were prepared for amplification at each round of cell-SELEX, and the samples were
run with the following optimized thermocycler program: initial denaturing for 30 seconds at 98°C,
then followed by 15 cycles of denaturing at 98°C for 10 seconds + annealing for 15 seconds at 58°C
+ extending for 5 seconds at 72°C, final extension at 72°C for 20 seconds, and ending with cooling to
4°C. The four samples were combined and stored at -20°C.
2.5 Digestion of dsDNA Aptamers by Lambda Exonuclease into ssDNA Aptamers
Since symmetric PCR was used to amplify the DNA aptamer pool after selection, the
aptamers were double stranded (ds). Aptamers need to be single stranded (ss) for proper binding to
target in subsequent selections and the success of DNA aptamer selection through SELEX is largely
dependent on the critical step of converting dsDNA into ssDNA after PCR (Marimuthu et al, 2012).
Exonucleases have 20 times more affinity for the phosphorylated 5’ end of the reverse strand and
they selectively digest this strand of the dsDNA molecule from 5’ to 3’ to result in high yield and
high quality ssDNA molecules (Marimuthu et al, 2012), as only the non-phosphorylated strand of
DNA remains after digestion is complete (Kujau and Wolfl, 1997). The digestion reaction mix
contained PCR amplified aptamer product, 1U of lambda exonuclease enzyme (Thermo Scientific)
per 50 µL of aptamer product in 1X lambda exonuclease buffer (Thermo Scientific) containing 670
mM glycine-KOH (pH 9.4), 25 mM MgCl2, and 0.1% (v/v) Triton X-100. This mixture was vortexed
and incubated at 37°C for 5 hours, which was deemed optimal previously for digestion to complete
fully. The mixture was vortexed every one hour to ensure the enzyme mixed thoroughly with the
aptamers during incubation. After incubation was complete, the sample was heated to 80°C for 5
minutes to deactivate the enzyme. The sample was stored at -20°C.

15
2.6 Purification by Agarose Gel Electrophoresis
The presence of the exonuclease in the sample from the digestion step necessitated the need
for a purification step prior to the next round of selection, since the enzyme can be another target in
cell-SELEX (Citartan et al, 2011). Hence, agarose gel electrophoresis was used to isolate ssDNA
aptamers from the product after digestion. The entire digested aptamer product was added in 1X
BlueJuice gel loading dye (Thermo Scientific) and run on 4% agarose gel (Ultrapure Agorse
Invitrogen by Life Technologies) containing 1X GelRed (Biotium) with 0.5X TBE buffer for 45
minutes at 150V. The gel was visualized for Cy-5 fluorescence by Fluorchem Q gel imager (Alpha
Innotech). The digested product was run against 100 nM aptamer library to identify the ssDNA
aptamer band which aligned with the 100 nM DNA aptamer library, as both were 80 nucleotides
long. This ssDNA aptamer band was extracted by excising with scalpel to remove from the gel. The
mass of the aptamer band was determined and for every 100 mg of the gel, 200 uL of NTC binding
buffer (potassium thiocyanate, 42 – 60%) (Clontech) was added and the gel-buffer sample was
incubated at 50°C for 30 minutes to dissolve the agarose band completely. The DNA aptamers were
purified from the agarose gel by using Nucleospin Column Clean-Up and Gel Extraction Kit
(Clontech) as per the manufacturer’s protocol. To elute the DNA aptamers from the filter column, 50
µL of PBS with Ca2+/Mg2+ was added to the column and incubated at 50°C for 10 minutes, then
centrifuged at 11000g for 1 minute. The flow through contained eluted DNA and the elution step was
repeated 3 – 5 times, after which point elutions were checked with Fluorchem Q gel imager under
Cy-5 fluorescence to ensure all the aptamers were eluted from the column. All elutions were
combined together and stored at -20°C. This purified sample was again subjected to selection against
RBC as described in section 2.3. This cell-SELEX procedure was repeated for a total of 3 rounds,
with the goal that each round of cell-SELEX would enrich the aptamer pool binding at 37°C to the
RBC and allow the pool to converge to sequences that bind with high specificity and affinity. For
round 3, cell-SELEX was stopped immediately after selection was completed to prepare it for flow
cytometry. Since each amplified product was used in subsequent rounds, the aptamer pools stored
after selection (round 1 and 2) had to be re-prepared to check their binding affinities to RBC with
flow cytometry.
2.7 Preparing DNA Aptamers from Cell-SELEX for Flow Cytometry Analysis
Rounds 1, 2, and 3 after selection with RBC were amplified according to the procedure
outlined in section 2.4, but instead of amplifying 4 reactions, 6 reactions were amplified in order to
have a high enough concentration for flow cytometry to detect the aptamers for binding to RBC. The
16
amplified products from all three rounds were then digested according to the protocol from section
2.5 and agarose gel electrophoresis was performed as described by section 2.6 to isolate the ssDNA
aptamers. The ssDNA aptamer band was extracted and chopped into very fine pieces with a scalpel
and suspended in 10 mL of PBS buffer with Ca2+/Mg2+ and left in a gentle shaker for 46 hours at
room temperature to elute the aptamers from the gel and into the buffer. The buffer was then
collected and separated from the gel fragments. 2 mL centrifugal units (Amicon) were used to
concentrate the 10 mL of buffer to 200 µL of DNA aptamers by repeated loading of buffer
containing the aptamers into the unit, 2 mL at a time, and centrifuging at 3000g for 40 minutes. The
concentrations of these three rounds of aptamer pools were determined by plate reader, after which
the samples were then stored at -20°C.
All three aptamer pools were diluted with PBS containing Ca2+/Mg2+ to the same
concentration as the aptamer pool with the lowest concentration. This dilution was performed in
order to eliminate any bias flow cytometry may exhibit towards binding affinities for aptamer pools
with higher concentration of aptamers. The DNA aptamer library was also diluted to the same
concentration to serve as the negative control in the flow cytometry analysis. 400 µL of RBC were
washed in 1 mL of PBS with Ca2+/Mg2+ and mixed by gentle pipetting with 1 mL pipette. The
mixture was centrifuged at 200g for 5 minutes and the supernatant was disposed to eliminate any cell
debris or dead RBC. 50 µL of the RBC were added to 220 µL of each aptamer pool and the library.
These four samples were split into two sets to result in eight samples total. One set of the aptamer-
RBC complex was incubated at 37°C for one hour, while the other set was incubated at room
temperature for one hour. The set incubated at room temperature was a control to test any difference
in binding affinities for temperature, since these aptamers were evolved to bind at 37°C by cell-
SELEX. After incubation, 500 µL of PBS with Ca2+/Mg2+ were used to wash each sample. The
samples were then centrifuged at 200g for 5 minutes and the supernatant was disposed. Each sample
was diluted to 400 µL with PBS with Ca2+/Mg2+. Another negative control with plain RBC was
prepared to account for autofluorescence by diluting 50 µL of the RBC to 400 µL with PBS. Ideally,
the 7th round aptamer pool with known binding to RBC at room temperature ought to have been run
against these samples as a positive control. However, there was not enough of this sample available
to be able to use it for flow cytometry.
After three rounds of cell-SELEX in which DNA aptamers were evolved to bind RBC at
37°C, the binding affinities of each aptamer pool to RBC were screened and verified with flow
cytometry. Gallios flow cytometer (Beckman Coulter) was used to determine Cy-5 fluorescence for
each of these 9 samples under the FL6 detector. The sample of plain RBC was used for live cell
17
gating under the logarithmic forward and side scatter dot plot (Figure 6) in order to set parameters for
the population of aptamer-RBC complexes that will be analyzed with flow cytometry. Cell debris,
dead cells, and cells undergoing mitosis were not considered for the final gated population (Figure 6).
Data for 20,000 events within the gated region was collected for each sample, and FL6 filter using
633 nm laser excitation was used to measure Cy-5 fluorescence. Cy-5 fluorescence emissions were
analyzed with Kaluza Gallios program (Beckman Coulter) and Cy-5 median fluorescence intensity
values for each sample were considered for further analysis. This procedure for assessing binding
affinity with flow cytometry was also repeated with 100 nM library and compared to plain RBC.
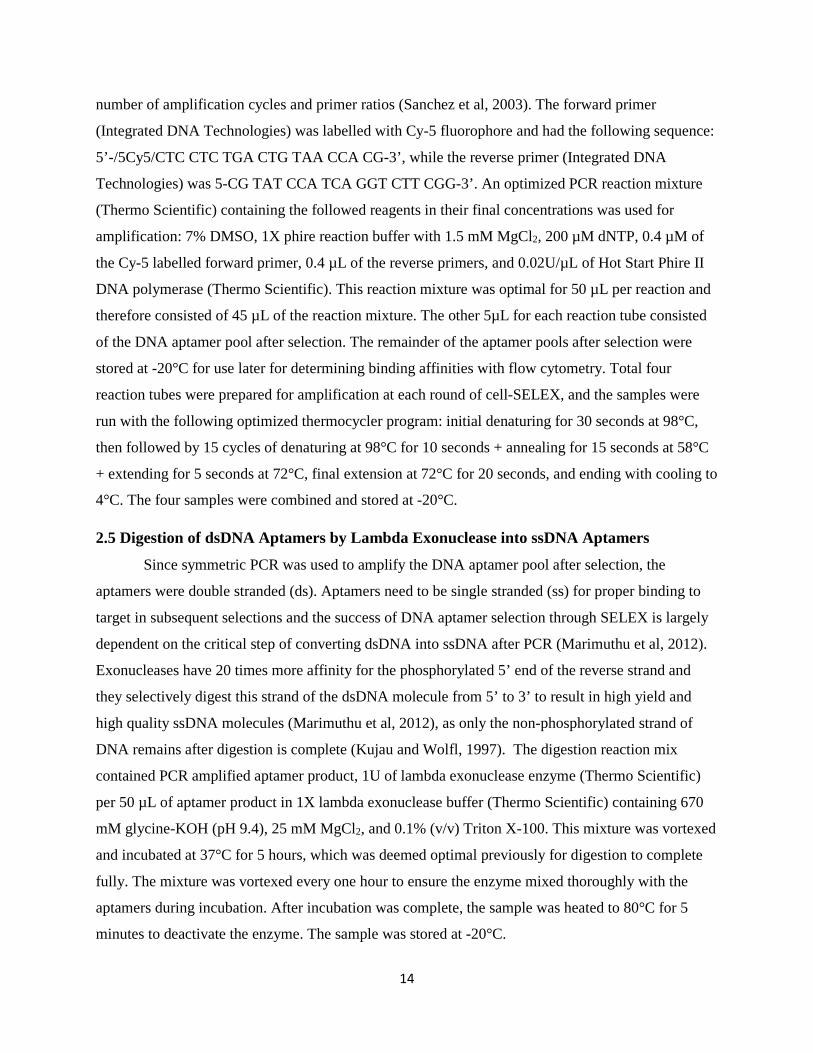
Figure 6. Gated population of plain RBC used for flow cytometry. The plain RBC population was represented by flow cytometry dot plot with log side scatter (SS) versus the forward scatter (FS). Cells with low FS were small sized and consisted of cell debris (B). Cells that also had low FS, but with high SS, and therefore high granularity, were dead cells (C). Cells with high FS were large cells undergoing mitosis (D). Only the population of RBC that fell into medium SS and FS were considered normal RBC, and these cells in red (A) were gated for analysis in flow cytometry for 20,000 events.
2.8 PCR and Digestion Verifications
Any time a new batch of master PCR reaction mixture was prepared, it was verified to
determine if there were any contaminants in the reagents and to ensure that the reagents were
working correctly. PCR verifications were performed preparing positive and negative PCR controls.
The reaction mixtures for 50 µL reactions were prepared as described in section 2.4. One reaction
tube had 5 µL of 100 pM aptamer library to serve as the positive control. The negative control
contained no DNA template and only the reaction mixture. These two samples were run through PCR
amplification as described in section 2.4. Then, half of the amplified product from the positive
control was digested with lambda exonuclease according to section 2.5. Afterwards, these three
samples were run through agarose gel electrophoresis as described by section 2.6. The samples were
run against 60.8 ng/µL MassRuler Low Range DNA Ladder (Thermo Scientific) and 100 nM DNA
library in order to distinguish what each band in the gel corresponded to.
18
3. Results
3.1 Optimal PCR Amplification Protocol and Purification in Cell-SELEX
The first objective for this study was to modify and optimize the cell-SELEX protocol. The
7th round (R7) aptamer pool developed by our research group to bind to RBC at room temperature
(RT) was used during all steps of optimization, since this pool would eventually be used to begin the
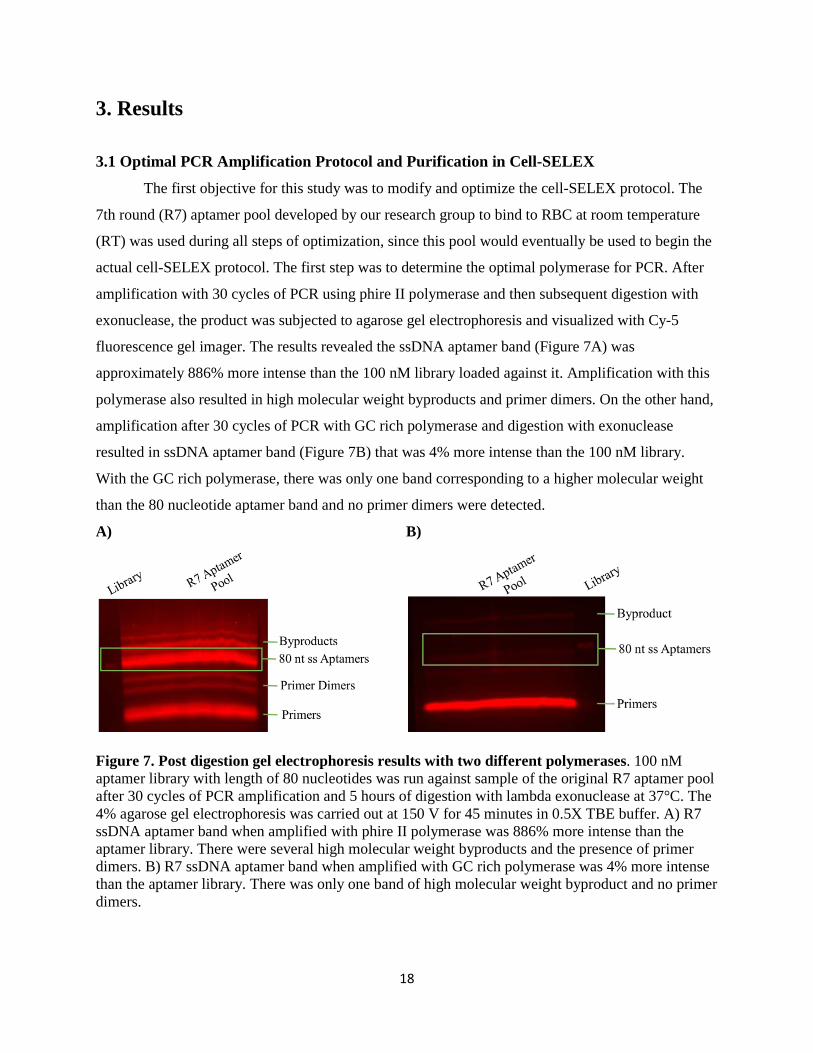
actual cell-SELEX protocol. The first step was to determine the optimal polymerase for PCR. After
amplification with 30 cycles of PCR using phire II polymerase and then subsequent digestion with
exonuclease, the product was subjected to agarose gel electrophoresis and visualized with Cy-5
fluorescence gel imager. The results revealed the ssDNA aptamer band (Figure 7A) was
approximately 886% more intense than the 100 nM library loaded against it. Amplification with this
polymerase also resulted in high molecular weight byproducts and primer dimers. On the other hand,
amplification after 30 cycles of PCR with GC rich polymerase and digestion with exonuclease
resulted in ssDNA aptamer band (Figure 7B) that was 4% more intense than the 100 nM library.
With the GC rich polymerase, there was only one band corresponding to a higher molecular weight
than the 80 nucleotide aptamer band and no primer dimers were detected.
A) B)
Figure 7. Post digestion gel electrophoresis results with two different polymerases. 100 nM aptamer library with length of 80 nucleotides was run against sample of the original R7 aptamer pool after 30 cycles of PCR amplification and 5 hours of digestion with lambda exonuclease at 37°C. The 4% agarose gel electrophoresis was carried out at 150 V for 45 minutes in 0.5X TBE buffer. A) R7 ssDNA aptamer band when amplified with phire II polymerase was 886% more intense than the aptamer library. There were several high molecular weight byproducts and the presence of primer dimers. B) R7 ssDNA aptamer band when amplified with GC rich polymerase was 4% more intense than the aptamer library. There was only one band of high molecular weight byproduct and no primer dimers.

19
The ssDNA aptamer band for the R7 pool amplified with GC rich polymerase was then
extracted and purified to prepare it for selection in R1 of the cell-SELEX procedure. After the
purified aptamer pool was subjected to incubation with RBC at 37 °C, the bound aptamers were
separated and recovered from the RBC, and this recovered aptamer pool was run through agarose gel
electrophoresis against the 100 nM aptamer library. The results from the gel electrophoresis indicated
that no ssDNA aptamer band corresponding to aptamer library was present (Figure 8). In order to
determine if PCR amplification using GC rich polymerase could be improved, a verification for the
PCR protocol using the GC rich polymerase with the aptamer library as the DNA template was
performed. Amplifications with 100 nM library and 100 pM library as DNA templates were tested to
detect any differences in band intensities. A third sample with 100 pM library as the DNA template
and with an additional 2.5 × 10⁻²µmol of dNTPs in the PCR reaction mixture was amplified with
GC rich polymerase. The amplified products were visualized with UV gel imager after agarose gel
electrophoresis (Figure 9) and the results indicated that decreasing the DNA template from 100 nM
to 100 pM increased the intensity of the aptamer band by 0.03%. The sample containing the 100 pM
library with the additional dNTPs had the most intense aptamer band and was approximately 24%
more intense than both of the library samples with no additional dNTPs.
Figure 8. Round 1 post selection gel electrophoresis of aptamer pool amplified with GC rich polymerase. After 30 cycles of amplifying the R7 aptamer pool with GC rich polymerase, digesting with lambda exonuclease for five hours, and extracting the digested product from agarose gel electrophoresis, the sample was purified to isolate DNA aptamers with nucleospin column cleanup. The purified sample was then subjected to incubation against RBC at 37°C for one hour for first round of selection in cell-SELEX. The recovered aptamers which had bound to the RBC during incubation were purified by 2% agarose gel electrophoresis. The R1 aptamer pool was run against the 80 nucleotide 100 nM library and the gel electrophoresis was carried out at 150 V for 45 minutes. No ssDNA aptamer band for the R1 aptamer pool after selection was detected.

20
Figure 9. PCR verification for amplification with GC rich polymerase. All three samples underwent 30 cycles of PCR amplification and then were visualized by 4% agarose gel electrophoresis run at 150 V for 45 minutes in 0.5X TBE buffer. In lane 1, 100 nM aptamer library was used as the template during amplification, while in lane 2, 100 pM aptamer library was used as the DNA template. In lane 3, 100 pM library was used as the template and an additional 0.025 µmol of dNTPs were added to the PCR amplification. Decreasing template concentration from 100 nM to 100 pM increased the intensity of the amplicon by 0.03%. Adding extra dNTPs increased the intensity of the amplicon by 24% from either sample with no additional dNTPs.
Since the additional dNTPs in the GC rich PCR reaction mixtures did not improve the
amplification by more than 24%, the R7 aptamer pool was instead amplified with the phire II
polymerase. After digestion with the exonuclease and subsequent extraction of the ssDNA aptamer
band (Figure S1 in the Appendix), the aptamer pool was purified and then subjected to R1 of
selection with RBC. The bound aptamers were separated and recovered from the RBC, and the
concentration of this recovered pool was determined to be 357 pM by plate readings of the Cy-5
fluorescence. However, this time the gel purification step prior to amplification was omitted. Thus,
the aptamer pool after selection was directly amplified with the phire II polymerase for 30 cycles.
The amplified product was digested with the exonuclease and then visualized with Cy-5 fluorescence
after agarose gel electrophoresis (Figure 10). The results indicated the presence of a ssDNA aptamer
band that was approximately 114% more intense than the 100 nM library. Thus, the experimental
data indicated that using phire II polymerase and eliminating the gel purification step immediately
after selection allowed the ssDNA aptamers to be isolated after amplification and digestion. The gel
from this R1 also depicted the presence of a large smear of high molecular weight byproducts above
the ssDNA aptamer band.
21
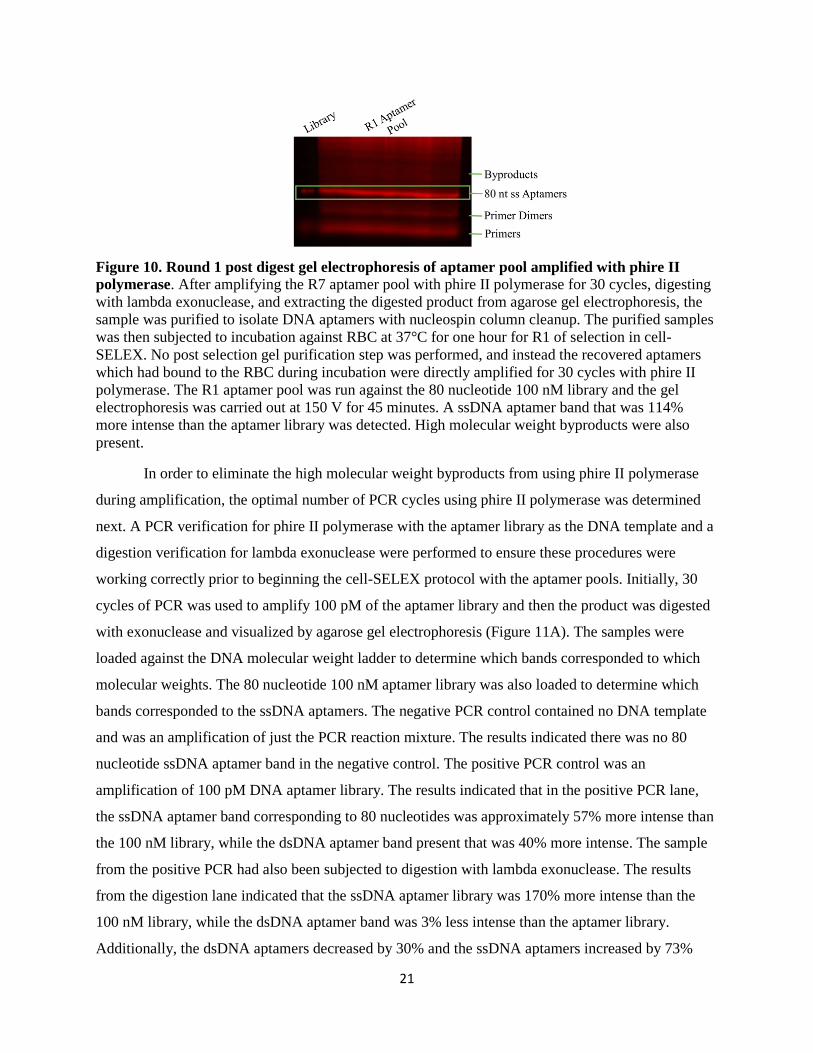
Figure 10. Round 1 post digest gel electrophoresis of aptamer pool amplified with phire II polymerase. After amplifying the R7 aptamer pool with phire II polymerase for 30 cycles, digesting with lambda exonuclease, and extracting the digested product from agarose gel electrophoresis, the sample was purified to isolate DNA aptamers with nucleospin column cleanup. The purified samples was then subjected to incubation against RBC at 37°C for one hour for R1 of selection in cell-SELEX. No post selection gel purification step was performed, and instead the recovered aptamers which had bound to the RBC during incubation were directly amplified for 30 cycles with phire II polymerase. The R1 aptamer pool was run against the 80 nucleotide 100 nM library and the gel electrophoresis was carried out at 150 V for 45 minutes. A ssDNA aptamer band that was 114% more intense than the aptamer library was detected. High molecular weight byproducts were also present.
In order to eliminate the high molecular weight byproducts from using phire II polymerase
during amplification, the optimal number of PCR cycles using phire II polymerase was determined
next. A PCR verification for phire II polymerase with the aptamer library as the DNA template and a
digestion verification for lambda exonuclease were performed to ensure these procedures were
working correctly prior to beginning the cell-SELEX protocol with the aptamer pools. Initially, 30
cycles of PCR was used to amplify 100 pM of the aptamer library and then the product was digested
with exonuclease and visualized by agarose gel electrophoresis (Figure 11A). The samples were
loaded against the DNA molecular weight ladder to determine which bands corresponded to which
molecular weights. The 80 nucleotide 100 nM aptamer library was also loaded to determine which
bands corresponded to the ssDNA aptamers. The negative PCR control contained no DNA template
and was an amplification of just the PCR reaction mixture. The results indicated there was no 80
nucleotide ssDNA aptamer band in the negative control. The positive PCR control was an
amplification of 100 pM DNA aptamer library. The results indicated that in the positive PCR lane,
the ssDNA aptamer band corresponding to 80 nucleotides was approximately 57% more intense than
the 100 nM library, while the dsDNA aptamer band present that was 40% more intense. The sample
from the positive PCR had also been subjected to digestion with lambda exonuclease. The results
from the digestion lane indicated that the ssDNA aptamer library was 170% more intense than the
100 nM library, while the dsDNA aptamer band was 3% less intense than the aptamer library.
Additionally, the dsDNA aptamers decreased by 30% and the ssDNA aptamers increased by 73%
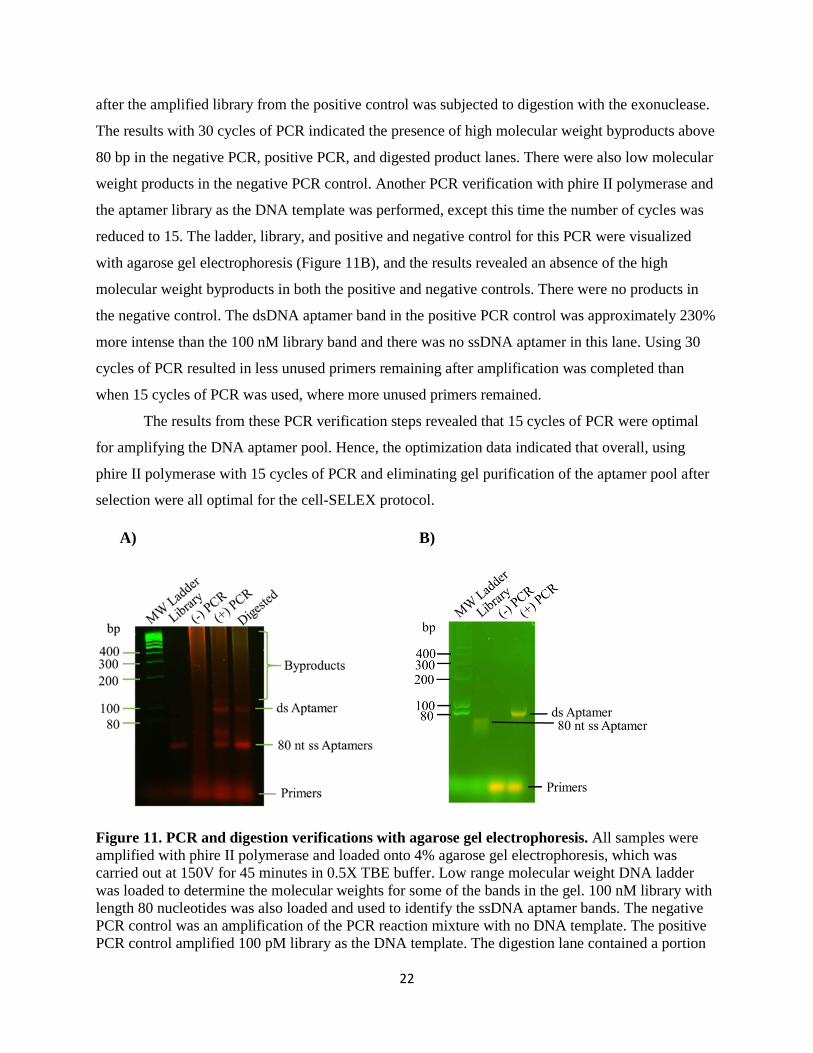
22
after the amplified library from the positive control was subjected to digestion with the exonuclease.
The results with 30 cycles of PCR indicated the presence of high molecular weight byproducts above
80 bp in the negative PCR, positive PCR, and digested product lanes. There were also low molecular
weight products in the negative PCR control. Another PCR verification with phire II polymerase and
the aptamer library as the DNA template was performed, except this time the number of cycles was
reduced to 15. The ladder, library, and positive and negative control for this PCR were visualized
with agarose gel electrophoresis (Figure 11B), and the results revealed an absence of the high
molecular weight byproducts in both the positive and negative controls. There were no products in
the negative control. The dsDNA aptamer band in the positive PCR control was approximately 230%
more intense than the 100 nM library band and there was no ssDNA aptamer in this lane. Using 30
cycles of PCR resulted in less unused primers remaining after amplification was completed than
when 15 cycles of PCR was used, where more unused primers remained.
The results from these PCR verification steps revealed that 15 cycles of PCR were optimal
for amplifying the DNA aptamer pool. Hence, the optimization data indicated that overall, using
phire II polymerase with 15 cycles of PCR and eliminating gel purification of the aptamer pool after
selection were all optimal for the cell-SELEX protocol.
A) B)
Figure 11. PCR and digestion verifications with agarose gel electrophoresis. All samples were amplified with phire II polymerase and loaded onto 4% agarose gel electrophoresis, which was carried out at 150V for 45 minutes in 0.5X TBE buffer. Low range molecular weight DNA ladder was loaded to determine the molecular weights for some of the bands in the gel. 100 nM library with length 80 nucleotides was also loaded and used to identify the ssDNA aptamer bands. The negative PCR control was an amplification of the PCR reaction mixture with no DNA template. The positive PCR control amplified 100 pM library as the DNA template. The digestion lane contained a portion
23
of the positive PCR control that was digested with lambda exonuclease for 5 hours. A) Amplification with 30 cycles of PCR. There was amplified DNA present in the negative PCR lane, and the positive and digestion lanes also contained high molecular weight byproducts. There was ssDNA present in the positive lane even after amplification, which was approximately 57% more intense than the aptamer library, while the dsDNA aptamer band was 40% more intense. The ssDNA aptamer band from the digestion lane was 170% more intense than the aptamer library, while the dsDNA aptamer in the lane was only 3% more intense than the library. B) Amplification with 15 cycles of PCR. No DNA present in the negative PCR lane and no high molecular weight byproducts in positive PCR lane. The positive PCR lane contained only a dsDNA aptamer band which was 230% more intense than the aptamer library.
3.2 Three Rounds of Cell-SELEX for Aptamers against RBC Binding at 37°C
After purifying the R7 aptamer pool and subjecting it to R1 of cell-SELEX, a portion of the
purified aptamers from this R1 were subjected to the second round (R2) of cell-SELEX. Once R2
was completed, a portion of its aptamer pool was used for completing the third (R3) and final round
of cell-SELEX. A portion of the purified R3 aptamer pool was directly used for determining the
binding affinity with flow cytometry. However, the aptamer pools from R1 and R2 had to be re-
amplified, digested, and purified by gel electrophoresis before determining their binding affinities to
RBC with flow cytometry, since the portion of aptamer pools were saved and stored at the pre-PCR
stage at each round. The gel images for each aptamer pool after selection with RBC, optimized
amplification, digestion, and gel electrophoresis are shown by Figure S2 in the Appendix. The
ssDNA aptamer bands from these gels were extracted and purified to test their binding affinities with
flow cytometry against RBC. This first trial with flow cytometry showed the binding affinities
overlapped with the negative controls (Figure S3A in Appendix) and were therefore zero (Figure
S3B in Appendix), so the pre-PCR stage stored samples from each round had to again be amplified,
digested, subjected to agarose gel electrophoresis, and purified to prepare them for a second trial of
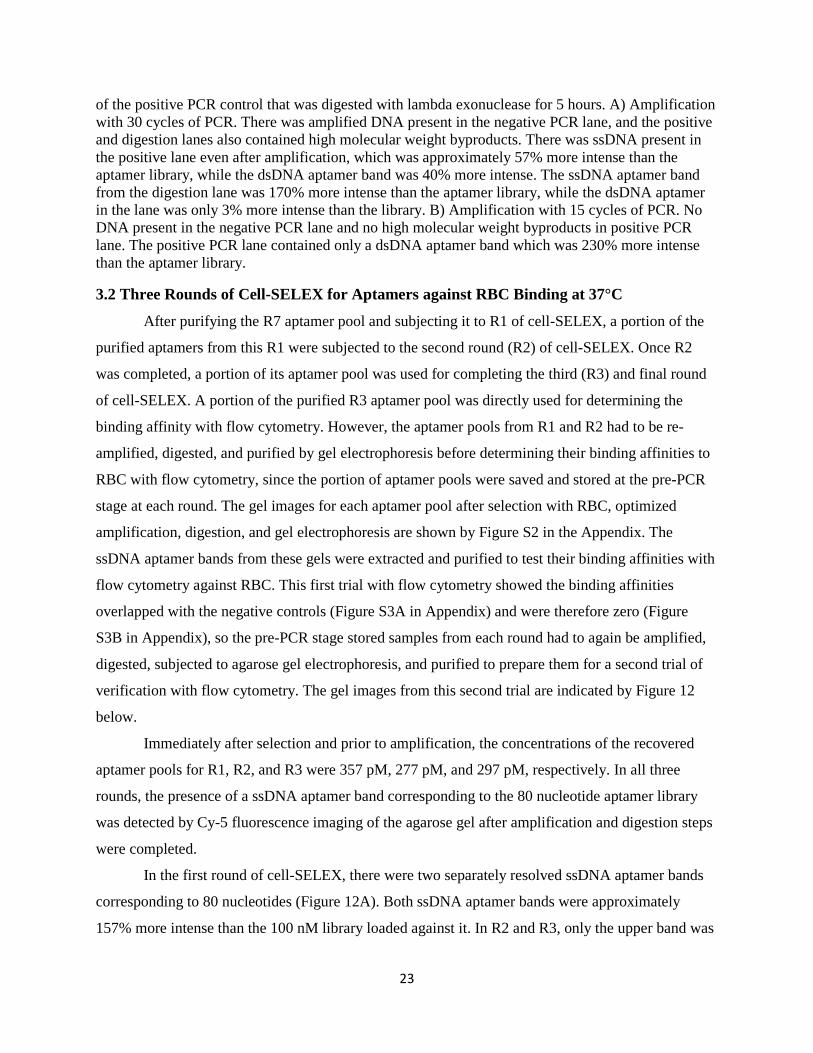
verification with flow cytometry. The gel images from this second trial are indicated by Figure 12
below.
Immediately after selection and prior to amplification, the concentrations of the recovered
aptamer pools for R1, R2, and R3 were 357 pM, 277 pM, and 297 pM, respectively. In all three
rounds, the presence of a ssDNA aptamer band corresponding to the 80 nucleotide aptamer library
was detected by Cy-5 fluorescence imaging of the agarose gel after amplification and digestion steps
were completed.
In the first round of cell-SELEX, there were two separately resolved ssDNA aptamer bands
corresponding to 80 nucleotides (Figure 12A). Both ssDNA aptamer bands were approximately
157% more intense than the 100 nM library loaded against it. In R2 and R3, only the upper band was
24
present in the agarose gel, while the lower band was completely absent. R2 had a ssDNA aptamer
band that was 27% less intense than the 100 nM library (Figure 12B), while R3 had ssDNA aptamer
band that was 84% more intense than the aptamer library (Figure 12C). These agarose gel images
confirmed aptamers were isolated after selection with RBC for each round of cell-SELEX.
A) B) C)
Figure 12. Post digest gel electrophoresis for rounds 1 to 3 of cell-SELEX. After incubation with RBC at 37°C for one hour, isolation and enrichment of the bound aptamers by 15 cycles of PCR amplification using phire II polymerase, and digestion with lambda exonuclease for 5 hours, the aptamer pools were run through 4% agarose gel electrophoresis for 45 min at 150 V in 0.5X TBE buffer. The 100 nM library was loaded against each aptamer pool to determine which band corresponded to the 80 nucleotide ssDNA aptamers. A) Post digest gel for R1 aptamer pool. Two different populations of ssDNA aptamers that were 157% more intense than the 100 nM library were observed. B) Post digest gel for R2 aptamer pool. A single population of ssDNA aptamer band with an intensity 27% less than the 100 nM library observed. C) Post digest gel for R3 aptamer pool. A single population of ssDNA aptamer band with an intensity 84% higher than the 100 nM library was observed.
3.3 Binding Affinities from Flow Cytometry after Three Rounds of Cell-SELEX
Initially, ssDNA aptamer bands from the gels shown in Figure S2 in Appendix were
extracted and purified for analysis by flow cytometry. Cy-5 emission flow cytometry results for these
samples are indicated in Figure S3A. The binding affinities were all zero (Figure S3B), and thus the
samples were re-prepared and ssDNA aptamer bands from Figure 12 were extracted and purified.
After purification, concentrations of these purified aptamer pools were determined. R1, R2, and R3
had concentrations that were 8.4 nM, 3.38 nM, and 2.06 nM, respectively. All samples, including the
aptamer library used as a negative control for flow cytometry, were diluted to 2.06 nM. Each sample
(R1, R2, R3, and aptamer library) was split into sets, where one set was incubated against RBC at
37°C and another set incubated at room temperature (RT). A negative control with plain RBC was
also prepared to gate the cell population in flow cytometry and represent autofluorescence. All 9
samples were then run through flow cytometry, and the resulting Cy-5 emission graph is indicated by
Figure 13A. Relative Cy-5 fluorescent intensities represent binding affinities. According to these
results, some of Cy-5 emission from certain samples overlapped with each other. Since it was
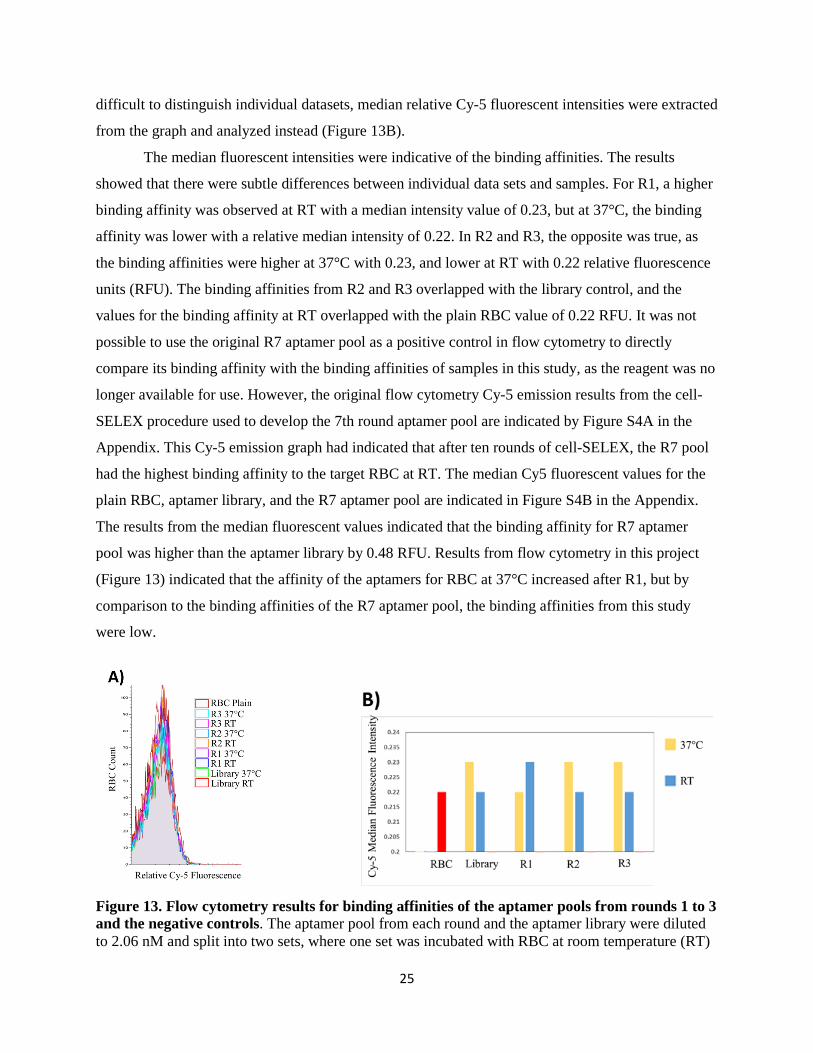
25
difficult to distinguish individual datasets, median relative Cy-5 fluorescent intensities were extracted
from the graph and analyzed instead (Figure 13B).
The median fluorescent intensities were indicative of the binding affinities. The results
showed that there were subtle differences between individual data sets and samples. For R1, a higher
binding affinity was observed at RT with a median intensity value of 0.23, but at 37°C, the binding
affinity was lower with a relative median intensity of 0.22. In R2 and R3, the opposite was true, as
the binding affinities were higher at 37°C with 0.23, and lower at RT with 0.22 relative fluorescence
units (RFU). The binding affinities from R2 and R3 overlapped with the library control, and the
values for the binding affinity at RT overlapped with the plain RBC value of 0.22 RFU. It was not
possible to use the original R7 aptamer pool as a positive control in flow cytometry to directly
compare its binding affinity with the binding affinities of samples in this study, as the reagent was no
longer available for use. However, the original flow cytometry Cy-5 emission results from the cell-
SELEX procedure used to develop the 7th round aptamer pool are indicated by Figure S4A in the
Appendix. This Cy-5 emission graph had indicated that after ten rounds of cell-SELEX, the R7 pool
had the highest binding affinity to the target RBC at RT. The median Cy5 fluorescent values for the
plain RBC, aptamer library, and the R7 aptamer pool are indicated in Figure S4B in the Appendix.
The results from the median fluorescent values indicated that the binding affinity for R7 aptamer
pool was higher than the aptamer library by 0.48 RFU. Results from flow cytometry in this project
(Figure 13) indicated that the affinity of the aptamers for RBC at 37°C increased after R1, but by
comparison to the binding affinities of the R7 aptamer pool, the binding affinities from this study
were low.
Figure 13. Flow cytometry results for binding affinities of the aptamer pools from rounds 1 to 3 and the negative controls. The aptamer pool from each round and the aptamer library were diluted to 2.06 nM and split into two sets, where one set was incubated with RBC at room temperature (RT)
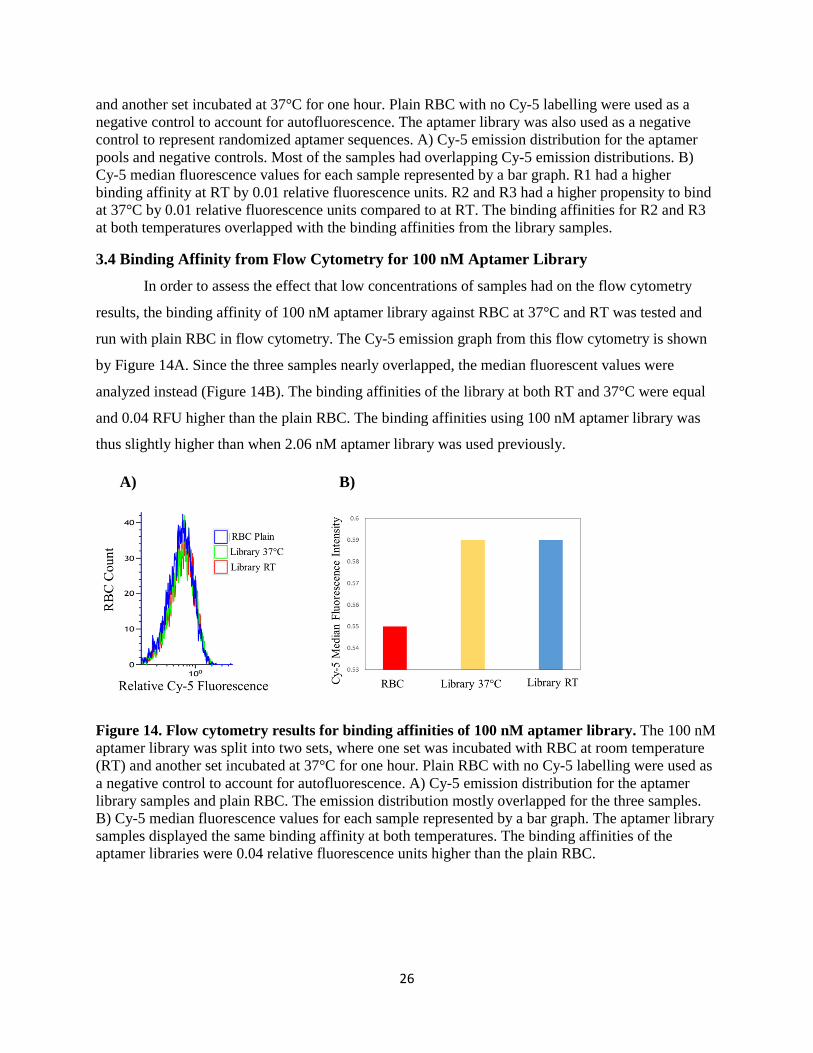
26
and another set incubated at 37°C for one hour. Plain RBC with no Cy-5 labelling were used as a negative control to account for autofluorescence. The aptamer library was also used as a negative control to represent randomized aptamer sequences. A) Cy-5 emission distribution for the aptamer pools and negative controls. Most of the samples had overlapping Cy-5 emission distributions. B) Cy-5 median fluorescence values for each sample represented by a bar graph. R1 had a higher binding affinity at RT by 0.01 relative fluorescence units. R2 and R3 had a higher propensity to bind at 37°C by 0.01 relative fluorescence units compared to at RT. The binding affinities for R2 and R3 at both temperatures overlapped with the binding affinities from the library samples.
3.4 Binding Affinity from Flow Cytometry for 100 nM Aptamer Library
In order to assess the effect that low concentrations of samples had on the flow cytometry
results, the binding affinity of 100 nM aptamer library against RBC at 37°C and RT was tested and
run with plain RBC in flow cytometry. The Cy-5 emission graph from this flow cytometry is shown
by Figure 14A. Since the three samples nearly overlapped, the median fluorescent values were
analyzed instead (Figure 14B). The binding affinities of the library at both RT and 37°C were equal
and 0.04 RFU higher than the plain RBC. The binding affinities using 100 nM aptamer library was
thus slightly higher than when 2.06 nM aptamer library was used previously.
A) B)
Figure 14. Flow cytometry results for binding affinities of 100 nM aptamer library. The 100 nM aptamer library was split into two sets, where one set was incubated with RBC at room temperature (RT) and another set incubated at 37°C for one hour. Plain RBC with no Cy-5 labelling were used as a negative control to account for autofluorescence. A) Cy-5 emission distribution for the aptamer library samples and plain RBC. The emission distribution mostly overlapped for the three samples. B) Cy-5 median fluorescence values for each sample represented by a bar graph. The aptamer library samples displayed the same binding affinity at both temperatures. The binding affinities of the aptamer libraries were 0.04 relative fluorescence units higher than the plain RBC.

27
4. Discussion This study optimized and modified the cell-SELEX protocol and employed it to develop
aptamers binding RBC under physiological conditions, such as 37°C. Major findings are discussed
below in relation to literature. Limitations of the study and future research is also discussed.
Amplifying R7 aptamer pool with phire II polymerase resulted in ssDNA aptamer band with
a very high yield, since after digestion the band was 886% brighter than the 100 nM library (Figure
7A). Using this polymerase also gave rise to high molecular weight byproducts that were a mixture
of dsDNA aptamers and nonspecific amplicons. According to Ellington and Szostak (1990), there is
usually a decrease in aptamer pool complexity after amplification, since replications cannot happen
past lesions and there is poor replication due to GC rich regions in aptamers. Amplifying templates
with high GC content is more difficult than amplifying templates with non-GC content (McDowell et
al, 1998), since GC regions affect primer specificity and optimal annealing temperature (Mamedove
et al, 2008). GC rich regions of DNA aptamers can form secondary structures and stem-loops that are
very stable due to the three hydrogen bonds in GC pairings and cause non-uniform amplification
(Kang et al, 2005), as these stable formations can be difficult to denature for the polymerase to
amplify the regions properly (Chakrabarti and Schutt, 2001). Additionally, loops in these DNA
regions can also make it difficult for the exonuclease to access the regions for digestion, and many
aptamers remain double stranded, which results in high molecular weight byproducts even after
digestion. Dimethyl sulfoxide (DMSO) is often used to disrupt secondary structures in DNA
templates caused by GC rich regions by hydrogen bonding to the major and minor grooves of DNA
molecules to destabilize the double helix (Simon et al, 2009). However, disrupted base-pairings
introduced by DMSO can lead to mismatched base-pairings during primer annealing and result in
nonspecific amplified products.
In order to eliminate the issues associated with GC rich regions of aptamers, a special GC
rich polymerase with its corresponding PCR reaction mixture and thermocycler protocol according to
the manufacturer’s recommendations were used to amplify the R7 aptamer pool. This GC rich
polymerase is designed for high specificity and yield for GC rich templates, and the PCR reaction
buffers provided by the manufacturer were designed to enhance primer-template hybridization during
amplification. As indicated by the gel image in Figure 7B, this polymerase led to a decrease in high
molecular weight byproducts. Only one band corresponded to a higher molecular weight than the 80
nucleotide ssDNA aptamers, and this band was likely just 80 bp dsDNA aptamers which were not
completely digested by the exonuclease into ssDNA aptamers. However, the major problem with the

28
GC rich polymerase was that it resulted in a very low yield of amplified ssDNA, since the aptamer
band was only 4% brighter than the 100 nM library. The GC rich protocol resulted in ssDNA
aptamer yield that was approximately 8.8 times lower than the phire II polymerase protocol. Even
though this protocol clearly resulted in a low yield of amplicons, the amplicons were still more
specific than the phire II polymerase protocol. Hence, the low yield aptamer band from the GC rich
protocol was still extracted from the gel and purified to subject it to round one of the selection step in
cell-SELEX to determine if the poor amplification was still sufficient for isolating aptamers.
After recovering the bound aptamers from selection, the pool was purified with gel
electrophoresis. This purification step was performed to remove any cell lysates from sample and to
ensure that only the target ssDNA aptamers are amplified during PCR, in order to minimize
nonspecific amplification. The gel purification indicated there were no ssDNA aptamers (Figure 8).
One possible reason there were no aptamers detected was possibly due to no aptamers being able to
bind at 37°C to RBC. However, an alternative reason for why no aptamers were possibly detected
was because the aptamer concentration was very low prior to selection. Since the aptamer yield from
gel purification of the R7 pool was low, it led to a low concentration of aptamers being subjected to
selection against RBC at 37°C. Ellington and Szostak (1990) reported that if 1010 sequences of RNA
aptamers are subjected to selection against a target, only one RNA aptamer can form the proper
structure to bind to the target. The concentration of aptamers recovered immediately after selection
was also even lower than the concentration prior to selection, and was likely too low to be detected
by the agarose gel. Evidently, it is important to not only have a high specificity during amplification,
but a high yield of amplified aptamer product for proper enrichment of the aptamers is also critical
for cell-SELEX to be successful in isolating aptamers that bind to RBC at 37°C.
Since the actual GC rich polymerase yielded a high specificity, this study tried to attempt to
improve the GC rich PCR reaction mixture itself to increase the yield during amplification. One
possible reason amplification was poor with GC rich polymerase may be because this protocol
requires a higher starting concentration for the DNA template. Thus, PCR amplification using 100
nM DNA aptamer library was compared to using 100 pM DNA aptamer library as template, since the
aptamer concentration immediately after selection is usually in the picomolar range. Interestingly, the
results revealed that using 1000 fold lower template concentration for amplification led to a slightly
higher yield by 0.03% (Figure 9). Too high DNA template concentration can lead to nonspecific
amplification, as the packed DNA can result in false priming. These results thus indicated that the
starting aptamer concentration in the picomolar range was not a factor in the poor amplification from
GC rich polymerase. No additional DMSO was added to the reaction mixture in order to determine if
29
it improved amplification, since additional DMSO can lead to nonspecific amplification. Instead, it
was proposed that perhaps the reaction mixture provided by the manufacturer was lacking sufficient
dNTPs for the polymerase to be able to synthesize the dsDNA aptamers. Although adding more
dNTPs to the reaction buffer and amplifying with 100 pM library template did improve the
amplification by 24% in both samples with no additional dNTPs, this improvement did not yield
amplicons that were as intense as using the phire II polymerase. Thus, it was determined that phire II
polymerase would be optimal for cell-SELEX.
The phire II polymerase was then used to amplify the R7 aptamer pool to enrich its
concentration, and then this amplified product was digested and purified by agarose gel (Figure S1 in
the Appendix). After being subjected it to R1 selection against RBC at 37°C, the recovered bound
aptamers were not purified with agarose gel. Even though the R7 aptamer pool had a high yield after
amplification with phire II polymerase and a much higher concentration of aptamers prior to
incubation with RBC than before, when GC rich polymerase was used, the concentration of
recovered aptamers was still very low at 357 pM. This concentration may still have been too low for
detection by visualizing the agarose gel with Cy-5 fluorescence. Thus, the gel purification step was
omitted and the recovered aptamer pool was amplified directly by PCR. After digestion of the
amplified product and the subsequent agarose gel electrophoresis, the gel image (Figure 10) revealed
that a ssDNA aptamer band which was 114% more intense than the 100 nM library was detected.
The presence of this aptamer band confirmed that selecting DNA aptamers against RBC at 37°C
worked, since bound aptamers were recovered successfully. This result also confirmed that indeed
there were bound aptamers recovered after selection, but the concentrations were too low for
detection by agarose gel from earlier. The yield of the aptamer band from this gel was lower than the
yield of the R7 aptamer band from Figure 7A by about 7.7 times, but this decrease in yield was
expected. The R7 post digest gel from Figure 7A was used to simply purify the aptamer pool prior to
the cell-SELEX and was therefore not subjected to incubation with RBC at 37°C. After selection
against RBC, the recovered aptamer pool subjected to amplification had a much lower starting
concentration for PCR, which resulted in a lower aptamer pool yield than before. The gel image of
the digested product did indicate the presence of high molecular weight byproducts, which were
likely due to nonspecific amplification from lack of purification. However, the presence of trace cell
lysates and other contaminants due to a lack of purification prior to amplification did not result in a
yield that was as low as when GC rich polymerase was used for amplification.
The PCR and digestion verification results (Figure 11) revealed that decreasing number of
PCR cycles from 30 to 15 helped to eliminate all the high molecular weight byproducts. Reducing
30
the number of cycles also eliminated contaminant amplicons from the negative PCR control, where
no DNA template was loaded and amplification should not result in any amplicons. Amplification of
the negative control with 30 cycles revealed the presence of amplified contaminants (Figure 11A).
Marimuthu and colleagues (2012) reported that overamplification by PCR can increase the number of
nonspecific aptamer binders and decrease the pool’s affinity and specificity for its target. The results
had indicated that most of the primers were used after 30 cycles, but many unused primers remained
under 15 cycles of PCR. Overamplifying during PCR can result in most or all of the primers being
used, which can lead to mispairing as the DNA templates begin to bind to each other instead and
produce undesired high molecular weight byproducts (Tuerk, 1990). In a study where SELEX was
performed for isolating aptamers against the protein target erythropoietin, the optimum number of
PCR cycles during amplification was determined to be 12 (Marimuthu et al, 2012). Thus, reducing
the number of cycles to 15 was also optimal for this study. This finding was further confirmed when
the high molecular weight byproducts from amplifying R1 aptamer pool (Figure 10) disappeared
when this same R1 aptamer pool was amplified with 15 cycles of PCR instead for preparing the
samples for flow cytometry analysis (Figure 12A). Thus, the high molecular weight byproducts
observed in Figure 10 were not due to trace cell lysates and contaminants from lack of purification,
but rather it was due to overamplification of background nonspecific amplicons.
Furthermore, reducing the number of PCR cycles also led to more specific amplification.
Since symmetric PCR was used, it is expected that most of the ssDNA aptamers would be converted
to dsDNA aptamers after amplification. When 30 cycles of PCR was used, the positive PCR control
lane in Figure 11A had revealed the presence of ssDNA aptamers even after amplification, and the
amplified dsDNA aptamer band was only 40% more intense than the library. In contrast, no ssDNA
aptamers were present with 15 cycles, which indicated they were all amplified to dsDNA. In fact, the
dsDNA aptamer band from 15 cycles was much more intense and was approximately 230% brighter
than the library. Verification of the digestion with lambda exonuclease (Figure 11A) revealed that the
majority of the dsDNA aptamers after amplification were digested to yield more ssDNA aptamers.
Marimuthu and colleagues (2012) assert that using lambda exonuclease is an unpopular method for
producing ssDNA aptamers from dsDNA aptamers, because the enzyme is expensive and incomplete
digestion can lead to the accumulation of dsDNA. However, the data indicated a high yield of
ssDNA aptamers after digestion with exonuclease and this was further validated when exonuclease
digestion was combined with 15 cycles of PCR for R1 post digest gel of the cell-SELEX protocol
(Figure 12A). The dsDNA aptamers from Figure 7, when R7 aptamer pool was amplified with 30
cycles and digested, was initially thought to be due to GC rich regions and incomplete digestion.
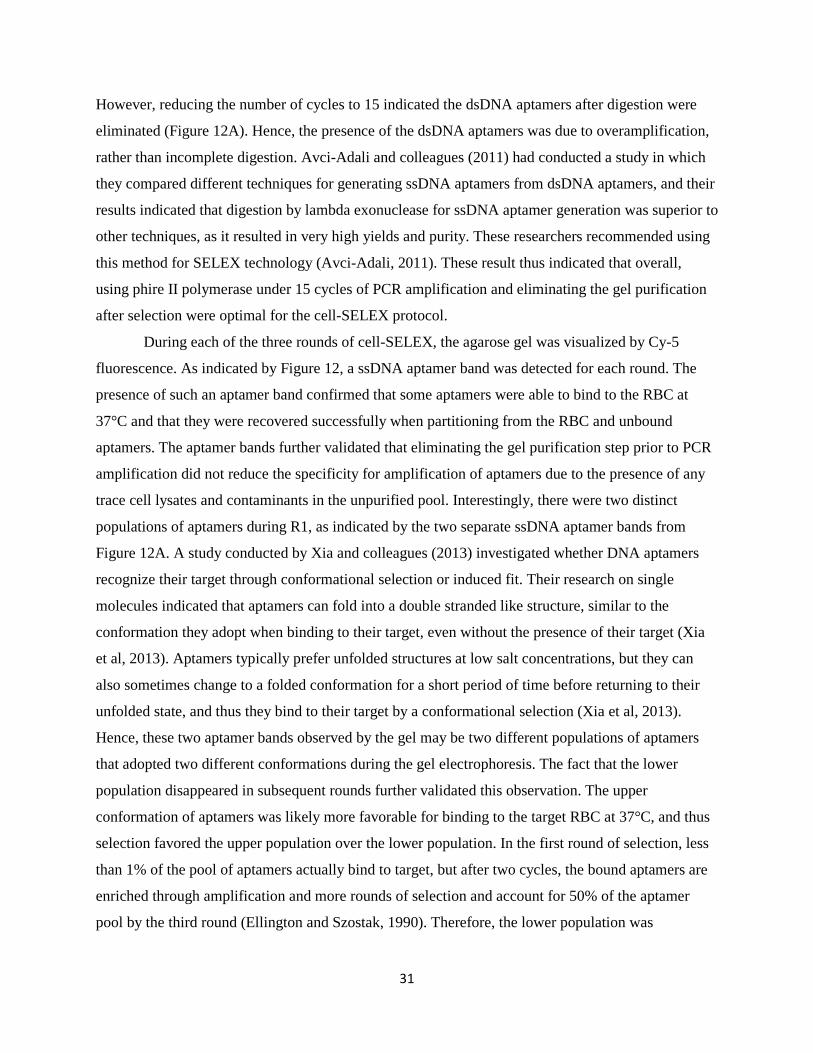
31
However, reducing the number of cycles to 15 indicated the dsDNA aptamers after digestion were
eliminated (Figure 12A). Hence, the presence of the dsDNA aptamers was due to overamplification,
rather than incomplete digestion. Avci-Adali and colleagues (2011) had conducted a study in which
they compared different techniques for generating ssDNA aptamers from dsDNA aptamers, and their
results indicated that digestion by lambda exonuclease for ssDNA aptamer generation was superior to
other techniques, as it resulted in very high yields and purity. These researchers recommended using
this method for SELEX technology (Avci-Adali, 2011). These result thus indicated that overall,
using phire II polymerase under 15 cycles of PCR amplification and eliminating the gel purification
after selection were optimal for the cell-SELEX protocol.
During each of the three rounds of cell-SELEX, the agarose gel was visualized by Cy-5
fluorescence. As indicated by Figure 12, a ssDNA aptamer band was detected for each round. The
presence of such an aptamer band confirmed that some aptamers were able to bind to the RBC at
37°C and that they were recovered successfully when partitioning from the RBC and unbound
aptamers. The aptamer bands further validated that eliminating the gel purification step prior to PCR
amplification did not reduce the specificity for amplification of aptamers due to the presence of any
trace cell lysates and contaminants in the unpurified pool. Interestingly, there were two distinct
populations of aptamers during R1, as indicated by the two separate ssDNA aptamer bands from
Figure 12A. A study conducted by Xia and colleagues (2013) investigated whether DNA aptamers
recognize their target through conformational selection or induced fit. Their research on single
molecules indicated that aptamers can fold into a double stranded like structure, similar to the
conformation they adopt when binding to their target, even without the presence of their target (Xia
et al, 2013). Aptamers typically prefer unfolded structures at low salt concentrations, but they can
also sometimes change to a folded conformation for a short period of time before returning to their
unfolded state, and thus they bind to their target by a conformational selection (Xia et al, 2013).
Hence, these two aptamer bands observed by the gel may be two different populations of aptamers
that adopted two different conformations during the gel electrophoresis. The fact that the lower
population disappeared in subsequent rounds further validated this observation. The upper
conformation of aptamers was likely more favorable for binding to the target RBC at 37°C, and thus
selection favored the upper population over the lower population. In the first round of selection, less
than 1% of the pool of aptamers actually bind to target, but after two cycles, the bound aptamers are
enriched through amplification and more rounds of selection and account for 50% of the aptamer
pool by the third round (Ellington and Szostak, 1990). Therefore, the lower population was
32
eliminated when selection in subsequent rounds did not favor it for binding, and instead the upper
population of aptamers bound to the target and were enriched by PCR after isolation.
As indicated by Figure 12, the aptamer band intensity was highest in R1, then there was a
large drop in intensity for R2, after which the intensity increased again in R3. Ellington and Szostak
(1990) reported that approximately 4% - 5% of the DNA aptamers are ever fully amplified during
PCR, which leads to a 20 – 25 fold increase in the pool after amplification. Thus, the yield after gel
electrophoresis is directly linked to the concentration of the aptamers after selection, when these
pools undergo direct amplification. The concentrations of the aptamer pools after selection confirmed
this observation, since R1 had the highest concentration, followed by R3, and R2. This trend in
concentrations is reflected in the yield from the gel electrophoresis. Ellington and Szostak (1990)
also reported that the complexity of the aptamer pool prior to amplification dropped by 100 fold
different sequences after amplification. Although PCR amplification itself is a necessity in the cell-
SELEX procedure for enrichment purposes, it can also be problematic if it does not result in an ideal
yield of aptamers. The lowest yield occurred for R2, and yet the lower yield was not an issue, since
extracting and purifying this aptamer band and using it for R3 still allowed the isolation of aptamers
against RBC to be possible in R3. One way to improve the yield for PCR amplification for the future
would be to concentrate the recovered aptamer pool after selection prior to subjecting it to PCR. In
their study, Marimuthu and colleagues (2012) discovered that very few bound aptamers were
recovered after selection, and thus they concentrated the aptamers by ethanol precipitation and then
subjected the concentrated pool to PCR amplification. In this study, perhaps concentrating the
aptamer pool in R1 would not have been necessary, but concentrating R2 and R3 aptamer pools after
selection may led to a higher DNA template concentration to yield more amplicons from PCR.
Additionally, the presence of primer dimers indicated by Figure 12 for all three rounds
resulted from primers annealing nonspecifically to each other (Jayasena, 1999). These primer dimers
were inaccessible during amplification and may have contributed to a low amplicon yield. In their
study for amplifying aptamers with emulsion PCR (ePCR). Yufa and colleagues (2015) discovered
that this ePCR technique in which amplification is carried out in microdroplets, prevented the
formation of any byproducts, such as primer dimers. Thus, ePCR could potentially be employed to
reduce byproducts and increase the specificity and yield of amplified products for the enrichment
process in cell-SELEX.
After the completing the cell-SELEX procedure for three rounds, the binding affinity for each
round was verified with flow cytometry. The samples were split into two sets where one set was
checked for binding against RBC at 37°C and another set was checked for binding against RBC at
33
RT. Binding at both temperatures was tested to determine whether there was a difference in binding
between the two temperatures. The original 7th round aptamer pool from cell-SELEX against RBC
binding at RT was used as a starting point for this study. The selection in this study was conducted at
37°C and aptamers binding at 37°C were evolved and enriched further at each round. Plain RBC
were used as an negative control to account for background fluorescence and autofluorescence from
the cells. This sample represented “zero” fluorescence. Additionally, the aptamer library was used as
another negative control. The aptamer library represented a complexity of 1014 to 1015 different
species (Pestourie et al, 2005) and the original R7 aptamer pool was evolved from this library pool of
random sequences. Hence, it was important to determine if the binding affinities of the aptamer pools
increased after the bound aptamers were evolved and enriched through cell-SELEX.
The Cy-5 emission graph (Figure 13A) for all the samples seemed to indicate that no binding
of the aptamers occurred, since the samples appeared to overlap with the emission from plain RBC
representing zero fluorescence. However, an analysis of the Cy-5 median fluorescence values (the
relative fluorescence of the peaks) revealed some subtleties in the binding affinities of the aptamer
pools (Figure 13B). The aptamer pool in R1 had a higher binding affinity at room temperature (RT)
than at 37°C. However, binding affinity of this pool was changed in the next subsequent rounds,
which showed a higher propensity to bind at 37°C than at RT. This result was consistent with the
aptamer band results from the gel images in Figure 12. The first round had two conformational
population of aptamers, but selection favored only the conformation of the upper band for binding
against RBC at 37°C in R2 and R3. Thus, the binding affinities were changed to favor 37°C in R2
and R3, as indicated by the median fluorescent values in Figure 13B. This result is also consistent
with Ellington and Szostak’s (1990) findings, as they had discovered that only 1% of the aptamer
pool contained aptamers that bind to target in round 1, but this percentage of bound aptamers in the
pool increased to 50% in rounds 2 and 3.
The actual values of binding affinities in R2 and R3 were very low. Selected pools ought to
have increased fluorescence compared to DNA aptamer library (Sefah et al, 2010), yet R2 and R3
binding affinities overlapped with binding affinities from the aptamer library for 37°C and RT. The
binding affinity for R2 and R3 pools incubated at RT also overlapped with plain RBC sample
representing zero fluorescence. Selection is complete when there is a significant difference between
the control and selected pools (Sefah et al, 2010). Binding affinities of R2 and R3 for 37°C were only
0.01 relative fluorescent units (RFU) above the negative control plain RBC sample. Hence, the low
binding affinities seem to indicate the aptamers isolated were not able to bind to the RBC at 37°C.
34
Sefah and colleagues (2010) reported that incubating aptamers at high temperatures such as
37°C against live cells may cause internalization of the aptamers. At higher temperatures, the tertiary
structures of aptamers are not as stable to bind to their target, since the aptamers cannot form
complex motifs such as junctions, loops, and bulges that are otherwise stable at lower temperatures
(Tinoco and Bustamante, 1999). However, Sefah and colleagues (2010) reported most aptamers are
able to bind at 37°C, especially high affinity aptamers. Aptamers can be developed to bind to a target
at a specified temperature (Smestad and Maher, 2013). For example, aptamers have been developed
to bind at specified temperatures to their targets using microchips by Hilton and colleagues (2012).
Their study was able to isolate aptamers capable of binding to human immunoglobulin E (IgE) at
physiological temperature of 37°C (Hilton et al, 2012).
However, the study conducted by Hilton and colleagues (2012) used purified protein as an
aptamer target instead of whole live cells. Since this study used cell-SELEX to develop aptamers
against whole live RBC that can bind at 37°C, it may be possible that when incubation was
conducted at 37°C for one hour, any deoxyribonuclease (DNase) from the cells may have come into
contact with bound aptamers and degraded them upon activation of DNase by the physiological
temperature. DNA aptamers can have a short half-life in vivo at only 100 seconds due to degradation
by nucleases (Pestourie et al, 2005). Using aptamer libraries containing modified sequences, such as
the incorporation of 2’-fluoro and 2’-O-methyl groups, can increase nuclease resistance of nucleic
acids (Sefah et al, 2010) without affecting the function of the aptamers (Pestourie et al, 2005). It was
unlikely the DNA aptamers from this study were degraded by DNase during incubation, since mature
RBC lack a nucleus (Shi et al, 2014) and do not possess DNase.
A study by Xia and colleagues (2013) indicated high salinity (360 mM NaCl) favors
aptamers in closed conformation, while low salinity (45 mM NaCl) favors unstructured
conformation, since decreased salinity destabilizes folded structures. Furthermore, their results
indicated a high salinity before selection against the target led to a lower structural recognition, since
the aptamer had already adopted a stable folded structure prior to binding and did not possess the
fluidity to change conformation for better binding to the target (Xia et al, 2013). Similarly, very low
salinity did not allow the aptamer to bind at all, as no partially folded structure necessary for binding
could form and resulted in zero structural recognition (Xia et al, 2013). Their research findings
showed the optimal salinity for DNA aptamer binding was 90 mM. However, since salinity in the
bloodstream is 137 mM, this was the salt concentration in the PBS buffer used during selection.
Since this salinity is higher than the optimal recommended salinity, it is possible it led to lower
bound aptamers recovered due to lower structural recognition to RBC. The physiologic salinity was
35
not as high as 360 mM, and was closer to the 90 mM recommended to be optimal. Additionally, this
PBS buffer was previously used to develop the 7th round aptamer pool with the high binding affinity
to RBC at RT, and so the salinity is likely not a factor contributing to poor binding.
An alternative and more plausible reason for why the binding affinities were rather low for
the aptamer pools may be because only three rounds of cell-SELEX was performed to develop
aptamers against RBC binding at 37°C. In their development of the SELEX procedure, Tuerk and
Gold (1990) recommended that multiple rounds of SELEX allow an enrichment for exponential
increase in the best binding aptamers, until the pool converges to these sequences and there is a
decrease in the pool’s complexity. Jayasena (1999) indicated that most SELEX procedures show high
affinity aptamer enrichment is achieved within 8 – 15 rounds, when approximately 90% of the
enriched pool binds to the target. Berezovski and colleagues (2008) had identified two different
aptamer pools which can differentiate between mature and immature dendritic cells. They reported
that during their cell-SELEX procedure in the first three rounds, the number of nonspecific binders
exceeded the number of aptamers that could bind to their target (Berezovski et al, 2008). Starting
with round 4, a shift in flow cytometry was observed, indicating the library from which the aptamers
were being evolved was undergoing enrichment for bound aptamers, and the shift in flow cytometry
increased until round 10, when saturation of bound aptamers was achieved in their aptamer pool
(Berezovski et al, 2008). Sefah and colleagues (2010) asserted that selection is complete when there
is no significant difference between successive pools. Even though R2 and R3 had the same binding
affinities, perhaps more rounds of cell-SELEX needed to be performed to enrich the pool for bound
aptamers before a significant shift in binding affinities from the aptamer library and the plain RBC
could be observed. SELEX is an evolutionary process, and the nonspecific binding aptamers decrease
as the specific binding aptamers dominate with each round (Sefah et al, 2010). The optimal number
of SELEX cycles needs to be determined experimentally for a particular target. For example, the
research group that identified aptamers against RBC ghosts had shown that over the course of 25
rounds of SELEX, there was a slow and steady improvement in binding affinity, and round 25
aptamer pool had a tenfold better binding affinity than the starting pool (Morris et al, 1998). In
contrast, the group which had identified aptamers against malaria-infected RBC had performed only
eight rounds of cell-SELEX to enrich their aptamer pool.
Even though three rounds of cell-SELEX was conducted and further rounds need to be
performed to validate the results, the small number of cell-SELEX rounds performed still did not
account for the low binding affinities of these DNA aptamers for binding to RBC at RT. In R1, the
binding affinity at RT was only 0.01 RFU more than the plain RBC, and for R2 and R3, the binding

36
affinity at RT overlapped with plain RBC completely, which indicated zero binding. These results
were interesting, especially considering that the 7th round aptamer pool used as a starting point for
cell-SELEX in this study was an aptamer pool with known binding to RBC at RT with high affinity
and specificity. As indicated by Figure S4 in the Appendix, the 7th round aptamer pool had a large
shift in binding affinity from the plain RBC sample and the aptamer library sample. This aptamer
pool was evolved from the random sequence aptamer library and R7 had shown a binding affinity
that had shifted by 0.48 RFU (Figure S4B in Appendix) from the library. This type of shift is typical
for when aptamers are evolved from an aptamer library to bind to a target with a high specificity and
affinity. Even if the aptamers from this study were not able to bind at 37°C, they should have at least
been able to bind at RT with as much high affinity and specificity as the R7 aptamer pool, since the
pools from this study contained the same sequences as the R7 aptamer pool. Thus, the most likely
reason the binding affinities for all samples from flow cytometry were low was due to low
concentrations of aptamer pools used during the procedure.
The dissociation constants of aptamers against their targets are typically in the nanomolar to
picomolar range (Nimjee et al, 2005). For example, the aptamer clones identified to bind to malaria
parasite-infected RBC had dissociation constants that ranged from 14 nM to 84 nM (Birch et al,
2015). Hence, for effective binding of aptamers to RBC to occur and be detected by flow cytometry,
concentrations of aptamers that were at least double their dissociation constants would ideally be
used. Typically, aptamer concentrations between 100 nM to 300 nM work best when verifying their
binding affinities with flow cytometry. All the aptamer concentrations were nearly 50 fold less than
these ideal concentrations, since they had to be diluted to R3 aptamer pool’s concentration of 2.06
nM. The low yield from amplification of the aptamer pool may have contributed to these low
concentrations. The aptamer-RBC complex was diluted even further after selection and immediately
before reading with flow cytometry. Since RBC coagulate and are very viscous, they can potentially
clog the flow cytometer. As such, the RBC had to be heavily diluted, which also diluted the aptamers
they were bound to even further. Yet, the major issue encountered during this study was eluting the
DNA aptamers from the agarose gel during the purification step, which contributed the most to low
aptamer concentrations.
Initially during the cell-SELEX procedure, nucleospin column clean-up protocol was used to
isolate DNA aptamers from the gel. The gel was melted and after the flow through was run through
the column, only DNA remained retained. Afterwards, retained DNA aptamers were eluted from the
column by using PBS buffer. After several elutions from the column, very little Cy-5 fluorescent
DNA aptamers could be detected in the flow through (Figure S5A in Appendix), and many aptamers
37
were retained in the column (Figure S5B in the Appendix). The overall volume of eluted DNA
aptamers was also very small using spin columns. Since flow cytometers required not only a high
concentration, but also a much higher volume of concentrated aptamers, the elution technique was
changed to using PBS buffer. PBS buffer was used since it was required for incubation step to
activate aptamers with Ca2+/Mg2+ ions. PBS buffer was also needed to mimic the physiologic pH and
salinity conditions during selection. When the first trial of aptamers were prepared for testing with
flow cytometry (Figure S2), the extracted gel pieces were incubated with 5 mL of PBS at RT and left
gently shaking for 13 hours to elute the DNA aptamers. However, this initial trial for testing binding
affinities of aptamers had failed, since the binding affinities of all samples were equal to the plain
RBC (Figure S3B). It was also proposed that perhaps the concentrations of the aptamer pools were
too low for successful binding with RBC during flow cytometry. The primary reason for this trial
failing was because old RBC had to be used during the binding assay, and the poor binding from old
RBC had affected the binding affinities as reported by the flow cytometer.
In order to improve the elution of aptamers from the gel, 10 mL of PBS was used to elute the
DNA aptamers during the second trial, and the elution time was increased to 46 hours. Increasing the
volume of buffer increased the surface area available for diffusion of the DNA aptamers to increase
the elution efficiency. The elution time was also increased to ensure more aptamers were eluted.
However, the elutions from the second trial were still poor, as much of the DNA aptamers continued
to remain in the agarose gel (Figure S6 in the Appendix). A different technique that could potentially
be applied in the future for eluting the DNA aptamers from the agarose gel would be to use a more
classic DNA elution buffer, such as 1X Tris-EDTA (TE) buffer, and then concentrating down the
aptamers with centrifugal units to eliminate TE buffer before resuspending aptamers back in PBS
buffer containing Mg2+/Ca2+. Other alternative options could also be pursued, such as isolating the
DNA by rapidly transferring the DNA from agarose gel to nylon membranes (Reed and Mann, 1985).
Hence, the effect that concentration of the aptamer pools had on the flow cytometry results
were tested. Since there were not enough samples left from rounds 1 – 3, 100 nM aptamer library
was tested for its binding against RBC at both RT and 37°C. The results indicated that once again,
the Cy-5 emissions overlapped with the plain RBC sample (Figure 14A), yet further subtleties were
revealed by the median fluorescence intensities (Figure 14B). As expected, library aptamer pools had
low binding affinities, since they were composed of randomized sequences that had not been
enriched for binding to the RBC. Increasing the concentration of the library aptamer by 50 fold did
increase its binding affinity to the RBC by 0.04 RFU. Although this shift was still small, this result
confirmed that the low aptamer concentrations used in flow cytometry likely led to the low binding

38
affinities observed. What is interesting to note is that according to the median fluorescent values
from Figure 14B, the both of the library aptamer pools incubated at 37°C and RT had the same
binding affinity, unlike before. This difference from the previous experiment is attributed to the
differences in the sample complexities of the library. Even though the aptamer library has a
complexity of approximately 1015, not necessarily all of these random sequences are present in a
single aliquot. Thus, the complexity could vary from sample batch to batch. The equal affinity at both
temperatures are reasonable, since no enrichment of either sample of randomized sequences was
performed for the aptamers to have a propensity to bind at one temperature over the other.
There were several limitations associated with this study. For example, the centrifuge
machine used during selection in cell-SELEX could not be set to a temperature higher than the room
temperature. The centrifuge machine was critical during the washing step, when unbound aptamers
were removed from the bound aptamer-RBC complex by adding PBS buffer to the sample, mixing,
and then centrifuging to separate the layers to remove the supernatant containing unbound aptamers.
Since temperature was a critical component in this cell-SELEX study, the centrifuge machine’s
inability to be set to 37°C could have resulted in some bound aptamers being removed during the
washing step if the drop in temperature induced a conformational change. In order to minimize this
limitation, an extra incubation at 37°C for 10 minutes was employed in between each washing step to
re-equilibrate the solution to 37°C before the next washing step. Even so, the centrifuging step was
performed for 5 minutes, and some of the bound aptamers may have been washed away.
Another limitation with this study was that it was difficult to mix the aptamers with RBC
prior to incubation. Since the RBC were live whole cells, keeping their extracellular surface and
integrity intact was critical for proper binding with aptamers. As such, the samples could not be
vortexed, and too much mixing by pipetting was avoided to prevent the shredding of the cells by
passing repeatedly through the small orifice of pipette tips. During the one hour incubation at 37°C,
the buffer containing the aptamers had a tendency to naturally separate from the RBC (Figure S7 in
the Appendix) due to differences in densities. Such a separation could lead to poor binding of
aptamers against RBC, if the aptamers do not have an opportunity for surface contact with the RBC.
In order to address this problem, mixing by pipetting step could be performed every 15 minutes
during incubation. However, too much pipetting could shred the cells as mentioned previously, and
as such a balance ought to be achieved.
Sefah and colleagues (2010) reported that the phosphodiester backbone of DNA aptamers can
interact with lysine and arginine residues on cell surfaces, so that nonspecific binding aptamers are
isolated during the cell-SELEX protocol. Nonspecific binding aptamers could also be isolated if

39
these negatively charged DNA aptamers bind to the positively charged histones on the cell surface,
which would result in aptamers with lower binding affinities in the enriched pool (Sun et al, 2016). A
study conducted by Gupta and colleagues (2011) found that nonspecific binding aptamers could be
minimized by adding an anionic competitor during selection, which increased aptamers with higher
binding affinities. This study employed positive selection of aptamers against RBC, but the pool of
aptamers could also be subjected to negative selection against white blood cells to eliminate
nonspecific binders further (Ni et al, 2011). Negative selection against unwanted targets, such as
white blood cells, would ensure that these aptamers would bind specifically to only RBC in the
bloodstream.
In terms of future directions for this project, many aspects can be considered. The results
indicated the aptamers were able to bind to RBC at 37°C and were successfully isolated from
unbound aptamers. Aptamer pools from R2 and R3 had a higher propensity to bind at 37°C than at
RT. Aptamer binding affinities were low according to results from flow cytometry, but certain
conditions for this study could be improved for the future in order to validate the binding affinities
for these aptamer pools further. The cell-SELEX protocol developed in this study could be optimized
further by improving the PCR amplification step and the DNA aptamer elution from the agarose gel
to result in a higher yield of purified aptamers. More rounds of cell-SELEX could also be performed
to further enrich the aptamer pool to bind at 37°C. The aptamer pools from these further rounds could
be tested for binding against RBC with flow cytometry, and the aptamer pool with the highest
binding affinity could be sequenced. Particular aptamer clones with conserved regions in their
sequences suggest these are functional domains for binding, and thus these particular aptamer clones
could be tested for binding against RBC with flow cytometry (Ellington and Szostak, 1990). Multiple
replicates of binding assays with clones would enable researchers to determine binding affinities for
aptamers, and statistical analyses on these datasets could be performed to determine their statistical
significance. Furthermore, aptamer clones with similar sequences also share similarities in primary
and secondary structures (Morris et al, 1998) and these families compete to bind to overlapping
epitopes (Morris et al, 1998). Berezovski and colleagues (2008) developed a modified aptamer
selection process called aptamer-facilitated biomarker discovery (AptaBiD), which allows aptamers
identified through cell-SELEX to be used to isolate the biomarkers they bind to by mass
spectrometry. As such, this method can be used to identify the molecular targets aptamers bind to on
RBC surface, and this information can enable researchers to predict the structural conformation
adopted by aptamers when binding to RBC surface. These particular aptamer clones can also be
modified by adding a functional group for chemical cross-linking, so that a covalent linkage between
40
the aptamer and target could strengthen the binding affinity between the two (Jayasena, 1999). Such
a modification would be particularly attractive if such aptamers were traveling through the
bloodstream in vivo, where noncovalent interactions can dissociate (Shi et al, 2014)
Although blood type O was used throughout selection process in this study, future research
can focus on using this cell-SELEX protocol to develop DNA aptamers that bind to particular RBC
blood types at 37°C. Antigens present on surface of RBC may influence which aptamers bind best. If
aptamers against particular blood types are developed, then these aptamers can be used for
personalized medicine. Once high affinity and specificity DNA aptamers binding to RBC under
physiological conditions are developed, aptamers can be conjugated to a drug and coupled to surface
of RBC for aptamer facilitated drug delivery by RBC. This new drug delivery system can eliminate
low blood residence times associated with simple aptamer-drug conjugates and it can also eliminate
the problem associated with loading drugs into RBC directly. Since no drugs would be encapsulated
directly inside the RBC, integrity and biocompatibility of the RBC would be maintained.
Additionally, bi-specific aptamers can be used in this novel drug delivery system for targeted
delivery. An aptamer binding to an intravascular cellular target could be conjugated to the aptamer
bound to the RBC in order to direct this drug delivery vehicle to the intravascular target. Since these
DNA aptamers from this study can potentially bind both at 37°C and RT, they would particularly be
useful. The aptamer-drug-RBC conjugate could prepared ex vivo, where binding at RT would be
necessary, and then once inserted in vivo, the aptamer would remain bound to the RBC.
In conclusion, the cell-SELEX procedure for isolation of aptamers binding RBC was
optimized. The results from optimization indicated that using phire II polymerase and employing 15
cycles of PCR during amplification enhanced aptamer enrichment yield. Eliminating gel purification
step after selection was also optimal for the procedure and allowed bound aptamers to be isolated
successfully. Results from cell-SELEX indicated aptamers were able to bind to RBC at 37°C and
these bound aptamers were successfully isolated and enriched for use in each subsequent round.
Screening aptamer pools after three rounds of cell-SELEX with flow cytometry confirmed the
protocol worked, as the last two rounds were enriched to bind preferentially at 37°C. The cell-
SELEX protocol can be optimized further to improve amplicon yields and more rounds of cell-
SELEX can result in higher affinity aptamers to be used for further validation of binding affinities
with flow cytometry. The results indicated that in light of the hypothesis, DNA aptamers can indeed
bind to RBC under physiological conditions and therefore have the potential to be used in an aptamer
facilitated drug delivery system for improved and efficient delivery of therapeutic agents to
intravascular targets.
41
5. References
1. Alvarez FJ, Herraez A, Murciano JC, Jordan JA, Diez JC, Tejedor MC. (1996). In vivo survival and organ uptake of loaded carrier rat erythrocytes. J Biochem, 120, 286 – 291.
2. Berezovski MV, Lechmann M, Musheev MU, Mak TW, Krylov SN. (2008) Aptamer-
facilitated biomarker discovery (AptaBiD). JACS, 130, 0137 – 9143.
3. Biagiotti S, Paoletti MF, Fraternale A, Rossi Luigi, Magnani M. (2011). Drug delivery by red blood cells. IUBMB Life, 63(8), 621 – 631
4. Birch CM, Hou HW, Han J, and Niles CJ. (2015). Identification of malaria-parasite infected
red blood cell surface aptamers by inertial microfluidic SELEX (I-SELEX). Nature Sci Rep, 5, 11347.
5. Breaker RR. (1997). DNA aptamers and DNA enzymes. Curr. Opin. Chem. Biol., 1, 26 – 31.
6. Borman, S. (2014). Hitching a ride on red blood cells. American Chemical Society, 92(27),
5.
7. Boyacioglu O, Stuart CH, Kulik G, Gmeiner WH (2013). Dimeric DNA Aptamer Complexes for High-capacity-targeted Drug Delivery Using pH-sensitive Covalent Linkages. Mol Ther Nucleic Acids, 2, 107.
8. Chakrabarti R, Schutt CE. (2001). The enhancement of PCR amplification by low molecular-weight sulfones. Gene, 274, 293-298
9. Citartan M, Tang TH, Tan SC, Gopinath SCB. (2011). Conditions optimized for the preparation of single-stranded DNA (ssDNA) employing lambda exonuclease digestion in generating DNA aptamer. World J Microbiol Biotechnol, 27, 1167 – 1173.
10. Ellington AD, Szostak JW. (1990). In vitro selection of RNA molecules that bind specific ligands. Nature, 346(6287), 818 – 822.
11. Gupta S, Thirstrup D, Jarvis TC, Schneider DJ, Wilcox SK, Carter J, Zhang C, Gelinas A, Weiss A, Janjic N, Baird GS. (2011). Rapid Histochemistry using slow off rate modified aptamers with anionic competition. Appl Immunohistochem Mol Morphol, 19, 273-278.
12. Gyllensten UB, Allen M. (1993). Sequencing of in vitro amplified DNA. Methods Enzymol.
218, 3 – 16.
13. Hackl EV, Kornilova SV, Blagoi YP. (2005). DNA structural transitions induced by divalent metal ions in aqueous solutions. Int J Biol Macromol. 35(3-4), 175 – 191.

42
14. Healy JM, Lewis SD, Kurz M, Boomer RM, Thompson KM, Wilson C, McCauley TG. (2004). Pharmacokinetics and biodistribution of novel aptamer compositions. Pharm. Res. 21(12), 2234 – 2246.
15. Hilton JP, Kim J, Nguyen T, Barbu M. Pei R, Stojanovic M, and Lin Q. (2012) Isolation of thermally sensitive aptamers on a microchip. MEMS, 25th International Conference proceedings, 100-103
16. Homann M and Goringer HU. Combinatorial selection of high affinity RNA ligands to live African trypanosomes. Proc Natl Acad Sci USA, 95, 2902 – 2907.
17. Ihler GM, Glew RH, Schnure FW. (1973). Enzyme loading of erythrocytes. Proc Natl Acad Sci USA, 70, 2663 – 2666.
18. Jayasena SD. (1999). Aptamers: An emerging class of molecules that rival antibodies in diagnostics. Clinical Chemistry, 45(9), 1628 – 1650.
19. Jenison RD, Gill SC, Pardi A, Polisky B. (1994). High-resolution molecular discrimination by RNA. Science, 263, 1425 – 1429.
20. Jing N, Rando RF, Pommier Y, Hogan ME. (1997). Ion selective folding of loop domains in a potent anti-HIV oligonucleotide. Biochemistry, 36(41), 12498 – 12505.
21. Jo M, Ahn JY, Lee J, Lee S, Hong SW, Yoo JW, Kang J, Dua P, Lee DK, Hong S, Kim S. (2011). c. Oligonucleotides, 21(2).
22. Kang J, Lee MS, Gorenstein DG. (2005). The enhancement of PCR amplification of a random sequence DNA library by DMSO and betaine: Application to in vitro combinatorial selection of aptamers. J. Biochem. Biophys. Methods, 64, 147–151.
23. Kujau MJ, Wolfl S. (1997). Efficient preparation of single-stranded DNA for in vitro
selection. Mol Biotechnol, 7, 333 – 335.
24. Magnani M, Mancini U, Bianchi M, Fazi A. (1992). Comparison of uricase-bound and uricase-loaded erythrocytes as bioreactors for uric acid degradation. Adv Exp Med Biol, 326, 189 – 194.
25. Magnani M, Rossi L, Fraternale A, Bianchi M, Antonelli A, Crinelli R, Chiarantani L. (2002). Erythrocyte-mediated delivery of drugs, peptides and modified oligonucleotides. Gene Therapy, 9, 749 – 751.
26. Mamedov TG, Pienaar E, Whitney SE, TerMaat JR, Carvill G. (2008). A fundamental study of the PCR amplification of GC-rich DNA templates. Computational Biology and Chemistry, 32(6), 452-457.
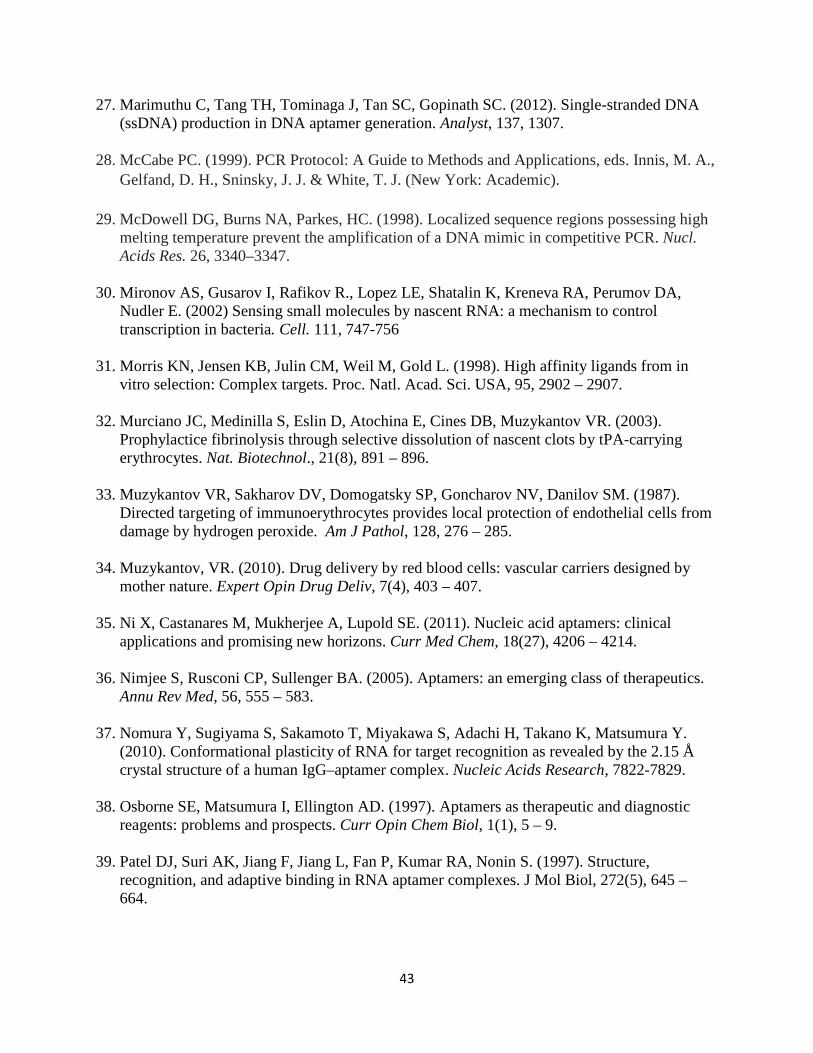
43
27. Marimuthu C, Tang TH, Tominaga J, Tan SC, Gopinath SC. (2012). Single-stranded DNA (ssDNA) production in DNA aptamer generation. Analyst, 137, 1307.
28. McCabe PC. (1999). PCR Protocol: A Guide to Methods and Applications, eds. Innis, M. A., Gelfand, D. H., Sninsky, J. J. & White, T. J. (New York: Academic).
29. McDowell DG, Burns NA, Parkes, HC. (1998). Localized sequence regions possessing high
melting temperature prevent the amplification of a DNA mimic in competitive PCR. Nucl. Acids Res. 26, 3340–3347.
30. Mironov AS, Gusarov I, Rafikov R., Lopez LE, Shatalin K, Kreneva RA, Perumov DA, Nudler E. (2002) Sensing small molecules by nascent RNA: a mechanism to control transcription in bacteria. Cell. 111, 747-756
31. Morris KN, Jensen KB, Julin CM, Weil M, Gold L. (1998). High affinity ligands from in vitro selection: Complex targets. Proc. Natl. Acad. Sci. USA, 95, 2902 – 2907.
32. Murciano JC, Medinilla S, Eslin D, Atochina E, Cines DB, Muzykantov VR. (2003). Prophylactice fibrinolysis through selective dissolution of nascent clots by tPA-carrying erythrocytes. Nat. Biotechnol., 21(8), 891 – 896.
33. Muzykantov VR, Sakharov DV, Domogatsky SP, Goncharov NV, Danilov SM. (1987). Directed targeting of immunoerythrocytes provides local protection of endothelial cells from damage by hydrogen peroxide. Am J Pathol, 128, 276 – 285.
34. Muzykantov, VR. (2010). Drug delivery by red blood cells: vascular carriers designed by mother nature. Expert Opin Drug Deliv, 7(4), 403 – 407.
35. Ni X, Castanares M, Mukherjee A, Lupold SE. (2011). Nucleic acid aptamers: clinical applications and promising new horizons. Curr Med Chem, 18(27), 4206 – 4214.
36. Nimjee S, Rusconi CP, Sullenger BA. (2005). Aptamers: an emerging class of therapeutics. Annu Rev Med, 56, 555 – 583.
37. Nomura Y, Sugiyama S, Sakamoto T, Miyakawa S, Adachi H, Takano K, Matsumura Y. (2010). Conformational plasticity of RNA for target recognition as revealed by the 2.15 Å crystal structure of a human IgG–aptamer complex. Nucleic Acids Research, 7822-7829.
38. Osborne SE, Matsumura I, Ellington AD. (1997). Aptamers as therapeutic and diagnostic reagents: problems and prospects. Curr Opin Chem Biol, 1(1), 5 – 9.
39. Patel DJ, Suri AK, Jiang F, Jiang L, Fan P, Kumar RA, Nonin S. (1997). Structure, recognition, and adaptive binding in RNA aptamer complexes. J Mol Biol, 272(5), 645 – 664.
http://www.ncbi.nlm.nih.gov/pubmed/?term=Murciano%20JC%5BAuthor%5D&cauthor=true&cauthor_uid=12845330
http://www.ncbi.nlm.nih.gov/pubmed/?term=Medinilla%20S%5BAuthor%5D&cauthor=true&cauthor_uid=12845330
44
40. Pestourie C, Tavitian B, Duconge F. (2005). Aptamers against extracellular targets for in vivo applications. Biochemie, 87, 921 – 930.
41. Reed KC, Mann DA. (1985). Rapid transfer of DNA from agarose gels to nylon membranes. Nucl. Acids Res., 13(20), 7207 – 7221.
42. Rossi L, Serafini S, Cenerini L, Picardi F, Bigi L, Panzani I, Magnani M. (2001). Erythrocyte-mediated delivery of dexamethasone in patients with chronic obstructive pulmonary disease. Biotechnol. Appl. Biochem, 33, 85 – 89.
43. Ruckman J, Green LS, Beeson J, Waugh S, Gillette WL, Henninger DD, Claesson-Welsh L, Janjić N. (1998). 2*-Fluoropyrimidine RNA-based Aptamers to the 165-Amino Acid Form of Vascular Endothelial Growth Factor (VEGF165). J Biol Chem, 273(32), 20556 – 20567.
44. Saifer MG, Williams LD, Sobczyk MA, Michaels SJ, Sherman MR (2014).Selectivity of binding of PEGs and PEG-like oligomers to anti-PEG antibodies induced by methoxyPEG-proteins. Mol Immunol, 57, 236–246.
45. Sanchez JA, Pierce KE, Rice JE, Wangh LJ. Linear-After-The-Exponential (LATE)–PCR: An advanced method of asymmetric PCR and its uses in quantitative real-time analysis. PNAS, 101(7) 1933 – 1938.
46. Sefah K, Shangguan D, Xiong X, O’Donoghue MB, Tan W. (2010). Development of DNA aptamers using Cell-SELEX. Nature Protocols, 5(6), 1169 – 1185.
47. Shi H, He X, Wang K, Wu X, Ye X, Guo Q, Tan W, Qing Z, Yang X, Zhou B. (2011). Activatable aptamer probe for contrast-enhanced in vivo cancer imaging based on cell membrane protein triggered conformation alteration. Proc. Natl. Acad. Sci. U S A 108(10), 3900–3905.
48. Shi J, Kundrat L, Pishesha N, Bilate A, Theile C, Maruyama T, Dougan SK, Ploegh HL, Lodish HF. (2014). Engineered red blood cells as carriers for systemic delivery of a wide array of functional probes. PNAS, 111(28), 10131 – 10136.
49. Smestad J, Maher, LJ. (2013) Ion-dependent conformational switching by a DNA aptamer that induces remyelination in a mouse model of multiple sclerosis. Nucleic Acids Res. 41, 1329-134240.
50. Smirnov VN, Domogatsky SP, Dolgov VV, Hvatov VB, Klibanov AL, Koteliansky VE, Muzykantov VR, Repin VS, Samokhin GP, Shekhonin BV. (1986). Carrier-directed targeting of liposomes and erythrocytes to denuded areas of vessel wall. Proc Natl Acad Sci USA, 83, 6603 – 6607.
51. Subramanian N, Raghunathan V, Kanwar JR, Kanwar RK, Elchuri SV, Khetan V. (2012). Target-specific delivery of doxorubicin to retinoblastoma using epithelial cell adhesion molecule aptamer. Mol Vis, 18, 2783–2795.

45
52. Sun H, Zhu X, Lu PY, Rosato RR, Tan W, Zu Y. (2014). Oligonucleotide aptamers: new
tools for targeted cancer therapy. Mol Ther Nucleic Acids, 3, 182.
53. Sun H, Zu Y. (2015). A highlight of recent advances in aptamers technology and its application. Molecules, 20(7), 11959 – 11980.
54. Sun H, Zhu X, Lu PY, Rosato RR, Tan W, Zu Y. (2016). Aptamers: Versatile molecular recognition probes. Analyst, 141, 403 – 415.
55. Tinoco I, Bustamante C. (1999) How RNA folds. J.Mol.Biol. 293, 271-281
56. Tuerk C. (1990). Methods in Molecular Biology, PCR Cloning Protocols From Molecular Cloning to Genetic Engineering, Ed. B.A. White. (New Jersey: Humana Press Inc).
57. Tuerk C, Gold L. (1990). Systematic Evolution of Ligands by Exponential Enrichment: RNA ligands to bacteriophage T4 DNA polymerase. Science, 249(4968), 505 – 510.
58. Tuerk C, MacDougal S, Gold L. (1992). RNA pseudoknots that inhibit human immunodeficiency virus type 1 reverse transcriptase. Proc Natl Acad Sci USA, 89(15), 6988 – 6992.
59. Vant-Hull B, Payano Baez A, Davis RH, Gold L. (1998). The mathematics of SELEX against complex targets. J Mol Biol, 278, 579 – 597.
60. Waters EK, RJ, Schaub RG, Kurz JC. (2009). Effect of NU172 and bivalirudin on ecarin clotting time in human plasma and whole blood. J. Thromb. Haemost. PPWE-168.
61. Wiegand TW, Williams PB, Dreskin SC, Jouvin MH, Kinet JP, Tasset D. (1996). High-affinity oligonucleotide ligands to human IgE inhibit binding to Fc epsilon receptor I. J Immunol, 157(1), 221 – 230.
62. Winkler WC, Breaker RR. (2003). Genetic control by metabolite-binding riboswitches. Chembiochem, 4(10), 1024 – 1032.
63. Xia T, Yuan J, and Fang Xiaohong. (2013). Conformational dynamics of an ATP-binding DNA aptamer: A single-molecule study. J Phys Chem B, 117(48), 14994 – 15003.
64. Yufa R, Krylova SM, Bruce C, Bagg EA, Schofield CJ, Krylov SN. (2015). Emulsion PCR significantly improves nonequilibrium capillary electrophoresis of equilibrium mixtures-based aptamer selection: Allowing for efficient and rapid selectionof aptamer to unmodified ABH2 protein. Anal Chem, 87(2), 1411 – 1419.
65. Zaitsev S, Spitzer D, Murciano JC, Ding BS, Tliba S, Kowalska MA, Marcos-Contreras OA,
Kuo A, Stepanova V, Atkinson JP, Poncz M, Cines DB, Muzykantov VR. (2010). Sustained

46
thromboprophylaxis mediated by an RBC-targeted pro-urokinase zymogen activated at the site of clot formation. Blood, 115(25), 5241 – 5248.
66. Zhu G, Meng L, ye M, yang L, Sefah K, O’Donoghue MB, Chen Y, Xiong X, Huang J, Song E, Tan W. (2012). Self-assembled aptamer-based drug carriers for bispecific cytotoxicity to cancer cells. Chem Asian, 7, 1630 – 1636.
47
6. Appendix
6.1 Supplementary Figures
Figure S1. R7 post digest gel electrophoresis with phire II polymerase. 100 nM aptamer library with length of 80 nucleotides was run against sample of the original R7 aptamer pool after 30 cycles of PCR amplification and 5 hours of digestion with lambda exonuclease at 37°C. The 4% agarose gel electrophoresis was carried out at 150 V for 45 minutes in 0.5X TBE buffer. R7 ssDNA aptamer band was 777% more intense than the aptamer library. There were several high molecular weight byproducts and the presence of primer dimers. This aptamer band was extracted and subjected to the first round of cell-SELEX use in this study.

48
A) B)
C)
Figure S2. Post digest gel electrophoresis for rounds 1 to 3 of cell-SELEX. After incubation with RBC at 37°C, isolation and enrichment of the bound aptamers by PCR amplification and digestion with lambda exonuclease, the aptamer pools were run through 4% agarose gel electrophoresis for 45 min at 150 V in 0.5X TBE buffer. The 100 nM library was loaded against each aptamer pool to determine which band corresponded to the 80 nucleotide ssDNA aptamers. A) Post digest gel for R1 aptamer pool, after amplification for 15 cycles and digestion. Two different populations of ssDNA aptamers that were 164% more intense than the 100 nM library were observed. B) Post digest gel for R2 aptamer pool, after amplification for 15 cycles and then digestion. A single population of ssDNA aptamer band with an intensity 67% less than the 100 nM library observed. C) Post digest gel for R3 aptamer pool, after amplification for 30 cycles and then digestion. A single population of ssDNA aptamer band with an intensity that was 200% more intense than the 100 nM library was observed. These aptamer bands were extracted and the DNA was eluted from the gel by incubating in 5 mL of PBS buffer containing Ca2+/Mg2+
overnight for 13 hours at room temperature, gently shaking.
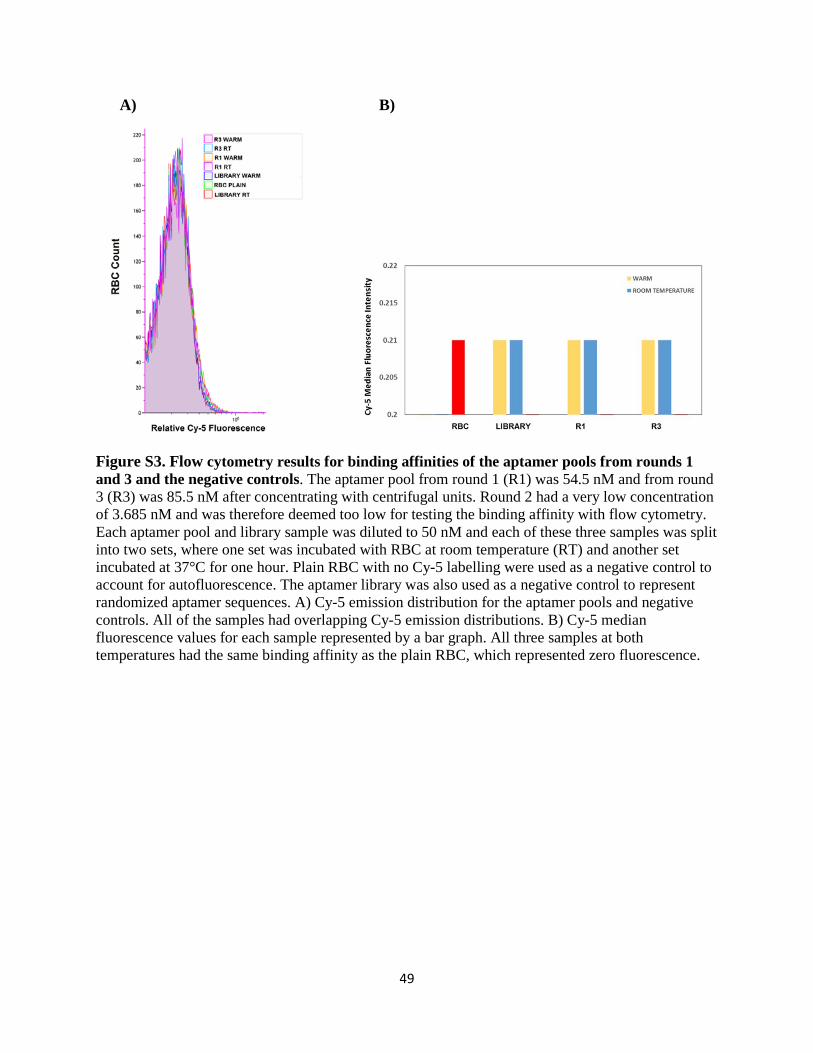
49
A) B)
Figure S3. Flow cytometry results for binding affinities of the aptamer pools from rounds 1 and 3 and the negative controls. The aptamer pool from round 1 (R1) was 54.5 nM and from round 3 (R3) was 85.5 nM after concentrating with centrifugal units. Round 2 had a very low concentration of 3.685 nM and was therefore deemed too low for testing the binding affinity with flow cytometry. Each aptamer pool and library sample was diluted to 50 nM and each of these three samples was split into two sets, where one set was incubated with RBC at room temperature (RT) and another set incubated at 37°C for one hour. Plain RBC with no Cy-5 labelling were used as a negative control to account for autofluorescence. The aptamer library was also used as a negative control to represent randomized aptamer sequences. A) Cy-5 emission distribution for the aptamer pools and negative controls. All of the samples had overlapping Cy-5 emission distributions. B) Cy-5 median fluorescence values for each sample represented by a bar graph. All three samples at both temperatures had the same binding affinity as the plain RBC, which represented zero fluorescence.

50
A)
B)
Figure S4. Flow cytometry for 10 rounds of cell-SELEX for aptamers binding RBC at RT. 10 rounds of cell-SELEX was performed by Evan Bushnik to find aptamer pool that binds to RBC with high affinity at room temperature. Each round and the aptamer library were diluted to 62.5 nM. Plain RBC with no Cy-5 labelling were used as a negative control to account for autofluorescence. The aptamer library was also used as a negative control to represent randomized aptamer sequences. A) Cy-5 emission distribution for the aptamer pools and negative controls. The round 7 aptamer pool (indicated by the arrow) had the largest shift and highest binding from the negative controls compared to the other rounds two. B) Cy-5 median fluorescence values for plain RBC, aptamer library, and 7th round aptamer pool represented by a bar graph. The R7 aptamer pool had a binding affinity that was 0.48 relative fluorescence units higher than the library and 0.61 relative fluorescence units higher than the plain RBC.
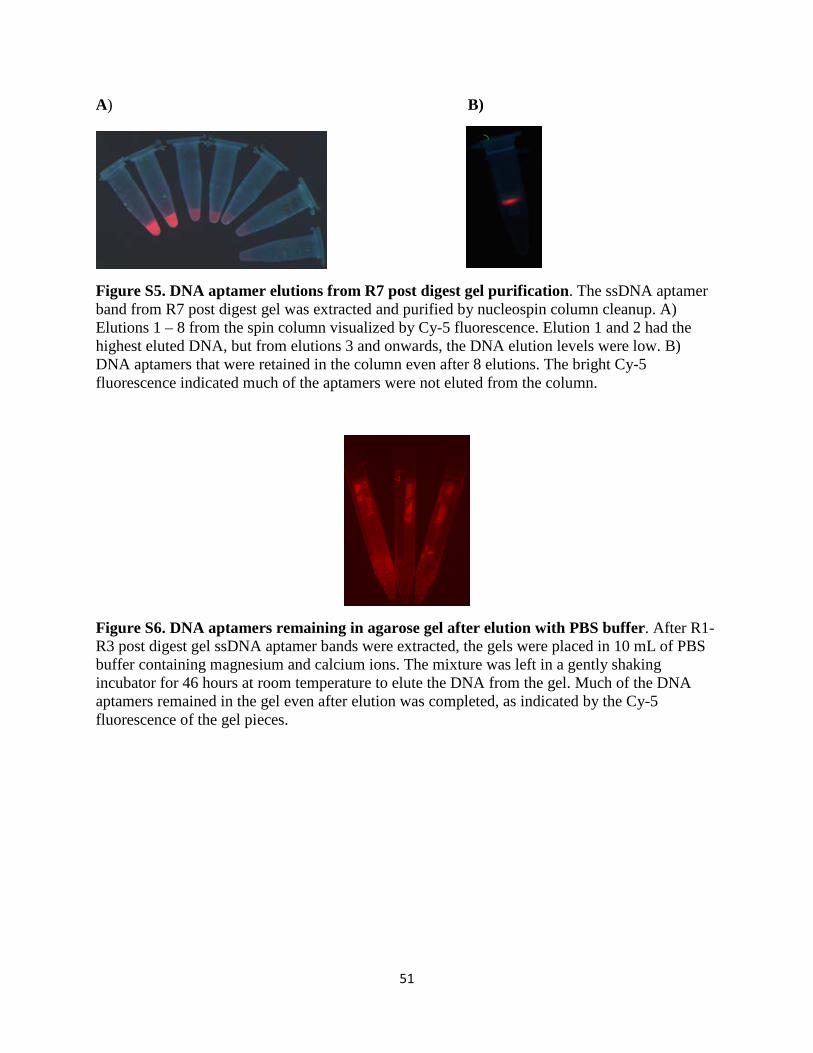
51
A) B)
Figure S5. DNA aptamer elutions from R7 post digest gel purification. The ssDNA aptamer band from R7 post digest gel was extracted and purified by nucleospin column cleanup. A) Elutions 1 – 8 from the spin column visualized by Cy-5 fluorescence. Elution 1 and 2 had the highest eluted DNA, but from elutions 3 and onwards, the DNA elution levels were low. B) DNA aptamers that were retained in the column even after 8 elutions. The bright Cy-5 fluorescence indicated much of the aptamers were not eluted from the column.
Figure S6. DNA aptamers remaining in agarose gel after elution with PBS buffer. After R1-R3 post digest gel ssDNA aptamer bands were extracted, the gels were placed in 10 mL of PBS buffer containing magnesium and calcium ions. The mixture was left in a gently shaking incubator for 46 hours at room temperature to elute the DNA from the gel. Much of the DNA aptamers remained in the gel even after elution was completed, as indicated by the Cy-5 fluorescence of the gel pieces.

52
Figure S7. Separation of RBC and buffer after incubation. The RBC and DNA aptamer pools were suspended in PBS buffer containing magnesium and calcium ions during incubation at 37°C for one hour. During incubation, the buffer and RBC layers formed naturally separated due to differences in densities. Such a separation may be detrimental to the selection process, as aptamers in the buffer layer may not be able to bind to the RBC, and potential high affinity aptamers can be eliminated during the washing step.