Selection Contractors in E-Tendering Procurement Of Goods ...
5
* Corresponding author: [email protected], [email protected] Selection Contractors in E-Tendering Procurement Of Goods And Services Bureau Central Kalimantan Using Analysis Network Process Citra Amalia 1 and Djoko Budiyanto Setyohadi 2 123 Magister Teknik Informatika, Universitas Atma Jaya Yogyakarta, Yogyakarta – Indonesia 55281 Abstract. Selection a contractor in e-tendering procurement of goods and service is an routine activity at tenders of Central Kalimantan government. It task is doing the selection against the contractors of e-tendering that offer documents are uploaded on the website of the official Bureau of procurement of goods and services of Central Kalimantan. Selection a contractor is a complicated task because it must be transparently but the problem is the system still lacks proper judgment for not explained about score points for contractors who do not win. System use fall system and not give a thorough explanation about contractors who did not win the tender. This research aims to be able to resolve the problem using Analysis Network Process to select contractor to provide the weight of each of the criteria. The criteria are administrative, price, technical, and prove the qualifications must be completed by each participant contractor who register on e-tendering. The contributin this research serve as a guide for the Bureau of procurement of goods and services and select the contractor in tenders held so a clear assessment and is open to contractors who follow e-tendering held Bureau Procurement of goods and services in Central Kalimantan. Keywords: Procurement; E-tendering, Analysis Network Process, Contractors, Central Kalimantan. 1 Introduction Indonesia have many Imperial construction companies that is as much as over one hundred thousand construction companies in Indonesia. In Indonesia there are 128,570 contractors active nationally. Details of the number of small contractors as much as 108,626 or 85%. The number of big contractors only 2% or 2,433 contractors and contractor 17,511 medium or 14% [1]. Procurement Of Goods And Services Bureau in Central Kalimantan handle project tenders procurement of goods and construction working above 200 million rupiah. Projects under the 200 million rupiah is handled directly by the Agency through a direct appointment- related contractors. A tender on selection of Bureau of procurement of goods and services through several stages, namely the administrative file selection, selection of technical work, selection of price and selection of proof qualifications. The current bureau system this is a knockout. It is becoming one of the focus of the research is due to leave the system fall used to be an issue that is often on the talk about local contractors in Central Kalimantan since determination of the winners don't pay attention to the weight of each criterion points. In the selection of contractors is less appropriate if using knockout because of not considering the overall score points but only pay attention to the completeness of the file. Bureau of procurement of goods and services formed a team in each tender which held that is composed of a Chairman and two members. The team in charge of conducting the selection against the tender. Contractor selection with four stages, namely administration, technical work, price quotes, and Standard Procurement Documents based on qualifying goods/services the Government Electronically with E- Tendering (Regulation No. 4 of the year 2015) [2]. In the selection of contractors, the team has the task of deciding the winner of the tender on the basis of predetermined criteria. The team used the knockout in the selection of contractors in Central Kalimantan. In this study the author aims at contributing to the fall of the system into a system of weighting the scoring to be transparent on the selection of contractors. In this study use ANP (Analytic Network Process). The Analytic Network Process (ANP) i.e. selection with several stages, namely determining criteria, weighting, pairwise comparison, eigen vector, test the consistency of the ratio, then rank [3]. The Analytic Network Process (ANP) is a a multicriteria theory of measurement used to derive relative priority scales of absolute numbers from https://doi.org/10.1051/e3sconf/201873 , (2018) E3S Web of Conferences 73 ICENIS 2018 0 1 1 300 30 5 5 © The Authors, published by EDP Sciences. This is an open access article distributed under the terms of the Creative Commons Attribution License 4.0 (http://creativecommons.org/licenses/by/4.0/).
Transcript of Selection Contractors in E-Tendering Procurement Of Goods ...

* Corresponding author: [email protected], [email protected]
Selection Contractors in E-Tendering Procurement Of Goods And Services Bureau Central Kalimantan Using Analysis Network Process
Citra Amalia1 and Djoko Budiyanto Setyohadi2
123Magister Teknik Informatika, Universitas Atma Jaya Yogyakarta, Yogyakarta – Indonesia 55281
Abstract. Selection a contractor in e-tendering procurement of goods and service is an
routine activity at tenders of Central Kalimantan government. It task is doing the selection
against the contractors of e-tendering that offer documents are uploaded on the website of
the official Bureau of procurement of goods and services of Central Kalimantan. Selection
a contractor is a complicated task because it must be transparently but the problem is the
system still lacks proper judgment for not explained about score points for contractors who
do not win. System use fall system and not give a thorough explanation about contractors
who did not win the tender. This research aims to be able to resolve the problem using
Analysis Network Process to select contractor to provide the weight of each of the criteria.
The criteria are administrative, price, technical, and prove the qualifications must be
completed by each participant contractor who register on e-tendering. The contributin this
research serve as a guide for the Bureau of procurement of goods and services and select
the contractor in tenders held so a clear assessment and is open to contractors who follow
e-tendering held Bureau Procurement of goods and services in Central Kalimantan.
Keywords: Procurement; E-tendering, Analysis Network Process, Contractors,
Central Kalimantan.
1 Introduction
Indonesia have many Imperial construction
companies that is as much as over one hundred thousand
construction companies in Indonesia. In Indonesia there
are 128,570 contractors active nationally. Details of the
number of small contractors as much as 108,626 or 85%.
The number of big contractors only 2% or 2,433
contractors and contractor 17,511 medium or 14% [1].
Procurement Of Goods And Services Bureau in
Central Kalimantan handle project tenders procurement
of goods and construction working above 200 million
rupiah. Projects under the 200 million rupiah is handled
directly by the Agency through a direct appointment-
related contractors. A tender on selection of Bureau of
procurement of goods and services through several
stages, namely the administrative file selection, selection
of technical work, selection of price and selection of
proof qualifications. The current bureau system this is a
knockout. It is becoming one of the focus of the research
is due to leave the system fall used to be an issue that is
often on the talk about local contractors in Central
Kalimantan since determination of the winners don't pay
attention to the weight of each criterion points. In the
selection of contractors is less appropriate if using
knockout because of not considering the overall score
points but only pay attention to the completeness of the
file. Bureau of procurement of goods and services
formed a team in each tender which held that is
composed of a Chairman and two members. The team in
charge of conducting the selection against the tender.
Contractor selection with four stages, namely
administration, technical work, price quotes, and
Standard Procurement Documents based on qualifying
goods/services the Government Electronically with E-
Tendering (Regulation No. 4 of the year 2015) [2].
In the selection of contractors, the team has the
task of deciding the winner of the tender on the basis of
predetermined criteria. The team used the knockout in
the selection of contractors in Central Kalimantan. In
this study the author aims at contributing to the fall of
the system into a system of weighting the scoring to be
transparent on the selection of contractors. In this study
use ANP (Analytic Network Process). The Analytic
Network Process (ANP) i.e. selection with several
stages, namely determining criteria, weighting, pairwise
comparison, eigen vector, test the consistency of the
ratio, then rank [3]. The Analytic Network Process
(ANP) is a a multicriteria theory of measurement used to
derive relative priority scales of absolute numbers from
https://doi.org/10.1051/e3sconf/201873 , (2018)E3S Web of Conferences 73ICENIS 2018
01 1300 3 05 5
© The Authors, published by EDP Sciences. This is an open access article distributed under the terms of the Creative Commons Attribution License 4.0 (http://creativecommons.org/licenses/by/4.0/).

individual judgments (or from actual measurements
relative to a normalized form) that also belong to a
fundamental scale of absolute numbers [4].
This research aims to provide theoretical
contribution about the ANP with the awarding of the
weighting on each criterion because Bureau of
procurement of goods and services (BPBJ) Central
Kalimantan did not previously use the system weights
but knockout so this study into consideration Committee
working group decision in determining the winner of the
tender for construction in Central Kalimantan.
2 Literature Review
2.1. Analysis Network Process
According to hosseini [5] The ANP methodology
consists of three main steps, namely, pairwise
comparisons and local priority vectors, weighted matrix,
and super super matrix formation and transformation.
ANP is used for the selection of the best strategy in
supply chain risk issues.
Stages of the ANP, according to coulter et al [6] is a
decision problem, using pairwise comparison, The
relative weights or priorities of the elements, Relative
local priorities of each element, Additional "files" of
elements, Networks of files.
According to jeon et al. [7], the ANP are used in
networking cooperation partners. Approach based on the
analytic network process (ANP) to rank a set of potential
candidates within a multivariate set of attributes
systematically. The criteria used are the 25 criteria.
2.2 Pairwise Comparison
The use of pairwise comparisons for comparison
matrix criteria is a lot of trouble if too many criteria. In
addition, the ANP pairwise comparison procedure and
subsequent analysis permits the integration of
quantitative and qualitative /intangible/ tangible
measures into a single overall score for ranking decision
alternatives. Finally, the ANP is superior to other forms
of multiattribute analysis [8] as well as to choice-based
conjoint methods, in that it enables its user to consider
interdependencies between and among factors.
2.3 Consistency Ratio
According to kabak et al [9] If the value of Consistency
Ratio (CR) for the matrix is smaller than 10%, the DMs '
consistency for the evaluations within the matrix is
acceptable. If the CR is equal to or greater than 10%,
pairwise comparisons within the matrix must be
evaluated again.
3 Methodology
Methodology used ANP with the following stages.
1. Study Literatur : Study of the theory of
reference related to the topic, namely the
method of ANP.
2. Identification Problem : Study of the theory of
reference related to the topic IE
maMengidentifikasi problem in the topic of
research and looking for the best solution in a
case study using the method of ANP in the
selection of contractors in Central Kalimantan
with ANP method.
3. Data Collection : The data obtained is
qualitative data, observations, interviews.
4. Tahapan ANP : - Determine Criteria : Data based on Standard
Documents Government procurement of
goods/services Electronically with E-are
Tendering (Regulation No. 4 of the year
2015)
- Pairwise Comparison : Pairwise comparison
is used in decision making for forming the
matrix so that the changed data into a ratio
- Eigen Vector
- Test Consistency ratio : The ratio of
consistency is done in order to ascertain
whether the judgment being entered is
accurate and can be used for the calculation
of the ANP. According to the rules,
consistent comparison matrix only if the
value of the CR is less than 0.1 [10].
- Rank
4 Discussion
Stages of research using the ANP for selection of
contractors in Central Kalimantan.
1. Criteria
Criteria are used in accordance with the
standard Procurement documents of
goods/services the Government Electronically
with E-are Tendering (Regulation No. 4 of the
year 2015) published the Agency Procurement
Policies Government goods/services, namely
administration, technical, pricing, and
qualifications. Its administrative HR criteria
i.e. completeness of legality of administrative
files, technical is a document discussing the
technical work, i.e. the price the total price bid
contractor against tender qualifications, namely
proof of the authenticity of all documents
administrative, technical and price review by
tim Bureau of procurement of goods and
services.
2. Weight of Criteria
The weighting of criteria based on the scale of
the ANP saaty as follows:
Table 1. The fundamental scale of absolute numbers (saaty) Intensity of
importance
Definition
1 Equal Importance
2 Weak or slight
3 Moderate importance
4 Moderate plus
5 Strong importance
6 Strong plus
https://doi.org/10.1051/e3sconf/201873 , (2018)E3S Web of Conferences 73ICENIS 2018
01 1300 3 05 5
2

7 Very strong or demonstrated
importance
8 Very, very strong
9 Extreme importance
Reciprocals of
above
If activity i has one of the above non-
zero numbers assigned to it when compared with i
Based on the table above then established criteria with
weights of interest as follows: Table 2. criteria Criteria Adminis-
tration
Techn-
ical
Price Qualification
administration 1 0,33 0,20 0,14
Technical 3 1,00 0,60 0,43
Price 5 1,67 1,00 0,71
Qualification 7 2,33 1,40 1,00
total 16 5,33 3,2 2,29
Description :
1. Administrative Criteria-Administration (1): just as
important as its administrative HR administration
2. Technical Criteria – Administration (3): a little
more important than technical administration
3. The criterion of price-administration (5): price is
more important than the Administration
4. Qualifying Criteria – Administration (7):
qualifying is very important from the
administrative
5. Administrative Criteria – technical (1/3): Use the
inverse of the technical criteria against
administrative inverse for comparison
6. Technical Criteria-technical (1): technical is as
important as the technical
7. Price – Technical Criteria (5/3): Use the inverse of
the technical criteria for comparison against the
price of the inverse
8. Qualifying Criteria – technical (7/3): Use the
inverse of the technical criteria against the
qualifications for the comparison of the inverse
9. Administrative Criteria – price (1/5): Use the
inverse criteria for comparison against the price
administrative inverse
10. Technical Criteria – price (3/5): Use the inverse of
the technical criteria for comparison against the
price of the inverse
11. Price – the price Criterion (1): the price is as
important as price
12. Qualifying Criteria – price (7/5): Use the inverse
criteria qualifying for comparison against the price
of the inverse
13. Administrative Criteria-qualifications (1/7): Use
the opposite qualifying criteria against the
Administration for comparison of the inverse
14. Technical Criteria – qualifications (3/7): Use the
inverse criteria qualifying against technical
comparison for the inverse
15. Price Criteria – qualifications (5/7): Use the
opposite qualifying criteria for comparison against
the price of the inverse
16. Qualifying Criteria – qualifications (1): qualifying
as important as qualifying..
3. Pairwise Comparison
Pairwise comparison is used in determine the decision to
form the matrix so as to change the data into the ratio
[11]. Paired comparison matrix mengkalikan i.e. himself
against himself as below. 1 0,33 0,20 0,14 1 0,33 0,20 0,14
3 1,00 0,60 0,43 x
3 1,00 0,60 0,43
5 1,67 1,00 0,71 5 1,67 1,00 0,71
7 2,33 1,40 1,00 7 2,33 1,40 1,00
=
4 1,33 0,8 0,57
12 4 2,4 1,71
20 6,67 4 2,86
28 9,33 5,6 4
The result matrix criteria pairwise comparison:
=
From the matrix above, eigen vector can be determined,
lambda consistensi index and maximum, and consistensi
ratio. Eigen vector values obtained from the division
between the first line against the number of values in the
first column of the second row in Add and divide the
amount of the value of the second column and so on up
to four columns.
The number of the first column of the matrix:
4 + 12 + 20 + 28 = 64
The amount of the second column of the matrix:
1,33 + 4 + 6,67 + 9,33 = 21,33
The number of the third column of the matrix:
0,8 + 2,44 + 4 + 5,6 = 12,8
The number of the fourth column of the matrix:
0,57 + 1,71 + 2,86 + 4 = 91,4
4. Eigen Vector
Next do the calculations to find the following eigen
vector.
Eigen vector lines 1:
= 0,0625
Eigen vector line 2 :
= 0,1875
Eigen vector line 3 :
= 0,3125
Eigen vector line 4 :
= 0,4375
Table 3. The value of the Eigen Vector Criteria against the
matrix of pairwise comparison
A T H K eVECTOR
A 1 0,33 0,20 0,14 0,0625
T 3 1,00 0,60 0,43 0,1875
H 5 1,67 1,00 0,71 0,3125
K 7 2,33 1,40 1,00 0,4375
jumlah 16 5,33 3,2 2,29 1
Description :
https://doi.org/10.1051/e3sconf/201873 , (2018)E3S Web of Conferences 73ICENIS 2018
01 1300 3 05 5
3

A = Administrative
T = Technical
H = Price
K= Qualification
5. Test Consistency Ratio
Next is calculating the maximum lamda as follows:
λmaks : (16 x 0,0625)+(5,33x0,1875)+
(3,2x0,3125)+(2,29x0,4375) = 4
Consistency index = = 0 as in equation
Where CI:
(1)
On matrix consistency, practically , While
not every variation of the matrix will bring changes to
the value of . Deviation from n is a
parameter of the Consistency Index (CI).
Description:
CI= Consistency Index
= maks eigen value
n = the number of elements that are further than did the
calculation equation with the formula CR :
(2)
Description:
CR = Consistency Ratio
CI = Consistency Index
RI = Random Index
Table 4. Random Index
Ord
er
1 2 3 4 5 6 7 8 9 10
R.I. 0 0 0.52
0.89
1.11
1.25
1.35
1.40
1.45
1.49
The ratio of the consistency or CR obtained using
equation 2.2
The value of the RI for n = 4 is 0.89 can be seen in table
2.2
CR = CI/RI = 0/0,89 = 0
The above value is consistent because CR ≤ 0.1. If the
value of CR > 0.1 then not consistent or unqualified and
subsequent decision matrix should be repeated until the
CR values consistently or qualify the consistency.
6. Determine value alternative
- Value alternative Table 5. contractor appraisal information
Value description
0-50 Not Good
51-69 Enough
70-84 Good
85-100 Very good
The value of the specified range, the data range that is
created into a scale of interests saaty, can be seen in the
following table: Table 6. Range alternatif comparison
Range Value of interest
Very good-very good 1
Very good – good 3
Very good – enought 5
Very good – not good 7
good –enought 2
good – not good 4
enought – not good 2
Here is an example of the case selection in Central
Kalimantan using method ANP. Table 7. Alternative
Alternative PT. X PT. Y PT. Z
A 100 100 100
T 75 90 50
H 80 70 60
K 100 100 100
Pairwise comparison done between subsequent
alternative against each of the criteria and looking for the
value of the eigen vector.
Table 8. Paired Comparison Matrix of alternatives to the
Administration's criteria
A PT.
X
PT.Y PT.
Z
eVECTOR
PT. X 1 1 1 0,333333
PT. Y 1 1 1 0,333333
PT. Z 1 1 1 0,333333
Jumlah 3 3 3 1
Description:
A : Administration
1. PT. X – PT. X (100-100): a comparison of
alternative range is from 1 (very good- very
good)
2. PT. Y – PT. X (100-100): a comparison of
alternative range is from 1 (very good- very
good)
3. PT. Z – PT. X (100-100): a comparison of
alternative range is from 1 (very good- very
good)
4. PT. X – PT. Y (100-100): a comparison of
alternative range is from 1 (very good- very
good)
5. PT. Y – PT. Y (100-100): a comparison of
alternative range is from 1 (very good- very
good)
6. PT. Z – PT. Y (100-100): a comparison of
alternative range is from 1 (very good- very
good)
7. PT. X – PT. Z (100-100): a comparison of
alternative range is from 1 (very good- very
good)
8. PT. Y-PT. Z (100-100): a comparison of
alternative range is from 1 (very good- very
good)
9. PT. Z – PT. Z (100-100): a comparison of
alternative range is from 1 (very good- very
good).
To get the value of the eigen vector then performed
the following stages:
- Pairwise comparison 1 1 1 1 1 1
=
3 3 3
1 1 1 x
1 1 1 3 3 3
1 1 1 1 1 1 3 3 3
Paired comparison results matrix criteria:
=
https://doi.org/10.1051/e3sconf/201873 , (2018)E3S Web of Conferences 73ICENIS 2018
01 1300 3 05 5
4
From the matrix above, eigen vector can be determined,
lambda consistensi index and maximum, and consistensi
ratio. Eigen vector values obtained from the division
between the first line against the number of values in the
first column of the second row in Add and divide the
amount of the value of the second column and so on up
to the third column.
The first column of the matrix sum of: 3 + 3 + 3 = 9
The second column of the matrix sum of: 3 + 3 + 3 = 9
The third column of the matrix sum of: 3 + 3 + 3 = 9
Next do the calculations to find the following eigen
vector.
Eigen vector line 1 : = 0,33
Eigen vector line 2: = 0,33
Eigen vector line -3: = 0,33
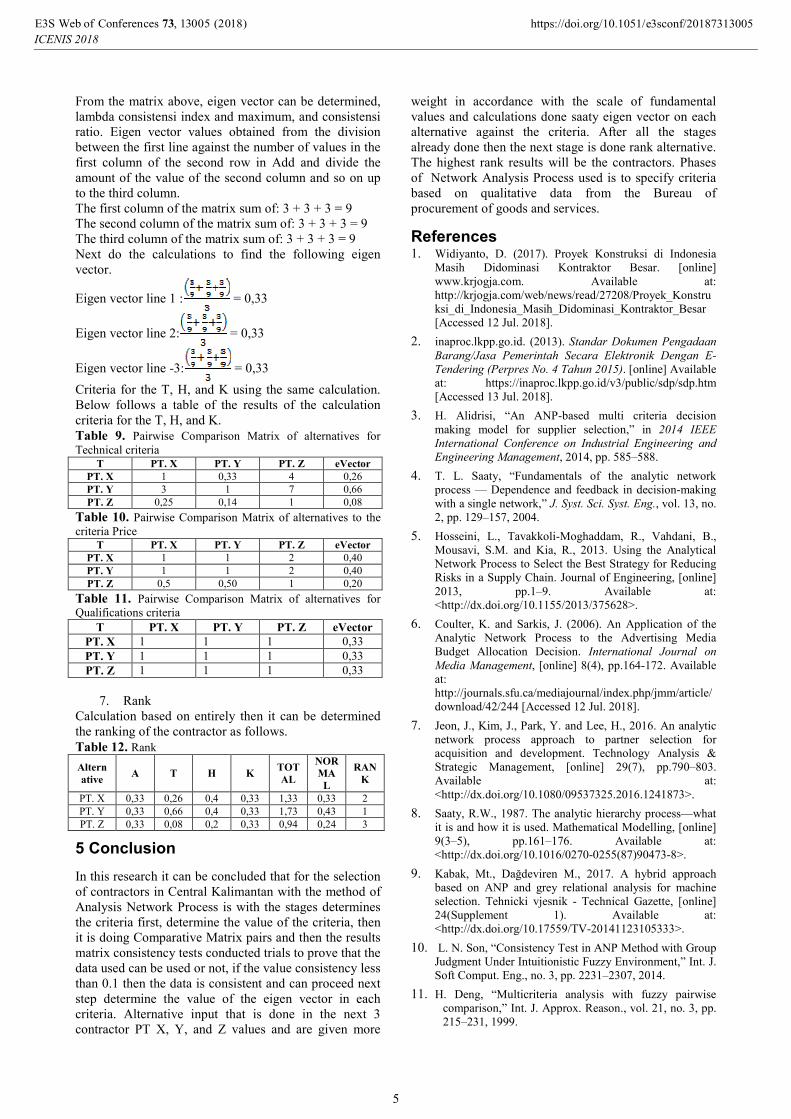
Criteria for the T, H, and K using the same calculation.
Below follows a table of the results of the calculation
criteria for the T, H, and K.
Table 9. Pairwise Comparison Matrix of alternatives for
Technical criteria T PT. X PT. Y PT. Z eVector
PT. X 1 0,33 4 0,26
PT. Y 3 1 7 0,66
PT. Z 0,25 0,14 1 0,08
Table 10. Pairwise Comparison Matrix of alternatives to the
criteria Price T PT. X PT. Y PT. Z eVector
PT. X 1 1 2 0,40
PT. Y 1 1 2 0,40
PT. Z 0,5 0,50 1 0,20
Table 11. Pairwise Comparison Matrix of alternatives for
Qualifications criteria T PT. X PT. Y PT. Z eVector
PT. X 1 1 1 0,33
PT. Y 1 1 1 0,33
PT. Z 1 1 1 0,33
7. Rank
Calculation based on entirely then it can be determined
the ranking of the contractor as follows.
Table 12. Rank
Altern
ative A T H K
TOT
AL
NOR
MA
L
RAN
K
PT. X 0,33 0,26 0,4 0,33 1,33 0,33 2
PT. Y 0,33 0,66 0,4 0,33 1,73 0,43 1
PT. Z 0,33 0,08 0,2 0,33 0,94 0,24 3
5 Conclusion
In this research it can be concluded that for the selection
of contractors in Central Kalimantan with the method of
Analysis Network Process is with the stages determines
the criteria first, determine the value of the criteria, then
it is doing Comparative Matrix pairs and then the results
matrix consistency tests conducted trials to prove that the
data used can be used or not, if the value consistency less
than 0.1 then the data is consistent and can proceed next
step determine the value of the eigen vector in each
criteria. Alternative input that is done in the next 3
contractor PT X, Y, and Z values and are given more
weight in accordance with the scale of fundamental
values and calculations done saaty eigen vector on each
alternative against the criteria. After all the stages
already done then the next stage is done rank alternative.
The highest rank results will be the contractors. Phases
of Network Analysis Process used is to specify criteria
based on qualitative data from the Bureau of
procurement of goods and services.
References 1. Widiyanto, D. (2017). Proyek Konstruksi di Indonesia
Masih Didominasi Kontraktor Besar. [online]
www.krjogja.com. Available at:
http://krjogja.com/web/news/read/27208/Proyek_Konstru
ksi_di_Indonesia_Masih_Didominasi_Kontraktor_Besar
[Accessed 12 Jul. 2018].
2. inaproc.lkpp.go.id. (2013). Standar Dokumen Pengadaan
Barang/Jasa Pemerintah Secara Elektronik Dengan E-
Tendering (Perpres No. 4 Tahun 2015). [online] Available
at: https://inaproc.lkpp.go.id/v3/public/sdp/sdp.htm
[Accessed 13 Jul. 2018].
3. H. Alidrisi, “An ANP-based multi criteria decision
making model for supplier selection,” in 2014 IEEE
International Conference on Industrial Engineering and
Engineering Management, 2014, pp. 585–588.
4. T. L. Saaty, “Fundamentals of the analytic network
process — Dependence and feedback in decision-making
with a single network,” J. Syst. Sci. Syst. Eng., vol. 13, no.
2, pp. 129–157, 2004.
5. Hosseini, L., Tavakkoli-Moghaddam, R., Vahdani, B.,
Mousavi, S.M. and Kia, R., 2013. Using the Analytical
Network Process to Select the Best Strategy for Reducing
Risks in a Supply Chain. Journal of Engineering, [online]
2013, pp.1–9. Available at:
<http://dx.doi.org/10.1155/2013/375628>.
6. Coulter, K. and Sarkis, J. (2006). An Application of the
Analytic Network Process to the Advertising Media
Budget Allocation Decision. International Journal on
Media Management, [online] 8(4), pp.164-172. Available
at:
http://journals.sfu.ca/mediajournal/index.php/jmm/article/
download/42/244 [Accessed 12 Jul. 2018].
7. Jeon, J., Kim, J., Park, Y. and Lee, H., 2016. An analytic
network process approach to partner selection for
acquisition and development. Technology Analysis &
Strategic Management, [online] 29(7), pp.790–803.
Available at:
<http://dx.doi.org/10.1080/09537325.2016.1241873>.
8. Saaty, R.W., 1987. The analytic hierarchy process—what
it is and how it is used. Mathematical Modelling, [online]
9(3–5), pp.161–176. Available at:
<http://dx.doi.org/10.1016/0270-0255(87)90473-8>.
9. Kabak, Mt., Dağdeviren M., 2017. A hybrid approach
based on ANP and grey relational analysis for machine
selection. Tehnicki vjesnik - Technical Gazette, [online]
24(Supplement 1). Available at:
<http://dx.doi.org/10.17559/TV-20141123105333>.
10. L. N. Son, “Consistency Test in ANP Method with Group
Judgment Under Intuitionistic Fuzzy Environment,” Int. J.
Soft Comput. Eng., no. 3, pp. 2231–2307, 2014.
11. H. Deng, “Multicriteria analysis with fuzzy pairwise
comparison,” Int. J. Approx. Reason., vol. 21, no. 3, pp.
215–231, 1999.
https://doi.org/10.1051/e3sconf/201873 , (2018)E3S Web of Conferences 73ICENIS 2018
01 1300 3 05 5
5