Selecting Professional Services Automation (PSA) Software
18
A Service Performance Insight White Paper Service Compass: Charting the Course to Professional Service Excellence Selecting a Professional Services Automation (PSA) Solution: Determining What Really Matters August 2012 Service Performance Insight 6260 Winter Hazel Drive 25 Boroughwood Place Liberty Township, OH 45044 USA Hillsborough, CA 94010 USA Telephone: 513.759.5443 Telephone: 650.342.4690 [email protected] [email protected] www.SPIresearch.com
Transcript of Selecting Professional Services Automation (PSA) Software

A Service Performance Insight White Paper
Service Compass: Charting the Course to Professional Service Excellence
Selecting a Professional Services Automation (PSA) Solution:
Determining What Really Matters
August 2012
Service Performance Insight
6260 Winter Hazel Drive 25 Boroughwood Place Liberty Township, OH 45044 USA Hillsborough, CA 94010 USA
Telephone: 513.759.5443 Telephone: 650.342.4690
[email protected] [email protected]
www.SPIresearch.com

i
TABLE OF CONTENTS
Introduction .................................................................................................................................... 1
Increasing Professional Services Challenges ............................................................................ 2
The War for Talent ..................................................................................................................... 2
Time to Value ............................................................................................................................. 2
Fixed Price: The New Normal .................................................................................................... 3
The Case for PSA........................................................................................................................... 4
Table Stakes ............................................................................................................................... 4
Rewards Amplified ..................................................................................................................... 5
PSA Deconstructed ....................................................................................................................... 6
Resource Management .............................................................................................................. 6
Project Management .................................................................................................................. 7
Time and Expense Management ............................................................................................... 7
Organizational Visibility .............................................................................................................. 8
Selecting a PSA: Determining What Really Matters................................................................... 9
Spotlight on Projector PSA ........................................................................................................ 10
Independent .............................................................................................................................. 10
Results-Driven .......................................................................................................................... 11
Focused on Professional Services ........................................................................................... 12
Analytical Reporting ............................................................................................................ 12
“Lumpy Scheduling” ............................................................................................................ 13
Fixed Price Visibility ............................................................................................................ 13
Conclusions ................................................................................................................................. 15
About Service Performance Insight .................................................................................... 16
FIGURES
Figure 1: PSA: The Heart of the “Bid-to-Bill” Process .................................................................... 6
Figure 2: Projector PSA Solution Overview .................................................................................. 10
Figure 3: Real-time Reporting and Dashboards ........................................................................... 12
Figure 4: Ironing Out “Lumpy” Schedules .................................................................................... 13
TABLES
Table 1: Project Durations Affect Organizational Performance ...................................................... 2
Table 2: PSA Offers Significant Organizational Benefits ............................................................... 4
Table 3: Integrated PSA Improves Service Performance............................................................... 5
Table 4: Real-time Visibility is a Leading Indicator of Success ...................................................... 8
Table 5: Projector Excels in Key Areas Compared to Other PSA Tools ...................................... 11

Service Compass Selecting a PSA: What Really Matters
Service Performance Insight Page 1
INTRODUCTION
The professional services (PS) market is entering another growth phase.
After a strong, decade-long expansion marked by double-digit growth,
the PS market slowed significantly throughout the recession. In 2012,
SPI Research expects professional service year-over-year revenue
growth in excess of 10% – heralding a return to steady growth. While
expansion is positive for the market, it is causing concern for PS
executives as they juggle globalization, more sophisticated clients,
changing skill requirements and an increasingly competitive war for
talent. Technology PS sector growth mirrors hot tech trends – mobile,
social, big data and cloud – while yesterday’s technology skills languish
and commoditize.
During this new growth phase, the pressure to execute more efficiently,
with higher levels of quality will intensify. PS firms must ensure they
deliver client value, and many are doing so in an environment of fixed-
price engagements. This adds additional pricing and staffing risk to
guarantee projects are delivered on-time and on-budget.
To combat these pressures, many Professional Services Organizations
(PSOs) will turn to Professional Services Automation (PSA) solutions.
PSA was initially designed to manage resources (primarily people) to
improve utilization and maximize billable hours. Over the past 15 years
PSA solutions have demonstrated the ability to improve utilization by
5% to 10%, producing 100 to 200 additional billable hours per consultant
per year.
While the PSA market has expanded to add other functionality for time
capture and billing, its success has always hinged on the robust
capabilities offered for managing resources, projects, time and cost. In
an era of increasing competition and a war for top talent, PSA must
provide measurable ROI to the business with a focus on improving key
performance metrics such as utilization, margin, delivery performance
and revenue growth.
In this white paper, SPI Research analyzes results from its 2012
Professional Services Maturity™ Benchmark, derived from over 200
PSOs, to show how PSA improves performance. It highlights the trends
necessitating sophisticated resource management and how products that
easily handle “lumpy” scheduling create competitive advantage. It
shows how the increasing prevalence of fixed price contracts affects the
bottom-line and how tools that help manage fixed price projects are not
all the same. It showcases how important real-time visibility is to the
performance of a PSO. Finally, the paper profiles Projector PSA, a
leading independent supplier of PSA solutions, and how it has stayed
true to its roots by building robust capabilities that drive real
performance in the increasingly competitive services market.

Service Compass Selecting a PSA: What Really Matters
Service Performance Insight Page 2
INCREASING PROFESSIONAL SERVICES CHALLENGES
Professional service organizations used to enjoy an operating
environment where they absorbed minimal risk. Buyers were
accustomed to large time and materials projects marred by significant
overruns and high failure rates. This was especially true in the IT sector,
where the underlying technology used to implement business solutions
required considerable unique customization and integration to make it
work. It resulted in large project teams where it was easy to hide and
grow junior consultants on the client’s dime. But those days are over.
The War for Talent
As the professional services market grows, finding resources with the
right mix of technical knowledge, business process acumen, and client-
facing skills is becoming harder and harder. PSOs are burdened with the
time and cost of growing their own consultants and must compete for top
college graduates as well as seasoned consultants. Clients are no longer
willing to pay for on-the-job training, and PSA tools that can help
consultants become productive sooner quickly pay for themselves.
As the economy improves and people feel more comfortable taking
personal and professional risks, turnover is expected to become an
increasing concern for PSOs. SPI Research believes employee attrition
could potentially cause significant downward pressure on both growth
and profitability in 2012. To mitigate the impact of turnover, PSOs must
contend with complicated resource scheduling to accommodate lifestyle
balance, desired project types and travel preferences.
Time to Value
The professional services client base is savvier than ever. Internal
pressures have forced clients to take a much harder look at professional
services spend, and make demands to improve consulting value per
dollar. A new metric of “time to value” has surfaced, putting the onus on
service providers to demonstrate value throughout the life of the project
– not just in a “big bang” at the end. This change has led to shorter
duration projects with fewer resources. PSOs would prefer to maximize
both the number of resources on projects as well as the number of
months to complete the work. Large-scale multi man-year projects
stabilize cash flow and improve profitability (Table 1), but are becoming
increasingly rare.
Table 1: Project Durations Affect Organizational Performance
Key Performance Indicator (KPI) Over 35
man-months Under 35
man-months Improve-
ment
Percentage of surveys 17.6% 82.4% N/A
Revenue per Employee (k) $218 $184 19%
EBITDA % 16.1% 13.1% 23%
Source: Service Performance Insight, August 2012

Service Compass Selecting a PSA: What Really Matters
Service Performance Insight Page 3
Agile software development techniques facilitate splitting large, long-
term projects, into shorter sprints. During and at the end of each work
phase, value can be assessed and corrections can be made. If
demonstrable value is not present, the remainder of the project can be
canceled or modified, causing significant pain for the PSO. This more
dynamic, quick-turn delivery model can cause PSOs to have to manage
their projected utilization more actively and rely more heavily on
sophisticated resource management tools such PSA.
Fixed Price: The New Normal
Along with expecting demonstrable value per consulting dollar, clients
have increased their appetite for fixed price, shared risk and value-priced
engagements. These contract types put the onus on providers to
predefine costs, often-times without detailed project requirements. This
shift in engagement type rewards the most-skilled professional service
providers who have already established a track record for delivering
similar work. It also penalizes newcomers who don’t yet have skilled
resources or repeatable processes.
Leading firms relish fixed-price engagements, as they have the
capabilities, knowledge and methodologies necessary to meet contract
obligations while generating profit. Unfortunately, organizations not
adept at managing scope, risk and deliverables, and those that lack real-
time visibility into project performance tend to fail in fixed-price
engagements.

Service Compass Selecting a PSA: What Really Matters
Service Performance Insight Page 4
THE CASE FOR PSA
After 15 years of research on the performance of PSOs, the statistics
speak for themselves. The 2012 Professional Service Maturity™
benchmark provides an example of how PSOs have improved
performance in all areas when professional services automation has been
deployed. PSA provides the necessary visibility to efficiently run
projects with fewer overhead resources, resulting in better resource
management and profit.
Table 2 shows a few of the most important KPIs and how adopting a
PSA can affect them. While increased billable utilization tends to be the
primary measurement, there are many others positively impacted by
these applications. PSOs can manage the business with less
administrative overhead and deliver more projects on time, driving better
financial performance. Organizations that use PSA have superior
revenue per consultant and per employee, and demonstrate significantly
higher profits.
Table 2: PSA Offers Significant Organizational Benefits
Key Performance Indicator (KPI) PSA Used
No PSA Used
Advantage
Employee Utilization 71.0% 66.3% 7%
Employee to Management Ratio 10.39 8.02 30%
% of Employees Billable or Chargeable 75.3% 70.6% 7%
Projects Delivered On-time 76.8% 74.8% 3%
Projects Canceled 2.1% 2.2% 4%
Annual Revenue per Billable Consultant (k) $201 $179 12%
Annual Revenue per Employee (k) $172 $149 15%
Earnings before Income Taxes, Depreciation & Amortization (EBITDA)
15.4% 8.3% 86%
Source: Service Performance Insight, August 2012
Table Stakes
Because of the significant benefits of PSA, SPI Research has found from
five years of benchmark analysis of over 1,000 firms, over 70% have
already adopted a PSA tool. Indeed, every single one of the top ranked
10% of survey respondents (the Best-of-the-Best list) has implemented
PSA. SPI Research believes that PSOs with over ten employees should
consider using a PSA. Running the business based on a complex web of
interconnected spreadsheets is no longer a viable alternative for even the
smallest PSOs.

Service Compass Selecting a PSA: What Really Matters
Service Performance Insight Page 5
Rewards Amplified
Although standalone PSA applications provide significant benefit, the
rewards are amplified when PSA is integrated with the organization’s
financial management application. PSA financial integration enhances
visibility and management control. It supports “open books” to give all
team members one source of the truth so they are empowered to ensure
their actions have a positive impact on the bottom-line.
Integration enhances visibility and makes the firm more agile because
decisions are based on fact, not intuition. Fact-based decisions mean
they are aligned to support the types of projects, clients and markets
where the firm excels. Table 3 compares organizations owning PSA, but
not having it integrated with the core financial management solution, to
those organizations using PSA with financial integration.
Table 3: Integrated PSA Improves Service Performance
Key Performance Indicator (KPI) Integrated Not
Integrated Advantage
Year-over-Year change in PS Revenue 13.4% 10.9% 23%
Projects Delivered On-time 80.0% 76.8% 4%
Projects Canceled 1.7% 2.4% 31%
Average Project Overrun 6.8% 7.9% 15%
Annual Revenue per Billable Consultant (k) $215 $195 10%
Annual Revenue per Employee (k) $183 $168 9%
Project Margin 37.0% 35.6% 4%
Source: Service Performance Insight, August 2012

Service Compass Selecting a PSA: What Really Matters
Service Performance Insight Page 6
PSA DECONSTRUCTED
Professional Service Automation (PSA) solutions provide the systems
basis for initiation, planning, execution, control and close-out of projects,
resources and services. PSA improves service delivery, resource
management, project management, and collaboration, while ensuring
accurate and timely time and expense capture and billing.
Figure 1 provides insight into where PSA sits in the “bid-to-bill” or
“quote-to-cash” process. This process spans from the time a bid or quote
is proposed through to invoicing and collection. A PSA tool helps an
organization plan, staff, deliver, track, and invoice its entire portfolio of
projects. PSA thus represents the core operational system in which all
the PSO’s delivery activities are managed, forming the foundation for
service execution.
Figure 1: PSA: The Heart of the “Bid-to-Bill” Process
Source: Service Performance Insight, August 2012
Resource Management
Resource Management is the most critical aspect of a PSA solution, due
to the importance of efficiently utilizing the PSO’s most valuable asset:
its people. Done right, effective resource management can easily
improve billable utilization by 5 to 10%, giving PSOs another 100 to 200
billable hours per consultant annually. The value of sophisticated
resource management tools is especially important in increasingly
complex and dynamic environments where resources may not be fully
dedicated to long term, multi-year projects.
Resource management provides PSOs the ability to assess skills, forecast
staffing needs, schedule resources and evaluate profitability by

Service Compass Selecting a PSA: What Really Matters
Service Performance Insight Page 7
individual, client and project type. This capability enables the
organization to target sales and hiring activities to more efficiently
balance the supply and demand for key resources and skillsets.
Resource management within PSA offers visibility to more efficiently
plan and schedule work, especially in environments where consultants
must work on several projects simultaneously. By more tightly
scheduling work with interspersed project deliverables and minimizing
downtime, effective resource scheduling can lead to vastly improved
resource utilization and faster project delivery.
Finally, consultants and subcontractors are increasingly given visibility
into the project pipeline so they can express interest in the type of work
that most intrigues them. This visibility can have a significant impact on
employee satisfaction, thus reducing the attrition that is expected to be a
key negative driver of profitability in the months and years to come.
Project Management
Projects have become more complicated even while project durations
have become shorter, significantly narrowing the margin for error. There
is a much stronger need to tie automated solutions into the service
delivery lifecycle as a greater focus on cost control, timeliness,
governance and quality has necessitated better use and sharing of project
information.
The project management functionality within PSA solutions allows
managers to more clearly understand current project status, and make
changes to improve delivery times and reduce cost. PSA supports
popular project management tools so both resource and project managers
can incorporate project plans down to the task level in their resource
planning. Project management within PSA often supports bi-directional
integration with Microsoft Project and other project management tools.
It helps managers understand tasks completed and work remaining,
enabling the PSO to calculate earned value and estimate time to
complete.
Time and Expense Management
Time and expense management has become a foundational component of
PSA, as high costs and rampant inaccuracy have made manual processes
unviable. SPI Research typically sees between 1% and 5% of project
cost is unbillable, primarily because the information has not been
accurately collected. This needless revenue leakage represents work that
a PSO’s billable staff completed or expenses that the organization
incurred that the firm is simply losing.
Robust PSA solutions support multiple bill rates per consultant,
depending on the type of work performed and tie expenses incurred and
work performed back to established budgets. Today’s solutions reflect
the increasingly global nature of business as they are able to manage
multiple currencies and financial regulations. Sophisticated PSA
solutions provide invoicing, with automatic preparation and presentation
of the invoice, and even enable clients to pre-review invoices to ensure

Service Compass Selecting a PSA: What Really Matters
Service Performance Insight Page 8
prompt payment. Strong solutions provide flexible integration with the
back-office financial management application, so that both project
managers and financial management can share and view the same
information.
Organizational Visibility
While PSA is best known for improving resource and project
management, its most significant impact might be providing real-time
visibility into all aspects of service delivery. PSA users can
simultaneously see the status of current and forecasted projects, historical
or projected costs and revenue, the supply and demand for key resources,
and a myriad of issues that could impact successful completion.
With real-time visibility, PS executives can more efficiently and
effectively run the business. Table 4 shows a few of the important key
performance measurements associated with having high levels of real-
time visibility in service execution.
Table 4: Real-time Visibility is a Leading Indicator of Success
Key Performance Indicator (KPI) High
Visibility
Low
Visibility Advantage
Year-over-Year change in PS Headcount 11.6% 9.1% 27%
Annual Employee Attrition 4.7% 8.2% 42%
Projects Canceled 1.6% 2.2% 29%
Average Project Overrun 6.8% 8.9% 24%
Project Margin for Time & Materials Projects 37.1% 32.7% 14%
Project Margin for Fixed Price Projects 36.8% 32.7% 13%
Source: Service Performance Insight, August 2012
Organizations with high levels of real-time visibility grow more rapidly
and face less employee attrition than others. Because work can be
managed more efficiently, fewer projects are canceled and even when
work is late, the impact is minimized. Real-time visibility is a primary
catalyst for improved project profitability as it allows managers to make
smaller course corrections earlier, rather than relying on grand, sweeping
(and often expensive) corrective actions late in the game.

Service Compass Selecting a PSA: What Really Matters
Service Performance Insight Page 9
SELECTING A PSA: DETERMINING WHAT REALLY MATTERS
Once an organization decides to invest in a PSA, with so many options
on the market, sifting through all the possibilities can be a daunting task.
Different organizations have different automation needs, and each of the
major PSA vendors has taken a slightly different approach to addressing
those needs. Some vendors promote the collaboration and social
networking aspects of their products, some stress the importance of
integration with the platforms they happen to be built upon, some
emphasize easy-to-learn user interfaces. What organizations need to
determine for themselves is what they’re looking to get out of a PSA tool
and how they want it to impact their businesses — basically, deciding
what really matters to them.
When PSOs evaluate PSA they expect the solution will give them a
significant positive return on investment (ROI), and pay for itself fast.
With PSA, a positive ROI can be realized in less than one year, as
increases in billable utilization, improved project margins, faster
invoicing, fewer out of control projects, and higher customer and
employee satisfaction make PSA a very valuable investment.
From Service Performance Insight’s research into the PSA market, the
key areas to consider when selecting a PSA include:
Total cost of ownership (TCO): the total cost to purchase,
implement and maintain the solution;
Solution depth: how robust each of the core modules is and how
well the application models the business. Oftentimes, weak
systems can lead to bad business decisions;
Business process support: how well the solution supports and
models strong business processes. In some cases the processes
embedded in the PSA solution are in fact better than the PSO’s
current business practices;
Vendor viability: whether the vendor will be around in five
years and how knowledgeable and committed the vendor is to
the professional services market;
Solution breadth: whether the solution provides or integrates
with additional modules, such as ERP, CRM and BI platforms;
Integration with financials: whether the solution easily
integrates with the core financial management (ERP) solution.
With these areas in mind, we’ll examine one of the key players in the
Professional Services Automation market: Projector PSA.
Service Compass Selecting a PSA: What Really Matters
Service Performance Insight Page 10
SPOTLIGHT ON PROJECTOR PSA
Considering most of its competitors have been acquired by ERP solution
providers, Projector has positioned itself well as one of the best
independent PSA solution providers. In SPI Research’s 2012
Professional Services Maturity™ Benchmark, Projector was used by
over 20% of the organizations surveyed. An analysis of its results shows
why the company has grown so rapidly over the past five years.
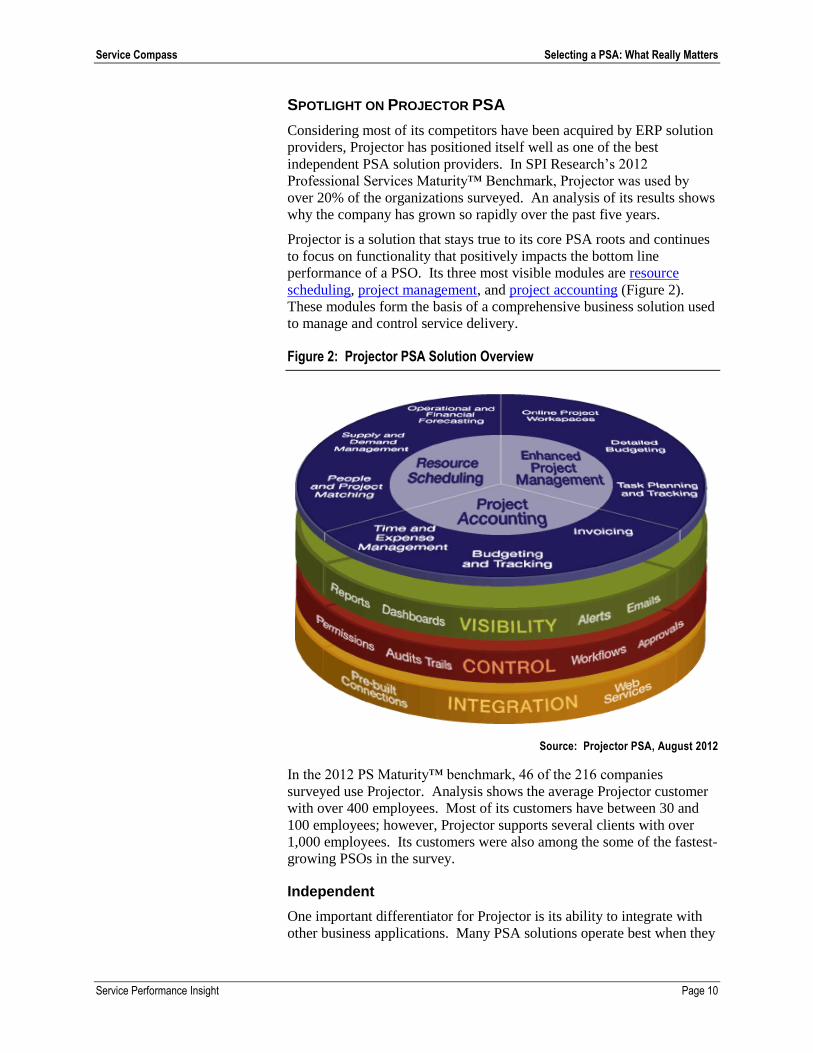
Projector is a solution that stays true to its core PSA roots and continues
to focus on functionality that positively impacts the bottom line
performance of a PSO. Its three most visible modules are resource
scheduling, project management, and project accounting (Figure 2).
These modules form the basis of a comprehensive business solution used
to manage and control service delivery.
Figure 2: Projector PSA Solution Overview
Source: Projector PSA, August 2012
In the 2012 PS Maturity™ benchmark, 46 of the 216 companies
surveyed use Projector. Analysis shows the average Projector customer
with over 400 employees. Most of its customers have between 30 and
100 employees; however, Projector supports several clients with over
1,000 employees. Its customers were also among the some of the fastest-
growing PSOs in the survey.
Independent
One important differentiator for Projector is its ability to integrate with
other business applications. Many PSA solutions operate best when they

Service Compass Selecting a PSA: What Really Matters
Service Performance Insight Page 11
reside within a suite built by a single provider. That often works well if
an organization is looking to replace its entire suite of business
applications, from CRM to PSA to ERP, at the same time with a
monolithic product from a single vendor.
Projector, as an independent PSA solution, is open and therefore
provides greater integration capabilities in a heterogeneous IT
environment. It provides configurable, pre-built integrations for the most
commonly implemented CRM and ERP applications and an open web
services-based API for legacy and custom applications.
Results-Driven
Projector is focused on solution depth by providing rich, robust
functionality in its core modules. The depth in its products and services
helps its customers achieve significant, measurable ROI by:
Allowing organizations to more accurately model their businesses,
especially in the areas of resource management and project
accounting;
Providing rich, comprehensive analytical reporting;
Providing first-class consulting and support, which ensures a closer
initial fit and better ongoing recalibration as the business changes;
Focusing exclusively on the unique and changing needs of service
and project-oriented organizations.
This results-driven focus is just one reason why Projector fared so well in
the recent maturity benchmark survey (Table 5) as compared to users of
other PSA software. While all of the PSA solutions showed positive
results in the survey, Projector excelled over organizations using other
PSA solutions in some of the most important, measurable areas that drive
ROI.
Table 5: Projector Excels in Key Areas Compared to Other PSA Tools
Key Performance Indicator (KPI) Projector Other PSA
Advantage
Employee Billable Utilization 73.2% 68.0% 8%
Effectiveness of Resource Management Process 3.76 3.42 10%
Average Project Overrun 6.5% 8.9% 27%
Project Margin for Fixed Price Projects 36.5% 31.6% 15%
Project Margin for Time & Materials Projects 33.9% 33.1% 2%
Time to Productivity for New Employees (Days) 106 134 21%
Satisfaction with PSA Solution 4.58 3.77 21%
Source: Service Performance Insight, August 2012

Service Compass Selecting a PSA: What Really Matters
Service Performance Insight Page 12
Projector is able to drive significant improvements in billable utilization
by enabling a more effective resource management process (as measured
on a 1 to 5 scale). Projector users experience more successful project
delivery rates as well, with lower average project overruns, and much
higher project margins, especially for fixed price projects. Organizations
using Projector were able to get new hires productive nearly a month
faster than those using other systems. Finally, survey respondents gave
Projector top marks when asked about their satisfaction with their PSA,
indicating a close fit with their needs from a product, support, and
services standpoint.
Focused on Professional Services
Projector’s sole focus is on the professional services market and on
designing a product that allows PSOs to more accurately model their
businesses within the system. Infused in the product is a collection of
little design decisions, each intended to help organizations optimize their
services delivery machine and provide real, bottom line ROI. This
section explores just a few of those decisions that relate to some of the
key delivery challenges identified in the benchmark survey.
Analytical Reporting
A key attribute of Projector is reporting and performance dashboards that
enable PSOs to both analyze performance and drill down into projects,
time periods or personnel. These tools enable organizations to spot
problems before they arise and in time to take corrective action (Figure
3). This capability allows decision makers to make changes in real time
that impact the success of the project, the satisfaction of the end client,
and the profitability of the business.
Figure 3: Real-time Reporting and Dashboards
Source: Projector PSA, August 2012

Service Compass Selecting a PSA: What Really Matters
Service Performance Insight Page 13
“Lumpy Scheduling”
One of the most important, but also the most challenging, aspects of
managing a services business is optimizing the utilization of billable
resources. Ideally, the resource management capability of PSA enables
PSOs to maximize billable hours by building plans where employees “fill
up” each day working on billable tasks. Unfortunately, the real world is
seldom this simple.
For example, an employee might be scheduled for 40 hours of work over
a two-week period. Most PSA solutions assume that should translate
into 20 hours per week or indeed exactly 4 hours per day. However, the
employee might actually be needed for 30 hours in the first week and 10
in the second based on the tasks involved. Many other PSA solutions
falsely report that if the resource was needed for 25 hours on a different
project in the second week or 6 hours next Thursday, the consultant
would be over-allocated.
Projector helps PSOs “iron out” the schedule (Figure 4) by allowing the
PSO to schedule the individual on a weekly, or even daily, basis,
enabling the resource manager to schedule work more tightly. It allows
managers to define more precise schedules when warranted, and the
system automatically flows flexible hours around more fixed scheduling
needs when appropriate.
Figure 4: Ironing Out “Lumpy” Schedules
Source: Projector PSA, August 2012
By reducing false over-allocation warnings, Projector prevents PSOs
from needlessly turning business away, delaying projects, hiring
additional resources, or contracting out work that they could have done
in house. In preventing these false over-allocations, Projector is able to
simply and effectively drive significantly higher utilization and better
organizational profitability.
Fixed Price Visibility
Most PSA solutions support billing clients on a fixed price basis.
However, many systems don’t provide the tools needed to allow a PSO

Service Compass Selecting a PSA: What Really Matters
Service Performance Insight Page 14
to manage a fixed price project effectively enough to maximize
profitability.
Many PSA solutions provide accurate revenue and profitability data only
at certain moments in time or only as of particular dates. This may be
only just after revenue recognition has been run, only at the end of an
accounting period, only after the project is actually completed, or with
stale data only as current as the last reporting database extract.
To overcome the limitations of other PSA tools, organizations often
adopt cumbersome, wasteful, and sometimes error-prone business
practices. These encompass performing “trial” rev rec runs on dozens of
projects each week, manually back-calculating and manipulating bill
rates to “true up” remaining revenue with projected hours, or managing
their fixed price projects in spreadsheets outside the application.
Because of the increased prevalence of fixed price contract terms
demanded by clients to spread risk, Projector was designed to provide
tools to maximize profitability on fixed price projects and eliminate all
those clumsy workarounds. By accurately tracking hours invested to date
and work remaining, Projector can automatically calculate how much
revenue should have been recognized as of any date. This always
available, real-time visibility into the profitability and health of fixed
price projects allows organizations to instantly spot projects in trouble so
they can react more quickly. The improved profitability of and increased
confidence in delivering fixed price projects gives PSOs using Projector
an edge when striving to win business in a competitive market.

Service Compass Selecting a PSA: What Really Matters
Service Performance Insight Page 15
CONCLUSIONS
The Professional Services Automation market has grown rapidly over the
past decade because the solutions have shown demonstrable results.
PSA, like any enterprise solution, can be extremely valuable when used
to its fullest capability. Most PSOs using PSA have shown between 100
and 200 additional billable hours per year per employee per year, making
PSA a solution with a high return on investment.
While there are a number of PSA solutions, they are not all the same.
Some have focused on broader capabilities, leaving some of the heavy
lifting to more focused applications such as project management
software. When selecting a solution PS executives should focus on the
attributes of PSA that are most important to them. Resource
management is one of those areas where robust functionality should be
mandatory. Resource management effectiveness is one of the main
drivers of improved performance since small changes in behavior can
lead to large rewards in increased revenue and profitability.
Projector has been a rapidly growing supplier of PSA solutions for over a
decade. The company’s singular focus is on building industry-leading
PSA capabilities into its solution. It is also one of the few independent
providers in the market today, as many of their competitors have been
acquired by larger ERP solution providers.
SPI Research’s analysis of the PSA market over the past 15 years has
shown approximately 50% of PS executives prefer best-of-breed PSA
solutions, while the other 50% prefer PSA as part of an integrated suite.
Projector is a leading provider of best-of-breed solutions, meaning PSOs
are not forced into one type of ERP or CRM solution. Projector allows
for smooth integration with existing business systems rather than forcing
the disruption and high switching costs caused by conversion to a
monolithic, single-vendor application.
Projector users have consistently given Projector the highest satisfaction
marks because the company is singularly focused on supporting the
unique needs of the professional service market. Certainly Projector
should be included in any PSA evaluation because the company has
made a myriad of good decisions in the design and delivery of its
product, support, and services. Each of these decisions was intended to
support the optimization of service delivery and result in a real, bottom-
line profit impact. The cumulative result of each of these little design
decisions is evident in the excellent performance of Projector’s users in
the latest SPI benchmark survey. It is these sorts of performance
advantages that can make the difference between success and failure in
today’s increasingly competitive professional services landscape.

Service Compass Selecting a PSA: What Really Matters
Service Performance Insight (SPI Research) is a global research, consulting and training organization dedicated to helping professional service organizations (PSOs) make quantum improvements in productivity and profit. In 2007, SPI developed the PS Maturity Model™ as a strategic planning and management framework. It is now the industry-leading performance improvement tool used by over 5,000 service and project-oriented organizations to chart their course to service excellence.
SPI provides a unique depth of operating experience combined with unsurpassed analytic capability. We not only diagnose areas for improvement but also provide the business value of change. We then work collaboratively with our clients to create new management processes to transform and ignite performance. Visit www.SPIresearch.com for more information on Service Performance Insight, LLC.
© 2012 Service Performance Insight Page 16
About Service Performance Insight
Jeanne Urich, Service Performance Insight Managing Director, is a renowned author, speaker and thought leader focused on the global service economy. She is a trusted advisor and transformative and operational change consultant to senior executives of leading services organizations, helping them navigate the journey from business-as-usual to business-as-exceptional.
Prior to co-founding Service Performance Insight she was a corporate officer and leader of the worldwide service organizations of Vignette, Blue Martini and Clarify, responsible for leading the growth of their professional services, education, account management and alliances organizations.
She is the co-author of the ground breaking Professional Service Maturity Model™ benchmark used by over 5,000 project-oriented organizations to diagnose and improve their performance. She is a featured speaker and author for major software solution providers and industry associations.
She has a Bachelor’s Degree (Magna Cum Laude and Phi Beta Kappa) in Math and Computer Science from Vanderbilt University. She is a contributing author of Tips from the Trenches: the Collective Wisdom of over 100 Professional Service Leaders. Contact Jeanne at [email protected] Phone (650) 342-4690.
R. David Hofferberth, PE, Service Performance Insight Managing Director, has over 25 years’ experience in information technology (IT) serving as an industry analyst, product director and consultant. Hofferberth’s research is focused on the services economy, and in particular, on white-collar productivity issues and the technologies that help people perform at their highest capacity.
Hofferberth’s background is extensive in services performance beginning in the early 1980s, where he conducted studies on white-collar productivity in the banking, technology, energy and construction sectors. In 1999 he introduced to the market the solution area now known as Professional Services Automation (PSA), when he published the seminal report: Professional Services Automation: Increasing Efficiencies and Profitability in Professional Services Organizations.
Prior to founding Service Performance Insight he was a Senior Director at Oracle and Aberdeen Group. Hofferberth earned an MBA from Duke University and a BS in Industrial Engineering from the University of Tennessee. He is also a licensed Professional Engineer (PE). Contact Dave at [email protected] Phone: (513) 759-5443.
Carey Bettencourt, Service Performance Insight Managing Director is a management consultant who specializes in improvement and transformation for project-driven professional service organizations. She is an experienced change management leader, expert in helping clients develop high performing teams that deliver increased utilization, profit and customer satisfaction. Carey also helps PS organizations identify, clarify, and create integrated communication, marketing, and product offerings that drive market differentiation and increased sales.
Carey has over 20 years domestic and international experience with leading software companies. She was a corporate officer and the senior vice president of the customer solutions organization at Accruent, the top-ranked professional services organization for three consecutive years according to the SPI Research Maturity benchmark. Carey was also a vice president at software firms ChannelPoint and Vroom Technologies responsible for professional services, education, support, strategic alliances, and hosting services. She previously held consulting practice, business development, and strategic alliance leadership roles at Oracle and J.D. Edwards.
Carey earned a Bachelor of Arts in Economics from UC Berkeley and an MBA from Pepperdine University. Contact [email protected]