
Piedmont College Student Work Program PIEDMONT COLLEGE Student Work Program.

Selected Paper
Southern Agricultural Economic Association
An Economic Analysis of Entrepreneurship in the Piedmont Triad of North Carolina
Beatriz M. Rodriguez
Graduate Student
North Carolina Agricultural and Technical State University
Email: [email protected]
Donald R. McDowell
Professor
North Carolina Agricultural and Technical State University
Email: [email protected]
Telephone: (336) 402-2812
Selected Paper prepared for presentation at the Southern Agricultural Economics Association
Annual Meeting, San Antonio, Texas, February 6-9, 2016
Copyright 2016 by [Rodriguez and McDowell]. All rights reserved. Readers may make verbatim copies of this
document for non-commercial purposes by any means provided that the copyright notice appears on all such copies.
1
An Economic Analysis of Entrepreneurship in the Piedmont Triad of North Carolina
Abstract
Rural America can be characterized as having lower economic growth, larger poverty
levels, and a higher concentration of the socially disadvantaged. One primary way of revitalizing
and sustaining rural America is through the development of entrepreneurship opportunities. Thus,
this study focuses on increasing the number and sustainability of entrepreneurs targeting the rural
areas of North Carolina. This study employed a combination of analytical approaches to examine
past and ongoing factors that contribute to rural entrepreneurs’ success in the Piedmont Triad
Prosperity Zone. Data derived from a survey of current entrepreneurs in the Piedmont Triad
Prosperity Zone was analyzed using various qualitative and quantitative statistical methods.
Analysis of variance was used to determine if there is statistical significant difference in growth
of the different size of firms in different economic sectors. Trade area analysis was employed to
determine the magnitude of consumer migration to various counties. The data indicated a larger
migration of consumers from rural counties to the urban counties, taking advantage of
agglomeration. Factor analysis and linear regression revealed that the sustainability (survival) of
entrepreneurship was dependent on demographic and socio-economic factors such as business
structure, location, gender, obstacles and, marital status.
Background
Economic growth and development is both a process and a set of desired outcomes. The
process is multifaceted and dynamic (Morgan, 2009). The process of an economic development
program focuses on expanding the capacity of individuals, firms and, communities and it results
in new private investment, job creation, increased wealth, and a higher standard of living for
residents (UNMDG, 2015). What drives economic development, is private business: that is,
businesses of all sizes starting up, relocating, or expanding in an area. They may be involved in
manufacturing, distribution, agriculture, transportation, research and development (R&D),
business services, or other activities. The investment these businesses make in a community gives
rise to a range of related commercial activities and services. Residential growth also occurs,
bringing a wide variety of retail, consumer services, recreational, tourism, and other commercial
enterprises (Morgan, 2009). As noted by Stangler and Kedrosky (2010), entrepreneurship creates
an environment that makes more entrepreneurship possible. Economic growth, itself a function of
innovation and entrepreneurship, expands the scope for more entrepreneurship. Entrepreneurs are
the bearers of often discomfiting change, and we must continue to ensure that such change is not
prospectively discouraged, but welcomed and celebrated. Therefore, the most important thing we

2
can do to promote entrepreneurship is to provide a hospitable environment which is one of the
main goals of the economic growth and development programs.
Development programs are primarily seeking to improve the living standards of residents
especially in the most distressed areas. The rural areas are more in need of development efforts
due to worsen economic, social and/or political factors. Additionally, rural areas tend to have
significantly fewer financial, professional, scientific and information services activities which are
concentrated in urban economies (Wojan & GMcGranahan, 2015). For instance, in the past decade
North Carolina has been characterized by a trend of declining employment in the state’s traditional
industries causing a significant economic disruption and transition. As it is mentioned by Freyer,
2014, the ongoing transformation from a manufacturing-oriented economy to a service-based
economy has completely upended the historic relationship between economic growth and rising
incomes. As middle-wage manufacturing jobs have been replaced by low-wage service jobs across
North Carolina, incomes have steadily fallen, despite seeing long-term growth in the value of the
goods and services produced in the state (Freyer, 2014). Additionally, the erosion of manufacturing
jobs, particularly in textiles, apparel, and furniture sectors is adversely affecting the state’s urban
and rural areas alike (Center of Globalization Governace & Competitiveness, 2015). Thus, efforts
are needed to help revitalize the rural landscape providing employment opportunities and therefore
contributing to sustain growth and development.
Problem Statement
Data have shown that employment opportunities in North Carolina are growing very slowly
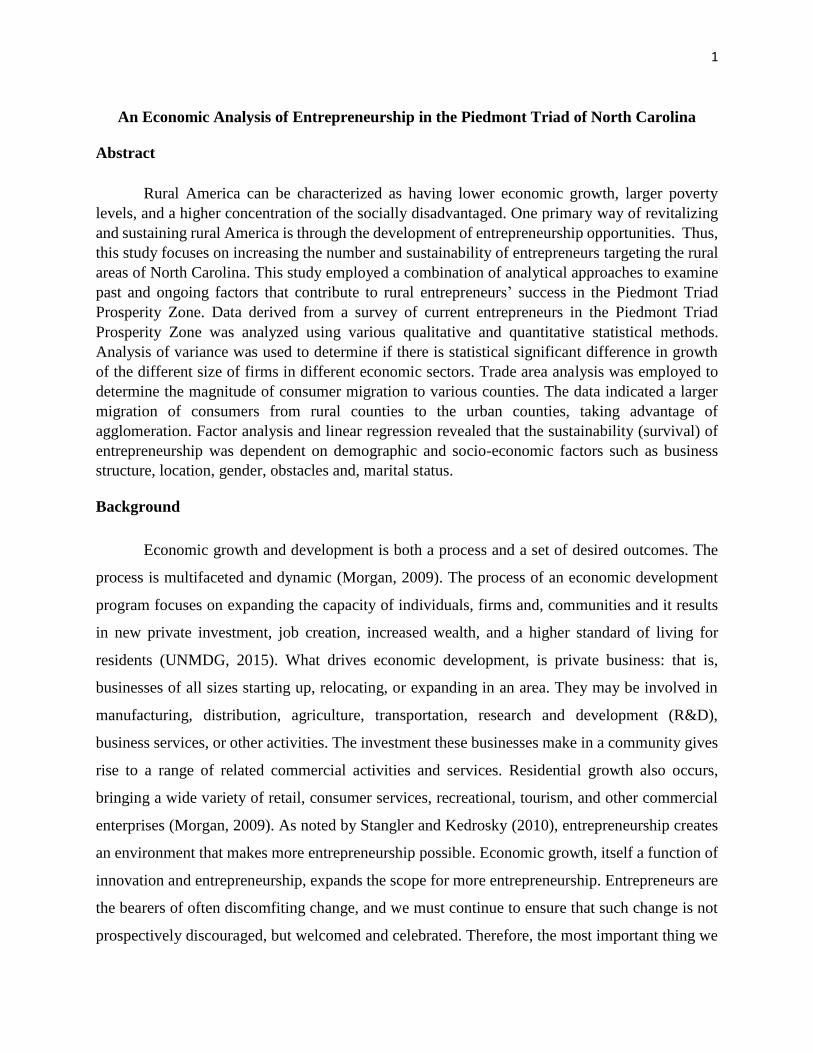
in only 13 of the 19 major industries (Figure 1). Six industries Manufacturing, Construction,
Agriculture, Utilities, Information and Transportation have experienced negative employment
growth over the period 2001 to 2012. The major employment areas are in services, health care and
manufacturing. More specifically, it has been reported that the Piedmont Triad Region with a
historical reliance on the Textile and Furniture industries, have been slow to fully recover from the
last recession compared to other regions in North Carolina. Thus, the regional focus of this study
is on sustaining and revitalizing development in this region/zone through entrepreneurship. This
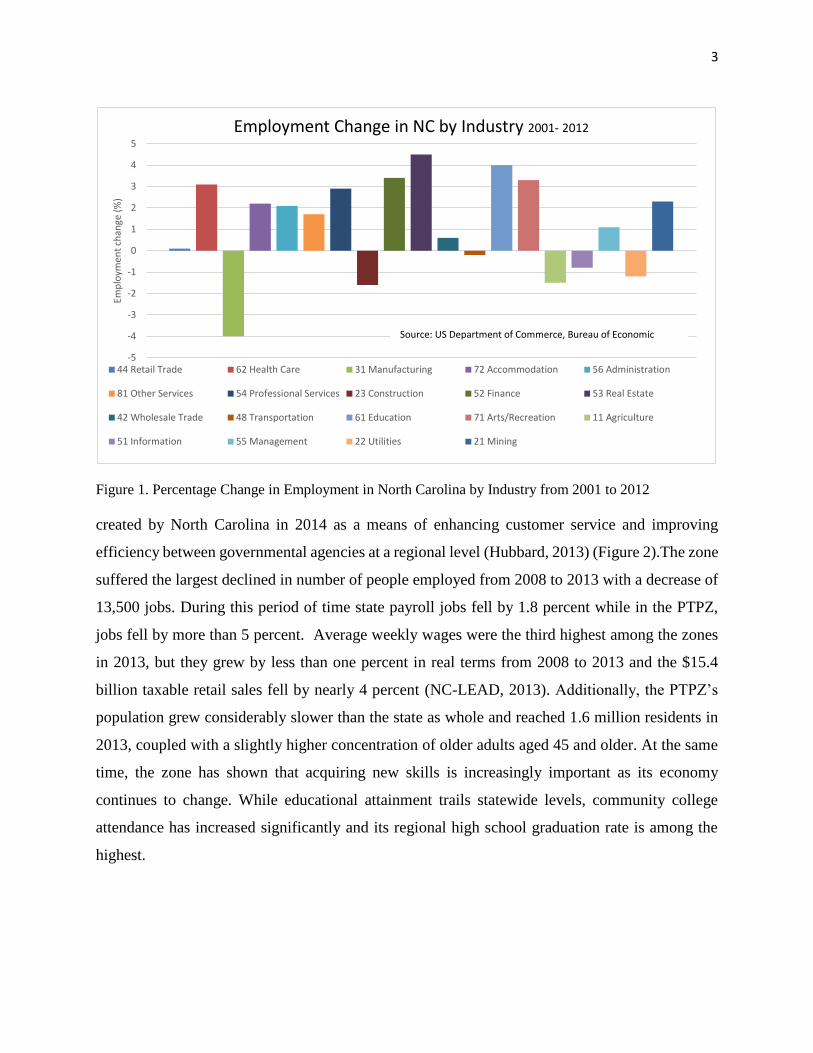
region, Piedmont Triad Prosperity Zone (PTPZ), is one of eight that was
3
Figure 1. Percentage Change in Employment in North Carolina by Industry from 2001 to 2012
created by North Carolina in 2014 as a means of enhancing customer service and improving
efficiency between governmental agencies at a regional level (Hubbard, 2013) (Figure 2).The zone
suffered the largest declined in number of people employed from 2008 to 2013 with a decrease of
13,500 jobs. During this period of time state payroll jobs fell by 1.8 percent while in the PTPZ,
jobs fell by more than 5 percent. Average weekly wages were the third highest among the zones
in 2013, but they grew by less than one percent in real terms from 2008 to 2013 and the $15.4
billion taxable retail sales fell by nearly 4 percent (NC-LEAD, 2013). Additionally, the PTPZ’s
population grew considerably slower than the state as whole and reached 1.6 million residents in
2013, coupled with a slightly higher concentration of older adults aged 45 and older. At the same
time, the zone has shown that acquiring new skills is increasingly important as its economy
continues to change. While educational attainment trails statewide levels, community college
attendance has increased significantly and its regional high school graduation rate is among the
highest.
-5
-4
-3
-2
-1
0
1
2
3
4
5
Emp
loym
ent
chan
ge (
%)
Employment Change in NC by Industry 2001- 2012
44 Retail Trade 62 Health Care 31 Manufacturing 72 Accommodation 56 Administration
81 Other Services 54 Professional Services 23 Construction 52 Finance 53 Real Estate
42 Wholesale Trade 48 Transportation 61 Education 71 Arts/Recreation 11 Agriculture
51 Information 55 Management 22 Utilities 21 Mining
Source: US Department of Commerce, Bureau of Economic
Analysis, BEA
4
Figu
re 2
. No
rth
Car
olin
a P
rosp
erit
y Zo
nes
Map
Sou
rce:
Lab
or
& E
con
om
ic A
nal
ysis
Div
isio
n, L
EAD

5
The PTPZ remains concentrated in the Furniture and Textile manufacturing industries with
more than a combined 20,000 jobs in 2013. However, furniture jobs declined by 22 percent from
2008–2013 while textile jobs fell by more than 31 percent during that period. Despite recent
successes in diversifying its economic base, the PTPZ is still more heavily concentrated in
manufacturing industries than the rest of the state. While Manufacturing accounted for 14 percent
of private sector employment statewide, it accounted for more than 16 percent in the Piedmont-
Triad region (Labor & Economic Analysis Division (North Carolina Department of Commerce,
2014). The entrepreneurial activity in the PTPZ in 2014 has more than 70% of the establishments
in the private industry located in urban counties (NC-LEAD, 2015). Consequently, the particular
characteristics of the PTPZ represent an enormous potential for economic development project to
succeed by matching the strengths of the region in solving the recurrent problems that hold the
region behind the economic development of the state.
This study conducts a comprehensive analysis of the sustainability of entrepreneurs to
benefit those currently residing in rural areas of the Piedmont Triad Prosperity Zone in North
Carolina. It seeks to help existing and potential rural entrepreneurs in agricultural and
nonagricultural activities by providing guidance on the most assertive choices of entrepreneurship
activities and will re-iterate the importance of developing entrepreneurial skills through education,
research and outreach that can boost entrepreneurial activity throughout the state, thereby, creating
more jobs, reducing unemployment, reducing poverty, revitalizing and sustaining rural areas.
Objectives
The overall objective of this study is to identify demographic and socio-economic factors
affecting the development, growth and sustainability (survival) of entrepreneurs in North Carolina.
In order to determine those factors the following specific objectives are pursued:
(1) To determine potential entrepreneur establishments to invest in by examining the growth
rate/survival rate of the leading industrial sectors in North Carolina.
(2) To determine entrepreneur growth areas (counties) by examining the pattern of retail trade
for the counties located in the Piedmont Triad Prosperity Zone – the project surveyed
counties.

6
(3) To employ a combination of multivariate statistical approaches to assess the demographic
and socio-economic profile and factors associated with surviving and growing entrepreneur
operations.
Literature Review
Entrepreneurship can address population loss, one of the major problems that rural
communities face and it is believed to be a cause of economic distress, as found by Jolley,
Nousaine & Huang, 2012, in their research entitled “Effective at the Margins: Outmigration and
Economic Development in Rural North Carolina.” Their paper describes the economic and social
challenges faced by Enfield, a small town in rural northeastern North Carolina. They found that
residential outmigration was the demographic trend having the most significant long-term impact
on the area’s economic vibrancy. Population lost and outmigration was more evident by the loss
of young adults and young families and the inability to attract older adults and retirees. Difficulty
to recruit and retain high quality teachers had caused Halifax County, the county of Enfield, to
also become one of the lowest-performing districts in the state.
Lack of employment opportunities lead to high levels of poverty as it is portrait by
McDowell and Allen Smith, 1995, in their study “Poverty among Southern Workers: Metro and
Non metro Differentials”. Their study tested the extent to which factors as Age, Education, Race,
Family Type, Family Size, Metro Status, Earners, Weeks Worked, Industry and interaction
Race*Earners are determinants of poverty among the working poor in metro and non- metro areas
of the south. Their results indicated that the variables earners, race and family size had the most
influence in determining the odds of being in poverty. However, the variable race was the most
influential determinant of poverty in the non-metro area. Number of earners was the most
important variable in the metro area. Thus, the findings suggest the need for more wages to reduce
poverty. Entrepreneurship is one way to provide opportunities to increase wages by employing
more people.
A number of publications have suggested that the best chance for regions to transform their
economies is through innovations derived from entrepreneurs (Hutcheson & Morrison, 2012);
(Markley & Low, 2012); (Robinson & Sexton, 1994). Further, according to (Steele, 2013) the
future success of “rural” areas is seen as closely tied to entrepreneurship. That is, small and locally

7
owned businesses that support a family and has one, five or ten additional employees, has been the
heart of rural community through the ages. The entrepreneurial opportunities are expanding in
such areas as tourism, sport and recreation facilities, professional and technical training, retailing
and wholesaling, industrial applications (engineering, crafts), servicing (consultancy), value added
(products from meat, milk, wood, etc.) and the possibility of off-farm work.
The relationship between small rural municipalities and institutions of higher education
and their role to improve the well-being of communities by engaging communities through service
learning practices has been studied by Davis; 2007, in his dissertation entitled “Higher Education:
An Assessment Of Community Development based Service Learning In Small Rural
Municipalities In The First Congressional District Of North Carolina.” The purpose of the
dissertation was to understand the relationship between citizens and municipalities and empower
them to conduct community development projects. He found that strengthening the workforce
profile is a factor that most definitively has an impact on entrepreneurship in an economy.
The value of entrepreneurs and the vital role they play in the economic growth of a region
was studied in an article by Henderson, 2002, entitled “Building the Rural Economy with High-
Growth Entrepreneurs”. In this study the author encourage the participation of high growth
entrepreneurs in the communities. He stated that there are two types of entrepreneurs; lifestyle and
high-growth entrepreneurs. Lifestyle entrepreneurs are the ones that started a firm to provide
family income and or support a desired lifestyle often sacrificing growth for lifestyle choices.
Conversely, high-growth entrepreneurs are typically motivated to develop larger, highly visible
and more valuable firms, these firms focus on obtaining the resources necessary to fuel growth
and they are characterized by the presence of innovation that change the competitive climate of
the market.
The study of firm survival becomes very relevant by having more information readily
available to entrepreneurs. Forsyth, 2005, in his study entitled “A Note on Small Business Survival
Rates in Rural Areas: The Case of Washington State” used Washington State Department of
Revenue and Employment Security Department data to examine factors impacting a firm survival.
Applying non-parametric duration analysis they examined a nine-year time path of rural firm
survival and hazard rates in 27 rural (non-Metropolitan Statistical Area [MSA]) counties. Their
study found evidence that firms that start out as employers have a clear survival advantage over
8
those that do not and in terms of business sectors, the wholesale/retail trades in their sample
presented the lowest overall survival rates. Firms in the natural resource and service-based sectors
survival rate was statistically higher (Forsyth, 2005).
Researchers dealing with large amounts of exogenous variables, which can be troublesome,
often summarize data to be analyzed or utilized by data reduction techniques to improve
effectiveness. Nickerson and Sloan, 1999, in their study entitled “Data Reduction Techniques and
Hypothesis Testing for Analysis of Benchmarking Data” utilized a multivariate data reduction
technique and regression to systematically link performance to underlying practices where the
number of observed variables often reaches the hundreds, making data analysis problematic. The
study utilized reduction techniques on eleven exogenous performance variables and seven
endogenous variables related to product, technology and production used principal component and
exploratory factor analysis. The authors were able to reduce the eleven exogenous variables to four
common factors which accounted for 79 percent of the variation and the seven endogenous
variables to four factors accounting for 83 percent of the variation.
Data
To fulfill the objectives of this study a combination of primary and secondary data has been
analyzed. Secondary data consisting of the annual number of establishments classified by number
of employees in each industry in North Carolina was derived from the US Census Bureau, County
Business Patterns (CBP). This data was used to determine which industries in North Carolina are
contributing to the continued economic growth and development of the region. Additionally, the
annual data series provide sub-national economic data by county. Annual data gathered from the
years 2002 to 2012 contained information pertaining to the type of industry, size of enterprise
given by number of employees and the number of establishments in each size category.
Establishment is defined as a single physical location where business is conducted or where
services or industrial operations are performed. The different categories listed by the County
Business Patterns are establishments with: one to four employees, five to nine employees, ten to
nineteen employees, twenty to forty nine employees, fifty to ninety nine employees, 100 to 249
employees, 250 to 499 employees, 500 to 999 employees and, more than 1,000 employees. For the
purpose of this research, and being consistent with the Small Business Administration size
categories, these categories were regrouped into small, medium, and large size enterprises for ease
9
of analysis. The small size enterprise comprises establishments with less than 100 employees,
medium size enterprises; establishments with 100 to 999 employees and large size enterprises;
establishments of more than 1,000 employees.
Trade Area analysis will be used to examine patterns of trade between counties in North
Carolina, specifically the Piedmont Triad Area. Thus, retail sales data at the county and state level
for the years 2007 and 2012 were obtained from the U.S. Census Bureau, Census of Retail Trade,
while the county and state population data was derived from the U.S. Census Bureau, Intercensal
Population Estimates for the same years and per capita income was obtained from the U.S. Census
Bureau, American Community Survey 2006 to 2010 and 2008 to 2012 (U. S. Census Bureau,
2015).
The primary data employed in this study is derived from the survey designed under the
USDA Evans Allen funded project entitled “Sustaining Rural Growth and Development through
Agricultural Entrepreneurship”. A questionnaire consisting of seven demographic questions and
thirty one socio economic questions was administered to local entrepreneurs residing in the
Piedmont Triad Prosperity Zone; this zone is made up of eleven counties: Alamance, Caswell,
Davidson, Davie, Forsyth, Guilford, Randolph, Rockingham, Stokes, Surry and Yadkin. This zone
was selected due to its proximity to North Carolina A&T State University and in the absence of
any local trade center to assist in entrepreneur activities. The survey was administered through
mail, online and, also by personal contact. Initially, a sample of 260 entrepreneurs was contacted
by telephone and given the option to take the survey by mail or online. Unfortunately a very low
response rate was received. Thus, survey monkey was developed to reach the respondents via
online with an added convenience of ease of collection and summarization. The email list consists
of 475 registered businesses maintained by the North Carolina Department of Agriculture.
Additionally, personal interviews were conducted at the Farmers Curb Market in Greensboro,
Piedmont Triad Farmers Market in Colfax and the Farmer’s Market Downtown Reidsville. As a
result of these efforts 109 completed surveys were obtained.
Methodology
This study employed a combination of analytical approaches to examine factors that affect
rural entrepreneur success in the Piedmont Triad Prosperity Zone, PTPZ. A set of qualitative and
quantitative methods have been combined to satisfy the objectives of this study. Analysis of

10
Variance (ANOVA) and Survivor Technique was used to satisfy objective 1; determining the
potential entrepreneur establishments for future investment. Trade Area Capture (TAC) and Pull
Factor (Pf) was used to satisfy objective 2; determining entrepreneur growth areas in the PTPZ.
Descriptive Statistics, Factor Analysis and Regression was utilized to satisfy objective 3; assessing
the demographic and socio-economic profile and factors impacting entrepreneurs activities. Each
method is briefly discussed below.
The Survivor Technique involves classifying the firms or plants of an industry by size and
computing the share of industry output for each class over time. If the proportion of industry output
by firms or plants of a specified size is maintained or increased, firms or plants of that size are
presumed to be of the optimum size (Reekie, 1984). For the purpose of this research, the focus
will be on the top four industries in North Carolina and the agriculture sector. Survivor Technique
will be used to determine the survival rate of the leading industrial sectors in North Carolina and
the optimal size of establishment.
ANOVA will be used to determine if there is any significant difference in the growth of
industry by size of establishment. The three sizes of enterprises are small, medium and large; the
industries are Service, Retail Trade, Construction, Health Care and Agriculture Industry during the
years 2002 to 2012. The null hypothesis to be tested is that there is no significant difference
between the three group means by industry type.
Trade area analysis was employed to determine the magnitude and ability of a county to
capture commercial activities from other counties within the PTPZ. The trade area analysis
indicates whether or not a county is attracting customers from outside its boundaries or if people
residing in a county are spending more for retail items. This analysis yields values that can be used
to determine inflows and outflows of retail sale customers. Trade area capture is determined by
dividing the county’s actual retail or service sales by the state per capita expenditures adjusted by
the relative per capita income between county and state (Harris, 1995 and Moore, 2008)
Trade area capture for retail sector j in county i, (TACij) is estimated as:
TACij = ______Asij_______
(Assj/ Ps) x (Yc/ Ys)

11
Where
Asij represents annual taxable retail sales for sector j in county i;
Assj represents annual taxable retail sales for sector j for the state
Ps is the state population
Yc is county per capita income
Ys is state per capita income
If the trade area capture is larger than the county population then it means that the county
is attracting consumers from outside its boundaries or people who reside in the county are spending
more for these retail items. If the trade area capture is less than the county population, then the
county is not even capturing the retail/service purchases of its own residents or the county residents
are spending relatively less than the statewide average (Thomas R. Harris, 1985).
Pull Factor is derived to estimate the amount of sales that were from customers outside the
county. Pull factor is a ratio which explicitly derives the portion of consumers that are from outside
the county boundaries. It is calculated by dividing the trade area capture by the county population.
Pfij =____TACij____
POPi
Where
–Pfij is the pull factor value for commercial sector j in county i
–TACij is the trade area capture value for commercial sector j in county i
–POPi is population in county i
Dividing the Trade Area Capture by the County Population removes the influence of
population change within a county and focuses attention on the county’s ability to draw outside
consumers. Therefore, the Pf is showing how much of the sales are due to local or foreign
purchases. A trade pull factor greater than 1.0 indicates that the city/county is pulling in retail trade
from beyond its boundaries. Thus, the balance of trade is favorable. Alternatively, a trade pull
factor less than 1.0 indicates that the city/county is not capturing the shoppers within its
boundaries. A trade pull factor equal to 1.0 indicates that there is a perfect balance of trade. The
purchases of city/county residents who shop elsewhere are offset by the purchases of out-of-
city/county customers (Moore, 2008)
Factor analysis was used to satisfy objective 3. Factor analysis was employed as a data
reduction tool to reduce the large survey data set to a workable and statistical feasible number. To
determine the factors affecting the survival of entrepreneurs in the Piedmont Triad Prosperity Zone
several entrepreneurship characteristic/variables where assessed. Although success can be measure

12
by different means, the present study defines success as sustainability of the enterprise, based on
the hypothesis that enterprises that are efficient will survive over time and expand. The dependent
variable representing survival of business is the number of years a business has been in operation.
The explanatory variables are the demographic and socio-economic characteristics of the sample
of the entrepreneurs of the Piedmont Triad Prosperity Zone (Appendix A). Thus, factor analysis
was performed on 31 survival characteristic of the entrepreneur. For the factor analysis, basic
factor analysis equation can be represented in matrix form as:
Zpx1 = λpxmFmx1 + εpx1
Where
Z is a px1 vector of variables,
λ is a pxm matrix of factor loadings
F is a mx1 vector of factors and
ε is a px1 vector of error (unique or specific) factors.
It will be assumed that factors were not correlated with the error components. Moreover, this study
employed the principal components factor analysis extraction method and Varimax rotation, which
generally results in reasonably interpretable simple structure (Thompson, 2004).
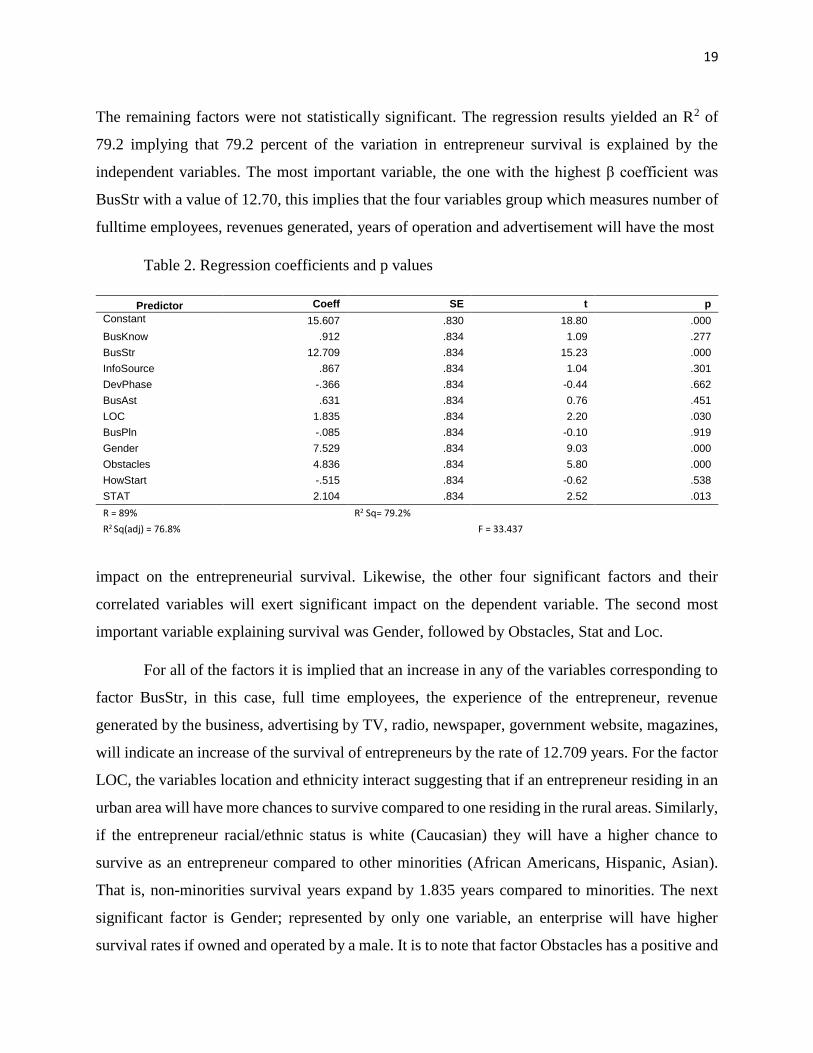
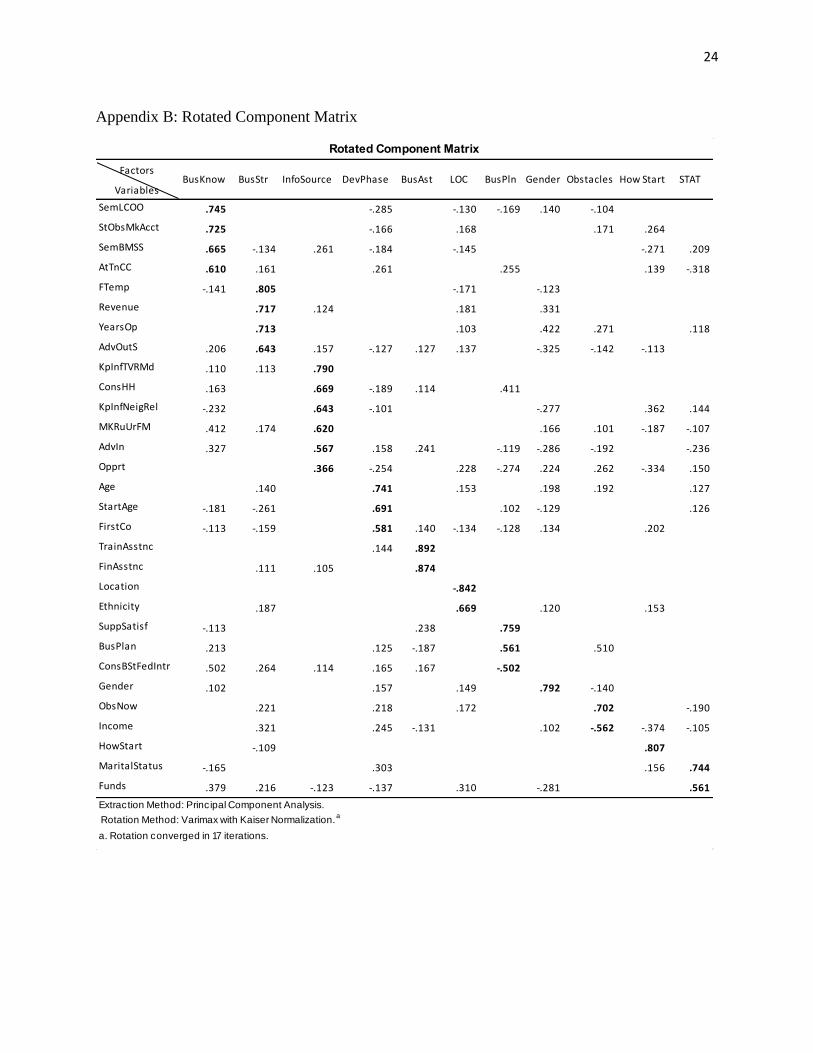
SPSS was used to derive the rotated component matrix (Appendix B) which is a matrix of
the factor loadings for each variable onto each factor. The variables are listed in the order of size
of their factor loading because SPSS is directed to give the output sorted by size for ease of analysis
and interpretation. Factor loadings are correlation coefficients between variables and factors and
they are used to obtain factor scores for selected factors.
Regression analysis is used as part of the methodology to satisfy objective 3. Regression
analysis is employed as a statistical tool for the investigation of relationships between variables.
Factors with Eigenvalues greater than one were employed in the multiple regression analysis
yielding factor scores. The score values of the selected factors or components were considered as
independent variables in the multiple regression analysis which will be used to predict the survival
of an entrepreneur, measured as the number of years a business has been in operation. The
regression equation is presented as:
S = a + b1FS1 + b2FS2 +……. + bnFSn + e

13
Where “a” is the regression constant (its value is zero), b1 through bn are regression
coefficients of Factor Scores (FS). FS is factor scores and “e” is the error term of the regression
model. Regression coefficients were tested by using t-test. Determination coefficient (R2) was
used as predictive survival criteria for the regression model. All the data was analyzed using
Statistical Package for Social Science (SPSS). The overall hypothesis to be tested is that all the
factors scores will have a significant and positive effect on an entrepreneur survival.
Empirical Results
The survey instrument used in this study was comprised of 38 questions soliciting
information from business owners concerning their current operation. Appendix C presents the
variables and the percentages of the most predominant participant’s responses to the survey
questions. The first seven variables represents demographic information and shows that most of
the participants reside in rural areas, are males, married, white, between the ages of 50-60, highly
educated with at least a BS/BA degree, and with family income of over $100,000. The remaining
variables are socio-economic factor profiling each survey participant. The data depicts that most
businesses have been in operation for an average of 17 years, they have less than 3 employees,
primarily family members and still operate their first company. Starting their business they were
faced with many obstacles such as financing, lack of information, managerial/entrepreneurial
skills, marketing, bookkeeping/accounting and finding skilled employees. Additionally, most of
the participants stated that they know where to obtain training and financial assistance and were
satisfied with the support they have received. The primary legal structure of the businesses was
sole-proprietorship with most participants stating that they wanted to create their own business.
The dominant business type was retailing/wholesaling operations. Moreover, most of the funds for
the business operation was acquired through personal savings. The participants indicated that their
business operations generated on average less than $50,000 annually. In general, most of the
participants also indicated that they have a business plan and plan to expand in the immediate
future. However, a number of obstacles to their continued success were reported, the most common
obstacle was finding a market for their products. Current marketing efforts have centered on
marketing in rural area, urban areas, farmers market communities and online. Additionally, basic
advertising has been through business website, flyers/newsletters and word-of-mouth. Thus, most
participants stated that business classes related to better marketing would be most helpful.

14
Additionally, they suggested that classes on federal regulations, business structure and credit
would be most beneficial.
Results from the ANOVA, indicated that there was no significant difference between
small, medium and large firm size within the industrial sectors. Thus, all further analysis will
examine differences between the individual industrial sectors.
Figure 3. Industrial sector growth rate
A further application of a t-test showed that there was a significant difference between
Service and Retail Trade and Service and Agriculture. Significant difference was also found in
Health Care and Retail Trade, Health Care and Construction and Health Care and Agriculture.
Employing survivor technique it was found that the Health Care industrial sector was the
more sustainable over the years as displayed in Figure 3. Consequently, an entrepreneur whose
business is related to the Health Care has been more sustainable during the last decade than the
other industries.
Trade Area Analysis
Table 1 shows TAC and Pf for each of the eleven counties in the PTPZ of North Carolina
for the years 2007 and 2012. The three metropolitan statistical areas are Burlington, Greensboro-

15
High Point and Winston Salem located in Alamance, Guilford and Forsyth County, respectively.
The micropolitan statistical areas are Lexington-Thomasville and Mount Airy located in Davidson
and Surry County, respectively. The remaining counties are classified as non-metropolitan or rural
counties. The data indicates that only four of the eleven counties; Alamance, Forsyth, Guilford and
Surry have a TAC that is greater than the county population. This implies that these counties are
attracting consumers from outside their boundaries. Therefore, entrepreneur opportunity may exist
in these counties. The remaining seven counties TAC is less than the county population implying
that these counties are not capturing the retail/services purchases of their own residents, thus,
entrepreneurship opportunities are questionable. The pull factor (Pf), is also provided in Table 1,
it measures how much of the retail trade activity is derived from other counties. The data show
that the Pf is also greater for Alamance, Forsyth, Guilford and Surry. A factor greater than one
implies the county is pulling in retail trade from beyond its boundaries. For instance, Surry County
has the largest Pf of 1.36 and 1.46 for the years 2007 and 2012, respectively, which implies, that
36 or 46 percent of his retail sales is derived outside the county. On the other hand, when the Pf is
less than one it is an indication of low commercial activity in the county and their residents are
either getting their retail trade items from outside the county or reducing their spending as for
example Caswell County that has the lowest Pf of 0.23 and 0.31. This suggests that 77 and 69
percent of its retail sales is flowing to adjacent counties.
Knowing the flow and direction of trade indicates to entrepreneur potential future location
for business operations. Some counties are steadily losing TAC and their Pf is lower than 1 as it is
the case of Davie, Randolph and Stokes Counties which lose Retail Trade sales from the years
2007 to 2012 not being able to capture the spending of their own population. Therefore, in order
for these counties to improve capture of local dollars and recapture lost trade development
strategies will be needed. What it is basically depicted in this study is the position of each county
and the direction of the changes over time. From the eleven counties four are increasing their Pf
and seven have decreased. This directional change provides an idea of potential good areas where
entrepreneurs can be successful. Additionally, Figure 4 complements our previous discussion by
showing graphically the counties that are attracting consumers from outside their boundaries and
the ones that are losing consumers to other areas. This suggests that future entrepreneur should
consider operating in the following four counties; Guilford, Forsyth, Alamance and Surry whose

16
Table 1. Trade Area Capture and Pull Factor for Counties in PTPZ, 2007 and 2012
Figure 4. Trade area analysis of the PTPZ during the years 2007 and 2012

17
Pf is greater than one. It should be also noted that these counties have the largest population and is
predominantly an urban population. However, Surry County is an exception given that it is
primarily a tourist area for its natural scenic attractions and it has a core urban micropolitan area.
Contrariwise, the rural counties, with lower population tend to be adjacent to a more urban county
thus the Pf is lower.
Factor Analysis and Linear Regression
Through exploratory factor analysis all variables (about 59) were analyzed in a correlation
matrix, variables with correlation coefficients larger than 0.9, which can represent singularity in
the data, were excluded. The component matrix was also checked for variables exhibiting weak
loading factors; those variables were also excluded from the data set. Exploratory factor analysis
was run again until thirty of the variables correlated very well and none of the correlation
coefficients were particularly large. The determinant of the matrix was larger than 0.00001
indicating that there were no multicollinearity problems.
Keiser- Meyer Olin test with a value of 0.568 indicated that the pattern of correlations was
relatively compact implying factor analysis is appropriate for these data. The significant test tells
us that the R-matrix is not an identity matrix; therefore there are some relationships between the
variables. For these data Bartlett’s test is highly significant, p<0.001, indicating that factor analysis
is appropriate.
After conducting factor analysis on the entrepreneur’s demographic and socio-economic
variables/characteristics the rotation factor loadings from the component matrix (Appendix B),
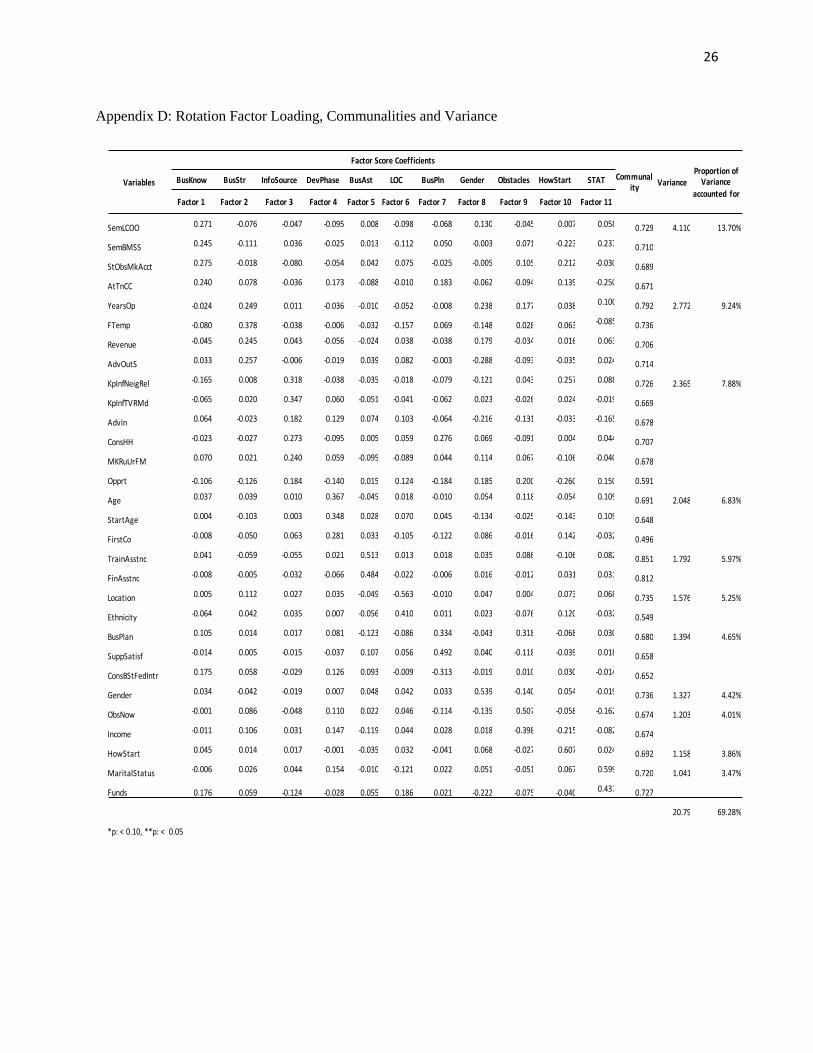
communalities and variances for the 30 characteristics were derived (Appendix D). Between one
to six variables/characteristics were found to load in one of the eleven factors. These eleven factors
were selected because they have eigenvalues greater than one and were selected as the explanatory
variables for the multiple regression model (Tabachnick & Fidell, 2007).
Additionally, communality values were higher in some factors, for example, SemLCOO
had a communality value of 0.73, indicating that 73% of the variance in SemLCOO is accounted
for by factors one through eleven. Then the proportion of the variance in a set of variables
accounted for by a factor is the sum of square loading for the factor (SSL) (variance of factor)

18
divided by the number of variables (when the rotation is orthogonal). Thus, the proportion of
variance accounted for by the five variables loaded on factor one, BusKnow is 13.70 %.
Factors two through eleven accounted for the remainder of the variance and are shown in
the last column of Appendix D. Because rotation is orthogonal, the eleven factors together are
responsible for the 69.3 percent of the variance in variables. The proportion of variance in the
solution accounted for by a factor, or the proportion of covariance, is the sum of loadings for the
factor divided by the sum of communalities.
The factors were named to represent the variables that loaded within it as depicted in
Appendix E. The variables that accounted for the largest variance are shown in descending order.
Therefore, factors with several variables will have a name that represents all variables that are
accounted for under that factor.
Given the orthogonal rotation, it is easy to find the values of loadings in descending order.
The values of loadings are correlations between variables and corresponding factors. The
correlation values indicated in bold represent the highest correlations between variables and
corresponding factors Appendix B. The greater the loading, the more the variable is a pure measure
of the factor. For example, factor 1 consist of four variables SemLCOO, SemBMSS, StObsMkAcct
and AtTnCC which exhibit the highest correlation with factor 1 thus, is consider as a group. This
group, factor 1, was renamed BusKnow because they represented the entrepreneurs knowledge of
business tools. Similarly, factors two through eleven are represented by the variables with higher
loading values or higher correlation with the corresponding factor and also renamed and presented
in Appendix E.
To obtain the factor score values factor score coefficients in Appendix D were used. These
factor score values for the eleven factors selected were the independent variables in the linear
regression analysis used to determine the significant factors that explain the survival of
entrepreneurs in the PTPZ. In the present study, five of the eleven selected independent
factors/variables were found to have significant impact on the dependent variable, entrepreneur
survival, measured by number of years a business has been in operation.
As depicted in Table 2, only five of the eleven factors exert a positive and significant effect
on the survival of entrepreneurs. Those factors are: BusStr, Gender, Obstacles, STAT and LOC.
19
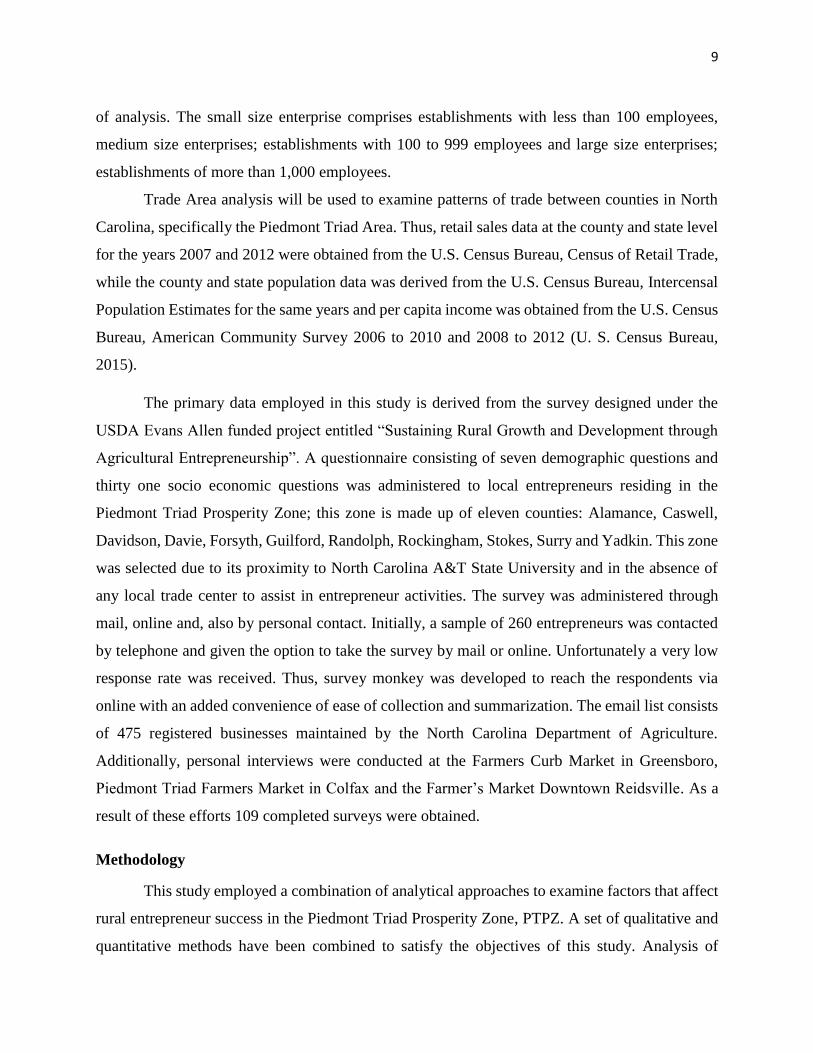
The remaining factors were not statistically significant. The regression results yielded an R2 of
79.2 implying that 79.2 percent of the variation in entrepreneur survival is explained by the
independent variables. The most important variable, the one with the highest β coefficient was
BusStr with a value of 12.70, this implies that the four variables group which measures number of
fulltime employees, revenues generated, years of operation and advertisement will have the most
Table 2. Regression coefficients and p values
Predictor Coeff SE t p
Constant 15.607 .830 18.80 .000
BusKnow .912 .834 1.09 .277
BusStr 12.709 .834 15.23 .000
InfoSource .867 .834 1.04 .301
DevPhase -.366 .834 -0.44 .662
BusAst .631 .834 0.76 .451
LOC 1.835 .834 2.20 .030
BusPln -.085 .834 -0.10 .919
Gender 7.529 .834 9.03 .000
Obstacles 4.836 .834 5.80 .000
HowStart -.515 .834 -0.62 .538
STAT 2.104 .834 2.52 .013
R = 89% R2 Sq= 79.2%
R2 Sq(adj) = 76.8% F = 33.437
impact on the entrepreneurial survival. Likewise, the other four significant factors and their
correlated variables will exert significant impact on the dependent variable. The second most
important variable explaining survival was Gender, followed by Obstacles, Stat and Loc.
For all of the factors it is implied that an increase in any of the variables corresponding to
factor BusStr, in this case, full time employees, the experience of the entrepreneur, revenue
generated by the business, advertising by TV, radio, newspaper, government website, magazines,
will indicate an increase of the survival of entrepreneurs by the rate of 12.709 years. For the factor
LOC, the variables location and ethnicity interact suggesting that if an entrepreneur residing in an
urban area will have more chances to survive compared to one residing in the rural areas. Similarly,
if the entrepreneur racial/ethnic status is white (Caucasian) they will have a higher chance to
survive as an entrepreneur compared to other minorities (African Americans, Hispanic, Asian).
That is, non-minorities survival years expand by 1.835 years compared to minorities. The next
significant factor is Gender; represented by only one variable, an enterprise will have higher
survival rates if owned and operated by a male. It is to note that factor Obstacles has a positive and

20
significant impact in the survival of an entrepreneur, this factor is represented by current obstacles
and family income, suggesting that an entrepreneur that has been able to overcome obstacles and
have higher family income will have more chances to survive in business. The factor STAT which
is represented by marital status and how the business was funded also have a positive impact in
the survival of an enterprise, meaning that if entrepreneur is married and has personal funds as
described in the study, the entrepreneur will have a higher survival rate.
Conclusions
The overall results of this study suggest that to be a successful entrepreneur requires an
individual to consider investing in businesses related with the health care industry or service
industry. However, data over the last two years indicate significant positive growth in the
Agriculture industrial sector which may indicate future entrepreneur potential. Additionally, the
focus should be also in the counties that are attracting more commercial activities. In this case,
those counties are Guilford, Forsyth, Alamance and Surry. Moreover, to be a successful
entrepreneur requires one to secure appropriate business structure, maintain a high impact
marketing strategy, be located in or adjacent to an area with growing commercial activities, a male,
free of barriers associated with marketing their product and if possible married.
Additionally, since the difference in survival rate between small, medium and large
enterprises was not statistical significant one can suggest that entrepreneurs will have a good
chance to succeed by engaging in small size enterprises. As it was previously mentioned, small
entrepreneurs can improve economic growth and development in a region by creating more jobs,
reducing unemployment, reducing poverty, revitalizing and sustaining rural areas.
A detail study about the commercial activity of Surry County is suggested for further
studies to reveal the causes of the flowing of retail trade activity by entrepreneurs in one of the
most commercial oriented rural county in the PTPZ. It is also recommended that further studies be
continued to pursue an analysis of the demographic characteristics separately from the socio-
economic variables to get a closer look at the way variables correlate with the dependent variable
and how the variables load in different factors. This type of analysis could reveal different
combinations of factors that may impact entrepreneur’s survival different from the one derived in
21
this study. Moreover, it could generate more significant variables that might positively or
negatively contribute to entrepreneurs continued success.
References
BEA. (2015). Broad Growth Across States in 2014. Retrieved June 10, 2015, 2015, from
http://www.bea.gov/newsreleases/regional/gdp_state/2015/pdf/gsp0615.pdf
BLS. (2015). Labor Force Statistics from the Current Population Survey. Databases, Tables &
Calculators by Subject.
Davis, Donald G. (2007). Higher Education: An Assessment of Community Development Based Service
Learning in Small Rural Municipalities in the First Congressional District of North Carolina.
(Doctor of Education Dissertation), East Carolina University, North Carolina. (UMI Microform
3255422)
Forsyth, Grant D. (2005). A Note on Small Business Survival Rates in Rural Areas: The Case of
Washington State. Growth and Change, 36(3), 428-440. doi:
http://onlinelibrary.wiley.com/journal/10.1111/%28ISSN%291468-2257/issues
Freyer, Allan. (2014). Economic Growth fails to Generate Increased Incomes for NC Families. Prosperity
Watch, 1(31).
Harris, T. R. . (2014). Estimating Market Potential Using Published Data: A Trade Area Analysis
Example. Western Extensopn Marketing Committee, 8(08), 7.
Harris, Thomas R. (1985). Commercial Sector Development in Rural Communities: Trade Area Analysis.
Hard Times Communities in Transition.
Henderson, Jason. (2002). Building the Rural Economy with High Growth Entrepreneurs. Economic
Review. Retrieved from www.kc.frb.org website:
https://www.kansascityfed.org/publicat/econrev/pdf/3q02hend.pdf
Hubbard, Jule. (2013). House OKs ‘prosperity zone’ plan. On Wilkes Journal-Patriot. Wilkesboro, NC.
Hutcheson, Scott, & Morrison, Ed. (2012). Transforming Regions Through Strategic Doing. Choices the
Magazine of Food , Farm and Resource Issues, 27(2), 6.
Jolley, Jason, Nousaine, Aaron, & Huang, Carolyn. (2012). Effective at the Margins: Outmigration and
Economic Development in Rural North Carolina. Sustainable Agriculture Research, 1(1), 2-12.
Markley, Deborah M., & Low, Sarah A. (2012). Wealth, Entrepreneurship, and Rural Livelihoods.
Choices the Magazine of Food, Farm, and Resource Issues, 27(1).

22
McDowell, Donald R., & Allen-Smith, Joyce E. (1995). Poverty among southern workers: Metro and
nonmetro differentials. American Journal of Agricultural Economics, 77(3), 796.
Morgan, Jonathan Q. (2009). Economic Development Handbook. Retrieved June 18, 2015, from
https://www.nceda.org/wp-content/uploads/Economic-Development-Handbook.pdf
NC-LEAD. (2015). Prosperity Zones Data Books. NC Department of Commerce. 2015, from
http://www.nccommerce.com/lead/research-publications/regional-economic-labor-market-
information/prosperity-zone-data-books/piedmont-triad-central-region
Nickerson, J. A., & Sloan, T. W. (1999). Data reduction techniques and hypothesis testing for analysis of
benchmarking data. International Journal of Production Research, 37(8), 1717.
Reekie, W. D. (1984). Minimum Efficient Scale in South African Industry: An Application of the
Survivor Technique. South African Journal of Economics, 52(3), 147-154. doi: 10.1111/j.1813-
6982.1984.tb00834.x
Robinson, Peter B., & Sexton, Edwin A. (1994). The effect of education and experience on self-
employment success. Journal of Business Venturing, 9(2), 141-156. doi:
http://dx.doi.org/10.1016/0883-9026(94)90006-X
Stangler, Dane, & Kedrosky, Paul. (2010). Exploring Firm Formation: Why is the Number of New Firms
Constant? In F. F. a. E. Growth (Series Ed.) E. M. K. Foundation (Ed.) (pp. 36). Retrieved from
http://www.kauffman.org/~/media/kauffman_org/research%20reports%20and%20covers/2010/04
/exploring_firm_formation_11310
Steele, Joanne. (2013). How to Use Rural Entrepreneurship to Save Your Small Town.
Thompson, Bruce. (2004). Exploratory and confirmatory factor analysis : understanding concepts and
applications (1st ed. ed.). Washington, DC :: American Psychological Association.
U. S. Census Bureau. (2015). The U.S. Census Bureau at work for you. [Washington, D.C.] :: U.S. Dept.
of Commerce, Economics and Statistics Administration, U.S. Census Bureau.
UNMDG. (2015). Millenium Development Goals. We can End Poverty. Retrieved June 18, 2015, from
http://www.millennium-institute.org/integrated_planning/frameworks/MDG/
Wojan, Tim, & GMcGranahan, David. (2015, April 10, 2015). Business & Industry. USDA-ERS.
Retrieved August 26,2015, 2015, from http://www.ers.usda.gov/topics/rural-economy-
population/business-industry.aspx

23
Appendix A: Definition of Variables
Variable Description
Location Location Rural Urban
Gender Gender Male Female
Marital Status Marital status Single Married Widow Separated/Divorced
Ethnicity Ethnicity African American African Asian Hispanic
Native American White Other
Age Age Category Under 20 years 20-29 years 20-29 years 30-39 years
40-49 years 50-60 years
Education Highest level of schooling Less than High School High School Some College College Education (BS, BA)
Postgraduate (MS, MBA, PhD) Certificate/training courses
Income Family Income $10,000 or less; $10,001to $20,000; $20,001 to $30,000;$30,001 to $40,000;
$40,001 to $50,000; $50,001 to $60,000; $60,001 to $70,000; $70,001 to $80,000;
$80,001 to $90,000; $90,001 to $100,000;Greater than $100,001
YearsOp Years Business has been in operation Actual number of years
FTemp Full time employees Number of FT employees
FamEmp Family members employed Actual number of family members employed
FirstCo First company Yes or No
TrainAsstnc Know where to get training assistance Yes or No
FinAsstnc Know where to get financial assistance Yes or No
ConsHh Consumers are households Yes or No
Business Plan Business Plan Yes or No
Expand Plan to expand Yes or No
Opportunities Think there are opportunities for other businesses Yes or No
HelpYours Would creation of other businesses, help yours? Yes or No
MKRuUrFM Marketing in local areas Local rural community,Nearby urban area, Farmer's Market
MkWbInBus Marketing online/internationally/business Website/online orders, International markets, Other
Funds How initial funds were accumulated Personal Savings, Support from Family and Friends, Bank loans, Grants, Other sources
LegalStr Business Legal Structure Sole Proprietorship, Partnership: General,Limited, Registered Limited Liability,
Other Partnership Corporation: Business,Nonprofit, Close, Professional,
Cooperative , Other Corporation
Revenue Revenue $1.00 to $10,000 $10,001 to $50,000 $50,001 to 100,000 $100, 001 to $250,000
$250,001 to $500,000 > $500,001
suppSatisf Satisfaction with support received Not satisfied, Somewhat satisfied, Very satisfied, Not applicable/Do not have any outside support
ObsNow Current Obstacles There are no obstacles, finance , finding a market for products, bookkeping and accounting,
finding skil led employees, Long hour away from family, Other
GSfood Goods/Services produced related to food Bakery, Butchery, Fruit and vegetable processing, Processed cheese and yoghurt,
Winery, Nursery
GSSalesServ Goods/Services are arts, recreation, services Direct Marketing, Livestock equipment and structures, Tourists related activity,
Sport and recreational facil ities, Servicing (financial, custodial, etc), others
ConsBStFedIntr Main consumers are Other businesses, Local, State or Federal Agencies/Institutions, International markets, others
StObsLack Initial Obstacles were Start up finance, Lack of information/advice on how to start a business
Inappropriate management skil ls, Lack of entrepreneurial skil ls
StObsMkAcct Initial obstacles were Gender/racial discrimination, Finding a market for products/service, Bookkeeping and accounting
Finding skil led employees, Long hour away from family, Other
AdvOutS Advertising by high impact media Newspaper ads, Television commercials, Government operated website/Internet, Magazines
AdvIn Advertising on short range media Business website/Internet, Flyers, Word-of-mouth, other
SuppCommEd Support received from service agencies Small Business Administration, Cooperative Extension, NC Rural Economic Development Center,
Universities/Communities Colleges
SemBMSS Think semminars in the following would help Preparing a business plan, Marketing assistance for business,
Overview of microenterprise and self-employment opportunities, Steps in starting a business
SemLCOO Think semminars in the following would help Local/state/federal regulations, policies and procedural requirements,
Choosing a legal business structure, Obtaining and using credit.
HowStart How the business started Created my current company myself, Family business that I inherited, A business that I purchased
Created the business with my spouse, Created the business with my children,
Created the business with other family, Created the business with a friend, other
TypeAct Type of activity Education, Banking/Finance/Accounting, Medical/Dental/Healthcare, Manufacturing and Processing
Online Retailer, Transportation/Util ities, Wholesaling/Retailing/Distribution,
Business Services/Consultant, Marketing/Advertising/Entertainment, other
Budget Annual Budget $1.00 to $10,000 $10,001 to $50,000 $50,001 to 100,000 $100, 001 to $250,000
$250,001 to $500,000 > $500,001
Definition of Variables
Responses
24
Appendix B: Rotated Component Matrix
Factors
Variables
SemLCOO .745 -.285 -.130 -.169 .140 -.104
StObsMkAcct .725 -.166 .168 .171 .264
SemBMSS .665 -.134 .261 -.184 -.145 -.271 .209
AtTnCC .610 .161 .261 .255 .139 -.318
FTemp -.141 .805 -.171 -.123
Revenue .717 .124 .181 .331
YearsOp .713 .103 .422 .271 .118
AdvOutS .206 .643 .157 -.127 .127 .137 -.325 -.142 -.113
KpInfTVRMd .110 .113 .790
ConsHH .163 .669 -.189 .114 .411
KpInfNeigRel -.232 .643 -.101 -.277 .362 .144
MKRuUrFM .412 .174 .620 .166 .101 -.187 -.107
AdvIn .327 .567 .158 .241 -.119 -.286 -.192 -.236
Opprt .366 -.254 .228 -.274 .224 .262 -.334 .150
Age .140 .741 .153 .198 .192 .127
StartAge -.181 -.261 .691 .102 -.129 .126
FirstCo -.113 -.159 .581 .140 -.134 -.128 .134 .202
TrainAsstnc .144 .892
FinAsstnc .111 .105 .874
Location -.842
Ethnicity .187 .669 .120 .153
SuppSatisf -.113 .238 .759
BusPlan .213 .125 -.187 .561 .510
ConsBStFedIntr .502 .264 .114 .165 .167 -.502
Gender .102 .157 .149 .792 -.140
ObsNow .221 .218 .172 .702 -.190
Income .321 .245 -.131 .102 -.562 -.374 -.105
HowStart -.109 .807
MaritalStatus -.165 .303 .156 .744
Funds .379 .216 -.123 -.137 .310 -.281 .561
Extraction Method: Principal Component Analysis.
Rotation Method: Varimax with Kaiser Normalization.a
a. Rotation converged in 17 iterations.
BusKnow BusStr InfoSource DevPhase BusAst LOC BusPln Gender Obstacles How Start STAT
Rotated Component Matrix

25
Appendix C: Variables Definition and Dominant Value
Variable Description
Location Location 71% Rural
Gender Gender 53% Male
Marital Status Marital status 84% Married
Ethnicity Ethnicity 83% White
Age Age Category 29% 50-60 years
Education Highest level of schooling 38% College Education (BA, BS)
Income Family Income 32% >100,000
YearsOp Years Business has been in operation 17 Years in average
FTemp Full time employees 88% less than 3 emp
FirstCo First company 61% yes
TrainAsstnc Know where to get training assistance 57% yes
FinAsstnc Know where to get financial assistance 47% yes
Funds How initial funds were accumulated 71% Personal Savings
LegalStr Business Legal Structure 62% Sole propriartorship
Revenue Revenue 71% $1-$50,000
ConsHh Consumers are households 83% Households
Business Plan Business Plan 61% Yes
Expand Plan to expand 52% Yes
suppSatisf Satisfaction with support received 50% Somewhat
ObsNow Current Obstacles 39% Finding a market for the product
Opportunities Think there are opportunities for other businesses 79% Yes
HelpYours Would creation of other businesses, help yours? 49% Yes
GSfood Goods and Services produced related to food 56% Yes
GSSalesServ Goods and Services related to arts, recreation, services 66% Yes
MKRuUrFM Marketing in rural, near urban and farmer's market community 88% Yes
MkWbInBus Marketing online, internationally or other business 39% Yes
ConsBStFedIntrConsumers are international, other business, state/federal agencies/institutions 39% Yes
StObsLack Initial Obstacles finance, lack of information, managerial or entrepreneur skills 55% Yes
StObsMkAcct Initial obstacles marketing, bookkeeping/accounting, finding skilled employees 59% Yes
AdvOutS Advertising by Newspaper, TV, radio gov website, magazines/trade shows 26% Yes
AdvIn Advertising on business website, flyers/newsletters, word of mouth 90% Yes
SuppCommEd Support received from service agencies 47% Yes
SemBMSS Think classes of business, marketing, microenterprise would help 43% Yes
SemLCOO Think classes of federal regulations, business structure, credit would help 47% Yes
HowStart How the business started 45% wanted to create my own company
TypeAct Type of activity 38% Wholesaling/retailing
FamEmp Family members employed 46% 0, 39% 1 or 2
Budget Annual Budget 49% $10,000 -$50,000
Dominant Value
Variable Definition and Dominant Value
26
Appendix D: Rotation Factor Loading, Communalities and Variance
Variables
Factor Score Coefficients
Communality
VarianceProportion of
Variance accounted for
BusKnow BusStr InfoSource DevPhase BusAst LOC BusPln Gender Obstacles HowStart STAT
Factor 1 Factor 2 Factor 3 Factor 4 Factor 5 Factor 6 Factor 7 Factor 8 Factor 9 Factor 10 Factor 11
SemLCOO 0.271 -0.076 -0.047 -0.095 0.008 -0.098 -0.068 0.130 -0.045 0.007 0.058 0.729 4.110 13.70%
SemBMSS 0.245 -0.111 0.036 -0.025 0.013 -0.112 0.050 -0.003 0.071 -0.223 0.237 0.710
StObsMkAcct 0.275 -0.018 -0.080 -0.054 0.042 0.075 -0.025 -0.005 0.105 0.212 -0.030 0.689
AtTnCC 0.240 0.078 -0.036 0.173 -0.088 -0.010 0.183 -0.062 -0.094 0.139 -0.250 0.671
YearsOp -0.024 0.249 0.011 -0.036 -0.010 -0.052 -0.008 0.238 0.177 0.038 0.100 0.792 2.772 9.24%
FTemp -0.080 0.378 -0.038 -0.006 -0.032 -0.157 0.069 -0.148 0.028 0.063 -0.085 0.736
Revenue -0.045 0.245 0.043 -0.056 -0.024 0.038 -0.038 0.179 -0.034 0.016 0.063 0.706
AdvOutS 0.033 0.257 -0.006 -0.019 0.039 0.082 -0.003 -0.288 -0.093 -0.035 0.024 0.714
KpInfNeigRel -0.165 0.008 0.318 -0.038 -0.035 -0.018 -0.079 -0.121 0.043 0.257 0.088 0.726 2.365 7.88%
KpInfTVRMd -0.065 0.020 0.347 0.060 -0.051 -0.041 -0.062 0.023 -0.026 0.024 -0.019 0.669
AdvIn 0.064 -0.023 0.182 0.129 0.074 0.103 -0.064 -0.216 -0.131 -0.033 -0.165 0.678
ConsHH -0.023 -0.027 0.273 -0.095 0.005 0.059 0.276 0.069 -0.091 0.004 0.044 0.707
MKRuUrFM 0.070 0.021 0.240 0.059 -0.095 -0.089 0.044 0.114 0.067 -0.106 -0.040 0.678
Opprt -0.106 -0.126 0.184 -0.140 0.015 0.124 -0.184 0.185 0.200 -0.260 0.150 0.591
Age 0.037 0.039 0.010 0.367 -0.045 0.018 -0.010 0.054 0.118 -0.054 0.109 0.691 2.048 6.83%
StartAge 0.004 -0.103 0.003 0.348 0.028 0.070 0.045 -0.134 -0.025 -0.143 0.109 0.648
FirstCo -0.008 -0.050 0.063 0.281 0.033 -0.105 -0.122 0.086 -0.016 0.142 -0.032 0.496
TrainAsstnc 0.041 -0.059 -0.055 0.021 0.513 0.013 0.018 0.035 0.086 -0.106 0.082 0.851 1.792 5.97%
FinAsstnc -0.008 -0.005 -0.032 -0.066 0.484 -0.022 -0.006 0.016 -0.012 0.031 0.031 0.812
Location 0.005 0.112 0.027 0.035 -0.049 -0.563 -0.010 0.047 0.004 0.073 0.068 0.735 1.576 5.25%
Ethnicity -0.064 0.042 0.035 0.007 -0.056 0.410 0.011 0.023 -0.076 0.120 -0.032 0.549
BusPlan 0.105 0.014 0.017 0.081 -0.123 -0.086 0.334 -0.043 0.318 -0.068 0.030 0.680 1.394 4.65%
SuppSatisf -0.014 0.005 -0.015 -0.037 0.107 0.056 0.492 0.040 -0.118 -0.039 0.018 0.658
ConsBStFedIntr 0.175 0.058 -0.029 0.126 0.093 -0.009 -0.313 -0.019 0.010 0.030 -0.014 0.652
Gender 0.034 -0.042 -0.019 0.007 0.048 0.042 0.033 0.539 -0.140 0.054 -0.019 0.736 1.327 4.42%
ObsNow -0.001 0.086 -0.048 0.110 0.022 0.046 -0.114 -0.135 0.507 -0.058 -0.162 0.674 1.203 4.01%
Income -0.011 0.106 0.031 0.147 -0.119 0.044 0.028 0.018 -0.398 -0.215 -0.082 0.674
HowStart 0.045 0.014 0.017 -0.001 -0.035 0.032 -0.041 0.068 -0.027 0.607 0.024 0.692 1.158 3.86%
MaritalStatus -0.006 0.026 0.044 0.154 -0.010 -0.121 0.022 0.051 -0.051 0.067 0.599 0.720 1.041 3.47%
Funds 0.176 0.059 -0.124 -0.028 0.055 0.186 0.021 -0.222 -0.075 -0.040 0.437 0.727
20.79 69.28%
*p: < 0.10, **p: < 0.05

27
Appendix E: Description of the Factors/Variables Renamed