Selected Acquisition Report (SAR) · Selected Acquisition Report-SAR 14. ABSTRACT 15. ... Selected...
38
Selected Acquisition Report (SAR) RCS: DD-A&T(Q&A)823-334 P-8A Poseidon Multi-Mission Maritime Aircraft (P-8A) As of FY 2015 President's Budget Defense Acquisition Management Information Retrieval (DAMIR) April 16, 2014 17:36:29 UNCLASSIFIED
Transcript of Selected Acquisition Report (SAR) · Selected Acquisition Report-SAR 14. ABSTRACT 15. ... Selected...

Selected Acquisition Report (SAR)
RCS: DD-A&T(Q&A)823-334
P-8A Poseidon Multi-Mission Maritime Aircraft (P-8A)As of FY 2015 President's Budget
Defense Acquisition Management Information Retrieval
(DAMIR)
April 16, 2014 17:36:29 UNCLASSIFIED

Report Documentation Page Form ApprovedOMB No. 0704-0188
Public reporting burden for the collection of information is estimated to average 1 hour per response, including the time for reviewing instructions, searching existing data sources, gathering andmaintaining the data needed, and completing and reviewing the collection of information. Send comments regarding this burden estimate or any other aspect of this collection of information,including suggestions for reducing this burden, to Washington Headquarters Services, Directorate for Information Operations and Reports, 1215 Jefferson Davis Highway, Suite 1204, ArlingtonVA 22202-4302. Respondents should be aware that notwithstanding any other provision of law, no person shall be subject to a penalty for failing to comply with a collection of information if itdoes not display a currently valid OMB control number.
1. REPORT DATE DEC 2013 2. REPORT TYPE
3. DATES COVERED 00-00-2013 to 00-00-2013
4. TITLE AND SUBTITLE P-8A Poseidon Multi-Mission Maritime Aircraft (P-8A)
5a. CONTRACT NUMBER
5b. GRANT NUMBER
5c. PROGRAM ELEMENT NUMBER
6. AUTHOR(S) 5d. PROJECT NUMBER
5e. TASK NUMBER
5f. WORK UNIT NUMBER
7. PERFORMING ORGANIZATION NAME(S) AND ADDRESS(ES) Air Anti-Submarine Warfare, Assault and Special Mission,,PMA290,B2185, STE 3190, Unit 6,,22347 Cedar Point Rd,,Patuxent River,,MD,20670
8. PERFORMING ORGANIZATIONREPORT NUMBER
9. SPONSORING/MONITORING AGENCY NAME(S) AND ADDRESS(ES) 10. SPONSOR/MONITOR’S ACRONYM(S)
11. SPONSOR/MONITOR’S REPORT NUMBER(S)
12. DISTRIBUTION/AVAILABILITY STATEMENT Approved for public release; distribution unlimited
13. SUPPLEMENTARY NOTES Selected Acquisition Report-SAR
14. ABSTRACT
15. SUBJECT TERMS
16. SECURITY CLASSIFICATION OF: 17. LIMITATION OF ABSTRACT Same as
Report (SAR)
18. NUMBEROF PAGES
38
19a. NAME OFRESPONSIBLE PERSON
a. REPORT unclassified
b. ABSTRACT unclassified
c. THIS PAGE unclassified
Standard Form 298 (Rev. 8-98) Prescribed by ANSI Std Z39-18

P-8A December 2013 SAR
April 16, 2014 17:36:29 UNCLASSIFIED 2
Table of Contents
Common Acronyms and Abbreviations 3Program Information 4Responsible Office 4References 4Mission and Description 5Executive Summary 6Threshold Breaches 7Schedule 8Performance 9Track to Budget 11Cost and Funding 13Low Rate Initial Production 22Foreign Military Sales 23Nuclear Costs 23Unit Cost 24Cost Variance 27Contracts 31Deliveries and Expenditures 34Operating and Support Cost 35

Common Acronyms and Abbreviations
Acq O&M - Acquisition-Related Operations and MaintenanceAPB - Acquisition Program BaselineAPPN - AppropriationAPUC - Average Procurement Unit CostBA - Budget Authority/Budget ActivityBY - Base YearDAMIR - Defense Acquisition Management Information RetrievalDev Est - Development EstimateDoD - Department of DefenseDSN - Defense Switched NetworkEcon - EconomicEng - EngineeringEst - EstimatingFMS - Foreign Military SalesFY - Fiscal YearIOC - Initial Operational Capability$K - Thousands of DollarsLRIP - Low Rate Initial Production$M - Millions of DollarsMILCON - Military ConstructionN/A - Not ApplicableO&S - Operating and SupportOth - OtherPAUC - Program Acquisition Unit CostPB - President’s BudgetPE - Program ElementProc - ProcurementProd Est - Production EstimateQR - Quantity RelatedQty - QuantityRDT&E - Research, Development, Test, and EvaluationSAR - Selected Acquisition ReportSch - ScheduleSpt - SupportTBD - To Be DeterminedTY - Then YearUCR - Unit Cost Reporting
P-8A December 2013 SAR
April 16, 2014 17:36:29 UNCLASSIFIED 3
Program Information
Responsible Office
References
Program Name P-8A Poseidon Multi-Mission Maritime Aircraft (P-8A)
DoD Component Navy
Responsible OfficeCAPT Scott Dillon Air Anti-Submarine Warfare, Assault and Special Mission PMA290, B2185, STE 3190, Unit 6 22347 Cedar Point Rd Patuxent River, MD 20670-1161
Phone Fax DSN Phone DSN Fax
301-757-5703 301-757-5681 757-5703 757-5681
[email protected] Date Assigned May 29, 2012
SAR Baseline (Production Estimate)Defense Acquisition Executive (DAE) Approved Acquisition Progam Baseline (APB) dated October 22, 2010 Approved APBDefense Acquisition Executive (DAE) Approved Acquisition Program Baseline (APB) dated February 5, 2014
P-8A December 2013 SAR
April 16, 2014 17:36:29 UNCLASSIFIED 4

Mission and Description The P-8A Poseidon Multi-mission Maritime Aircraft (P-8A), is based on the 737-800 ERX developed by The Boeing Company. The management of the contracted effort is located at The Boeing Company in Seattle, Washington. The system requirements are based on the P-8A Capability Production Document #791-88-09, validated and approved on June 22, 2009. P-8A is the replacement system for the P-3C, Orion. The P-8A system will sustain and improve the armed maritime and littoral Intelligence, Surveillance, and Reconnaissance capabilities for United States Naval forces in traditional, joint and combined roles to counter changing and emerging threats. The P-8A program is structured on an evolutionary systems replacement approach that aligns the processes employed for requirements definition, acquisition strategy, and system development into a dynamic and flexible means to attain the strategic vision for tomorrow's Naval forces. The P-8A is part of the Maritime Patrol and Reconnaissance Force Family of Systems that also includes the MQ-4C Triton Unmanned Aircraft System, the EP-3, and the Tactical Operations Center. The primary roles of P-8A are persistent Anti-Submarine Warfare and Anti-Surface Warfare. The program will deliver the first increment of capability to the users in the quickest and most cost efficient manner.
P-8A December 2013 SAR
April 16, 2014 17:36:29 UNCLASSIFIED 5

Executive Summary The P-8A Poseidon has successfully achieved its most significant remaining System Development & Demonstration milestones, including completion of Initial Operational Test and Evaluation (IOT&E), achievement of Initial Operating Capability, commencement of first operational deployment and approval for Full Rate Production (FRP). Live Fire Test and Evaluation completed in February 2013. IOT&E completed in March 2013. The IOT&E report released by Commander, Operational Test Force in July 2013 rated the P-8A as operationally effective, operationally suitable, and recommended Fleet introduction. Integrated testing of deficiency corrections and of the Harpoon Anti-Surface Warfare weapon integration successfully completed in September 2013. The current fleet release software build is supporting successful, on-going fleet squadron transition training at Naval Air Station Jacksonville, Florida and operational deployment to Naval Air Facility Kadena, Japan. Increment 2 Engineering Change Proposal (ECP) 1 developmental flight testing completed in March 2014. Quick look reports on multiple Developmental Test flights over submarine indicated successful detect and localization on every event. Increment 2 ECP 2 Final Design Review completed in December 2013 and software development is on-track. Increment 2 ECP 3 proposal is currently under evaluation.
A change to the P-8A Acquisition Strategy to add a fourth lot of LRIP of thirteen aircraft in FY 2013 was approved July 15, 2013. The program received FRP approval on January 3, 2014 and awarded the FRP Lot I contract for sixteen aircraft on February 25, 2014. To date, five lots of LRIP/FRP aircraft, including fifty-three aircraft and associated trainers, spares and support equipment, are on contract with Boeing Defense Space and Security. The initial two lots of thirteen total LRIP aircraft were delivered to the fleet on or ahead of schedule. The remaining forty LRIP/FRP aircraft are on order and the program continues preparations for award of subsequent production lots. The program has continued to reduce unit costs for each aircraft production lot through effective negotiations with the prime contractor and through development and implementation of production process improvement initiatives.
There are two P-8A Memorandums of Understanding (MOU) in effect between the United States and Australia. The Increment 2 MOU, signed April 2009, authorizes Australian participation in P-8A Increment 2 development. The Production, Sustainment, and Follow-on Development MOU, signed March 2012, authorizes Australian procurement of Increment 2 capable P-8A aircraft, participation in development of common sustainment strategies for the life of the aircraft, and participation in development of new platform capabilities. There are no significant software-related issues with this program at this time.
P-8A December 2013 SAR
April 16, 2014 17:36:29 UNCLASSIFIED 6

Threshold Breaches
APB Breaches Schedule Performance Cost RDT&E
Procurement MILCON Acq O&M
O&S CostUnit Cost PAUC
APUC Nunn-McCurdy Breaches
Current UCR Baseline PAUC NoneAPUC None
Original UCR Baseline PAUC NoneAPUC None
P-8A December 2013 SAR
April 16, 2014 17:36:29 UNCLASSIFIED 7
Schedule
Milestones SAR Baseline Prod Est
Current APB Production
Objective/Threshold
Current Estimate
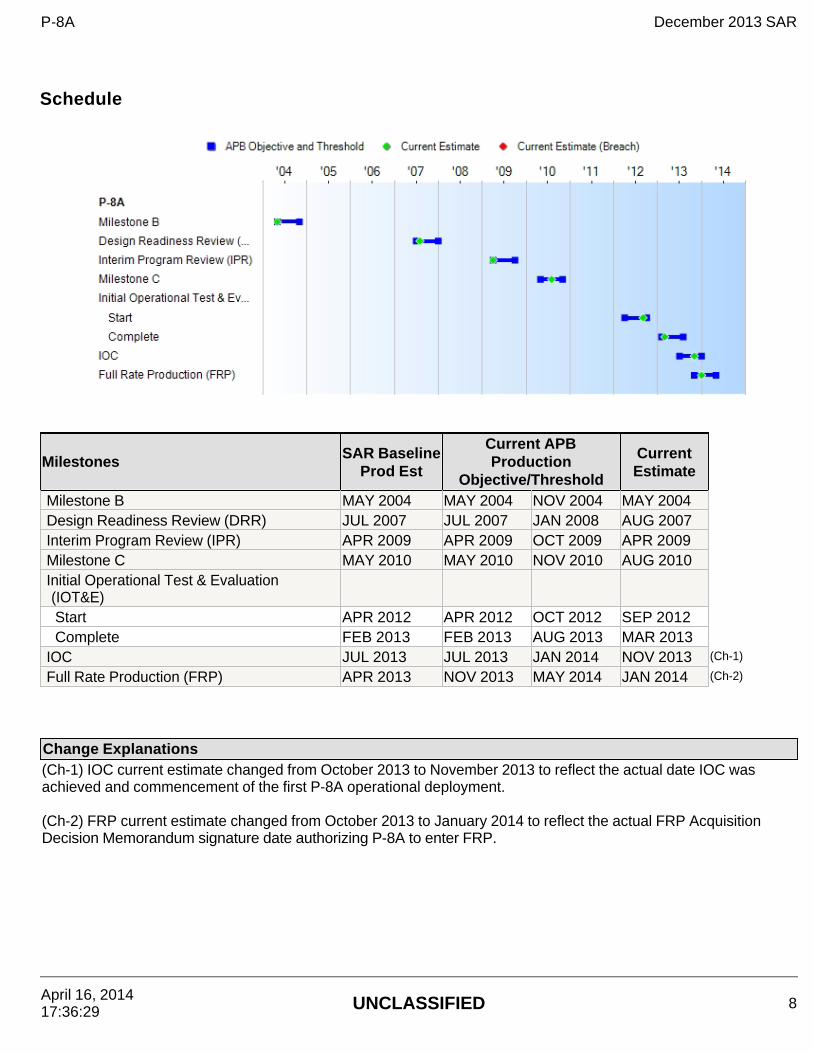
Milestone B MAY 2004 MAY 2004 NOV 2004 MAY 2004Design Readiness Review (DRR) JUL 2007 JUL 2007 JAN 2008 AUG 2007Interim Program Review (IPR) APR 2009 APR 2009 OCT 2009 APR 2009Milestone C MAY 2010 MAY 2010 NOV 2010 AUG 2010Initial Operational Test & Evaluation (IOT&E) Start APR 2012 APR 2012 OCT 2012 SEP 2012Complete FEB 2013 FEB 2013 AUG 2013 MAR 2013
IOC JUL 2013 JUL 2013 JAN 2014 NOV 2013 (Ch-1)
Full Rate Production (FRP) APR 2013 NOV 2013 MAY 2014 JAN 2014 (Ch-2)
Change Explanations (Ch-1) IOC current estimate changed from October 2013 to November 2013 to reflect the actual date IOC was achieved and commencement of the first P-8A operational deployment. (Ch-2) FRP current estimate changed from October 2013 to January 2014 to reflect the actual FRP Acquisition Decision Memorandum signature date authorizing P-8A to enter FRP.
P-8A December 2013 SAR
April 16, 2014 17:36:29 UNCLASSIFIED 8
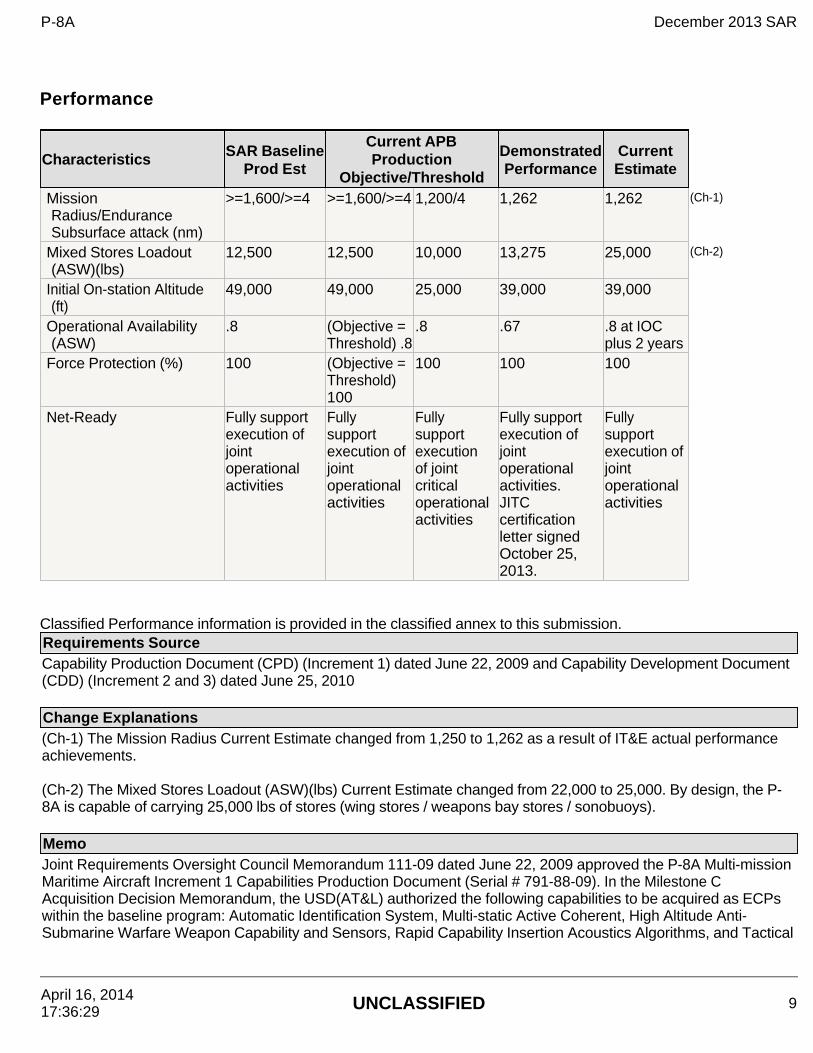
Performance
Classified Performance information is provided in the classified annex to this submission.
Characteristics SAR Baseline Prod Est
Current APB Production
Objective/Threshold
Demonstrated Performance
Current Estimate
Mission Radius/Endurance Subsurface attack (nm)
>=1,600/>=4 >=1,600/>=4 1,200/4 1,262 1,262 (Ch-1)
Mixed Stores Loadout (ASW)(lbs)
12,500 12,500 10,000 13,275 25,000 (Ch-2)
Initial On-station Altitude (ft)
49,000 49,000 25,000 39,000 39,000
Operational Availability (ASW)
.8 (Objective = Threshold) .8
.8 .67 .8 at IOC plus 2 years
Force Protection (%) 100 (Objective = Threshold) 100
100 100 100
Net-Ready Fully support execution of joint operational activities
Fully support execution of joint operational activities
Fully support execution of joint critical operational activities
Fully support execution of joint operational activities. JITC certification letter signed October 25, 2013.
Fully support execution of joint operational activities
Requirements Source Capability Production Document (CPD) (Increment 1) dated June 22, 2009 and Capability Development Document (CDD) (Increment 2 and 3) dated June 25, 2010
Change Explanations (Ch-1) The Mission Radius Current Estimate changed from 1,250 to 1,262 as a result of IT&E actual performance achievements. (Ch-2) The Mixed Stores Loadout (ASW)(lbs) Current Estimate changed from 22,000 to 25,000. By design, the P-8A is capable of carrying 25,000 lbs of stores (wing stores / weapons bay stores / sonobuoys). Memo Joint Requirements Oversight Council Memorandum 111-09 dated June 22, 2009 approved the P-8A Multi-mission Maritime Aircraft Increment 1 Capabilities Production Document (Serial # 791-88-09). In the Milestone C Acquisition Decision Memorandum, the USD(AT&L) authorized the following capabilities to be acquired as ECPs within the baseline program: Automatic Identification System, Multi-static Active Coherent, High Altitude Anti-Submarine Warfare Weapon Capability and Sensors, Rapid Capability Insertion Acoustics Algorithms, and Tactical
P-8A December 2013 SAR
April 16, 2014 17:36:29 UNCLASSIFIED 9
Operations Center updates. These ECPs provide additional capabilities beyond the P-8A Increment 1 capability and will be incorporated in-line with production or via retrofit.
Acronyms and Abbreviations ASW - Anti-Submarine Warfare CDD - Capability Development Document CPD - Capability Production Document ECP - Engineering Change Proposal ft - Feet IT&E - Integrated Test and Evaluation lbs - Pounds nm - Nautical miles USD (AT&L) - Under Secretary of Defense for Acquisition, Technology, and Logistics
P-8A December 2013 SAR
April 16, 2014 17:36:29 UNCLASSIFIED 10

Track to Budget General Memo The RDT&E cost parameters include the costs associated with Project Unit 2696 (Increment 1 System Development and Demonstration (SDD)) and Project Unit 3181 (Increment 2 next Phase of Capabilities (previously called Spiral One)). Project Unit 3181 capabilities will be integrated into the P-8A through Engineering Change Proposals (ECPs) as approved in the Milestone C (MS C) Acquisition Decision Memorandum dated August 27, 2010. These ECPs are: Automatic Identification System, Multi-static Active Coherent, High Altitude Anti-submarine Warfare Weapon Capability and Sensors, Rapid Capability Insertion Acoustics Algorithms, and Tactical Operations Center updates. Project Unit 3218 (P-8A Increment 3 (previously called Spiral Two)) was not included in the Acquisition Program Baseline cost parameters established at MS C and are excluded from the funding reported in this SAR. RDT&E
Appn BA PE Navy 1319 05 0605500N
Project Name
2696 P-8A Multi-mission Maritime Aircraft SDD
3181 P-8A Spiral One Development
Notes: P-8A Multi-mission Maritime Aircraft Increment 2 (formerly Spiral 1)
Procurement
Appn BA PE Navy 1506 01 0204251N
Line Item Name 019300 P-8A Poseidon
Navy 1506 06 0204251N Line Item Name 060500 Spares and Repair Parts MILCON
Appn BA PE Navy 1205 01 0212176N
Project Name P252 P-8A Hangar & Apron Expansion (Sunk) Notes: Naval Air Station Whidbey Island
P-8A December 2013 SAR
April 16, 2014 17:36:29 UNCLASSIFIED 11

P659 P-8 Training and Parking Apron Expansion (Sunk)
Notes: Naval Air Station Jacksonville Integrated Training Center
Navy 1205 01 0703676N Project Name P630 P-8/MMA Facilities Modification (Sunk)
Notes: Naval Air Station Jacksonville (Facilities Modifications)
P654 P-8A Hangar Upgrades (Sunk) Notes: Naval Air Station Jacksonville
Navy 1205 01 0712876N Project Name P655 P-8A Hangar & Training Facility Notes: Naval Air Station Sigonella P955 P-8A Hangar & Training Facility Notes: Naval Support Activity Bahrain
Navy 1205 01 0805376N Project Name
P146 MMA Test Facilities, Renovation & Modn (Sunk)
Notes: Multi-mission Maritime Hangar Test Facility Modifications Naval Air Station Patuxent River
P147 MMA Technical Supt Facs, Pax River MD (Sunk)
Notes: Multi-mission Maritime Hangar Test Facility Build Naval Air Station Patuxent River
Navy 1205 01 0805976N Project Name P623 MMA Simulator Training Building (Sunk)
Notes: Naval Air Station Jacksonville (Build of Integrated Training Center)
Navy 1205 01 0815976N Project Name P251 P-8A Hangar & Training Facility Notes: Naval Air Station Whidbey Island P624 P-8A Training Facility (Sunk) Notes: Naval Air Station Jacksonville
P-8A December 2013 SAR
April 16, 2014 17:36:29 UNCLASSIFIED 12
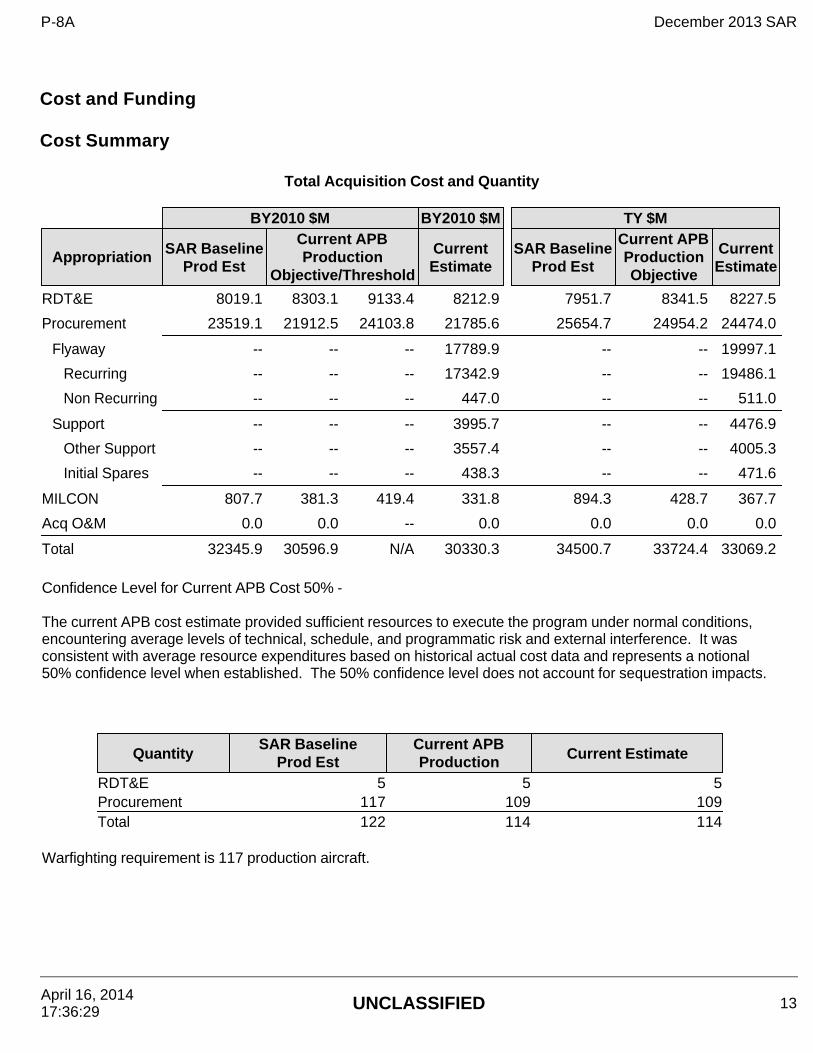
Cost and Funding Cost Summary
Total Acquisition Cost and Quantity
BY2010 $M BY2010 $M TY $M
Appropriation SAR Baseline Prod Est
Current APB Production
Objective/Threshold
Current Estimate
SAR Baseline Prod Est
Current APB Production Objective
Current Estimate
RDT&E 8019.1 8303.1 9133.4 8212.9 7951.7 8341.5 8227.5
Procurement 23519.1 21912.5 24103.8 21785.6 25654.7 24954.2 24474.0
Flyaway -- -- -- 17789.9 -- -- 19997.1
Recurring -- -- -- 17342.9 -- -- 19486.1
Non Recurring -- -- -- 447.0 -- -- 511.0
Support -- -- -- 3995.7 -- -- 4476.9
Other Support -- -- -- 3557.4 -- -- 4005.3
Initial Spares -- -- -- 438.3 -- -- 471.6
MILCON 807.7 381.3 419.4 331.8 894.3 428.7 367.7
Acq O&M 0.0 0.0 -- 0.0 0.0 0.0 0.0
Total 32345.9 30596.9 N/A 30330.3 34500.7 33724.4 33069.2 Confidence Level for Current APB Cost 50% - The current APB cost estimate provided sufficient resources to execute the program under normal conditions, encountering average levels of technical, schedule, and programmatic risk and external interference. It was consistent with average resource expenditures based on historical actual cost data and represents a notional 50% confidence level when established. The 50% confidence level does not account for sequestration impacts.
QuantitySAR Baseline
Prod EstCurrent APB Production Current Estimate
RDT&E 5 5 5Procurement 117 109 109Total 122 114 114
Warfighting requirement is 117 production aircraft.
P-8A December 2013 SAR
April 16, 2014 17:36:29 UNCLASSIFIED 13
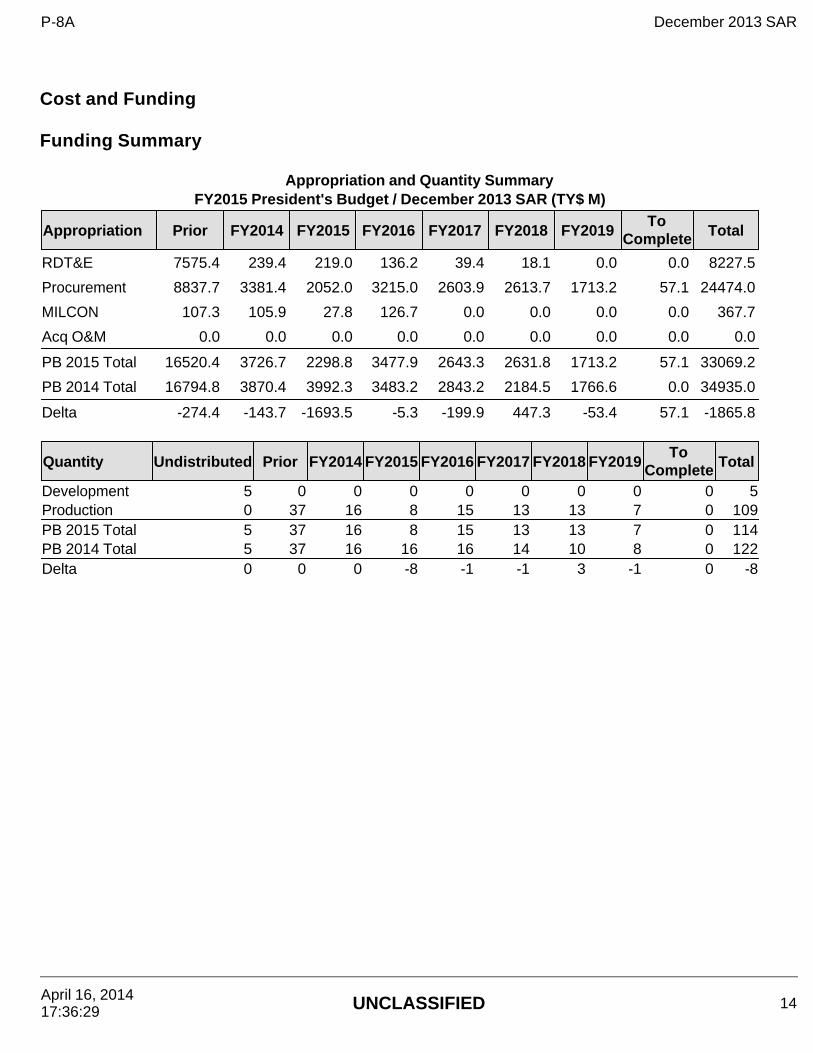
Cost and Funding Funding Summary
Appropriation and Quantity Summary FY2015 President's Budget / December 2013 SAR (TY$ M)
Appropriation Prior FY2014 FY2015 FY2016 FY2017 FY2018 FY2019To
Complete Total
RDT&E 7575.4 239.4 219.0 136.2 39.4 18.1 0.0 0.0 8227.5
Procurement 8837.7 3381.4 2052.0 3215.0 2603.9 2613.7 1713.2 57.1 24474.0
MILCON 107.3 105.9 27.8 126.7 0.0 0.0 0.0 0.0 367.7
Acq O&M 0.0 0.0 0.0 0.0 0.0 0.0 0.0 0.0 0.0
PB 2015 Total 16520.4 3726.7 2298.8 3477.9 2643.3 2631.8 1713.2 57.1 33069.2
PB 2014 Total 16794.8 3870.4 3992.3 3483.2 2843.2 2184.5 1766.6 0.0 34935.0
Delta -274.4 -143.7 -1693.5 -5.3 -199.9 447.3 -53.4 57.1 -1865.8
Quantity Undistributed Prior FY2014 FY2015 FY2016 FY2017 FY2018 FY2019To
Complete Total
Development 5 0 0 0 0 0 0 0 0 5Production 0 37 16 8 15 13 13 7 0 109PB 2015 Total 5 37 16 8 15 13 13 7 0 114PB 2014 Total 5 37 16 16 16 14 10 8 0 122Delta 0 0 0 -8 -1 -1 3 -1 0 -8
P-8A December 2013 SAR
April 16, 2014 17:36:29 UNCLASSIFIED 14

Cost and Funding Annual Funding By Appropriation
Annual Funding TY$ 1319 | RDT&E | Research, Development, Test, and Evaluation, Navy
Fiscal Year
Quantity
End Item Recurring Flyaway
TY $M
Non End Item
Recurring Flyaway
TY $M
Non Recurring Flyaway TY $M
Total Flyaway TY $M
Total Support TY $M
Total Program
TY $M
2002 -- -- -- -- -- -- 37.0
2003 -- -- -- -- -- -- 65.3
2004 -- -- -- -- -- -- 66.3
2005 -- -- -- -- -- -- 470.9
2006 -- -- -- -- -- -- 927.0
2007 -- -- -- -- -- -- 1100.0
2008 -- -- -- -- -- -- 860.0
2009 -- -- -- -- -- -- 1089.7
2010 -- -- -- -- -- -- 1125.5
2011 -- -- -- -- -- -- 893.6
2012 -- -- -- -- -- -- 581.4
2013 -- -- -- -- -- -- 358.7
2014 -- -- -- -- -- -- 239.4
2015 -- -- -- -- -- -- 219.0
2016 -- -- -- -- -- -- 136.2
2017 -- -- -- -- -- -- 39.4
2018 -- -- -- -- -- -- 18.1
Subtotal 5 -- -- -- -- -- 8227.5
P-8A December 2013 SAR
April 16, 2014 17:36:29 UNCLASSIFIED 15

Annual Funding BY$ 1319 | RDT&E | Research, Development, Test, and Evaluation, Navy
Fiscal Year
Quantity
End Item Recurring Flyaway
BY 2010 $M
Non End Item
Recurring Flyaway
BY 2010 $M
Non Recurring Flyaway
BY 2010 $M
Total Flyaway
BY 2010 $M
Total Support
BY 2010 $M
Total Program
BY 2010 $M
2002 -- -- -- -- -- -- 43.1
2003 -- -- -- -- -- -- 75.0
2004 -- -- -- -- -- -- 74.1
2005 -- -- -- -- -- -- 512.8
2006 -- -- -- -- -- -- 979.0
2007 -- -- -- -- -- -- 1134.0
2008 -- -- -- -- -- -- 870.7
2009 -- -- -- -- -- -- 1089.2
2010 -- -- -- -- -- -- 1108.4
2011 -- -- -- -- -- -- 859.0
2012 -- -- -- -- -- -- 549.3
2013 -- -- -- -- -- -- 333.6
2014 -- -- -- -- -- -- 218.9
2015 -- -- -- -- -- -- 196.6
2016 -- -- -- -- -- -- 119.9
2017 -- -- -- -- -- -- 34.0
2018 -- -- -- -- -- -- 15.3
Subtotal 5 -- -- -- -- -- 8212.9
P-8A December 2013 SAR
April 16, 2014 17:36:29 UNCLASSIFIED 16
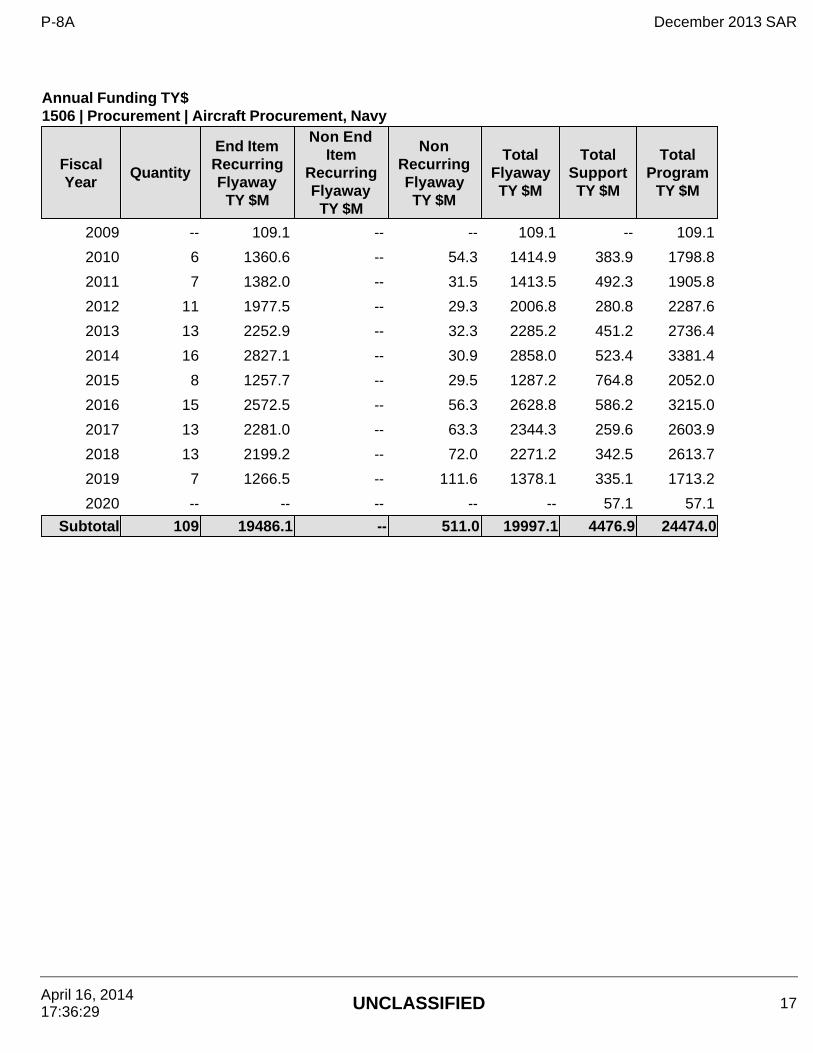
Annual Funding TY$ 1506 | Procurement | Aircraft Procurement, Navy
Fiscal Year
Quantity
End Item Recurring Flyaway
TY $M
Non End Item
Recurring Flyaway
TY $M
Non Recurring Flyaway TY $M
Total Flyaway TY $M
Total Support TY $M
Total Program
TY $M
2009 -- 109.1 -- -- 109.1 -- 109.1
2010 6 1360.6 -- 54.3 1414.9 383.9 1798.8
2011 7 1382.0 -- 31.5 1413.5 492.3 1905.8
2012 11 1977.5 -- 29.3 2006.8 280.8 2287.6
2013 13 2252.9 -- 32.3 2285.2 451.2 2736.4
2014 16 2827.1 -- 30.9 2858.0 523.4 3381.4
2015 8 1257.7 -- 29.5 1287.2 764.8 2052.0
2016 15 2572.5 -- 56.3 2628.8 586.2 3215.0
2017 13 2281.0 -- 63.3 2344.3 259.6 2603.9
2018 13 2199.2 -- 72.0 2271.2 342.5 2613.7
2019 7 1266.5 -- 111.6 1378.1 335.1 1713.2
2020 -- -- -- -- -- 57.1 57.1
Subtotal 109 19486.1 -- 511.0 19997.1 4476.9 24474.0
P-8A December 2013 SAR
April 16, 2014 17:36:29 UNCLASSIFIED 17
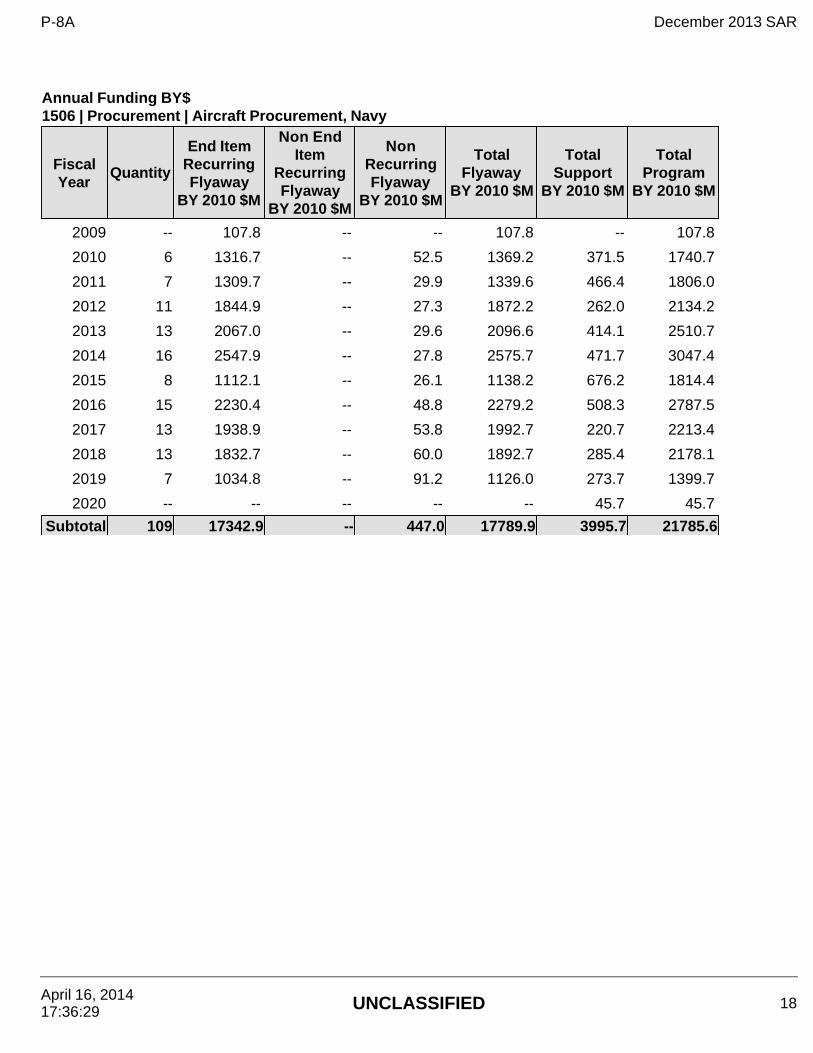
Annual Funding BY$ 1506 | Procurement | Aircraft Procurement, Navy
Fiscal Year
Quantity
End Item Recurring Flyaway
BY 2010 $M
Non End Item
Recurring Flyaway
BY 2010 $M
Non Recurring Flyaway
BY 2010 $M
Total Flyaway
BY 2010 $M
Total Support
BY 2010 $M
Total Program
BY 2010 $M
2009 -- 107.8 -- -- 107.8 -- 107.8
2010 6 1316.7 -- 52.5 1369.2 371.5 1740.7
2011 7 1309.7 -- 29.9 1339.6 466.4 1806.0
2012 11 1844.9 -- 27.3 1872.2 262.0 2134.2
2013 13 2067.0 -- 29.6 2096.6 414.1 2510.7
2014 16 2547.9 -- 27.8 2575.7 471.7 3047.4
2015 8 1112.1 -- 26.1 1138.2 676.2 1814.4
2016 15 2230.4 -- 48.8 2279.2 508.3 2787.5
2017 13 1938.9 -- 53.8 1992.7 220.7 2213.4
2018 13 1832.7 -- 60.0 1892.7 285.4 2178.1
2019 7 1034.8 -- 91.2 1126.0 273.7 1399.7
2020 -- -- -- -- -- 45.7 45.7
Subtotal 109 17342.9 -- 447.0 17789.9 3995.7 21785.6
P-8A December 2013 SAR
April 16, 2014 17:36:29 UNCLASSIFIED 18

Cost Quantity Information 1506 | Procurement | Aircraft Procurement, Navy
Fiscal Year Quantity
End Item Recurring Flyaway (Aligned
with Quantity) BY 2010
$M
2009 -- --
2010 6 1271.7
2011 7 1304.4
2012 11 1774.5
2013 13 2019.6
2014 16 2541.5
2015 8 1351.4
2016 15 2028.6
2017 13 1952.0
2018 13 1939.3
2019 7 1159.9
2020 -- --
Subtotal 109 17342.9
P-8A December 2013 SAR
April 16, 2014 17:36:29 UNCLASSIFIED 19

Annual Funding TY$ 1205 | MILCON | Military Construction, Navy and Marine Corps
Fiscal Year
Total Program
TY $M
2006 5.7
2007 16.3
2008 --
2009 48.2
2010 5.9
2011 --
2012 31.2
2013 --
2014 105.9
2015 27.8
2016 126.7
Subtotal 367.7
P-8A December 2013 SAR
April 16, 2014 17:36:29 UNCLASSIFIED 20

Annual Funding BY$ 1205 | MILCON | Military Construction, Navy and Marine Corps
Fiscal Year
Total Program
BY 2010 $M
2006 5.9
2007 16.6
2008 --
2009 47.5
2010 5.7
2011 --
2012 28.8
2013 --
2014 94.4
2015 24.3
2016 108.6
Subtotal 331.8
P-8A December 2013 SAR
April 16, 2014 17:36:29 UNCLASSIFIED 21

Low Rate Initial Production
The Current Total LRIP Quantity is more than 10% of the total production quantity due to the necessity to establish the initial production base and to achieve an orderly and efficient increase in both the production rate and industry workforce.
Initial LRIP Decision Current Total LRIP Approval Date 6/4/2004 7/15/2013 Approved Quantity 34 37 Reference Milestone B ADM LRIP Lot IV ADM Start Year 2010 2010 End Year 2012 2013
P-8A December 2013 SAR
April 16, 2014 17:36:29 UNCLASSIFIED 22
Nuclear Costs
Foreign Military Sales
None
None
P-8A December 2013 SAR
April 16, 2014 17:36:29 UNCLASSIFIED 23
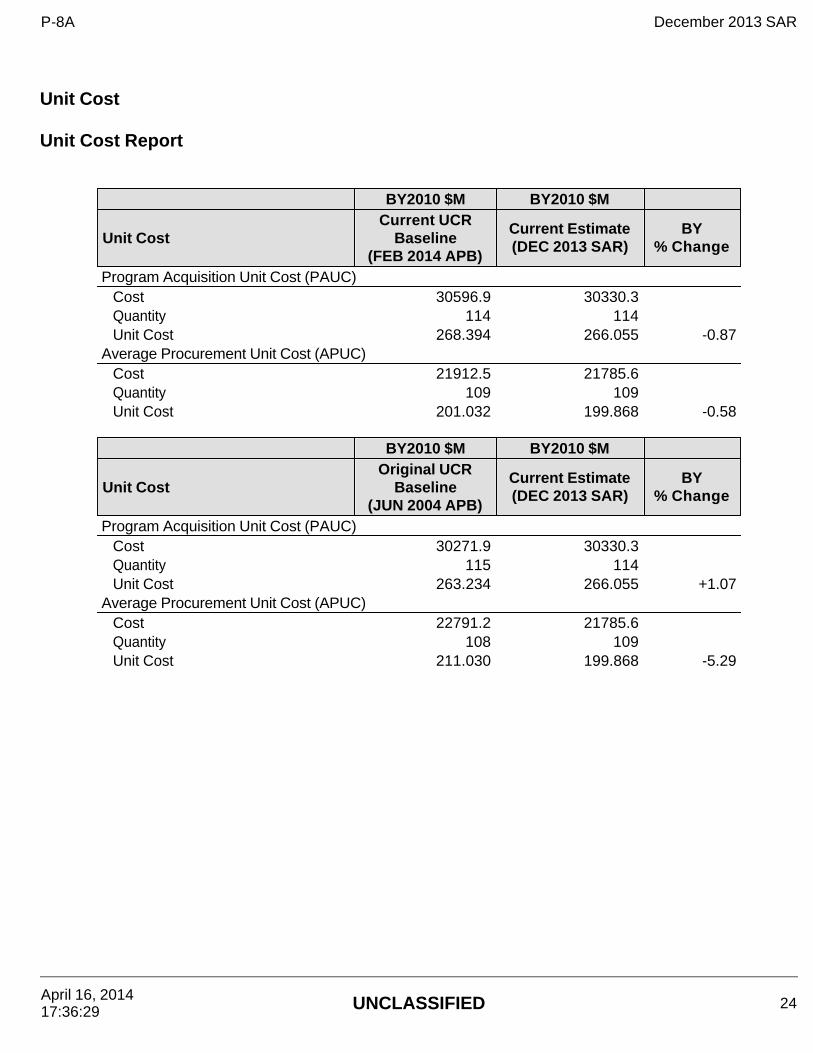
Unit Cost Unit Cost Report
BY2010 $M BY2010 $M
Unit Cost Current UCR
Baseline (FEB 2014 APB)
Current Estimate (DEC 2013 SAR)
BY % Change
Program Acquisition Unit Cost (PAUC) Cost 30596.9 30330.3Quantity 114 114Unit Cost 268.394 266.055 -0.87
Average Procurement Unit Cost (APUC) Cost 21912.5 21785.6Quantity 109 109Unit Cost 201.032 199.868 -0.58
BY2010 $M BY2010 $M
Unit Cost Original UCR
Baseline (JUN 2004 APB)
Current Estimate (DEC 2013 SAR)
BY % Change
Program Acquisition Unit Cost (PAUC) Cost 30271.9 30330.3Quantity 115 114Unit Cost 263.234 266.055 +1.07
Average Procurement Unit Cost (APUC) Cost 22791.2 21785.6Quantity 108 109Unit Cost 211.030 199.868 -5.29
P-8A December 2013 SAR
April 16, 2014 17:36:29 UNCLASSIFIED 24
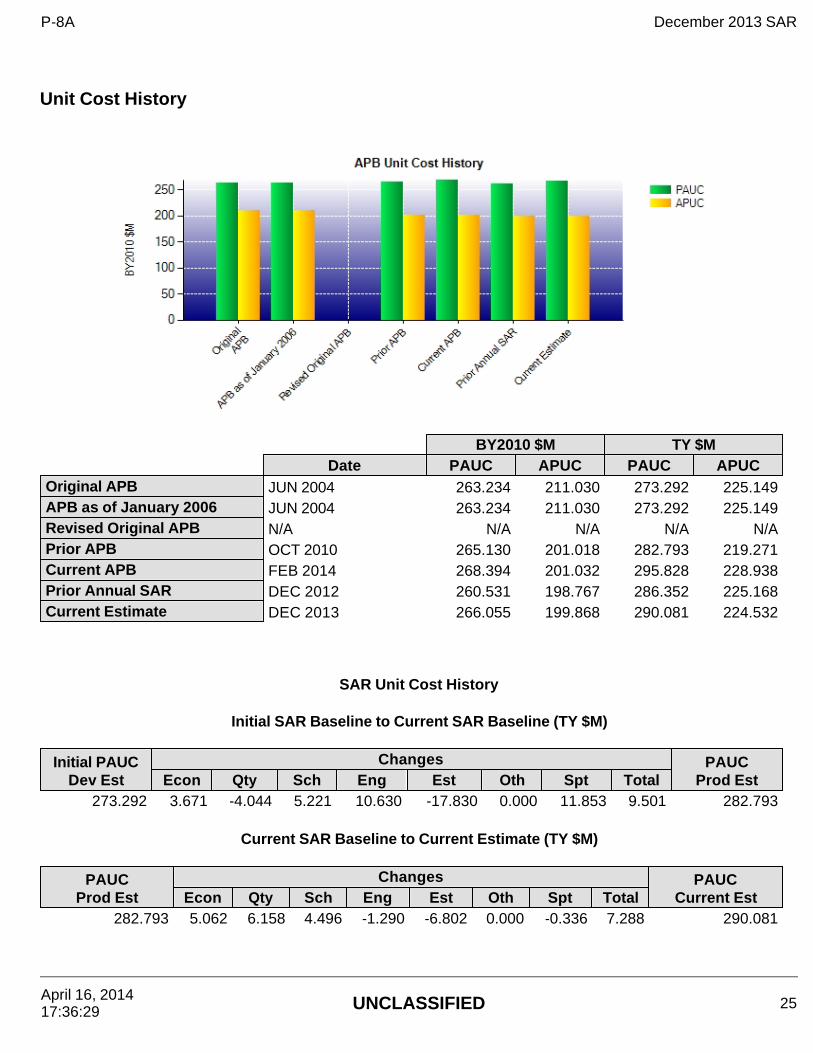
Unit Cost History
BY2010 $M TY $MDate PAUC APUC PAUC APUC
Original APB JUN 2004 263.234 211.030 273.292 225.149APB as of January 2006 JUN 2004 263.234 211.030 273.292 225.149Revised Original APB N/A N/A N/A N/A N/APrior APB OCT 2010 265.130 201.018 282.793 219.271Current APB FEB 2014 268.394 201.032 295.828 228.938Prior Annual SAR DEC 2012 260.531 198.767 286.352 225.168Current Estimate DEC 2013 266.055 199.868 290.081 224.532
SAR Unit Cost History
Initial SAR Baseline to Current SAR Baseline (TY $M)
Initial PAUC Dev Est
Changes PAUC Prod Est Econ Qty Sch Eng Est Oth Spt Total
273.292 3.671 -4.044 5.221 10.630 -17.830 0.000 11.853 9.501 282.793
Current SAR Baseline to Current Estimate (TY $M)
PAUC Prod Est
Changes PAUC Current Est Econ Qty Sch Eng Est Oth Spt Total
282.793 5.062 6.158 4.496 -1.290 -6.802 0.000 -0.336 7.288 290.081
P-8A December 2013 SAR
April 16, 2014 17:36:29 UNCLASSIFIED 25
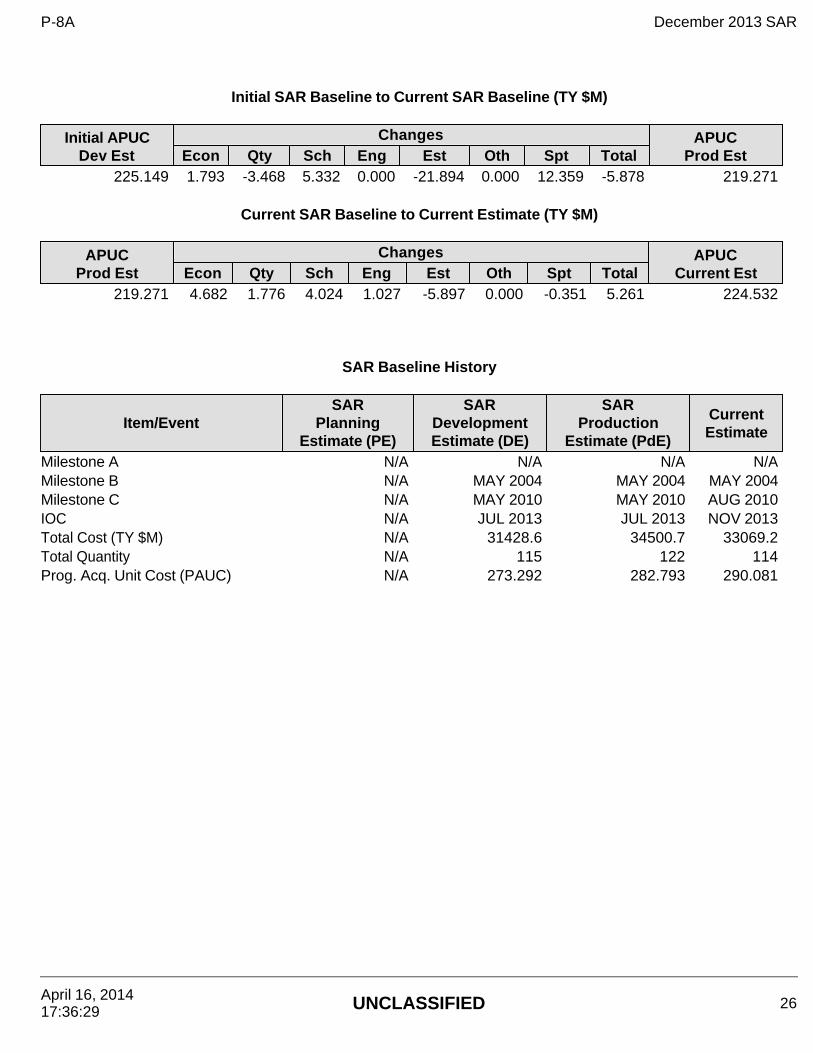
Initial SAR Baseline to Current SAR Baseline (TY $M)
Initial APUC Dev Est
Changes APUC Prod Est Econ Qty Sch Eng Est Oth Spt Total
225.149 1.793 -3.468 5.332 0.000 -21.894 0.000 12.359 -5.878 219.271
Current SAR Baseline to Current Estimate (TY $M)
APUC Prod Est
Changes APUC Current Est Econ Qty Sch Eng Est Oth Spt Total
219.271 4.682 1.776 4.024 1.027 -5.897 0.000 -0.351 5.261 224.532
SAR Baseline History
Item/Event SAR
Planning Estimate (PE)
SAR Development Estimate (DE)
SAR Production
Estimate (PdE)
Current Estimate
Milestone A N/A N/A N/A N/AMilestone B N/A MAY 2004 MAY 2004 MAY 2004Milestone C N/A MAY 2010 MAY 2010 AUG 2010IOC N/A JUL 2013 JUL 2013 NOV 2013Total Cost (TY $M) N/A 31428.6 34500.7 33069.2Total Quantity N/A 115 122 114Prog. Acq. Unit Cost (PAUC) N/A 273.292 282.793 290.081
P-8A December 2013 SAR
April 16, 2014 17:36:29 UNCLASSIFIED 26
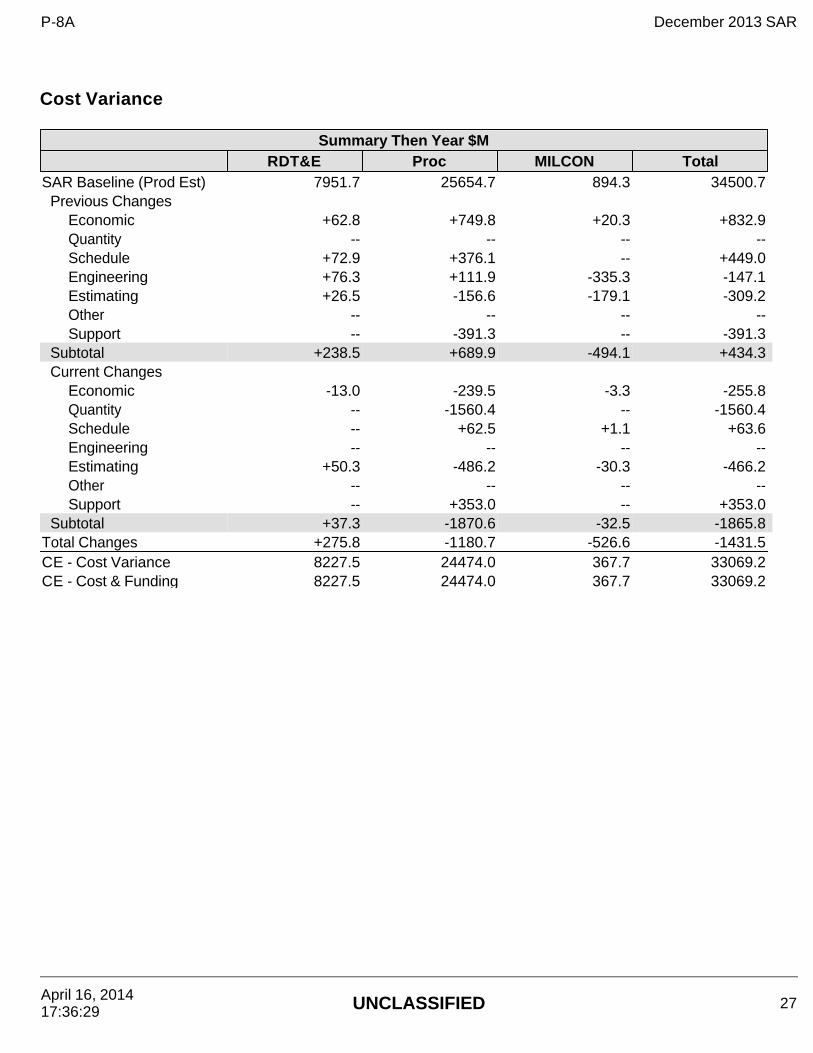
Cost Variance
Summary Then Year $MRDT&E Proc MILCON Total
SAR Baseline (Prod Est) 7951.7 25654.7 894.3 34500.7Previous Changes
Economic +62.8 +749.8 +20.3 +832.9Quantity -- -- -- --Schedule +72.9 +376.1 -- +449.0Engineering +76.3 +111.9 -335.3 -147.1Estimating +26.5 -156.6 -179.1 -309.2Other -- -- -- --Support -- -391.3 -- -391.3
Subtotal +238.5 +689.9 -494.1 +434.3Current Changes
Economic -13.0 -239.5 -3.3 -255.8Quantity -- -1560.4 -- -1560.4Schedule -- +62.5 +1.1 +63.6Engineering -- -- -- --Estimating +50.3 -486.2 -30.3 -466.2Other -- -- -- --Support -- +353.0 -- +353.0
Subtotal +37.3 -1870.6 -32.5 -1865.8Total Changes +275.8 -1180.7 -526.6 -1431.5CE - Cost Variance 8227.5 24474.0 367.7 33069.2CE - Cost & Funding 8227.5 24474.0 367.7 33069.2
P-8A December 2013 SAR
April 16, 2014 17:36:29 UNCLASSIFIED 27

Summary Base Year 2010 $MRDT&E Proc MILCON Total
SAR Baseline (Prod Est) 8019.1 23519.1 807.7 32345.9Previous Changes
Economic -- -- -- --Quantity -- -- -- --Schedule +68.1 +158.8 -- +226.9Engineering +68.4 +94.0 -295.6 -133.2Estimating +15.2 -114.0 -153.8 -252.6Other -- -- -- --Support -- -402.2 -- -402.2
Subtotal +151.7 -263.4 -449.4 -561.1Current Changes
Economic -- -- -- --Quantity -- -1276.4 -- -1276.4Schedule -- -52.7 -0.4 -53.1Engineering -- -- -- --Estimating +42.1 -423.3 -26.1 -407.3Other -- -- -- --Support -- +282.3 -- +282.3
Subtotal +42.1 -1470.1 -26.5 -1454.5Total Changes +193.8 -1733.5 -475.9 -2015.6CE - Cost Variance 8212.9 21785.6 331.8 30330.3CE - Cost & Funding 8212.9 21785.6 331.8 30330.3
Previous Estimate: December 2012
P-8A December 2013 SAR
April 16, 2014 17:36:29 UNCLASSIFIED 28

RDT&E $M
Current Change ExplanationsBase Year
Then Year
Revised escalation indices. (Economic) N/A -13.0Reduction in FY 2013 funding due to Sequestration Order thereby reducing System
Development & Demonstration Integrated Test Team staffing and storage of one test aircraft for four months. (Estimating)
-26.7 -28.6
Increase due to correction of high priority deficiencies. (Estimating) +78.6 +89.9Revised estimate to reflect prior year actuals. (Estimating) -10.3 -11.5Adjustment due to FY 2015 PB funding realignment. (Estimating) -11.6 -12.5Adjustment for current and prior escalation. (Estimating) +9.2 +9.8Revised estimate to reflect application of new outyear escalation indices. (Estimating) +2.9 +3.2
RDT&E Subtotal +42.1 +37.3
Procurement $M
Current Change ExplanationsBase Year
Then Year
Revised escalation indices. (Economic) N/A -239.5Quantity variance resulting from a decrease of eight aircraft from 117 to 109. (Quantity) -1226.9 -1501.7Additional Quantity Variance resulting from a decrease of eight aircraft from 117 to 109.
(Quantity) -49.5 -58.7
Schedule Variance resulting from rephasing aircraft (FY 2015 -8, FY 2016 -1, FY 2017 -1, FY 2018 +3, FY 2019 -1). (Schedule) 0.0 +121.7
Additional Schedule Variance resulting from rephasing aircraft in FY 2015-2019. (Schedule) -52.7 -59.2
Decrease in cost estimate due to change in estimating methodology for labor hours and rates and commercial aircraft pricing. (Estimating) -476.7 -548.0
Increase in cost estimate due to change in material estimating methodology for Contractor Furnished Equipment and Government Furnished Equipment. (Estimating) +8.9 +12.1
Increase in cost estimate due to change in estimating methodology for Ancillary equipment. (Estimating) +10.6 +13.6
Decrease in cost estimate due to benefit in business base created by the Royal Australian Air Force aircraft procurement. (Estimating) -161.1 -184.8
Adjustment for current and prior escalation. (Estimating) +78.1 +84.9Revised estimate to reflect the application of new outyear escalation indices.
(Estimating) +116.9 +136.0
Adjustment for current and prior escalation. (Support) +16.9 +18.5Increase in cost estimate for Other Support due to updated actuals and revised interim
support strategy. (Support) +224.4 +289.1
Increase in Initial Spares allocation. (Support) +41.0 +45.4Procurement Subtotal -1470.1 -1870.6
MILCON $M
Current Change ExplanationsBase Year
Then Year
P-8A December 2013 SAR
April 16, 2014 17:36:29 UNCLASSIFIED 29

Revised escalation indices. (Economic) N/A -3.3Increase due to Naval Air Station Whidbey Island new facility construction delay from FY
2015 to FY 2016. (Schedule) -0.4 +1.1
Adjustment for current and prior escalation. (Estimating) +1.2 +1.3Decrease in cost estimate for Bahrain facilities due to P-8A Hangar and Training
Facility estimate revisions. (Estimating) -4.0 -4.5
Decrease in cost estimate for Sigonella, Italy facilities due to P-8A Hangar and Training Facility estimate revisions. (Estimating) -1.5 -1.7
Decrease in cost estimate for Whidbey Island facilities due to P-8A Hangar and Apron Expansion estimate revisions. (Estimating) -23.5 -27.4
Revised estimate to reflect the application of new outyear escalation indices. (Estimating) +1.7 +2.0
MILCON Subtotal -26.5 -32.5
P-8A December 2013 SAR
April 16, 2014 17:36:29 UNCLASSIFIED 30
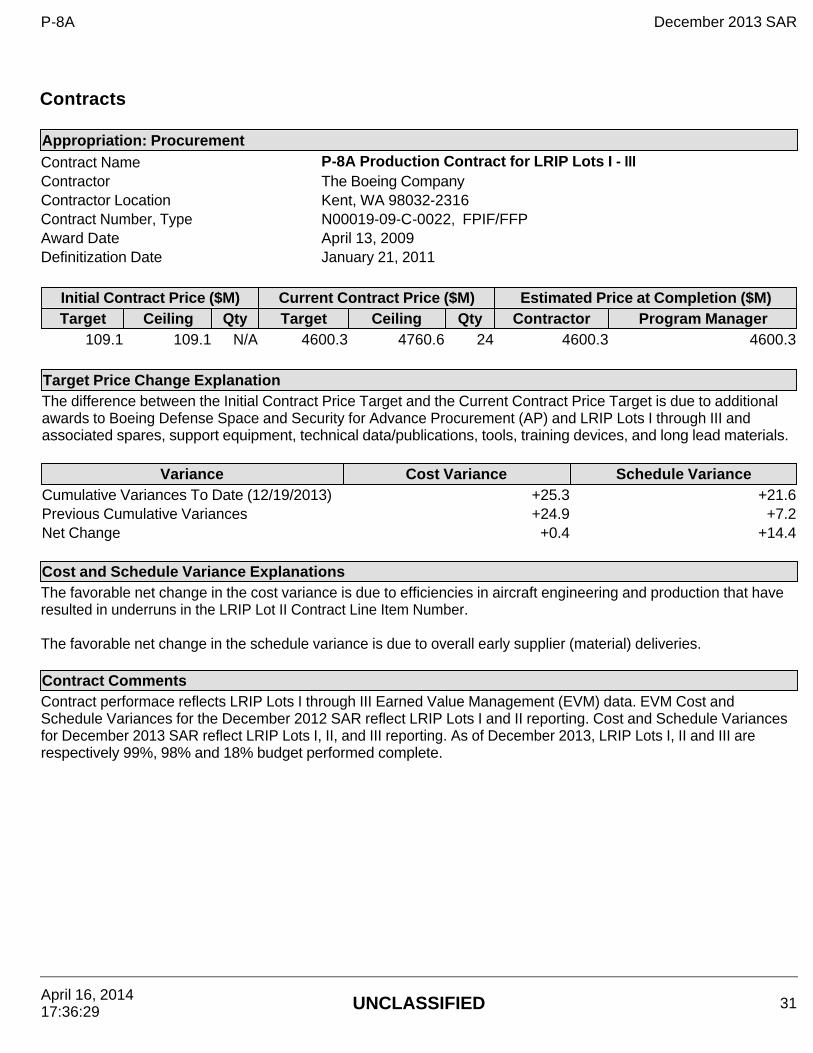
Contracts
Appropriation: Procurement Contract Name P-8A Production Contract for LRIP Lots I - III Contractor The Boeing Company Contractor Location Kent, WA 98032-2316 Contract Number, Type N00019-09-C-0022, FPIF/FFP Award Date April 13, 2009 Definitization Date January 21, 2011
Initial Contract Price ($M) Current Contract Price ($M) Estimated Price at Completion ($M) Target Ceiling Qty Target Ceiling Qty Contractor Program Manager
109.1 109.1 N/A 4600.3 4760.6 24 4600.3 4600.3
Target Price Change Explanation The difference between the Initial Contract Price Target and the Current Contract Price Target is due to additional awards to Boeing Defense Space and Security for Advance Procurement (AP) and LRIP Lots I through III and associated spares, support equipment, technical data/publications, tools, training devices, and long lead materials.
Variance Cost Variance Schedule Variance Cumulative Variances To Date (12/19/2013) +25.3 +21.6 Previous Cumulative Variances +24.9 +7.2 Net Change +0.4 +14.4
Cost and Schedule Variance Explanations The favorable net change in the cost variance is due to efficiencies in aircraft engineering and production that have resulted in underruns in the LRIP Lot II Contract Line Item Number. The favorable net change in the schedule variance is due to overall early supplier (material) deliveries.
Contract Comments Contract performace reflects LRIP Lots I through III Earned Value Management (EVM) data. EVM Cost and Schedule Variances for the December 2012 SAR reflect LRIP Lots I and II reporting. Cost and Schedule Variances for December 2013 SAR reflect LRIP Lots I, II, and III reporting. As of December 2013, LRIP Lots I, II and III are respectively 99%, 98% and 18% budget performed complete.
P-8A December 2013 SAR
April 16, 2014 17:36:29 UNCLASSIFIED 31

Appropriation: Procurement Contract Name P-8A Production Contract for LRIP Lot IV Contractor The Boeing Company Contractor Location Kent, WA 98032-2316 Contract Number, Type N00019-12-C-0112/0, FPIF/FFP Award Date August 31, 2012 Definitization Date July 31, 2013
Initial Contract Price ($M) Current Contract Price ($M) Estimated Price at Completion ($M) Target Ceiling Qty Target Ceiling Qty Contractor Program Manager
244.9 244.9 N/A 1928.2 1991.2 13 1928.2 1928.2 Target Price Change Explanation The difference between the Initial Contract Price Target and the Current Contract Price Target is due to additional awards to Boeing Defense Space and Security for Advance Procurement (AP) and LRIP Lot IV and associated spares, support equipment, technical data/publications, tools, training devices, and long lead materials.
Cost and Schedule Variance Explanations Cost and Schedule Variance reporting is not required on this FPIF/FFP contract.
General Contract Variance Explanation Cost and Schedule Variance reporting is not available at this time for the contract. LRIP Lot IV reporting will be provided in future SARs following completion of the LRIP Lot IV Integrated Baseline Review, planned in May 2014.
Contract Comments This is the first time this contract is being reported.
P-8A December 2013 SAR
April 16, 2014 17:36:29 UNCLASSIFIED 32
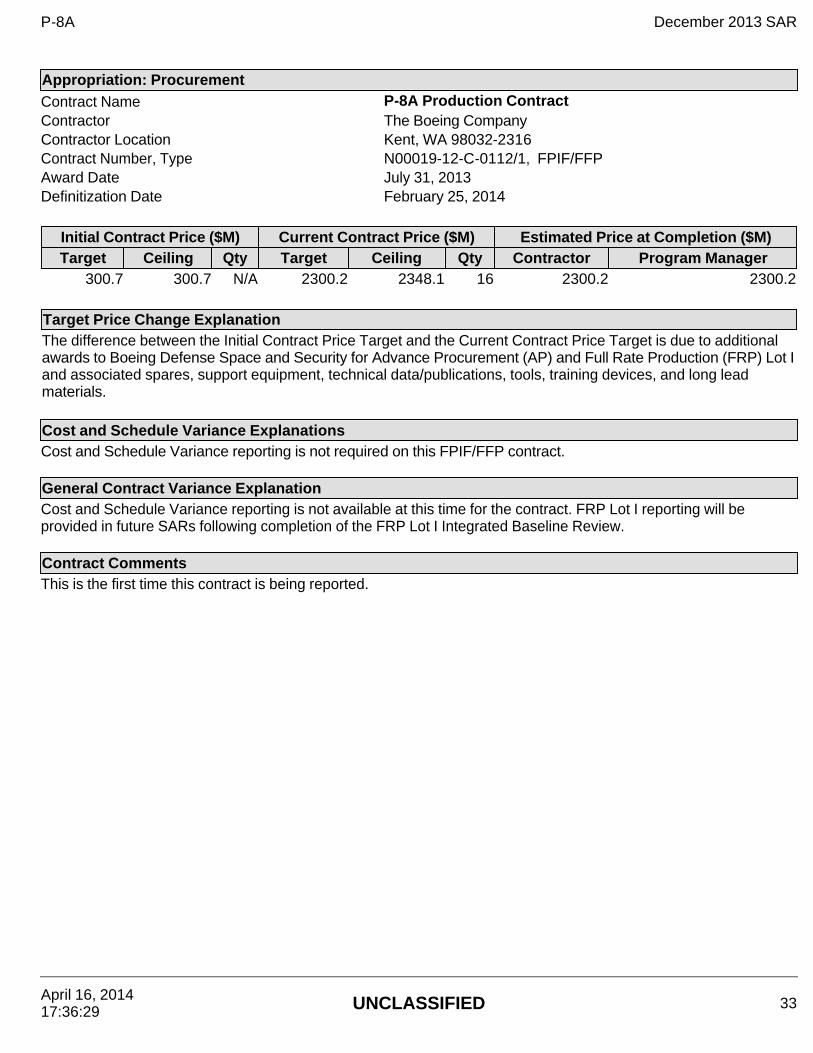
Appropriation: Procurement Contract Name P-8A Production Contract Contractor The Boeing Company Contractor Location Kent, WA 98032-2316 Contract Number, Type N00019-12-C-0112/1, FPIF/FFP Award Date July 31, 2013 Definitization Date February 25, 2014
Initial Contract Price ($M) Current Contract Price ($M) Estimated Price at Completion ($M) Target Ceiling Qty Target Ceiling Qty Contractor Program Manager
300.7 300.7 N/A 2300.2 2348.1 16 2300.2 2300.2 Target Price Change Explanation The difference between the Initial Contract Price Target and the Current Contract Price Target is due to additional awards to Boeing Defense Space and Security for Advance Procurement (AP) and Full Rate Production (FRP) Lot I and associated spares, support equipment, technical data/publications, tools, training devices, and long lead materials.
Cost and Schedule Variance Explanations Cost and Schedule Variance reporting is not required on this FPIF/FFP contract.
General Contract Variance Explanation Cost and Schedule Variance reporting is not available at this time for the contract. FRP Lot I reporting will be provided in future SARs following completion of the FRP Lot I Integrated Baseline Review.
Contract Comments This is the first time this contract is being reported.
P-8A December 2013 SAR
April 16, 2014 17:36:29 UNCLASSIFIED 33

Deliveries and Expenditures
The above data is current as of 3/21/2014. Although RDT&E deliveries commenced with the first flight test aircraft (airworthiness, T-1), it is not included in the Planned or Actual deliveries since it is not a fully configured end item. The RDT&E delivered quantities include: the second flight test aircraft (mission equipped, T-2); the third flight test aircraft (mission equipped for weapon separation testing, T-3); and T-4, T-5 and T-6, System Development and Demonstration Stage II production representative aircraft. The Fleet has taken delivery of thirteen total LRIP Lots I and II aircraft supporting initial Fleet transition training and operational deployment. All aircraft delivered early or on-time to contracted delivery dates. LRIP Lot III aircraft are on track to begin deliveries in June 2014.
Delivered to Date Plan to Date Actual to Date Total Quantity Percent
Delivered Development 5 5 5 100.00% Production 13 13 109 11.93% Total Program Quantity Delivered 18 18 114 15.79%
Expended and Appropriated (TY $M) Total Acquisition Cost 33069.2 Years Appropriated 13 Expended to Date 12558.0 Percent Years Appropriated 68.42% Percent Expended 37.97% Appropriated to Date 20247.1 Total Funding Years 19 Percent Appropriated 61.23%
P-8A December 2013 SAR
April 16, 2014 17:36:29 UNCLASSIFIED 34

Operating and Support Cost
P-8A Assumptions and Ground Rules Cost Estimate Reference: All costs were estimated in constant FY 2010 dollars, the BY of the estimate. The O&S estimate is dated November 12, 2013 and is based on the P-8A Full Rate Production Service Cost Position quantity profile.
Life cycle is 25 years. Aircraft quantities are: P-8A = 109 (Total Aircraft Inventory (TAI)) and 89 (Primary Authorized Aircraft (PAA) less test assets).
Flight hours per aircraft per year are: P-8A = 699. The calculation is based on summing the total operational flight hours and dividing by total operational aircraft. P-8A operations are based on: one Fleet Replacement Squadron (12 aircraft) and 12 Fleet squadrons (6-7 aircraft each). As a result of reducing P-8A procurement from 117 to 109 aircraft, the P-8A will have a seven six-aircraft and five seven-aircraft squadrons. Previous SAR submittals maintained the Program of Record of 12 seven-aircraft squadrons and a PAA of 96. Estimate duration: start year = 2012, end year = 2044, total years = 33. Estimate uses November 2009 Manpower Estimate Report (MER); MER requirement was adjusted to an authorized level, based on P-3C actual manpower by work center. Sustainment Strategy: P-8A O&S costs are based on limited 3-level maintenance. Antecedent Information: P-3C O&S costs are based on a 3-level maintenance system. P-3C data was pulled from the Aircraft Type Model Series Report of the Navy Visibility and Management of Operating and Support Costs database in August 2013 (BY 2010 dollar average for FY 2010 - FY 2012). Aircraft quantities: P-3C = 133 (TAI) and 125 (PAA) (P-3C Source: Aircraft Program Data file). Flight hours per aircraft per year are: P-3C = 550. The calculation is based on summing the total operational flight hours and dividing by total operational aircraft. The P-3C flight hours are artificially restricted due to Health of Naval Aviation decisions to manage P-3C operational service life.
Indirect support for P-3C was estimated based on a ratio of mission personnel and intermediate maintenance government labor. Indirect support calculation now a percentage of mission personnel equivalent to the P-8A calculation.
P-8A December 2013 SAR
April 16, 2014 17:36:29 UNCLASSIFIED 35

Unitized O&S Costs BY2010 $M
Cost ElementP-8A
Average Annual Cost Per Aircraft
P-3C (Antecedent) Average Annual Cost Per
AircraftUnit-Level Manpower 4.049 3.702Unit Operations 3.028 1.823Maintenance 4.775 2.876Sustaining Support 1.006 0.168Continuing System Improvements 0.998 2.342Indirect Support 1.747 1.384Other 0.000 0.000Total 15.603 12.295
Unitized Cost Comments: The dollars per aircraft are derived by taking the total O&S cost by element and dividing it by the total operating aircraft years (P-8A: 2,238 aircraft years). Total O&S Cost $M
Current Production APB
Objective/ThresholdCurrent Estimate
P-8A P-8A P-3C (Antecedent)Base Year 34917.5 38409.3 34917.5 27528.5Then Year 50434.9 N/A 50434.9 N/A
Total O&S Costs Comments: P-3C Total O&S Cost (BY 2010$) = P-3C Annual O&S Cost per Aircraft times P-8A Total Operating Aircraft Years.
The annual P-3C 3-year average (FY 2010 - FY 2012) sustainment cost is $1.64B (BY 2010) while the P-8A steady state sustainment cost is $1.34B (BY 2010) resulting in an annual cost avoidance of $.30B (BY 2010).
O&S Cost Variance
Category BY 2010 $M Change Explanations
Prior SAR Total O&S Est - Dec 2012 34,658.375
Cost Estimating Methodology +390.732 Increase for training expendables, P-3C squadron analogy.
Cost Data Update -1,295.517
Decrease for Airframe D-check complexity factor, Engine overhaul cost refinement, Naval Supply Systems Command Cost Recovery Rate/Burdening reduction, inflation adjustments and Indirect Support rates.
Labor Rate +723.720 Increase for Military Pay rates. Energy Rate +146.434 Increase Fuel $ / gal. rate (2012 rate).
Increase for engineering adjustment of the fuel consumption rate
P-8A December 2013 SAR
April 16, 2014 17:36:29 UNCLASSIFIED 36
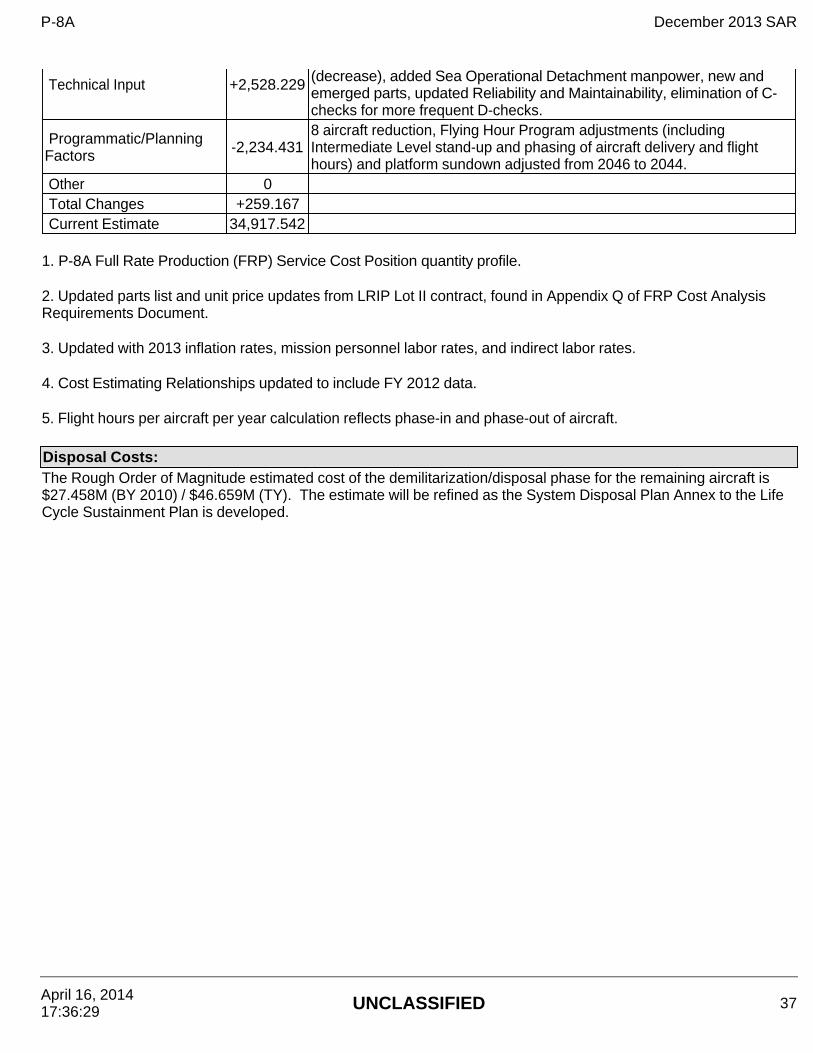
1. P-8A Full Rate Production (FRP) Service Cost Position quantity profile.
2. Updated parts list and unit price updates from LRIP Lot II contract, found in Appendix Q of FRP Cost Analysis Requirements Document.
3. Updated with 2013 inflation rates, mission personnel labor rates, and indirect labor rates.
4. Cost Estimating Relationships updated to include FY 2012 data.
5. Flight hours per aircraft per year calculation reflects phase-in and phase-out of aircraft.
Technical Input +2,528.229 (decrease), added Sea Operational Detachment manpower, new and emerged parts, updated Reliability and Maintainability, elimination of C-checks for more frequent D-checks.
Programmatic/Planning Factors -2,234.431
8 aircraft reduction, Flying Hour Program adjustments (including Intermediate Level stand-up and phasing of aircraft delivery and flight hours) and platform sundown adjusted from 2046 to 2044.
Other 0 Total Changes +259.167 Current Estimate 34,917.542
Disposal Costs: The Rough Order of Magnitude estimated cost of the demilitarization/disposal phase for the remaining aircraft is $27.458M (BY 2010) / $46.659M (TY). The estimate will be refined as the System Disposal Plan Annex to the Life Cycle Sustainment Plan is developed.
P-8A December 2013 SAR
April 16, 2014 17:36:29 UNCLASSIFIED 37