Seizing greenfield infrastructure opportunities in ASEAN · Seizing greenfield infrastructure...
44
Seizing greenfield infrastructure opportunities in ASEAN Infrastructure Series Report 2 www.pwc.com/sg
Transcript of Seizing greenfield infrastructure opportunities in ASEAN · Seizing greenfield infrastructure...
Seizing greenfield infrastructure opportunities in ASEAN Infrastructure Series Report 2
www.pwc.com/sg
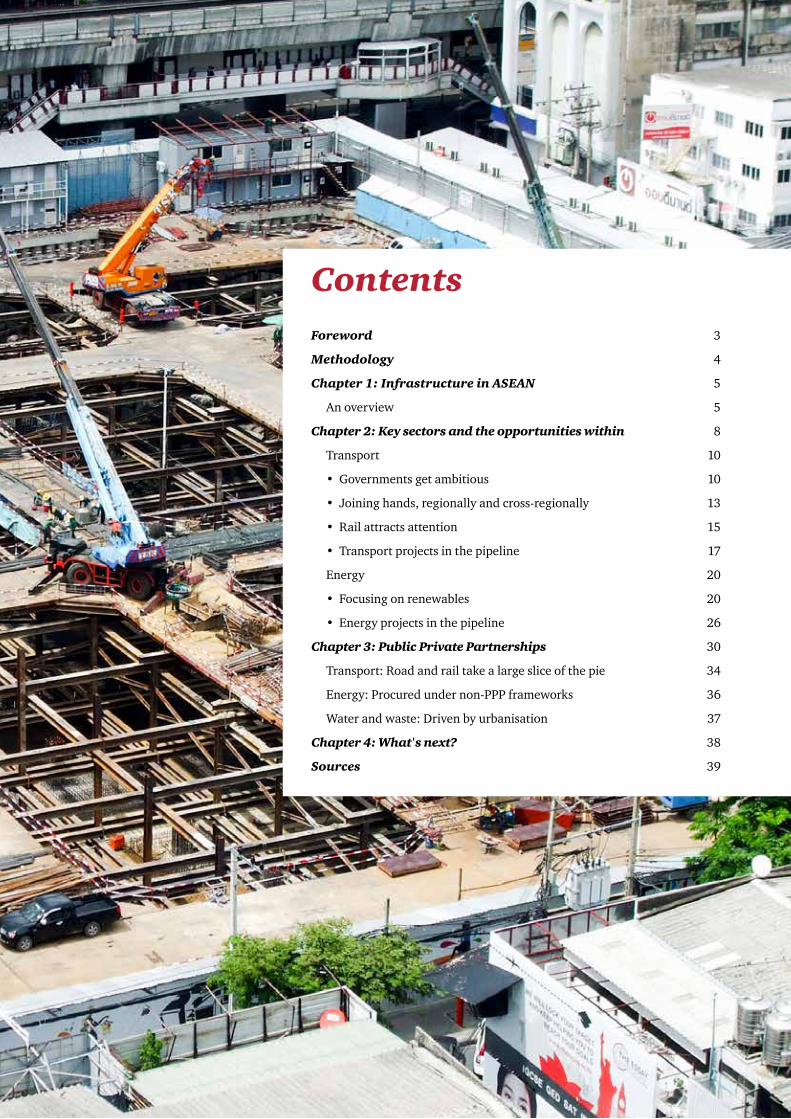
ContentsForeword 3
Methodology 4
Chapter 1: Infrastructure in ASEAN 5
An overview 5
Chapter 2: Key sectors and the opportunities within 8
Transport 10
• Governments get ambitious 10
• Joining hands, regionally and cross-regionally 13
• Rail attracts attention 15
• Transport projects in the pipeline 17
Energy 20
• Focusing on renewables 20
• Energy projects in the pipeline 26
Chapter 3: Public Private Partnerships 30
Transport: Road and rail take a large slice of the pie 34
Energy: Procured under non-PPP frameworks 36
Water and waste: Driven by urbanisation 37
Chapter 4: What's next? 38
Sources 39
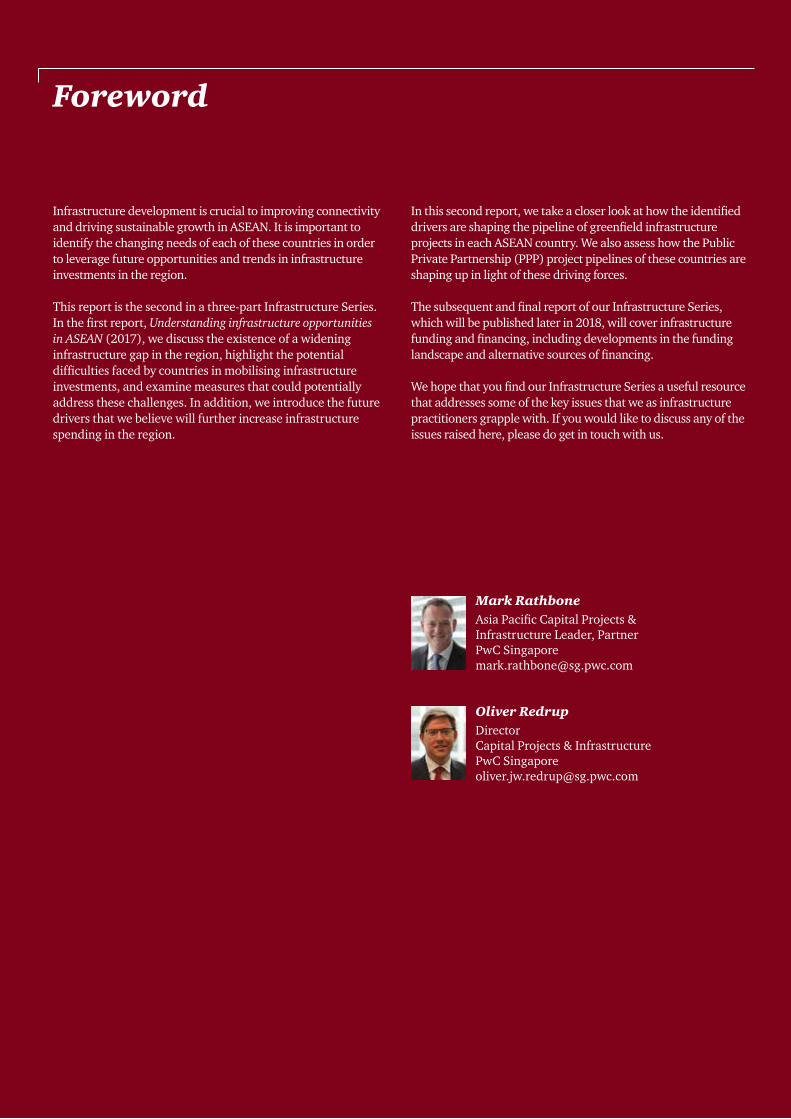
Foreword
Infrastructure development is crucial to improving connectivity and driving sustainable growth in ASEAN. It is important to identify the changing needs of each of these countries in order to leverage future opportunities and trends in infrastructure investments in the region.
This report is the second in a three-part Infrastructure Series. In the first report, Understanding infrastructure opportunities in ASEAN (2017), we discuss the existence of a widening infrastructure gap in the region, highlight the potential difficulties faced by countries in mobilising infrastructure investments, and examine measures that could potentially address these challenges. In addition, we introduce the future drivers that we believe will further increase infrastructure spending in the region.
In this second report, we take a closer look at how the identified drivers are shaping the pipeline of greenfield infrastructure projects in each ASEAN country. We also assess how the Public Private Partnership (PPP) project pipelines of these countries are shaping up in light of these driving forces.
The subsequent and final report of our Infrastructure Series, which will be published later in 2018, will cover infrastructure funding and financing, including developments in the funding landscape and alternative sources of financing.
We hope that you find our Infrastructure Series a useful resource that addresses some of the key issues that we as infrastructure practitioners grapple with. If you would like to discuss any of the issues raised here, please do get in touch with us.
Mark RathboneAsia Pacific Capital Projects & Infrastructure Leader, PartnerPwC [email protected]
Oliver RedrupDirectorCapital Projects & InfrastructurePwC [email protected]
Methodology
Our comments and analysis are based on data obtained from industry recognised sources. We also built on PwC’s significant research and findings included within the first report in this Infrastructure Series, Understanding infrastructure opportunities in ASEAN (2017). We supplemented these findings with independent research to provide a holistic view of the topic. Furthermore, we have
also included case studies and examples, where relevant, to illustrate the trends observed.
Lastly, we would like to highlight that as this report relies on third-party project databases such as Business Monitor International Research (BMI) and InfraPPP World, any assumptions that form the basis of the project databases do apply to this report as well.
4 | Infrastructure Series Report 2 | PwC
Chapter 1: Infrastructure in ASEAN
An overview
All economies in ASEAN have been focusing their efforts on increasing both private and public sector investments in infrastructure. However, the region’s rapid growth has outpaced its infrastructure development, which has resulted in a huge need for infrastructure investments.
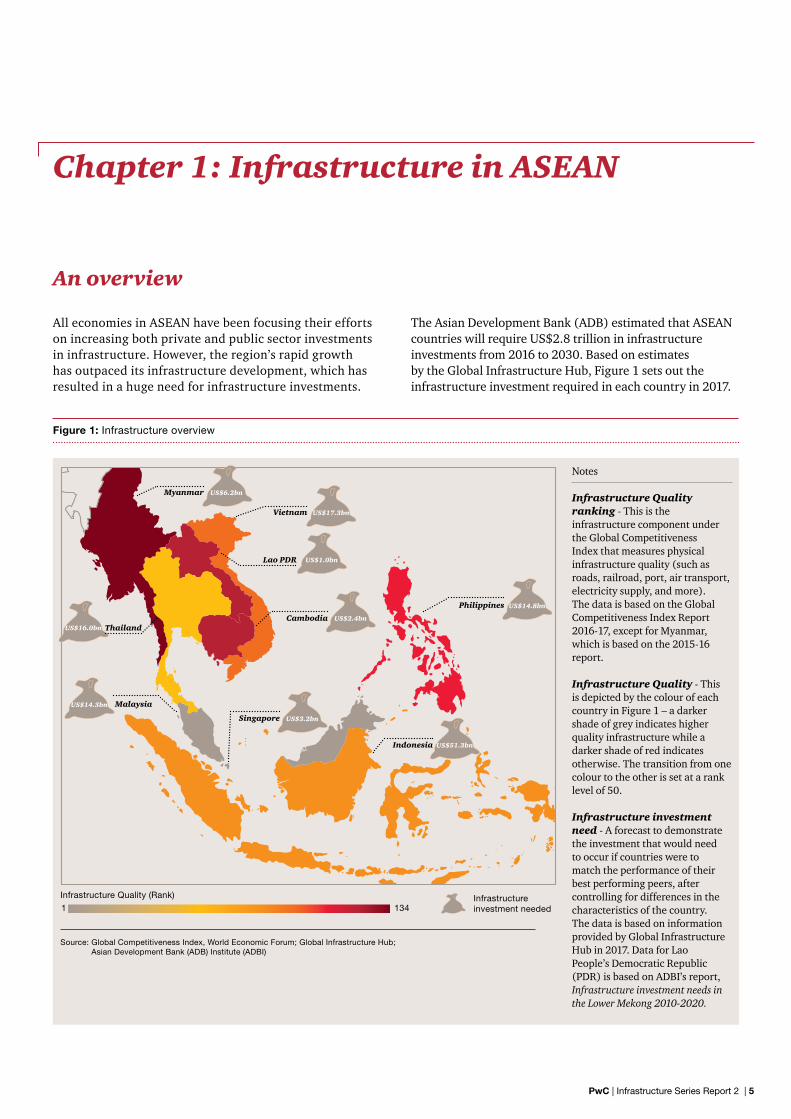
The Asian Development Bank (ADB) estimated that ASEAN countries will require US$2.8 trillion in infrastructure investments from 2016 to 2030. Based on estimates by the Global Infrastructure Hub, Figure 1 sets out the infrastructure investment required in each country in 2017.
Figure 1: Infrastructure overview
Notes
Infrastructure Quality ranking - This is the infrastructure component under the Global Competitiveness Index that measures physical infrastructure quality (such as roads, railroad, port, air transport, electricity supply, and more). The data is based on the Global Competitiveness Index Report 2016-17, except for Myanmar, which is based on the 2015-16 report.
Infrastructure Quality - This is depicted by the colour of each country in Figure 1 – a darker shade of grey indicates higher quality infrastructure while a darker shade of red indicates otherwise. The transition from one colour to the other is set at a rank level of 50.
Infrastructure investment need - A forecast to demonstrate the investment that would need to occur if countries were to match the performance of their best performing peers, after controlling for differences in the characteristics of the country. The data is based on information provided by Global Infrastructure Hub in 2017. Data for Lao People’s Democratic Republic (PDR) is based on ADBI’s report, Infrastructure investment needs in the Lower Mekong 2010-2020.
Source: Global Competitiveness Index, World Economic Forum; Global Infrastructure Hub; Asian Development Bank (ADB) Institute (ADBI)
Infrastructure investment needed
Infrastructure Quality (Rank)
1 134
Vietnam
Lao PDR
Philippines
Indonesia
Singapore
Malaysia
ThailandCambodia
US$6.2bn
US$17.3bn
US$1.0bn
US$2.4bn
US$14.8bn
US$51.3bn
US$3.2bn
US$14.3bn
US$16.0bn
Myanmar
PwC | Infrastructure Series Report 2 | 5
Driver Impact on infrastructure investment
Population change
Urbanisation ASEAN’s emerging economies are experiencing a very high rate of urbanisation, which is creating greater population density in cities and giving rise to issues such as congestion, electricity cuts and pollution. This, in turn, is leading to an increased demand for transport networks, utilities and waste management.
As cities grow, more investment needs to be made in efficient transport networks to reduce reliance on private vehicles. Utilities and public services also need investment to satisfy a growing number of urban residents and improved waste management facilities are required to deal with waste generated by inhabitants in a sustainable manner.
Demographic and social change, including ageing populations
Rising wealth, changing demographics and increasingly sophisticated lifestyles in ASEAN will fuel demand for more spending on social infrastructure. Capital will need to be allocated to develop education facilities, healthcare centres and urban governance services such as e-governance systems. Presently, social infrastructure spending sits lower on the investment agenda as countries focus on economic infrastructure to boost growth. However, there is clearly room for more investments in the social space and the need for investment in this sector is only likely to increase.
Increase in mobility, increased demand for transportation
Increasing prosperity leads to, among other things, a greater demand for car ownership. This in turn leads to congestion and economic inefficiencies if road networks are not expanded and/or improved. In addition to increased spending on road infrastructure, economies also need to invest heavily in other forms of transport infrastructure — commuter rail, high speed rail, and urban rail are necessary to allow for the effective movement of goods, raw materials, and people. Ports and airports remain a key part of transport networks in a geographically fractured region.
Geopolitical and environmental factors
Trade competitiveness
As countries become more engaged in global production networks, investing in infrastructure upgrades to facilitate trade bears greater significance. The quality of infrastructure within a country plays a major role in the trade costs incurred when engaging in trade, thus affecting the trade competitiveness of countries. ASEAN economies also share important trade links with one another. With increased demand for goods from consumers both within and beyond ASEAN, there would be a corresponding development of regional supply chains, leading to a need for infrastructure to improve connectivity within and between countries in the region. In addition to transport networks, infrastructure supporting access to, and transmission of, power would also be critical in facilitating economic production and trade.
Climate change and resource scarcity: the need for sustainable infrastructure
With rapid economic growth and its overarching impact on climate, there has been a corresponding global emphasis on sustainable development. This has contributed to the demand for sustainable infrastructure in the region. For instance, of the 17 Sustainable Development Goals (SDGs) adopted by world leaders during the September 2015 United Nations Sustainable Development Summit, Goal 7 speaks of ensuring “access to affordable, reliable, sustainable and modern energy for all”.
This has in turn created a demand for the generation of clean energy through solar farms, wind farms and hydropower plants.
Table 1: Summary of drivers of infrastructure spending
In the first report of this Infrastructure Series, we shared the drivers that we see contributing to increased infrastructure requirements in the region (Table 1).
6 | Infrastructure Series Report 2 | PwC
Shifts in global economic power
It is widely acknowledged that global economic power is shifting fast to the east. Economic powerhouses like China and Japan are proactively looking at expanding their footprint across the region and to further connect themselves with the global economy through government-to-government collaborations, as well as regional and cross-regional projects. A clear example of this is China’s Belt and Road Initiative (BRI). The emphasis is on improving global connectivity to bolster trade and this has resulted in funds flowing towards infrastructure assets, especially transport and power.
Disruption
Technological breakthroughs
Technological breakthroughs impact every industry. In the infrastructure sector, it transforms the way infrastructure is procured, built and operated, and has major implications on enablers throughout the lifecycle of infrastructure projects. One of the major trends that is likely to impact infrastructure in ASEAN is the rise of smart cities and grids.
Communication needs
Telecommunication capability is becoming increasingly important as businesses rely on their employees’ ability to talk to colleagues, customers and suppliers both on a global basis and in a timely manner. Cities and countries that can implement fast and reliable wired and wireless communication networks stand to gain a competitive advantage over their geographical neighbours. This has the dual benefit of increasing workforce productivity and attracting new companies to establish operations in a city or country.
These drivers were analysed in the first report of our Infrastructure Series where we discussed the state of play of the infrastructure sector in ASEAN. In this report, we will build on our earlier analysis to explore how the identified drivers have affected the pipeline of infrastructure projects in the region.
PwC | Infrastructure Series Report 2 | 7
Chapter 2: Key sectors and the opportunities within
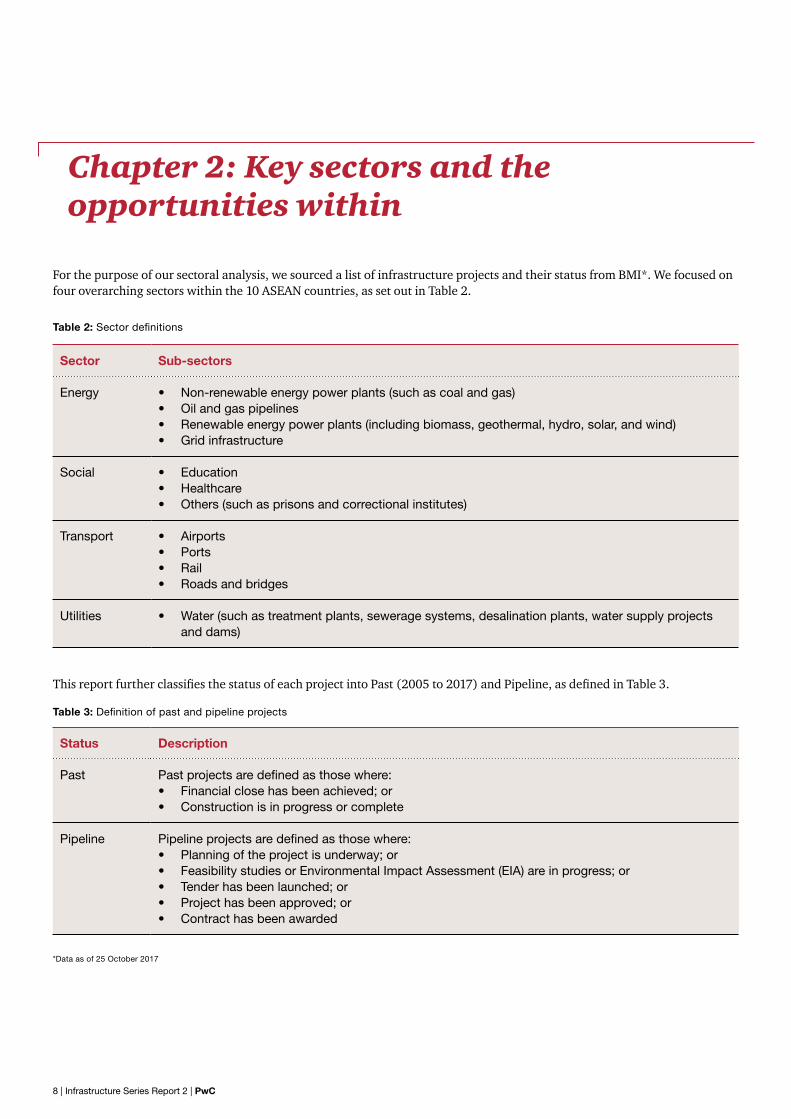
For the purpose of our sectoral analysis, we sourced a list of infrastructure projects and their status from BMI*. We focused on four overarching sectors within the 10 ASEAN countries, as set out in Table 2.
This report further classifies the status of each project into Past (2005 to 2017) and Pipeline, as defined in Table 3.
Table 2: Sector definitions
Table 3: Definition of past and pipeline projects
Sector Sub-sectors
Energy • Non-renewable energy power plants (such as coal and gas)• Oil and gas pipelines• Renewable energy power plants (including biomass, geothermal, hydro, solar, and wind)• Grid infrastructure
Social • Education• Healthcare• Others (such as prisons and correctional institutes)
Transport • Airports• Ports• Rail• Roads and bridges
Utilities • Water (such as treatment plants, sewerage systems, desalination plants, water supply projects and dams)
Status Description
Past Past projects are defined as those where:• Financial close has been achieved; or • Construction is in progress or complete
Pipeline Pipeline projects are defined as those where:• Planning of the project is underway; or• Feasibility studies or Environmental Impact Assessment (EIA) are in progress; or• Tender has been launched; or• Project has been approved; or• Contract has been awarded
*Data as of 25 October 2017
8 | Infrastructure Series Report 2 | PwC
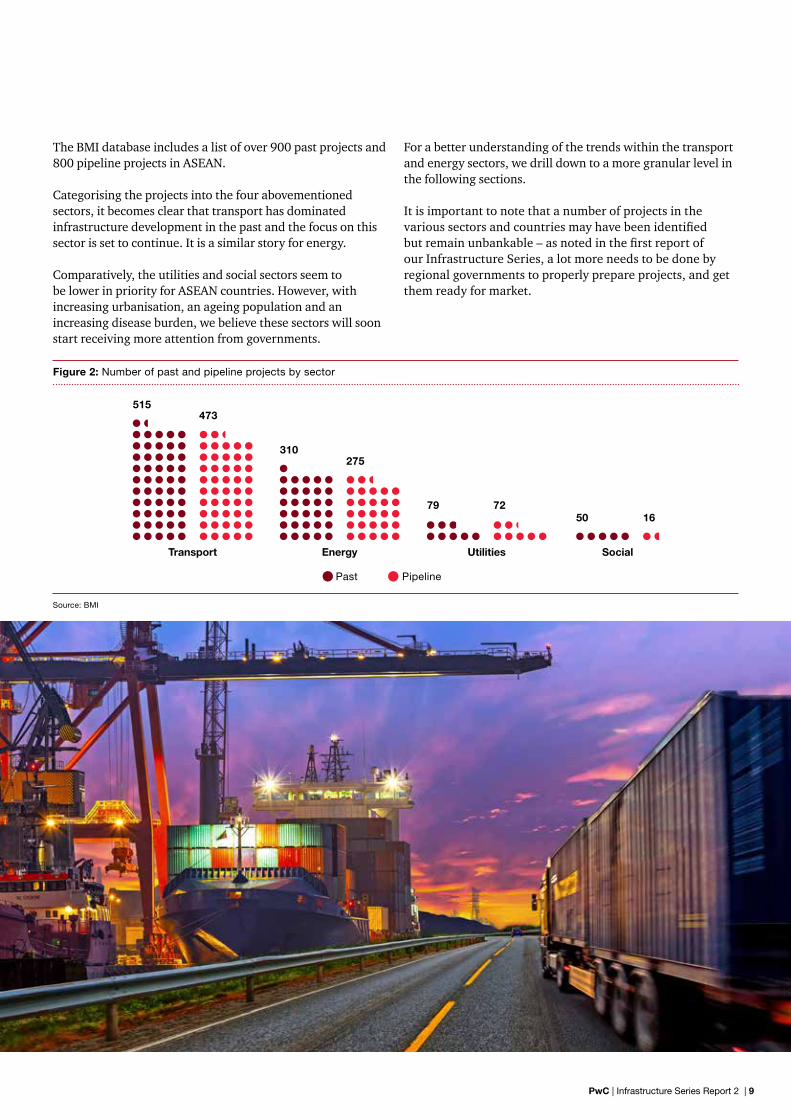
The BMI database includes a list of over 900 past projects and 800 pipeline projects in ASEAN.
Categorising the projects into the four abovementioned sectors, it becomes clear that transport has dominated infrastructure development in the past and the focus on this sector is set to continue. It is a similar story for energy.
Comparatively, the utilities and social sectors seem to be lower in priority for ASEAN countries. However, with increasing urbanisation, an ageing population and an increasing disease burden, we believe these sectors will soon start receiving more attention from governments.
For a better understanding of the trends within the transport and energy sectors, we drill down to a more granular level in the following sections.
It is important to note that a number of projects in the various sectors and countries may have been identified but remain unbankable – as noted in the first report of our Infrastructure Series, a lot more needs to be done by regional governments to properly prepare projects, and get them ready for market.
Figure 2: Number of past and pipeline projects by sector
Past Pipeline
UtilitiesEnergyTransport Social
79 72
310275
515473
50 16
Source: BMI
PwC | Infrastructure Series Report 2 | 9
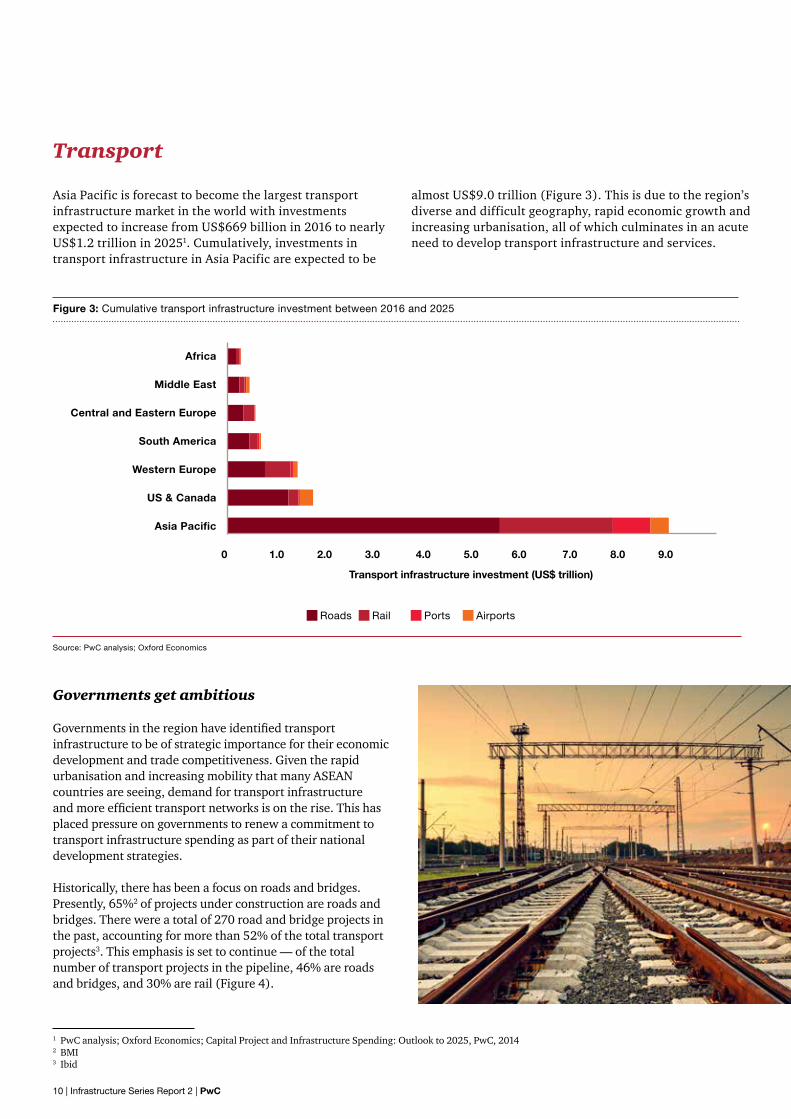
Transport
Asia Pacific is forecast to become the largest transport infrastructure market in the world with investments expected to increase from US$669 billion in 2016 to nearly US$1.2 trillion in 20251. Cumulatively, investments in transport infrastructure in Asia Pacific are expected to be
almost US$9.0 trillion (Figure 3). This is due to the region’s diverse and difficult geography, rapid economic growth and increasing urbanisation, all of which culminates in an acute need to develop transport infrastructure and services.
1 PwC analysis; Oxford Economics; Capital Project and Infrastructure Spending: Outlook to 2025, PwC, 20142 BMI3 Ibid
Africa
Middle East
Central and Eastern Europe
South America
Western Europe
US & Canada
Asia Pacific
0 1.0 2.0 3.0 4.0 5.0 6.0 7.0 8.0 9.0
Transport infrastructure investment (US$ trillion)
Roads Rail Ports Airports
Figure 3: Cumulative transport infrastructure investment between 2016 and 2025
Source: PwC analysis; Oxford Economics
Governments get ambitious
Governments in the region have identified transport infrastructure to be of strategic importance for their economic development and trade competitiveness. Given the rapid urbanisation and increasing mobility that many ASEAN countries are seeing, demand for transport infrastructure and more efficient transport networks is on the rise. This has placed pressure on governments to renew a commitment to transport infrastructure spending as part of their national development strategies.
Historically, there has been a focus on roads and bridges. Presently, 65%2 of projects under construction are roads and bridges. There were a total of 270 road and bridge projects in the past, accounting for more than 52% of the total transport projects3. This emphasis is set to continue — of the total number of transport projects in the pipeline, 46% are roads and bridges, and 30% are rail (Figure 4).
10 | Infrastructure Series Report 2 | PwC
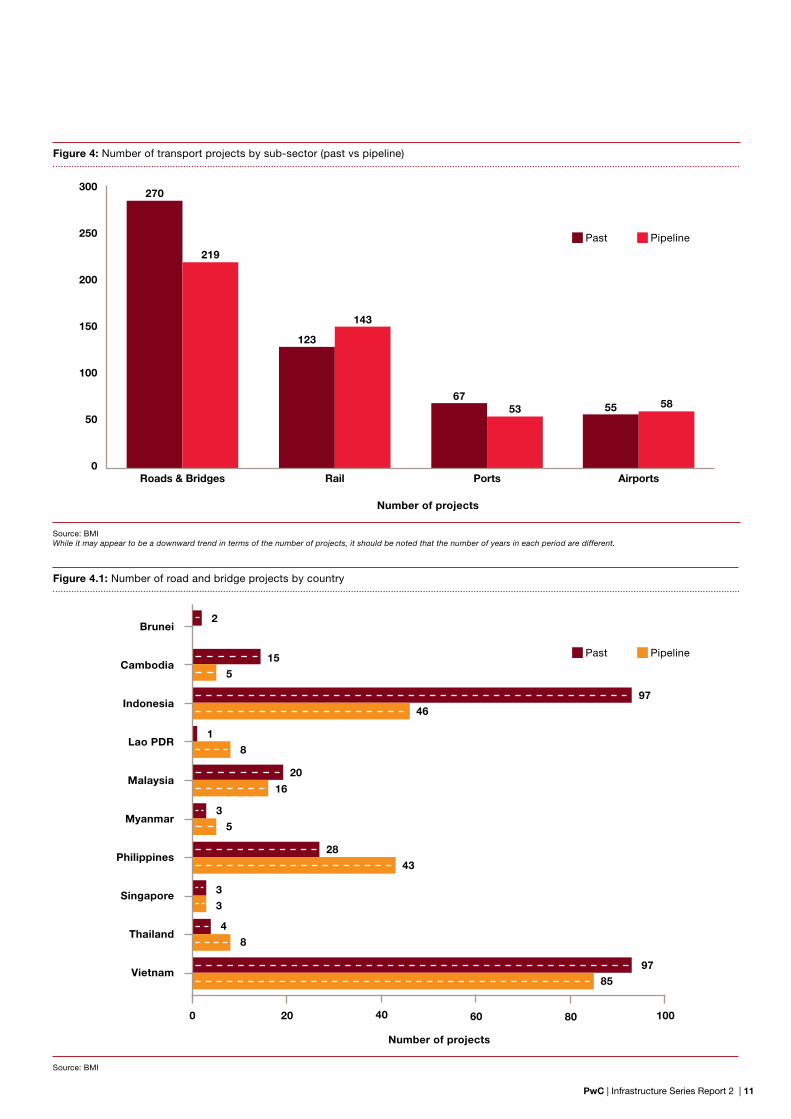
Figure 4: Number of transport projects by sub-sector (past vs pipeline)
Figure 4.1: Number of road and bridge projects by country
Source: BMIWhile it may appear to be a downward trend in terms of the number of projects, it should be noted that the number of years in each period are different.
Source: BMI
300
250
200
150
100
50
0Roads & Bridges Rail Ports Airports
Past Pipeline
Past Pipeline
0 6020 8040 100
Brunei
Cambodia
Indonesia
Lao PDR
Malaysia
Myanmar
Philippines
Singapore
Thailand
Vietnam97
85
4
3
8
3
28
3
5
20
16
1
8
43
9746
15
5
2
270
219
123
143
6753 55 58
Number of projects
Number of projects
PwC | Infrastructure Series Report 2 | 11
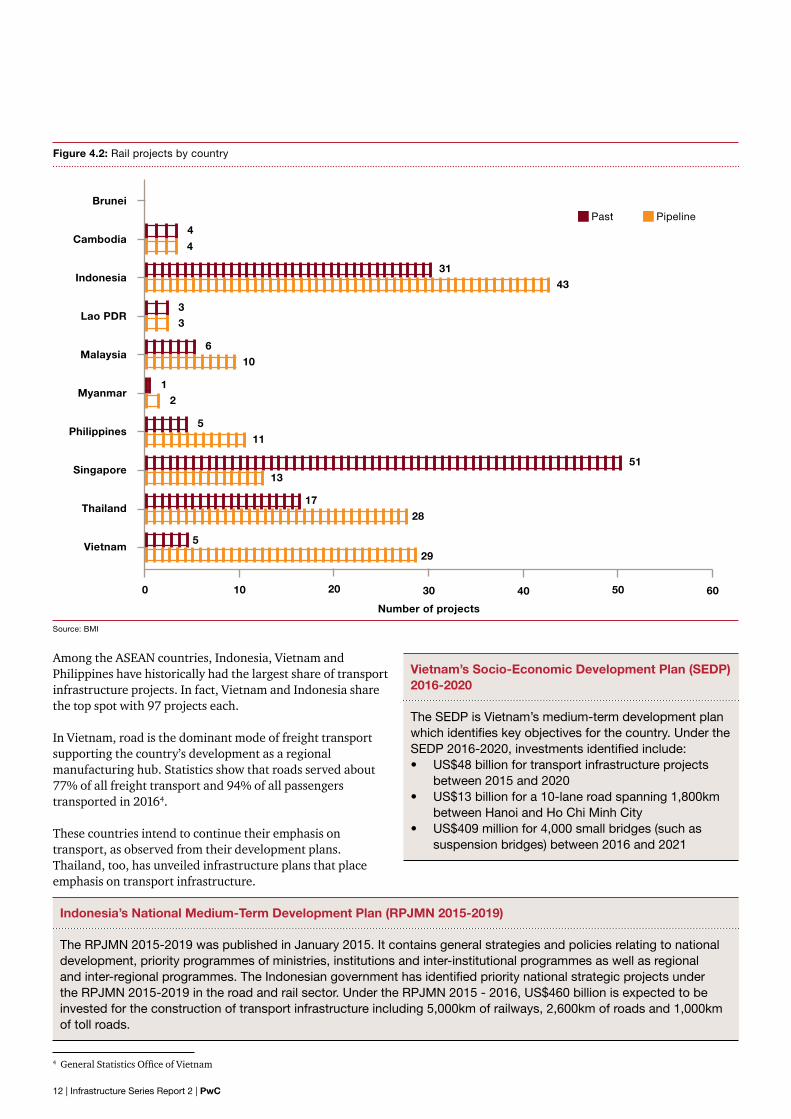
Figure 4.2: Rail projects by country
Source: BMI
Among the ASEAN countries, Indonesia, Vietnam and Philippines have historically had the largest share of transport infrastructure projects. In fact, Vietnam and Indonesia share the top spot with 97 projects each.
In Vietnam, road is the dominant mode of freight transport supporting the country’s development as a regional manufacturing hub. Statistics show that roads served about 77% of all freight transport and 94% of all passengers transported in 20164.
These countries intend to continue their emphasis on transport, as observed from their development plans. Thailand, too, has unveiled infrastructure plans that place emphasis on transport infrastructure.
4 General Statistics Office of Vietnam
Vietnam’s Socio-Economic Development Plan (SEDP) 2016-2020
The SEDP is Vietnam’s medium-term development plan which identifies key objectives for the country. Under the SEDP 2016-2020, investments identified include:• US$48 billion for transport infrastructure projects
between 2015 and 2020• US$13 billion for a 10-lane road spanning 1,800km
between Hanoi and Ho Chi Minh City• US$409 million for 4,000 small bridges (such as
suspension bridges) between 2016 and 2021
Indonesia’s National Medium-Term Development Plan (RPJMN 2015-2019)
The RPJMN 2015-2019 was published in January 2015. It contains general strategies and policies relating to national development, priority programmes of ministries, institutions and inter-institutional programmes as well as regional and inter-regional programmes. The Indonesian government has identified priority national strategic projects under the RPJMN 2015-2019 in the road and rail sector. Under the RPJMN 2015 - 2016, US$460 billion is expected to be invested for the construction of transport infrastructure including 5,000km of railways, 2,600km of roads and 1,000km of toll roads.
0 30 6010 4020 50
Brunei
Cambodia
Indonesia
Lao PDR
Malaysia
Myanmar
Philippines
Singapore
Thailand
Vietnam5
29
17
28
51
13
5
11
12
610
3
3
31
43
4
4
Past Pipeline
Number of projects
12 | Infrastructure Series Report 2 | PwC
Philippine Development Plan 2017-2022
The Philippine Development Plan 2017-2022 is the first medium-term development plan to be aligned with a long-term vision of attaining inclusive economic growth in the country and eventually transforming the Philippines into a knowledge economy through increased innovation.
One of the sectors identified by the government is transport infrastructure, including roads and bridges, ports, airports, vehicles, transport systems, and communication, and a US$71.8 billion development plan for the next five years was announced in 2017.
Thailand’s Transport Infrastructure Development Plan 2015 – 20225
Thailand’s transport plan aims to reduce the cost of logistics and transportation, which is expected to improve its economic competitiveness. The goal is to turn Thailand into a key logistics hub in the ASEAN Economic Community. The plan consists of five key programmes:
1. Inter-city rail network 2. Capacity enhancement for highway network to link key areas in the country and neighbouring countries 3. Public transportation network development plan for Bangkok Metropolitan Region4. Air transport capacity enhancement 5. Maritime transport development
The Thai government has taken action by approving transport infrastructure plans including:• A US$51 billion plan for 2016; and• A US$25 billion plan for 2017
Joining hands, regionally and cross-regionally
While many ASEAN countries are looking inward at their infrastructure needs, they remain acutely aware of their place in the wider global supply chain. Shifts in global economic power and trade competitiveness are driving regional cooperation and integration initiatives. Global and regional
megaprojects arising from this trend, such as China’s BRI and the initiatives announced for the Greater Mekong Subregion (GMS), will boost infrastructure spending, particularly in ASEAN.
Belt and Road Initiative
The BRI announced by the Chinese government aims to establish connectivity between China and the rest of Asia, Europe and Africa.
A key area of this initiative is to develop a transport network connecting China to other Asian countries, Europe and Africa via three land routes and two maritime routes. These networks are connected across a number of economic corridors. The BRI has driven regional initiatives such as the Singapore-Kunming Rail Link, and the East Coast Rail Link, and is acting as a catalyst not just for infrastructure investments, but also for the broader economic growth of the region. We previously discussed these initiatives in the first report of our Infrastructure Series, Understanding infrastructure opportunities in ASEAN (2017). More details can be found in the following PwC publications:- Preparing the Ancient Silk Routes (2017)- A Strategist's Guide to China's Belt and Road Initiative (2018)
Alibaba logistics hub6
In addition to an extensive transport network, the BRI has also driven a series of Chinese investments in other infrastructure sectors. For instance, Chinese e-commerce conglomerate Alibaba Group has announced plans to establish a regional logistics hub in Malaysia. The hub is to serve as a centralised facility for the region, so as to achieve faster clearance for imports and exports.
5 Enhancing Infrastructure Development for Thailand’s Future Growth, Board of Investment, Thailand6 “Alibaba to set up regional logistics hub in Malaysia”, Reuters, March 2017
PwC | Infrastructure Series Report 2 | 13
Greater Mekong Subregion
With the idea of increasing connectivity, improving competitiveness and fostering a greater sense of community, the GMS programme was established in 1992 with assistance from ADB. It comprises Cambodia, China (specifically, the Yunnan Province and Guangxi Zhuang Autonomous Region), Lao PDR, Myanmar, Thailand and Vietnam. The programme is anchored on identifying and implementing high-priority sub-regional projects across sectors to improve economic cooperation.
At the fourth GMS summit in 2011, a 10-year Strategic Framework was adopted to guide the GMS from 2012 to 2022. To operationalise the Strategic Framework, a GMS Regional Investment Framework (RIF) was endorsed in December 20137. This sets out a pipeline of priority projects in the GMS. As of the mid-term review of the RIF 2022 in September 2017, there were 222 investment and technical assistance projects requiring financing of approximately US$64 billion8.
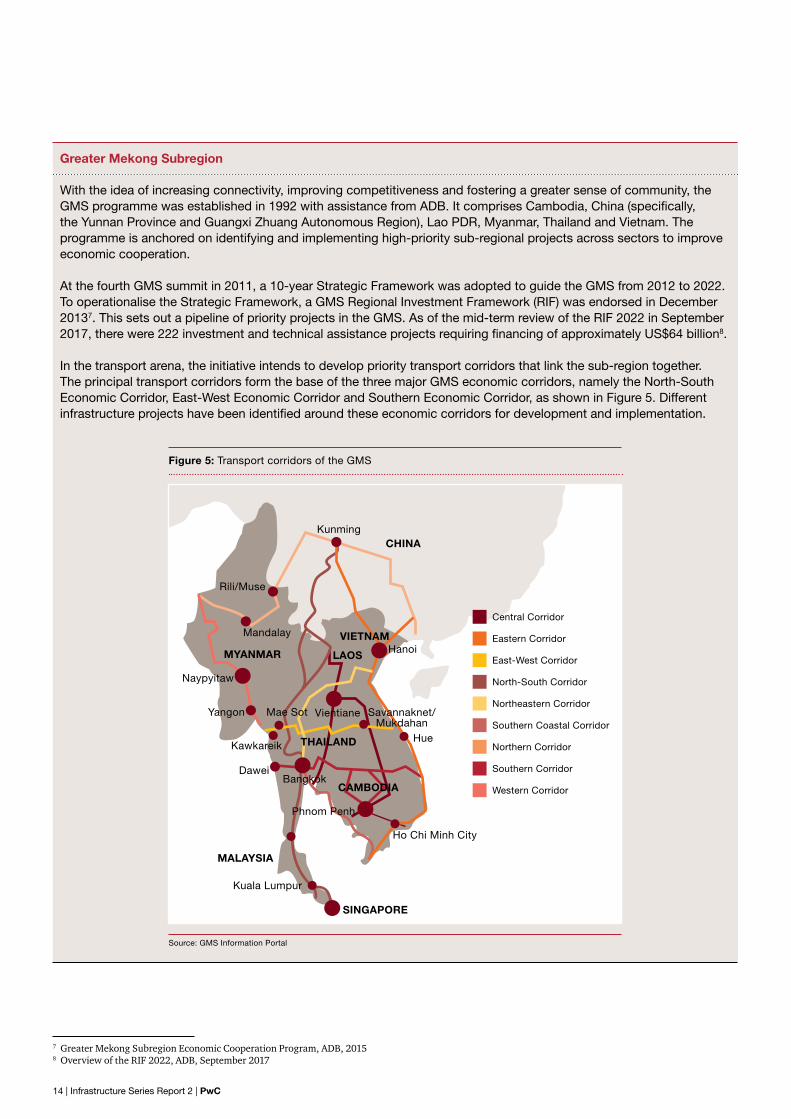
In the transport arena, the initiative intends to develop priority transport corridors that link the sub-region together. The principal transport corridors form the base of the three major GMS economic corridors, namely the North-South Economic Corridor, East-West Economic Corridor and Southern Economic Corridor, as shown in Figure 5. Different infrastructure projects have been identified around these economic corridors for development and implementation.
Figure 5: Transport corridors of the GMS
Source: GMS Information Portal
Kunming
Mandalay
Naypyitaw
Yangon Mae Sot Vientiane
Kawkareik
DaweiBangkok
Phnom Penh
Ho Chi Minh City
Hue
Savannaknet/Mukdahan
Hanoi
Rili/Muse
CHINA
VIETNAM
LAOSMYANMAR
THAILAND
CAMBODIA
SINGAPORE
MALAYSIA
Kuala Lumpur
7 Greater Mekong Subregion Economic Cooperation Program, ADB, 20158 Overview of the RIF 2022, ADB, September 2017
Central Corridor
Northeastern Corridor
Western Corridor
East-West Corridor
Northern Corridor
Eastern Corridor
Southern Coastal Corridor
North-South Corridor
Southern Corridor
14 | Infrastructure Series Report 2 | PwC
9 PwC analysis; Oxford Economics10 Meeting Asia’s Infrastructure Needs, ADB, 2017
Rail attracts attention
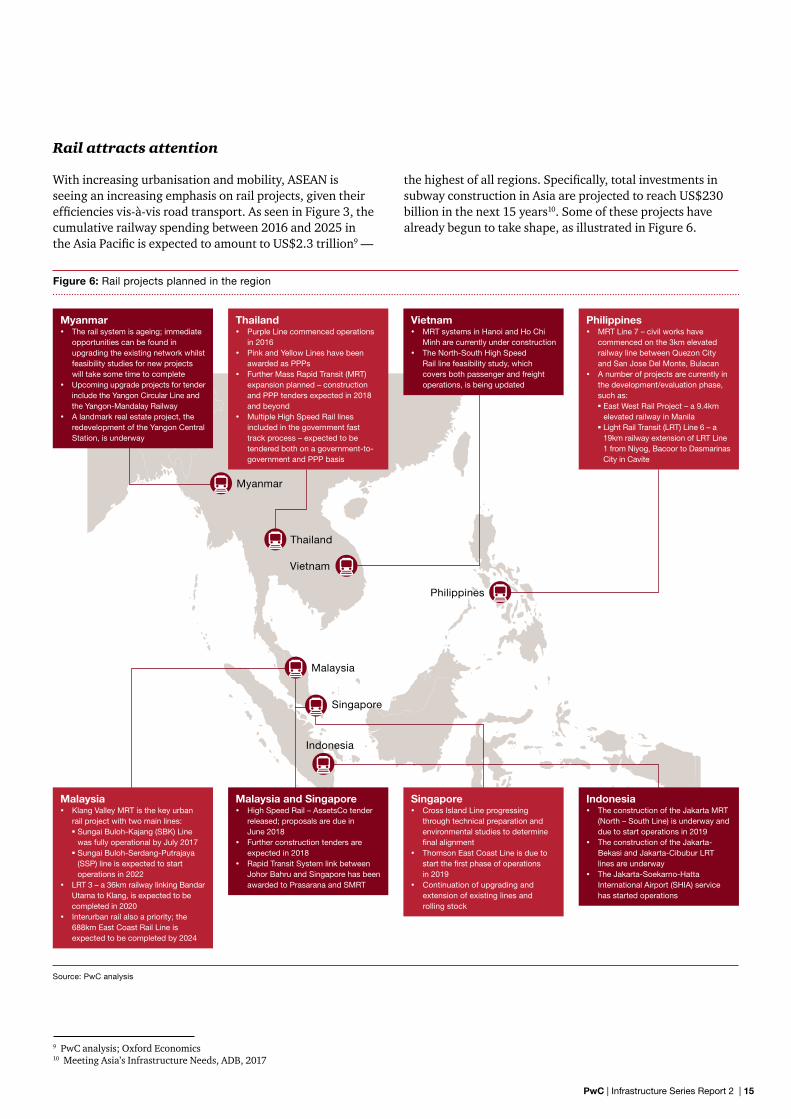
With increasing urbanisation and mobility, ASEAN is seeing an increasing emphasis on rail projects, given their efficiencies vis-à-vis road transport. As seen in Figure 3, the cumulative railway spending between 2016 and 2025 in the Asia Pacific is expected to amount to US$2.3 trillion9 —
the highest of all regions. Specifically, total investments in subway construction in Asia are projected to reach US$230 billion in the next 15 years10. Some of these projects have already begun to take shape, as illustrated in Figure 6.
Figure 6: Rail projects planned in the region
Source: PwC analysis
Philippines
Malaysia
Singapore
Indonesia
Vietnam
Thailand
Myanmar
Myanmar The rail system is ageing; immediate
opportunities can be found in upgrading the existing network whilst feasibility studies for new projects will take some time to complete
Upcoming upgrade projects for tender include the Yangon Circular Line and the Yangon-Mandalay Railway
A landmark real estate project, the redevelopment of the Yangon Central Station, is underway
Thailand Purple Line commenced operations
in 2016 Pink and Yellow Lines have been
awarded as PPPs Further Mass Rapid Transit (MRT)
expansion planned – construction and PPP tenders expected in 2018 and beyond
Multiple High Speed Rail lines included in the government fast track process – expected to be tendered both on a government-to-government and PPP basis
Vietnam MRT systems in Hanoi and Ho Chi
Minh are currently under construction The North-South High Speed
Rail line feasibility study, which covers both passenger and freight operations, is being updated
Philippines MRT Line 7 – civil works have
commenced on the 3km elevated railway line between Quezon City and San Jose Del Monte, Bulacan
A number of projects are currently in the development/evaluation phase, such as: East West Rail Project – a 9.4km
elevated railway in Manila Light Rail Transit (LRT) Line 6 – a
19km railway extension of LRT Line 1 from Niyog, Bacoor to Dasmarinas City in Cavite
Malaysia Klang Valley MRT is the key urban
rail project with two main lines: Sungai Buloh-Kajang (SBK) Line
was fully operational by July 2017 Sungai Buloh-Serdang-Putrajaya
(SSP) line is expected to start operations in 2022
LRT 3 – a 36km railway linking Bandar Utama to Klang, is expected to be completed in 2020
Interurban rail also a priority; the 688km East Coast Rail Line is expected to be completed by 2024
Malaysia and Singapore High Speed Rail – AssetsCo tender
released; proposals are due in June 2018
Further construction tenders are expected in 2018
Rapid Transit System link between Johor Bahru and Singapore has been awarded to Prasarana and SMRT
Indonesia The construction of the Jakarta MRT
(North – South Line) is underway and due to start operations in 2019
The construction of the Jakarta-Bekasi and Jakarta-Cibubur LRT lines are underway
The Jakarta-Soekarno-Hatta International Airport (SHIA) service has started operations
Singapore Cross Island Line progressing
through technical preparation and environmental studies to determine final alignment
Thomson East Coast Line is due to start the first phase of operations in 2019
Continuation of upgrading and extension of existing lines and rolling stock
PwC | Infrastructure Series Report 2 | 15
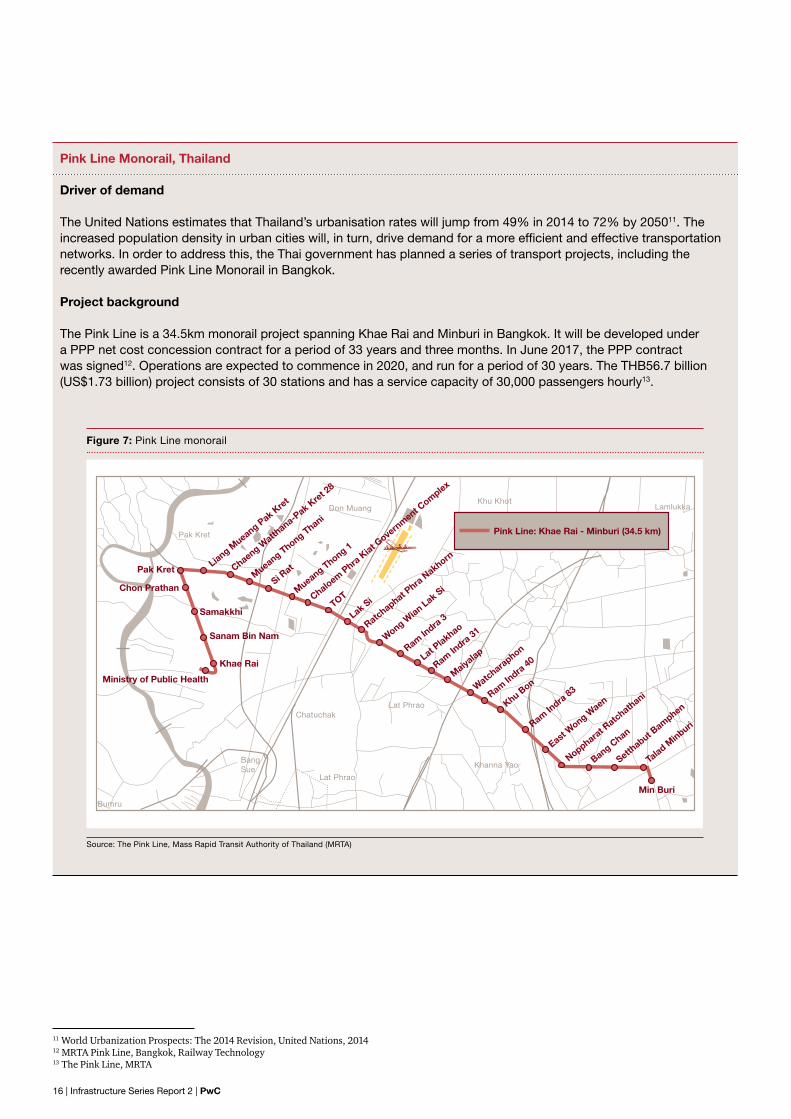
Pink Line Monorail, Thailand
Driver of demand
The United Nations estimates that Thailand’s urbanisation rates will jump from 49% in 2014 to 72% by 205011. The increased population density in urban cities will, in turn, drive demand for a more efficient and effective transportation networks. In order to address this, the Thai government has planned a series of transport projects, including the recently awarded Pink Line Monorail in Bangkok.
Project background
The Pink Line is a 34.5km monorail project spanning Khae Rai and Minburi in Bangkok. It will be developed under a PPP net cost concession contract for a period of 33 years and three months. In June 2017, the PPP contract was signed12. Operations are expected to commence in 2020, and run for a period of 30 years. The THB56.7 billion (US$1.73 billion) project consists of 30 stations and has a service capacity of 30,000 passengers hourly13.
Figure 7: Pink Line monorail
Source: The Pink Line, Mass Rapid Transit Authority of Thailand (MRTA)
Pink Line: Khae Rai - Minburi (34.5 km)
Bumru
BangSue
Chatuchak
Pak Kret
Don MuangKhu Khot
Lamlukka
Lat Phrao
Lat Phrao
Khanna Yao
Ministry of Public Health
Liang Mueang P
ak Kre
t
Chaeng Watth
ana-Pak K
ret 2
8
Mueang Thong Thani
Mueang Thong 1
Chaloem Phra
Kiat G
overn
ment Complex
TOT
Lak Si
Ratchaphat Phra
Nakhorn
Wong Wian Lak Si
Ram Indra
3
Ram Indra
31
Ram Indra
40
Ram Indra
83
Lat Plakhao
Maiyalap
Watcharaphon
Noppharat R
atchathani
Talad M
inburi
Min Buri
Setthabut B
amphen
Bang Chan
East Wong W
aenKhu Bon
Si Rat
Khae Rai
Sanam Bin Nam
Chon Prathan
Pak Kret
Samakkhi
11 World Urbanization Prospects: The 2014 Revision, United Nations, 2014 12 MRTA Pink Line, Bangkok, Railway Technology13 The Pink Line, MRTA
16 | Infrastructure Series Report 2 | PwC
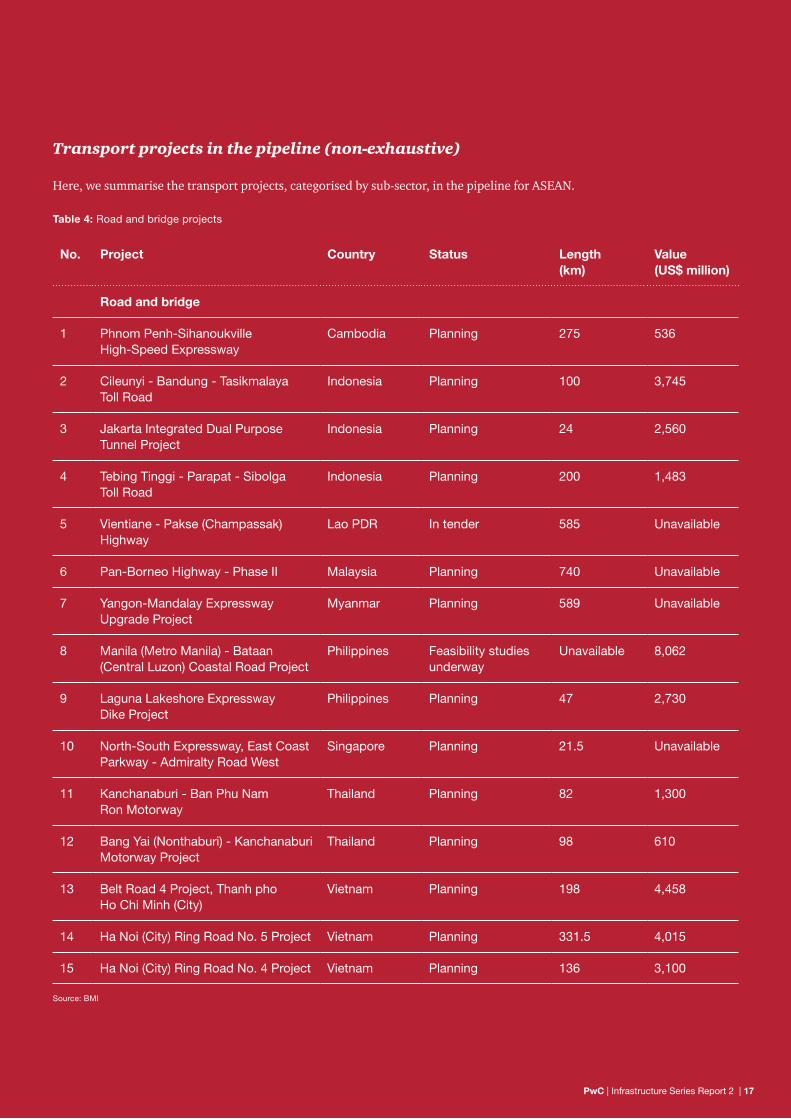
Here, we summarise the transport projects, categorised by sub-sector, in the pipeline for ASEAN.
No. Project Country Status Length (km)
Value (US$ million)
Road and bridge
1 Phnom Penh-Sihanoukville High-Speed Expressway
Cambodia Planning 275 536
2 Cileunyi - Bandung - Tasikmalaya Toll Road
Indonesia Planning 100 3,745
3 Jakarta Integrated Dual Purpose Tunnel Project
Indonesia Planning 24 2,560
4 Tebing Tinggi - Parapat - Sibolga Toll Road
Indonesia Planning 200 1,483
5 Vientiane - Pakse (Champassak) Highway
Lao PDR In tender 585 Unavailable
6 Pan-Borneo Highway - Phase II Malaysia Planning 740 Unavailable
7 Yangon-Mandalay Expressway Upgrade Project
Myanmar Planning 589 Unavailable
8 Manila (Metro Manila) - Bataan (Central Luzon) Coastal Road Project
Philippines Feasibility studies underway
Unavailable 8,062
9 Laguna Lakeshore Expressway Dike Project
Philippines Planning 47 2,730
10 North-South Expressway, East Coast Parkway - Admiralty Road West
Singapore Planning 21.5 Unavailable
11 Kanchanaburi - Ban Phu Nam Ron Motorway
Thailand Planning 82 1,300
12 Bang Yai (Nonthaburi) - Kanchanaburi Motorway Project
Thailand Planning 98 610
13 Belt Road 4 Project, Thanh pho Ho Chi Minh (City)
Vietnam Planning 198 4,458
14 Ha Noi (City) Ring Road No. 5 Project Vietnam Planning 331.5 4,015
15 Ha Noi (City) Ring Road No. 4 Project Vietnam Planning 136 3,100
Table 4: Road and bridge projects
Source: BMI
Transport projects in the pipeline (non-exhaustive)
PwC | Infrastructure Series Report 2 | 17
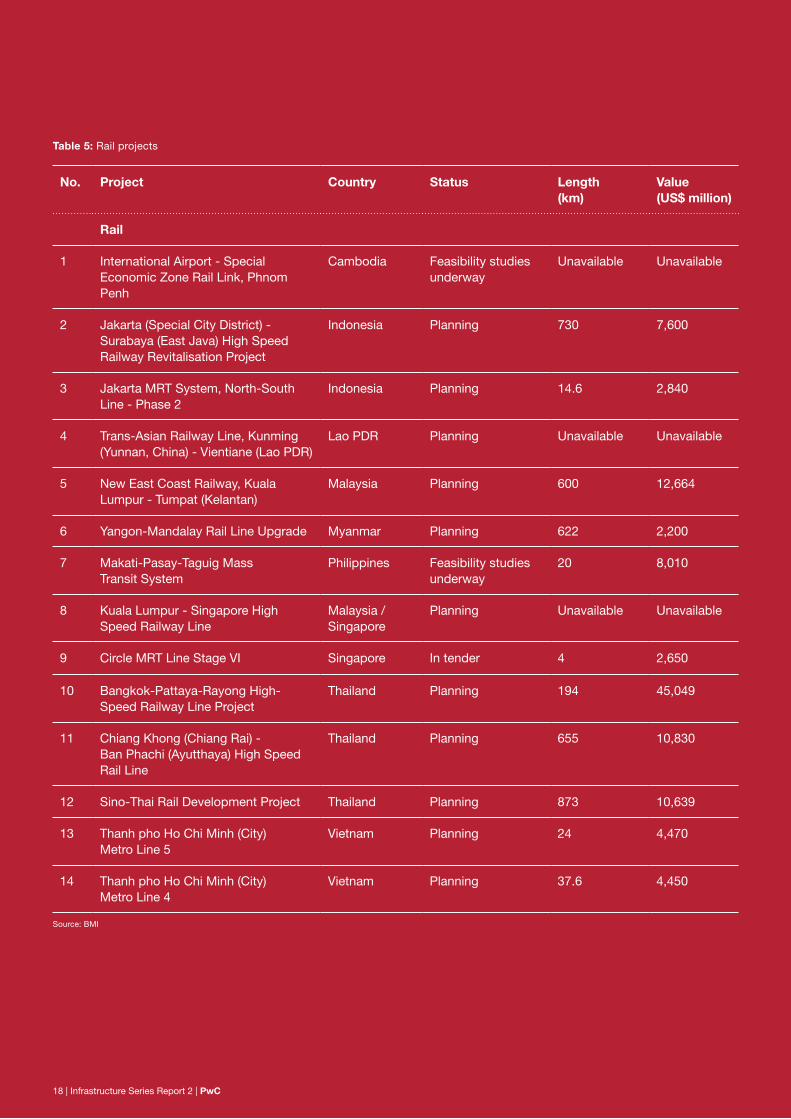
Table 5: Rail projects
No. Project Country Status Length (km)
Value (US$ million)
Rail
1 International Airport - Special Economic Zone Rail Link, Phnom Penh
Cambodia Feasibility studies underway
Unavailable Unavailable
2 Jakarta (Special City District) - Surabaya (East Java) High Speed Railway Revitalisation Project
Indonesia Planning 730 7,600
3 Jakarta MRT System, North-South Line - Phase 2
Indonesia Planning 14.6 2,840
4 Trans-Asian Railway Line, Kunming (Yunnan, China) - Vientiane (Lao PDR)
Lao PDR Planning Unavailable Unavailable
5 New East Coast Railway, Kuala Lumpur - Tumpat (Kelantan)
Malaysia Planning 600 12,664
6 Yangon-Mandalay Rail Line Upgrade Myanmar Planning 622 2,200
7 Makati-Pasay-Taguig Mass Transit System
Philippines Feasibility studies underway
20 8,010
8 Kuala Lumpur - Singapore High Speed Railway Line
Malaysia / Singapore
Planning Unavailable Unavailable
9 Circle MRT Line Stage VI Singapore In tender 4 2,650
10 Bangkok-Pattaya-Rayong High-Speed Railway Line Project
Thailand Planning 194 45,049
11 Chiang Khong (Chiang Rai) - Ban Phachi (Ayutthaya) High Speed Rail Line
Thailand Planning 655 10,830
12 Sino-Thai Rail Development Project Thailand Planning 873 10,639
13 Thanh pho Ho Chi Minh (City) Metro Line 5
Vietnam Planning 24 4,470
14 Thanh pho Ho Chi Minh (City) Metro Line 4
Vietnam Planning 37.6 4,450
Source: BMI
18 | Infrastructure Series Report 2 | PwC
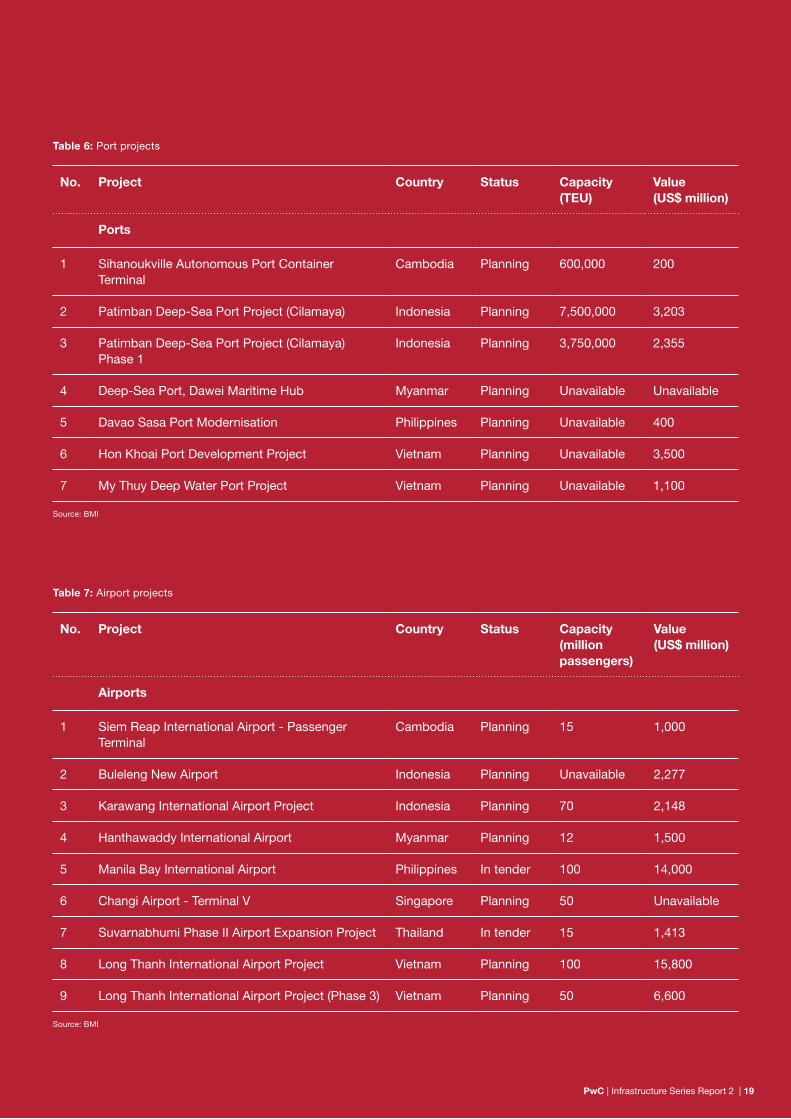
Table 6: Port projects
Table 7: Airport projects
No. Project Country Status Capacity(TEU)
Value (US$ million)
Ports
1 Sihanoukville Autonomous Port Container Terminal
Cambodia Planning 600,000 200
2 Patimban Deep-Sea Port Project (Cilamaya) Indonesia Planning 7,500,000 3,203
3 Patimban Deep-Sea Port Project (Cilamaya) Phase 1
Indonesia Planning 3,750,000 2,355
4 Deep-Sea Port, Dawei Maritime Hub Myanmar Planning Unavailable Unavailable
5 Davao Sasa Port Modernisation Philippines Planning Unavailable 400
6 Hon Khoai Port Development Project Vietnam Planning Unavailable 3,500
7 My Thuy Deep Water Port Project Vietnam Planning Unavailable 1,100
Source: BMI
Source: BMI
No. Project Country Status Capacity(million passengers)
Value (US$ million)
Airports
1 Siem Reap International Airport - Passenger Terminal
Cambodia Planning 15 1,000
2 Buleleng New Airport Indonesia Planning Unavailable 2,277
3 Karawang International Airport Project Indonesia Planning 70 2,148
4 Hanthawaddy International Airport Myanmar Planning 12 1,500
5 Manila Bay International Airport Philippines In tender 100 14,000
6 Changi Airport - Terminal V Singapore Planning 50 Unavailable
7 Suvarnabhumi Phase II Airport Expansion Project Thailand In tender 15 1,413
8 Long Thanh International Airport Project Vietnam Planning 100 15,800
9 Long Thanh International Airport Project (Phase 3) Vietnam Planning 50 6,600
PwC | Infrastructure Series Report 2 | 19
Energy
Focusing on renewables
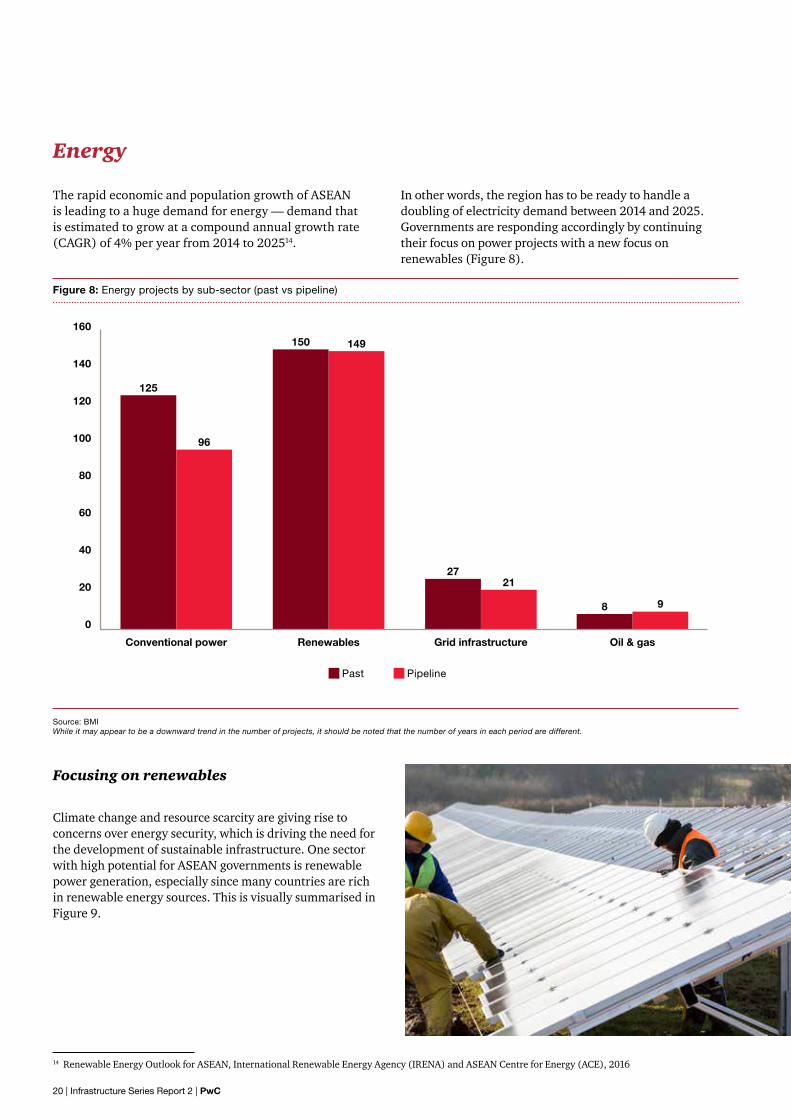
The rapid economic and population growth of ASEAN is leading to a huge demand for energy — demand that is estimated to grow at a compound annual growth rate (CAGR) of 4% per year from 2014 to 202514.
In other words, the region has to be ready to handle a doubling of electricity demand between 2014 and 2025. Governments are responding accordingly by continuing their focus on power projects with a new focus on renewables (Figure 8).
Climate change and resource scarcity are giving rise to concerns over energy security, which is driving the need for the development of sustainable infrastructure. One sector with high potential for ASEAN governments is renewable power generation, especially since many countries are rich in renewable energy sources. This is visually summarised in Figure 9.
Figure 8: Energy projects by sub-sector (past vs pipeline)
Source: BMIWhile it may appear to be a downward trend in the number of projects, it should be noted that the number of years in each period are different.
14 Renewable Energy Outlook for ASEAN, International Renewable Energy Agency (IRENA) and ASEAN Centre for Energy (ACE), 2016
160
140
120
100
80
60
40
20
0
Conventional power Renewables Grid infrastructure Oil & gas
Past Pipeline
125
96
150 149
2721
8 9
20 | Infrastructure Series Report 2 | PwC
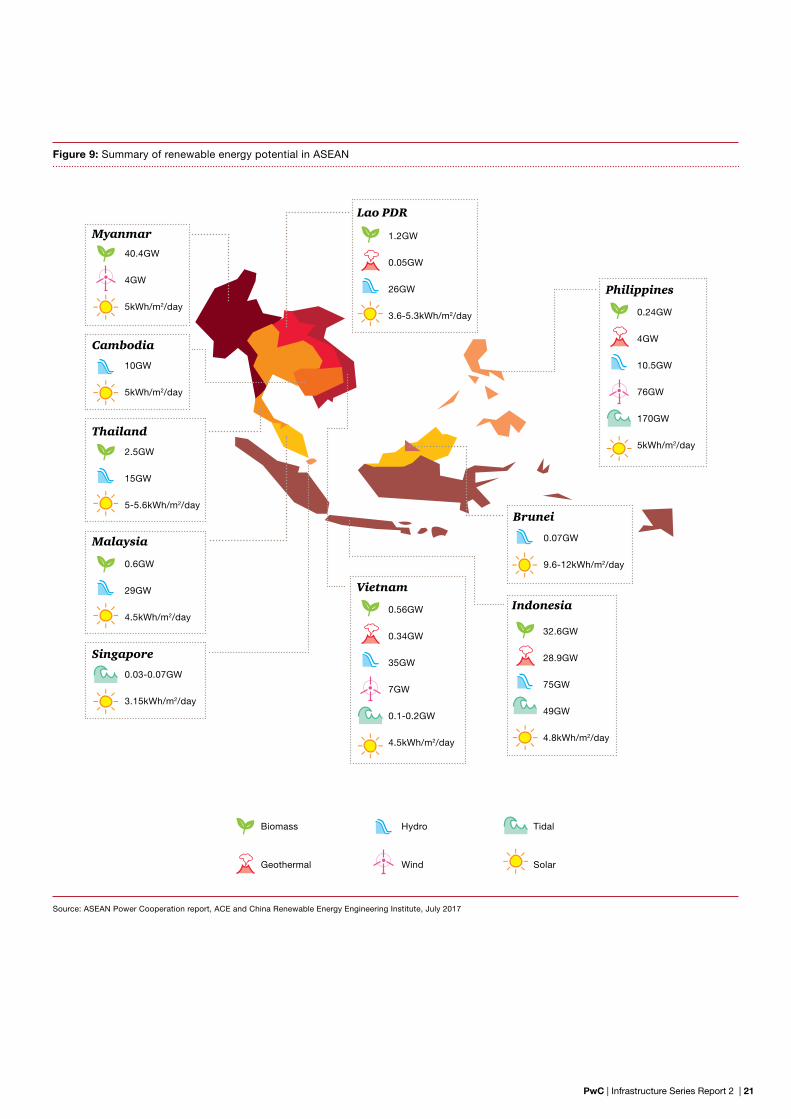
Figure 9: Summary of renewable energy potential in ASEAN
Source: ASEAN Power Cooperation report, ACE and China Renewable Energy Engineering Institute, July 2017
Philippines
Vietnam
Indonesia
Lao PDR
Malaysia
Thailand
Cambodia
Singapore
Myanmar
Brunei
0.07GW
9.6-12kWh/m2/day
32.6GW
28.9GW
75GW
49GW
4.8kWh/m2/day
1.2GW
0.05GW
26GW
3.6-5.3kWh/m2/day 0.24GW
4GW
10.5GW
76GW
170GW
5kWh/m2/day
0.56GW
0.34GW
35GW
7GW
0.1-0.2GW
4.5kWh/m2/day
2.5GW
15GW
5-5.6kWh/m2/day
0.6GW
29GW
4.5kWh/m2/day
40.4GW
4GW
5kWh/m2/day
10GW
5kWh/m2/day
0.03-0.07GW
3.15kWh/m2/day
Biomass Hydro Tidal
Geothermal Wind Solar
PwC | Infrastructure Series Report 2 | 21
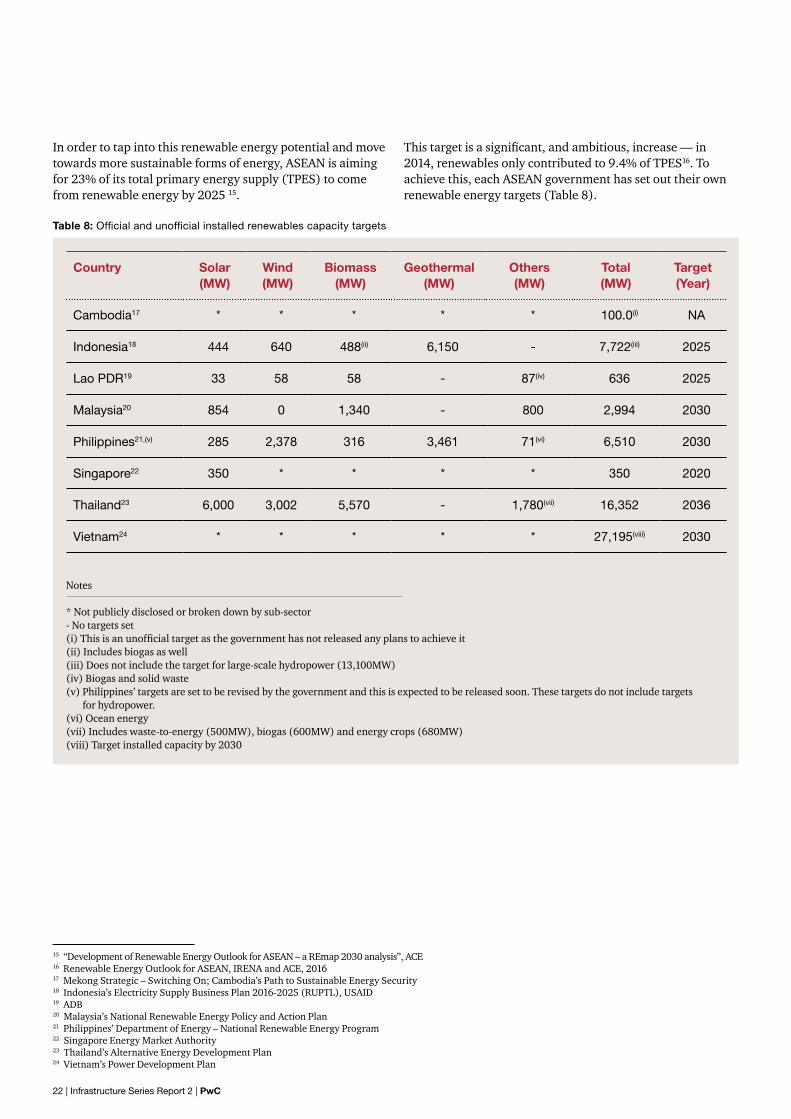
Table 8: Official and unofficial installed renewables capacity targets
15 “Development of Renewable Energy Outlook for ASEAN – a REmap 2030 analysis”, ACE16 Renewable Energy Outlook for ASEAN, IRENA and ACE, 201617 Mekong Strategic – Switching On; Cambodia’s Path to Sustainable Energy Security18 Indonesia’s Electricity Supply Business Plan 2016-2025 (RUPTL), USAID19 ADB20 Malaysia’s National Renewable Energy Policy and Action Plan21 Philippines’ Department of Energy – National Renewable Energy Program22 Singapore Energy Market Authority23 Thailand’s Alternative Energy Development Plan24 Vietnam’s Power Development Plan
In order to tap into this renewable energy potential and move towards more sustainable forms of energy, ASEAN is aiming for 23% of its total primary energy supply (TPES) to come from renewable energy by 2025 15.
This target is a significant, and ambitious, increase — in 2014, renewables only contributed to 9.4% of TPES16. To achieve this, each ASEAN government has set out their own renewable energy targets (Table 8).
Country Solar (MW)
Wind(MW)
Biomass(MW)
Geothermal(MW)
Others(MW)
Total (MW)
Target (Year)
Cambodia17 * * * * * 100.0(i) NA
Indonesia18 444 640 488(ii) 6,150 - 7,722(iii) 2025
Lao PDR19 33 58 58 - 87(iv) 636 2025
Malaysia20 854 0 1,340 - 800 2,994 2030
Philippines21,(v) 285 2,378 316 3,461 71(vi) 6,510 2030
Singapore22 350 * * * * 350 2020
Thailand23 6,000 3,002 5,570 - 1,780(vii) 16,352 2036
Vietnam24 * * * * * 27,195(viii) 2030
Notes
* Not publicly disclosed or broken down by sub-sector- No targets set (i) This is an unofficial target as the government has not released any plans to achieve it(ii) Includes biogas as well(iii) Does not include the target for large-scale hydropower (13,100MW)(iv) Biogas and solid waste(v) Philippines’ targets are set to be revised by the government and this is expected to be released soon. These targets do not include targets
for hydropower.(vi) Ocean energy (vii) Includes waste-to-energy (500MW), biogas (600MW) and energy crops (680MW)(viii) Target installed capacity by 2030
22 | Infrastructure Series Report 2 | PwC
Notes
(i) Hybrid – a combination of two or more renewable energy types/sources (ii) Electricity Generating Authority of Thailand (EGAT)(iii) Other ASEAN members such as Lao PDR, Cambodia and Myanmar do not have any formal programmes or policies promoting renewable
energy development
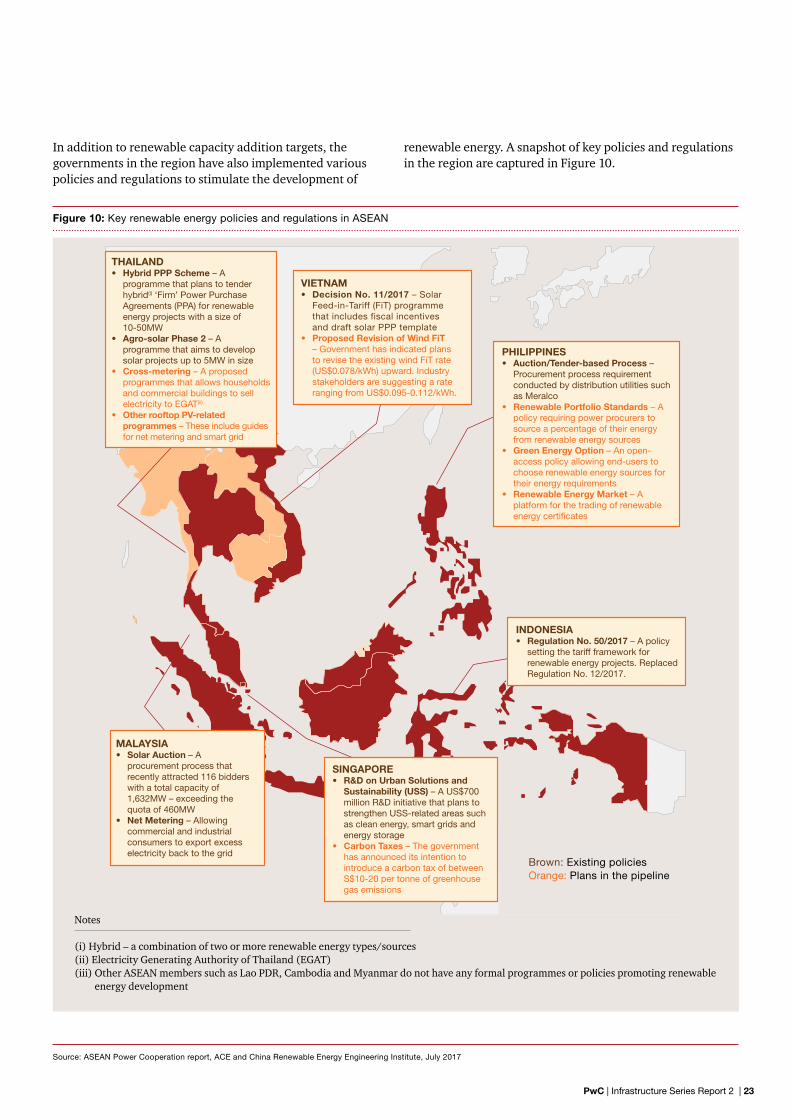
In addition to renewable capacity addition targets, the governments in the region have also implemented various policies and regulations to stimulate the development of
renewable energy. A snapshot of key policies and regulations in the region are captured in Figure 10.
Figure 10: Key renewable energy policies and regulations in ASEAN
Source: ASEAN Power Cooperation report, ACE and China Renewable Energy Engineering Institute, July 2017
THAILAND• Hybrid PPP Scheme – A
programme that plans to tender hybrid(i) ‘Firm’ Power Purchase Agreements (PPA) for renewable energy projects with a size of 10-50MW
• Agro-solar Phase 2 – A programme that aims to develop solar projects up to 5MW in size
• Cross-metering – A proposed programmes that allows households and commercial buildings to sell electricity to EGAT(ii)
• Other rooftop PV-related programmes – These include guides for net metering and smart grid
VIETNAM • Decision No. 11/2017 – Solar
Feed-in-Tariff (FiT) programme that includes fiscal incentives and draft solar PPP template
• Proposed Revision of Wind FiT – Government has indicated plans to revise the existing wind FiT rate (US$0.078/kWh) upward. Industry stakeholders are suggesting a rate ranging from US$0.095-0.112/kWh.
PHILIPPINES• Auction/Tender-based Process –
Procurement process requirement conducted by distribution utilities such as Meralco
• Renewable Portfolio Standards – A policy requiring power procurers to source a percentage of their energy from renewable energy sources
• Green Energy Option – An open-access policy allowing end-users to choose renewable energy sources for their energy requirements
• Renewable Energy Market – A platform for the trading of renewable energy certificates
INDONESIA• Regulation No. 50/2017 – A policy
setting the tariff framework for renewable energy projects. Replaced Regulation No. 12/2017.
SINGAPORE• R&D on Urban Solutions and
Sustainability (USS) – A US$700 million R&D initiative that plans to strengthen USS-related areas such as clean energy, smart grids and energy storage
• Carbon Taxes – The government has announced its intention to introduce a carbon tax of between S$10-20 per tonne of greenhouse gas emissions
MALAYSIA• Solar Auction – A
procurement process that recently attracted 116 bidders with a total capacity of 1,632MW – exceeding the quota of 460MW
• Net Metering – Allowing commercial and industrial consumers to export excess electricity back to the grid
Brown: Existing policies Orange: Plans in the pipeline
PwC | Infrastructure Series Report 2 | 23
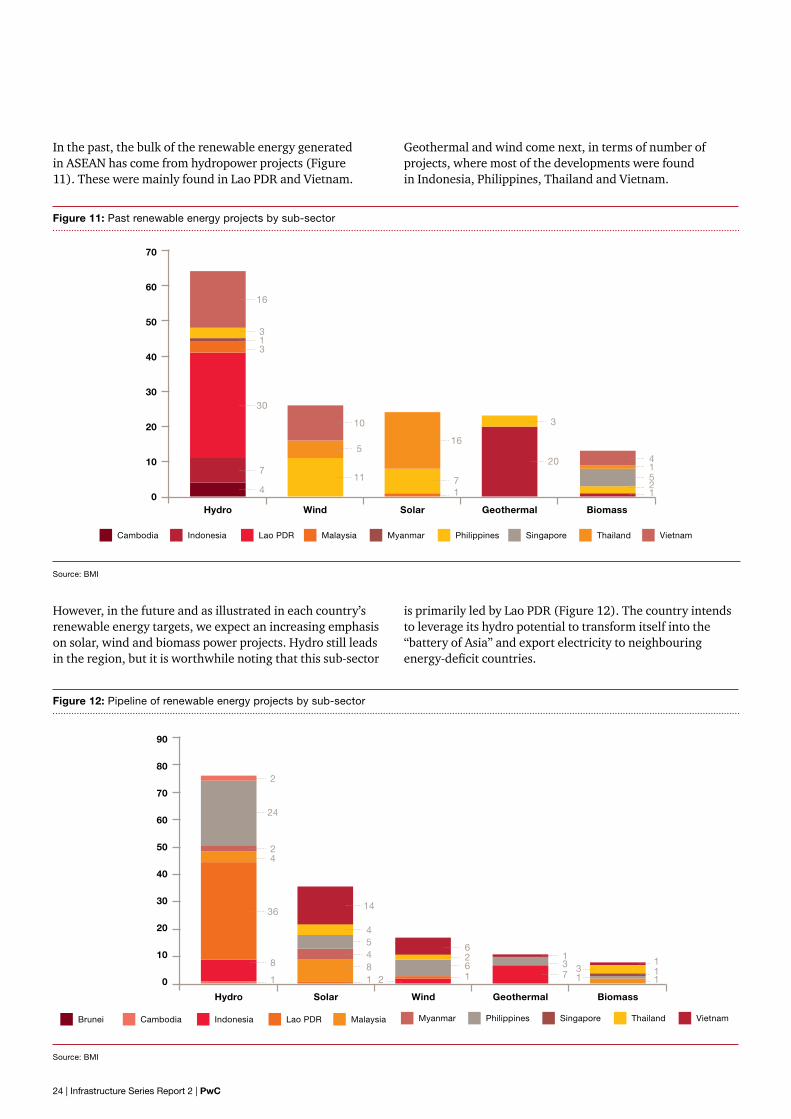
In the past, the bulk of the renewable energy generated in ASEAN has come from hydropower projects (Figure 11). These were mainly found in Lao PDR and Vietnam.
Geothermal and wind come next, in terms of number of projects, where most of the developments were found in Indonesia, Philippines, Thailand and Vietnam.
However, in the future and as illustrated in each country’s renewable energy targets, we expect an increasing emphasis on solar, wind and biomass power projects. Hydro still leads in the region, but it is worthwhile noting that this sub-sector
is primarily led by Lao PDR (Figure 12). The country intends to leverage its hydro potential to transform itself into the “battery of Asia” and export electricity to neighbouring energy-deficit countries.
Figure 11: Past renewable energy projects by sub-sector
Source: BMI
Figure 12: Pipeline of renewable energy projects by sub-sector
Source: BMI
Hydro Wind Geothermal Solar Biomass
70
60
50
40
30
20
10
0
16
3
3
30
10
16
3
41521
20
71
5
117
4
2
24
24
3614
61 1
11
31
37
2612
45481
8
1
1
Cambodia Lao PDR MyanmarIndonesia Malaysia Philippines ThailandSingapore Vietnam
Brunei Indonesia Malaysia Cambodia Lao PDR Myanmar SingaporePhilippines Thailand Vietnam
Hydro Solar Geothermal Wind Biomass
90
80
70
60
50
40
30
20
10
0
24 | Infrastructure Series Report 2 | PwC
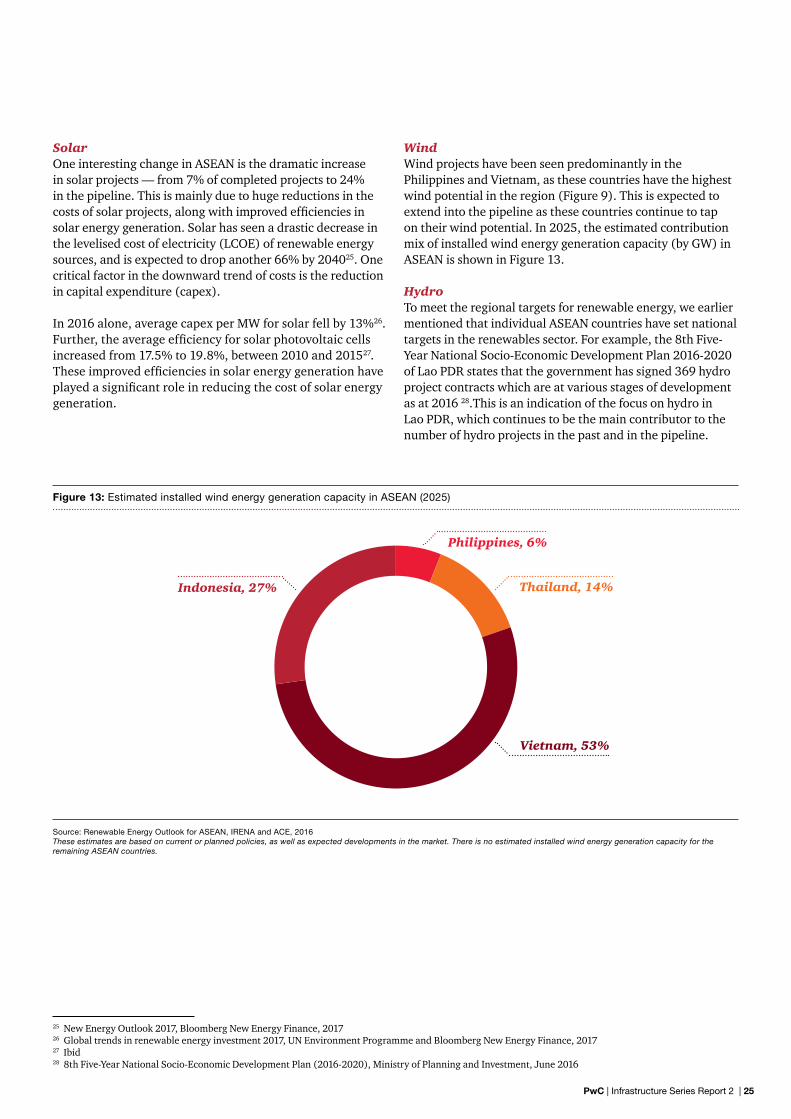
Figure 13: Estimated installed wind energy generation capacity in ASEAN (2025)
Source: Renewable Energy Outlook for ASEAN, IRENA and ACE, 2016These estimates are based on current or planned policies, as well as expected developments in the market. There is no estimated installed wind energy generation capacity for the remaining ASEAN countries.
SolarOne interesting change in ASEAN is the dramatic increase in solar projects — from 7% of completed projects to 24% in the pipeline. This is mainly due to huge reductions in the costs of solar projects, along with improved efficiencies in solar energy generation. Solar has seen a drastic decrease in the levelised cost of electricity (LCOE) of renewable energy sources, and is expected to drop another 66% by 204025. One critical factor in the downward trend of costs is the reduction in capital expenditure (capex).
In 2016 alone, average capex per MW for solar fell by 13%26. Further, the average efficiency for solar photovoltaic cells increased from 17.5% to 19.8%, between 2010 and 201527.
These improved efficiencies in solar energy generation have played a significant role in reducing the cost of solar energy generation.
WindWind projects have been seen predominantly in the Philippines and Vietnam, as these countries have the highest wind potential in the region (Figure 9). This is expected to extend into the pipeline as these countries continue to tap on their wind potential. In 2025, the estimated contribution mix of installed wind energy generation capacity (by GW) in ASEAN is shown in Figure 13.
HydroTo meet the regional targets for renewable energy, we earlier mentioned that individual ASEAN countries have set national targets in the renewables sector. For example, the 8th Five-Year National Socio-Economic Development Plan 2016-2020 of Lao PDR states that the government has signed 369 hydro project contracts which are at various stages of development as at 2016 28.This is an indication of the focus on hydro in Lao PDR, which continues to be the main contributor to the number of hydro projects in the past and in the pipeline.
25 New Energy Outlook 2017, Bloomberg New Energy Finance, 201726 Global trends in renewable energy investment 2017, UN Environment Programme and Bloomberg New Energy Finance, 201727 Ibid 28 8th Five-Year National Socio-Economic Development Plan (2016-2020), Ministry of Planning and Investment, June 2016
Philippines, 6%
Thailand, 14%Indonesia, 27%
Vietnam, 53%
PwC | Infrastructure Series Report 2 | 25
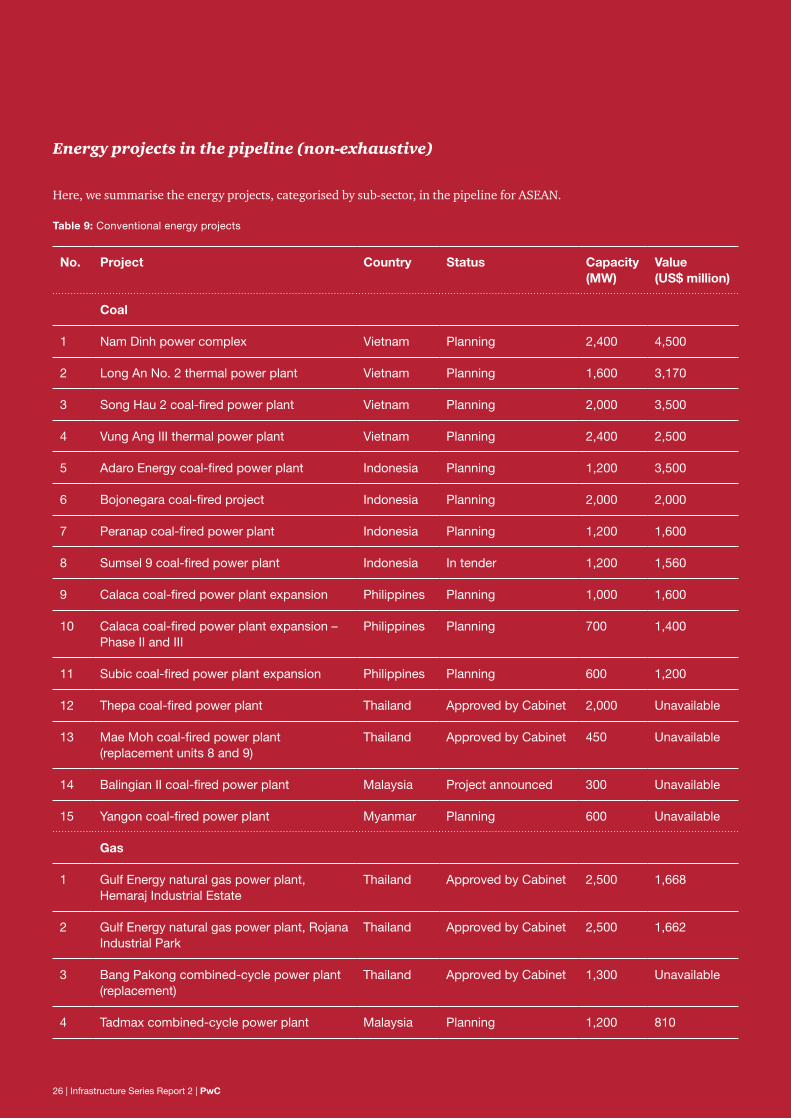
Energy projects in the pipeline (non-exhaustive)
Here, we summarise the energy projects, categorised by sub-sector, in the pipeline for ASEAN.
Table 9: Conventional energy projects
No. Project Country Status Capacity (MW)
Value (US$ million)
Coal
1 Nam Dinh power complex Vietnam Planning 2,400 4,500
2 Long An No. 2 thermal power plant Vietnam Planning 1,600 3,170
3 Song Hau 2 coal-fired power plant Vietnam Planning 2,000 3,500
4 Vung Ang III thermal power plant Vietnam Planning 2,400 2,500
5 Adaro Energy coal-fired power plant Indonesia Planning 1,200 3,500
6 Bojonegara coal-fired project Indonesia Planning 2,000 2,000
7 Peranap coal-fired power plant Indonesia Planning 1,200 1,600
8 Sumsel 9 coal-fired power plant Indonesia In tender 1,200 1,560
9 Calaca coal-fired power plant expansion Philippines Planning 1,000 1,600
10 Calaca coal-fired power plant expansion – Phase II and III
Philippines Planning 700 1,400
11 Subic coal-fired power plant expansion Philippines Planning 600 1,200
12 Thepa coal-fired power plant Thailand Approved by Cabinet 2,000 Unavailable
13 Mae Moh coal-fired power plant (replacement units 8 and 9)
Thailand Approved by Cabinet 450 Unavailable
14 Balingian II coal-fired power plant Malaysia Project announced 300 Unavailable
15 Yangon coal-fired power plant Myanmar Planning 600 Unavailable
Gas
1 Gulf Energy natural gas power plant, Hemaraj Industrial Estate
Thailand Approved by Cabinet 2,500 1,668
2 Gulf Energy natural gas power plant, Rojana Industrial Park
Thailand Approved by Cabinet 2,500 1,662
3 Bang Pakong combined-cycle power plant (replacement)
Thailand Approved by Cabinet 1,300 Unavailable
4 Tadmax combined-cycle power plant Malaysia Planning 1,200 810
26 | Infrastructure Series Report 2 | PwC
5 Kedah combined-cycle power plant Malaysia Planning 1,000 Unavailable
6 Java 1 combined-cycle power plant Indonesia Planning 1,760 1,800
7 Grati combined-cycle power plant extension
Indonesia Planning 501 260
8 Gas power plant Muara Karang expansion Indonesia Planning 500 288
9 Dung Quat Economic Zone power plant Vietnam Planning 1,500 Unavailable
10 O Mon IV combined-cycle power station Vietnam Planning 750 793
11 Gas-based power plant Philippines Planning 480 Unavailable
12 Tabangao LNG power plant Philippines Feasibility studies underway
415 Unavailable
13 Thanlyin gas-fired power generation facility Myanmar Planning 400 1,000
Source: BMI
PwC | Infrastructure Series Report 2 | 27
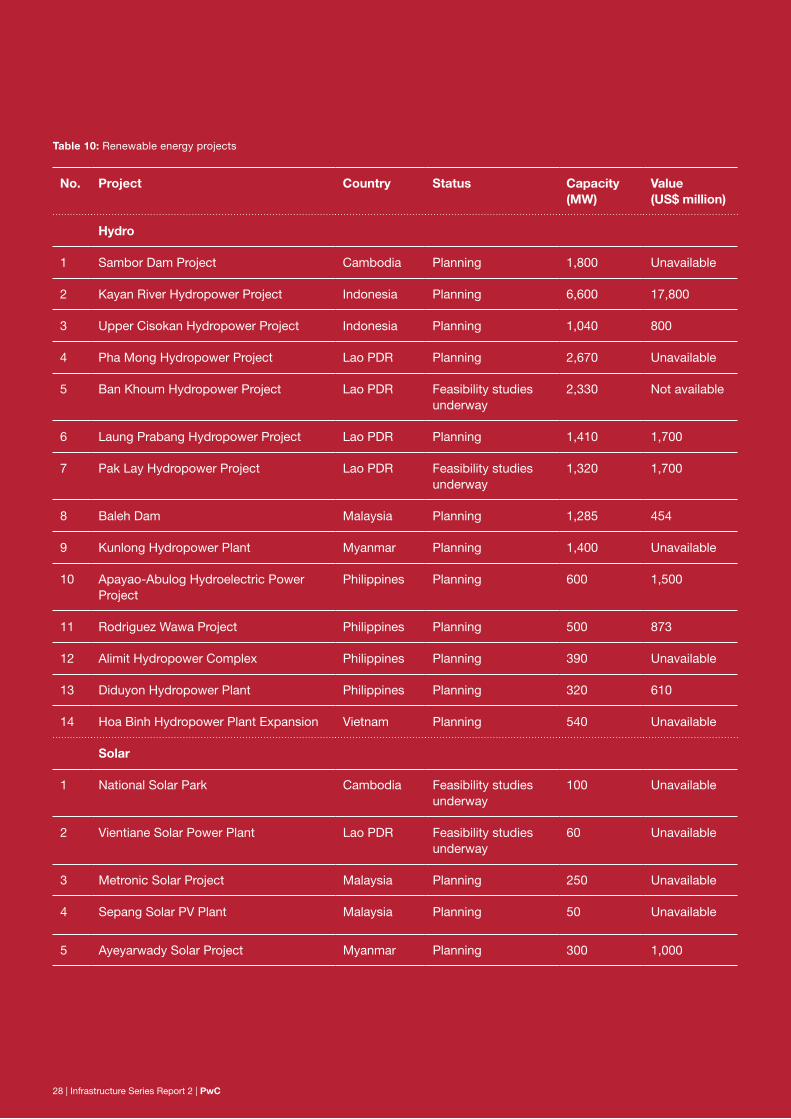
Table 10: Renewable energy projects
No. Project Country Status Capacity (MW)
Value (US$ million)
Hydro
1 Sambor Dam Project Cambodia Planning 1,800 Unavailable
2 Kayan River Hydropower Project Indonesia Planning 6,600 17,800
3 Upper Cisokan Hydropower Project Indonesia Planning 1,040 800
4 Pha Mong Hydropower Project Lao PDR Planning 2,670 Unavailable
5 Ban Khoum Hydropower Project Lao PDR Feasibility studies underway
2,330 Not available
6 Laung Prabang Hydropower Project Lao PDR Planning 1,410 1,700
7 Pak Lay Hydropower Project Lao PDR Feasibility studies underway
1,320 1,700
8 Baleh Dam Malaysia Planning 1,285 454
9 Kunlong Hydropower Plant Myanmar Planning 1,400 Unavailable
10 Apayao-Abulog Hydroelectric Power Project
Philippines Planning 600 1,500
11 Rodriguez Wawa Project Philippines Planning 500 873
12 Alimit Hydropower Complex Philippines Planning 390 Unavailable
13 Diduyon Hydropower Plant Philippines Planning 320 610
14 Hoa Binh Hydropower Plant Expansion Vietnam Planning 540 Unavailable
Solar
1 National Solar Park Cambodia Feasibility studies underway
100 Unavailable
2 Vientiane Solar Power Plant Lao PDR Feasibility studies underway
60 Unavailable
3 Metronic Solar Project Malaysia Planning 250 Unavailable
4 Sepang Solar PV Plant Malaysia Planning 50 Unavailable
5 Ayeyarwady Solar Project Myanmar Planning 300 1,000
28 | Infrastructure Series Report 2 | PwC
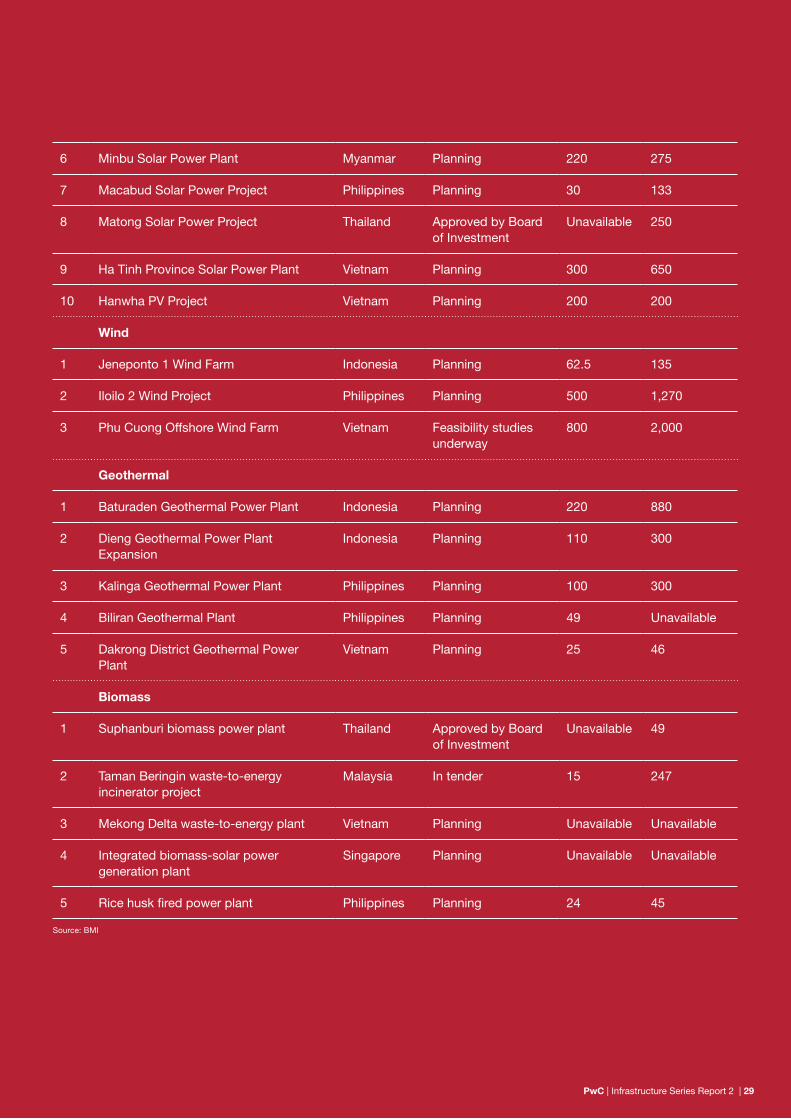
6 Minbu Solar Power Plant Myanmar Planning 220 275
7 Macabud Solar Power Project Philippines Planning 30 133
8 Matong Solar Power Project Thailand Approved by Board of Investment
Unavailable 250
9 Ha Tinh Province Solar Power Plant Vietnam Planning 300 650
10 Hanwha PV Project Vietnam Planning 200 200
Wind
1 Jeneponto 1 Wind Farm Indonesia Planning 62.5 135
2 Iloilo 2 Wind Project Philippines Planning 500 1,270
3 Phu Cuong Offshore Wind Farm Vietnam Feasibility studies underway
800 2,000
Geothermal
1 Baturaden Geothermal Power Plant Indonesia Planning 220 880
2 Dieng Geothermal Power Plant Expansion
Indonesia Planning 110 300
3 Kalinga Geothermal Power Plant Philippines Planning 100 300
4 Biliran Geothermal Plant Philippines Planning 49 Unavailable
5 Dakrong District Geothermal Power Plant
Vietnam Planning 25 46
Biomass
1 Suphanburi biomass power plant Thailand Approved by Board of Investment
Unavailable 49
2 Taman Beringin waste-to-energy incinerator project
Malaysia In tender 15 247
3 Mekong Delta waste-to-energy plant Vietnam Planning Unavailable Unavailable
4 Integrated biomass-solar power generation plant
Singapore Planning Unavailable Unavailable
5 Rice husk fired power plant Philippines Planning 24 45
Source: BMI
PwC | Infrastructure Series Report 2 | 29
Chapter 3: Public Private Partnerships
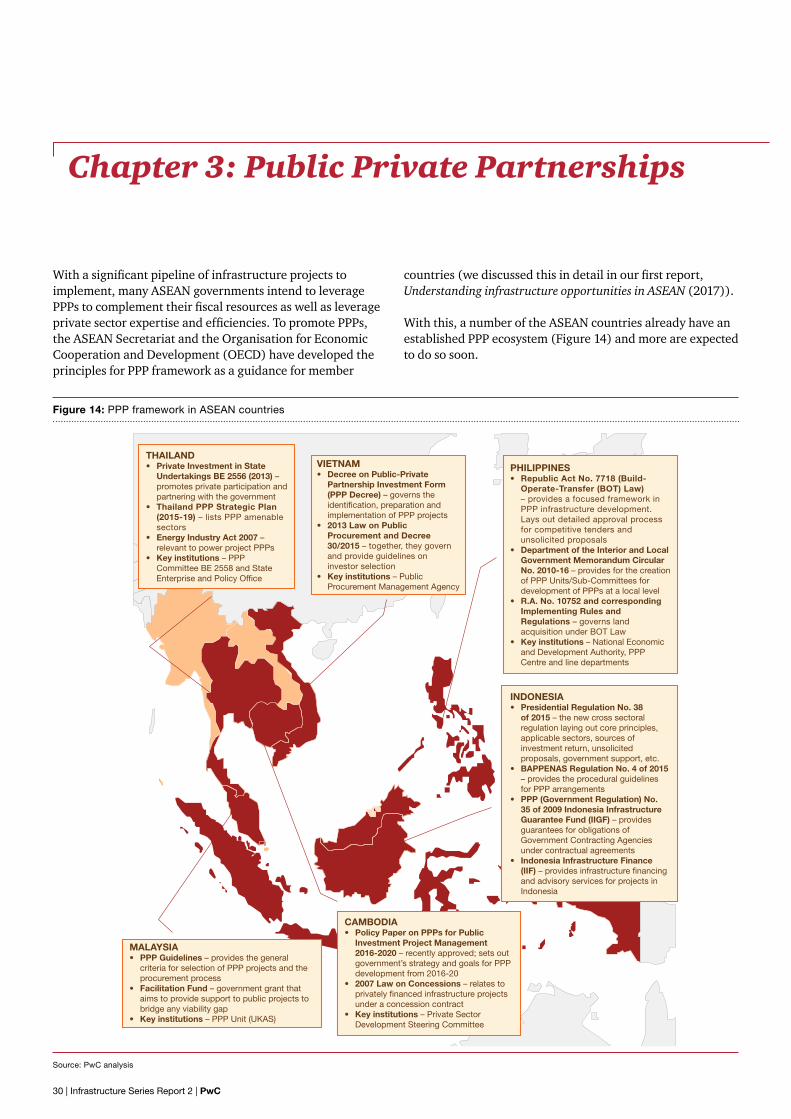
With a significant pipeline of infrastructure projects to implement, many ASEAN governments intend to leverage PPPs to complement their fiscal resources as well as leverage private sector expertise and efficiencies. To promote PPPs, the ASEAN Secretariat and the Organisation for Economic Cooperation and Development (OECD) have developed the principles for PPP framework as a guidance for member
countries (we discussed this in detail in our first report, Understanding infrastructure opportunities in ASEAN (2017)).
With this, a number of the ASEAN countries already have an established PPP ecosystem (Figure 14) and more are expected to do so soon.
Figure 14: PPP framework in ASEAN countries
Source: PwC analysis
THAILAND• Private Investment in State
Undertakings BE 2556 (2013) – promotes private participation and partnering with the government
• Thailand PPP Strategic Plan (2015-19) – lists PPP amenable sectors
• Energy Industry Act 2007 – relevant to power project PPPs
• Key institutions – PPP Committee BE 2558 and State Enterprise and Policy Office
VIETNAM• Decree on Public-Private
Partnership Investment Form (PPP Decree) – governs the identification, preparation and implementation of PPP projects
• 2013 Law on Public Procurement and Decree 30/2015 – together, they govern and provide guidelines on investor selection
• Key institutions – Public Procurement Management Agency
PHILIPPINES• Republic Act No. 7718 (Build-
Operate-Transfer (BOT) Law) – provides a focused framework in PPP infrastructure development. Lays out detailed approval process for competitive tenders and unsolicited proposals
• Department of the Interior and Local Government Memorandum Circular No. 2010-16 – provides for the creation of PPP Units/Sub-Committees for development of PPPs at a local level
• R.A. No. 10752 and corresponding Implementing Rules and Regulations – governs land acquisition under BOT Law
• Key institutions – National Economic and Development Authority, PPP Centre and line departments
INDONESIA • Presidential Regulation No. 38
of 2015 – the new cross sectoral regulation laying out core principles, applicable sectors, sources of investment return, unsolicited proposals, government support, etc.
• BAPPENAS Regulation No. 4 of 2015 – provides the procedural guidelines for PPP arrangements
• PPP (Government Regulation) No. 35 of 2009 Indonesia Infrastructure Guarantee Fund (IIGF) – provides guarantees for obligations of Government Contracting Agencies under contractual agreements
• Indonesia Infrastructure Finance (IIF) – provides infrastructure financing and advisory services for projects in Indonesia
MALAYSIA• PPP Guidelines – provides the general
criteria for selection of PPP projects and the procurement process
• Facilitation Fund – government grant that aims to provide support to public projects to bridge any viability gap
• Key institutions – PPP Unit (UKAS)
CAMBODIA• Policy Paper on PPPs for Public
Investment Project Management 2016-2020 – recently approved; sets out government’s strategy and goals for PPP development from 2016-20
• 2007 Law on Concessions – relates to privately financed infrastructure projects under a concession contract
• Key institutions – Private Sector Development Steering Committee
30 | Infrastructure Series Report 2 | PwC
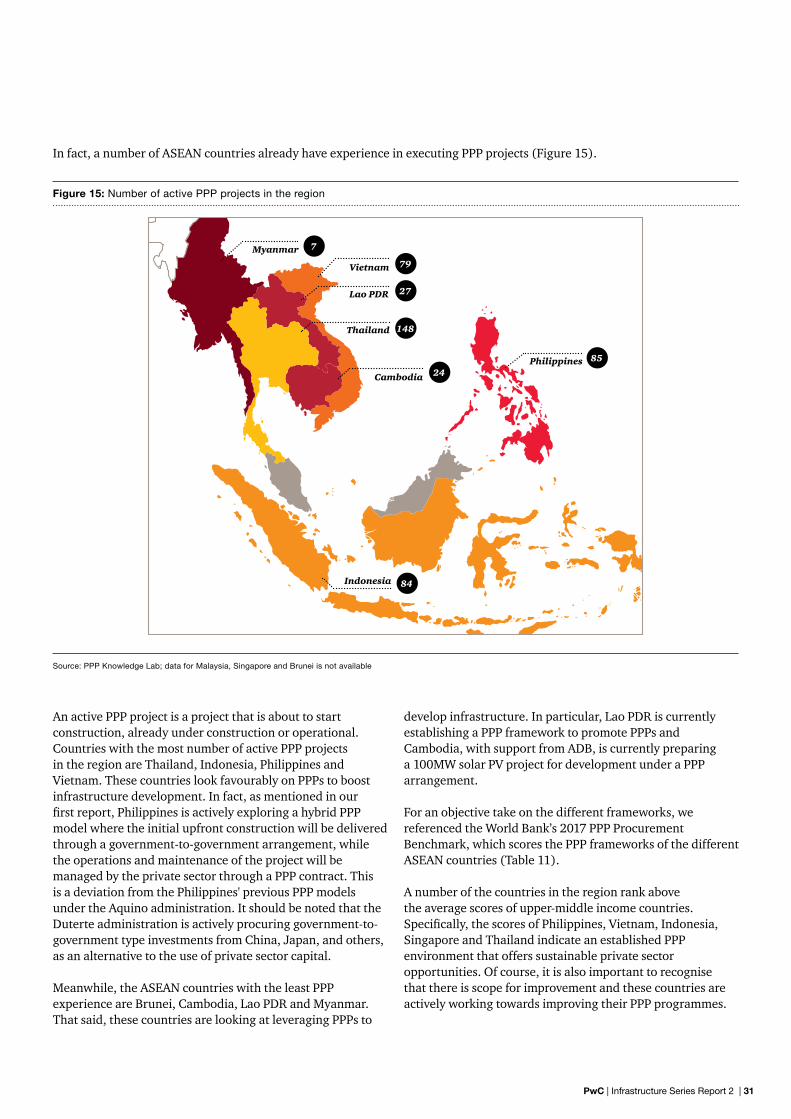
In fact, a number of ASEAN countries already have experience in executing PPP projects (Figure 15).
Figure 15: Number of active PPP projects in the region
Source: PPP Knowledge Lab; data for Malaysia, Singapore and Brunei is not available
An active PPP project is a project that is about to start construction, already under construction or operational. Countries with the most number of active PPP projects in the region are Thailand, Indonesia, Philippines and Vietnam. These countries look favourably on PPPs to boost infrastructure development. In fact, as mentioned in our first report, Philippines is actively exploring a hybrid PPP model where the initial upfront construction will be delivered through a government-to-government arrangement, while the operations and maintenance of the project will be managed by the private sector through a PPP contract. This is a deviation from the Philippines' previous PPP models under the Aquino administration. It should be noted that the Duterte administration is actively procuring government-to-government type investments from China, Japan, and others, as an alternative to the use of private sector capital.
Meanwhile, the ASEAN countries with the least PPP experience are Brunei, Cambodia, Lao PDR and Myanmar. That said, these countries are looking at leveraging PPPs to
develop infrastructure. In particular, Lao PDR is currently establishing a PPP framework to promote PPPs and Cambodia, with support from ADB, is currently preparing a 100MW solar PV project for development under a PPP arrangement.
For an objective take on the different frameworks, we referenced the World Bank’s 2017 PPP Procurement Benchmark, which scores the PPP frameworks of the different ASEAN countries (Table 11).
A number of the countries in the region rank above the average scores of upper-middle income countries. Specifically, the scores of Philippines, Vietnam, Indonesia, Singapore and Thailand indicate an established PPP environment that offers sustainable private sector opportunities. Of course, it is also important to recognise that there is scope for improvement and these countries are actively working towards improving their PPP programmes.
Vietnam
Philippines
Lao PDR
Cambodia
Indonesia
Thailand
Myanmar
79
85
27
24
84
148
7
PwC | Infrastructure Series Report 2 | 31
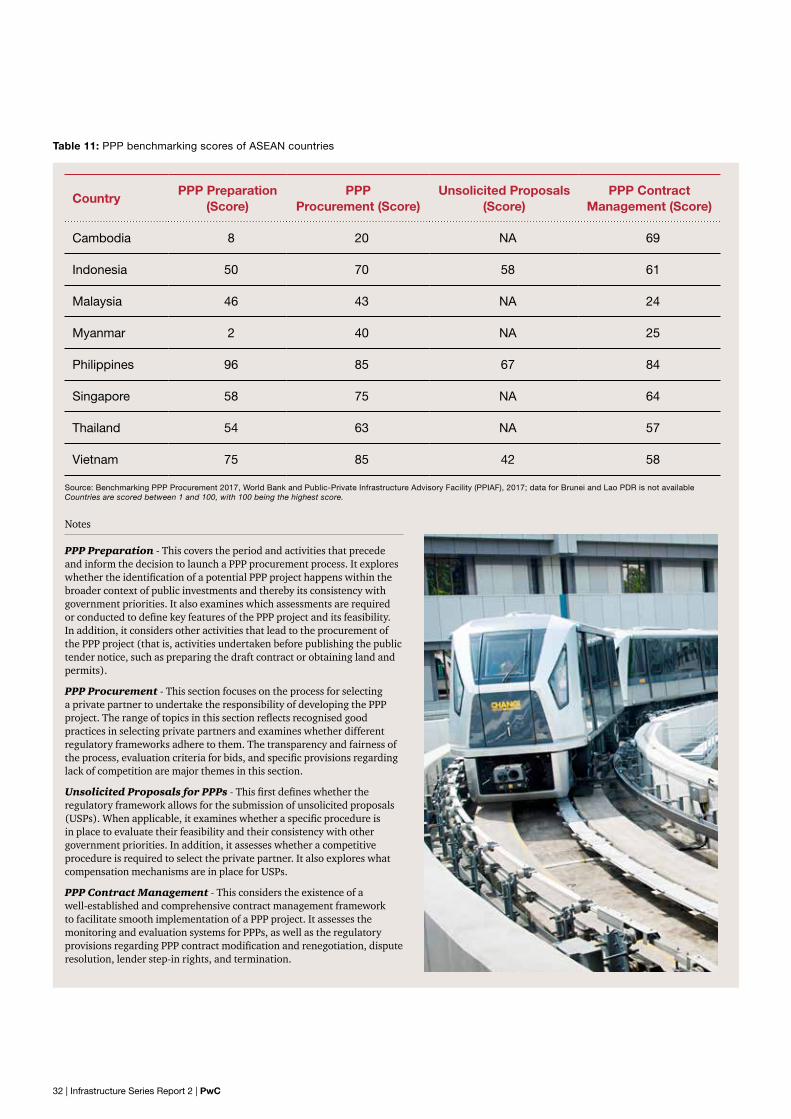
CountryPPP Preparation
(Score)PPP
Procurement (Score)Unsolicited Proposals
(Score)PPP Contract
Management (Score)
Cambodia 8 20 NA 69
Indonesia 50 70 58 61
Malaysia 46 43 NA 24
Myanmar 2 40 NA 25
Philippines 96 85 67 84
Singapore 58 75 NA 64
Thailand 54 63 NA 57
Vietnam 75 85 42 58
Source: Benchmarking PPP Procurement 2017, World Bank and Public-Private Infrastructure Advisory Facility (PPIAF), 2017; data for Brunei and Lao PDR is not availableCountries are scored between 1 and 100, with 100 being the highest score.
Notes
PPP Preparation - This covers the period and activities that precede and inform the decision to launch a PPP procurement process. It explores whether the identification of a potential PPP project happens within the broader context of public investments and thereby its consistency with government priorities. It also examines which assessments are required or conducted to define key features of the PPP project and its feasibility. In addition, it considers other activities that lead to the procurement of the PPP project (that is, activities undertaken before publishing the public tender notice, such as preparing the draft contract or obtaining land and permits).
PPP Procurement - This section focuses on the process for selecting a private partner to undertake the responsibility of developing the PPP project. The range of topics in this section reflects recognised good practices in selecting private partners and examines whether different regulatory frameworks adhere to them. The transparency and fairness of the process, evaluation criteria for bids, and specific provisions regarding lack of competition are major themes in this section.
Unsolicited Proposals for PPPs - This first defines whether the regulatory framework allows for the submission of unsolicited proposals (USPs). When applicable, it examines whether a specific procedure is in place to evaluate their feasibility and their consistency with other government priorities. In addition, it assesses whether a competitive procedure is required to select the private partner. It also explores what compensation mechanisms are in place for USPs.
PPP Contract Management - This considers the existence of a well-established and comprehensive contract management framework to facilitate smooth implementation of a PPP project. It assesses the monitoring and evaluation systems for PPPs, as well as the regulatory provisions regarding PPP contract modification and renegotiation, dispute resolution, lender step-in rights, and termination.
Table 11: PPP benchmarking scores of ASEAN countries
32 | Infrastructure Series Report 2 | PwC
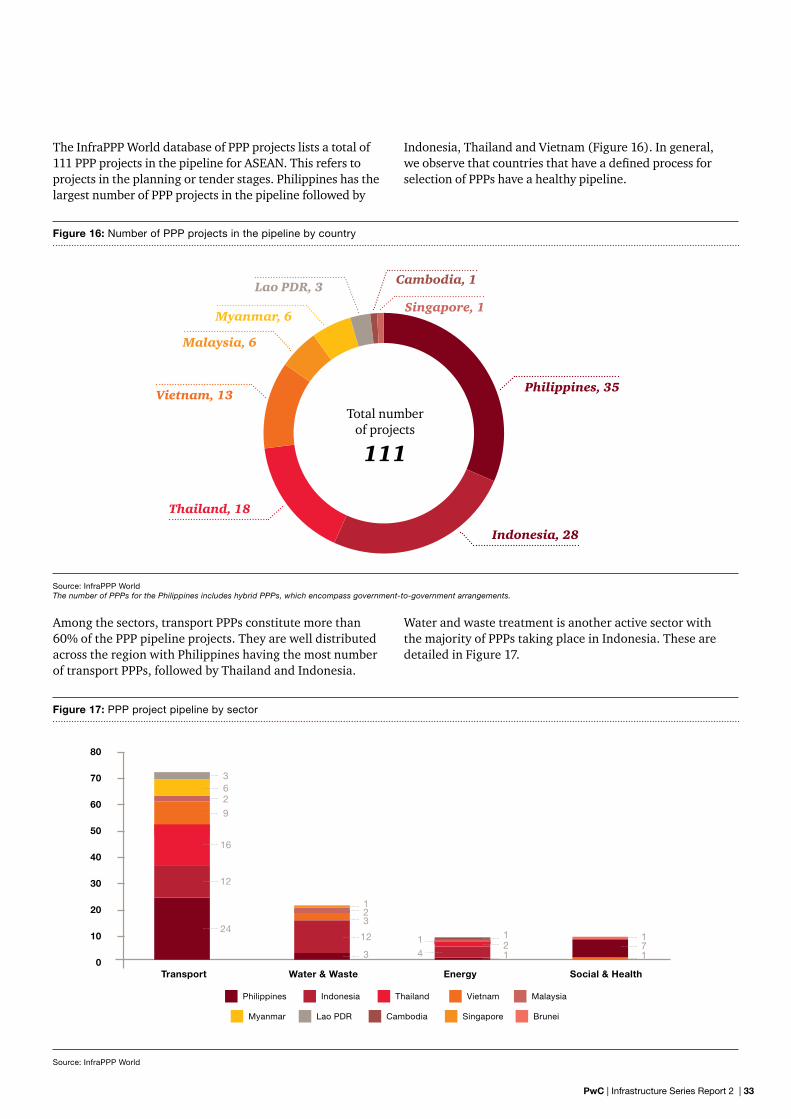
The InfraPPP World database of PPP projects lists a total of 111 PPP projects in the pipeline for ASEAN. This refers to projects in the planning or tender stages. Philippines has the largest number of PPP projects in the pipeline followed by
Indonesia, Thailand and Vietnam (Figure 16). In general, we observe that countries that have a defined process for selection of PPPs have a healthy pipeline.
Among the sectors, transport PPPs constitute more than 60% of the PPP pipeline projects. They are well distributed across the region with Philippines having the most number of transport PPPs, followed by Thailand and Indonesia.
Water and waste treatment is another active sector with the majority of PPPs taking place in Indonesia. These are detailed in Figure 17.
Figure 16: Number of PPP projects in the pipeline by country
Source: InfraPPP WorldThe number of PPPs for the Philippines includes hybrid PPPs, which encompass government-to-government arrangements.
Figure 17: PPP project pipeline by sector
Source: InfraPPP World
Philippines, 35
Singapore, 1
Cambodia, 1
Indonesia, 28
Vietnam, 13
Thailand, 18
Lao PDR, 3
Myanmar, 6
Malaysia, 6
80
70
60
50
40
30
20
10
0Transport Water & Waste Energy Social & Health
Philippines Thailand Malaysia Indonesia Vietnam
Myanmar Cambodia BruneiLao PDR Singapore
Total number of projects
111
362
9
16
12
24
1
1 1
12 7
4
3
12
3
2
1
1
PwC | Infrastructure Series Report 2 | 33
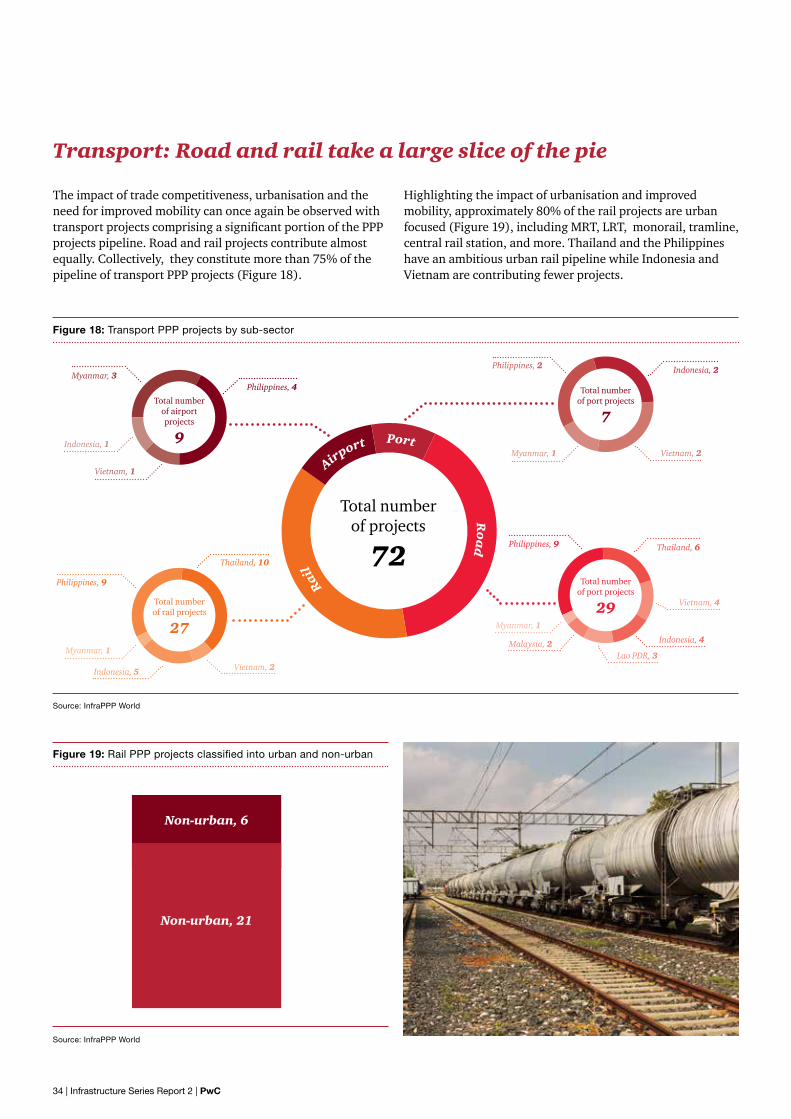
Transport: Road and rail take a large slice of the pie
The impact of trade competitiveness, urbanisation and the need for improved mobility can once again be observed with transport projects comprising a significant portion of the PPP projects pipeline. Road and rail projects contribute almost equally. Collectively, they constitute more than 75% of the pipeline of transport PPP projects (Figure 18).
Highlighting the impact of urbanisation and improved mobility, approximately 80% of the rail projects are urban focused (Figure 19), including MRT, LRT, monorail, tramline, central rail station, and more. Thailand and the Philippines have an ambitious urban rail pipeline while Indonesia and Vietnam are contributing fewer projects.
Figure 18: Transport PPP projects by sub-sector
Source: InfraPPP World
Figure 19: Rail PPP projects classified into urban and non-urban
Source: InfraPPP World
Non-urban, 6
Non-urban, 21
Total number of projects
72
Port
Ro
ad
Rail
Airport
Total number of airport projects
9
Philippines, 4Myanmar, 3
Indonesia, 1
Vietnam, 1
Indonesia, 2
Vietnam, 2
Philippines, 2
Myanmar, 1
Total number of port projects
7
Thailand, 10
Total number of rail projects
27
Philippines, 9
Myanmar, 1
Indonesia, 5 Vietnam, 2
Total number of port projects
29
Philippines, 9 Thailand, 6
Vietnam, 4
Indonesia, 4
Myanmar, 1
Malaysia, 2Lao PDR, 3
Total number of projects
72
34 | Infrastructure Series Report 2 | PwC
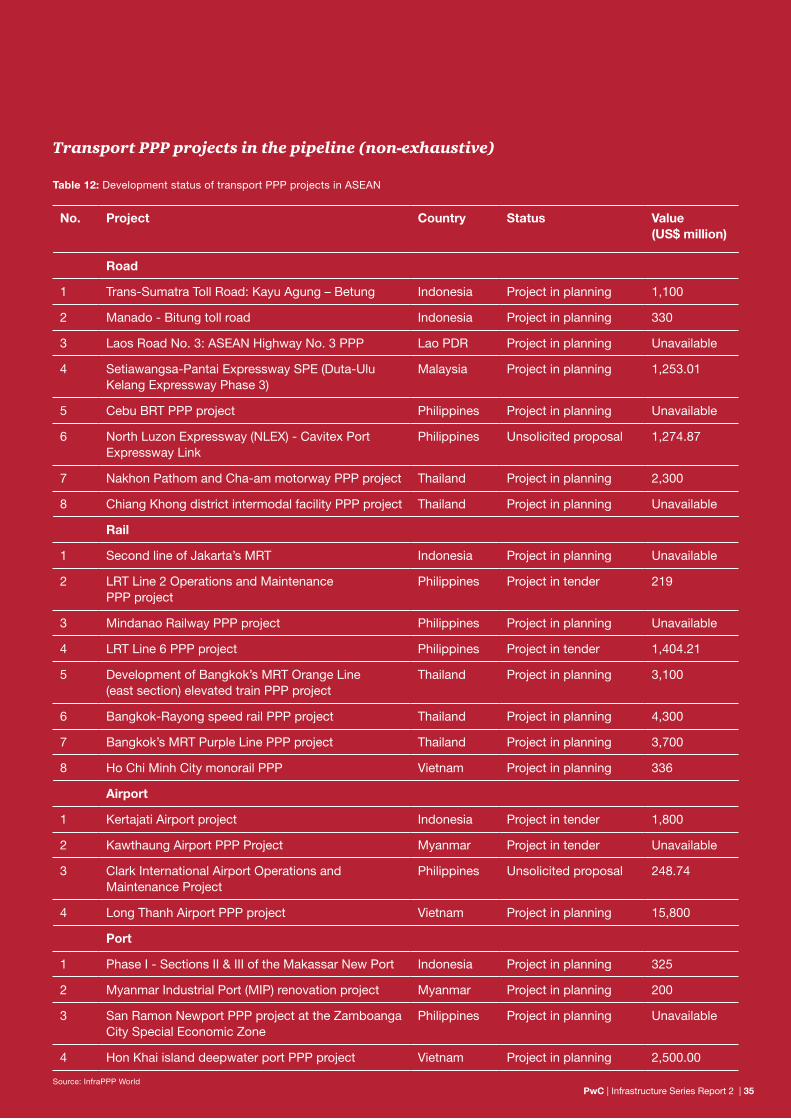
No. Project Country Status Value (US$ million)
Road
1 Trans-Sumatra Toll Road: Kayu Agung – Betung Indonesia Project in planning 1,100
2 Manado - Bitung toll road Indonesia Project in planning 330
3 Laos Road No. 3: ASEAN Highway No. 3 PPP Lao PDR Project in planning Unavailable
4 Setiawangsa-Pantai Expressway SPE (Duta-Ulu Kelang Expressway Phase 3)
Malaysia Project in planning 1,253.01
5 Cebu BRT PPP project Philippines Project in planning Unavailable
6 North Luzon Expressway (NLEX) - Cavitex Port Expressway Link
Philippines Unsolicited proposal 1,274.87
7 Nakhon Pathom and Cha-am motorway PPP project Thailand Project in planning 2,300
8 Chiang Khong district intermodal facility PPP project Thailand Project in planning Unavailable
Rail
1 Second line of Jakarta’s MRT Indonesia Project in planning Unavailable
2 LRT Line 2 Operations and Maintenance PPP project
Philippines Project in tender 219
3 Mindanao Railway PPP project Philippines Project in planning Unavailable
4 LRT Line 6 PPP project Philippines Project in tender 1,404.21
5 Development of Bangkok’s MRT Orange Line (east section) elevated train PPP project
Thailand Project in planning 3,100
6 Bangkok-Rayong speed rail PPP project Thailand Project in planning 4,300
7 Bangkok’s MRT Purple Line PPP project Thailand Project in planning 3,700
8 Ho Chi Minh City monorail PPP Vietnam Project in planning 336
Airport
1 Kertajati Airport project Indonesia Project in tender 1,800
2 Kawthaung Airport PPP Project Myanmar Project in tender Unavailable
3 Clark International Airport Operations and Maintenance Project
Philippines Unsolicited proposal 248.74
4 Long Thanh Airport PPP project Vietnam Project in planning 15,800
Port
1 Phase I - Sections II & III of the Makassar New Port Indonesia Project in planning 325
2 Myanmar Industrial Port (MIP) renovation project Myanmar Project in planning 200
3 San Ramon Newport PPP project at the Zamboanga City Special Economic Zone
Philippines Project in planning Unavailable
4 Hon Khai island deepwater port PPP project Vietnam Project in planning 2,500.00
Source: InfraPPP World
Table 12: Development status of transport PPP projects in ASEAN
Transport PPP projects in the pipeline (non-exhaustive)
PwC | Infrastructure Series Report 2 | 35
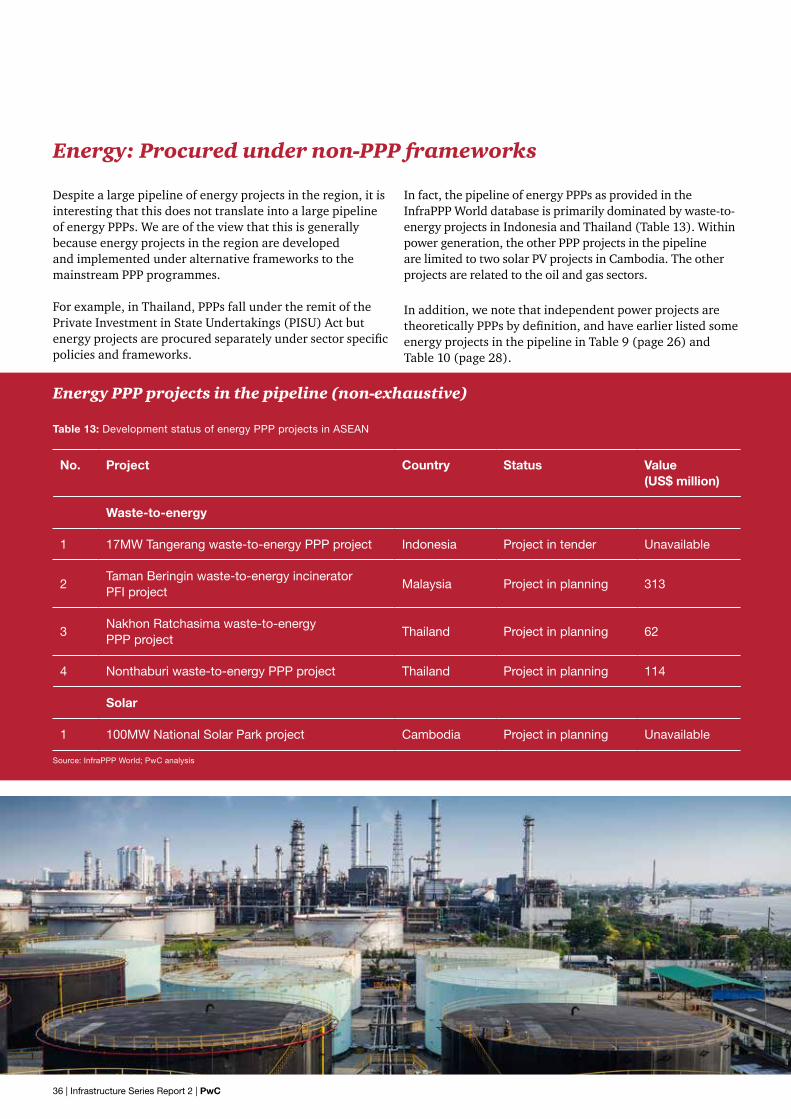
Energy: Procured under non-PPP frameworks
Despite a large pipeline of energy projects in the region, it is interesting that this does not translate into a large pipeline of energy PPPs. We are of the view that this is generally because energy projects in the region are developed and implemented under alternative frameworks to the mainstream PPP programmes.
For example, in Thailand, PPPs fall under the remit of the Private Investment in State Undertakings (PISU) Act but energy projects are procured separately under sector specific policies and frameworks.
In fact, the pipeline of energy PPPs as provided in the InfraPPP World database is primarily dominated by waste-to-energy projects in Indonesia and Thailand (Table 13). Within power generation, the other PPP projects in the pipeline are limited to two solar PV projects in Cambodia. The other projects are related to the oil and gas sectors.
In addition, we note that independent power projects are theoretically PPPs by definition, and have earlier listed some energy projects in the pipeline in Table 9 (page 26) and Table 10 (page 28).
No. Project Country Status Value (US$ million)
Waste-to-energy
1 17MW Tangerang waste-to-energy PPP project Indonesia Project in tender Unavailable
2Taman Beringin waste-to-energy incinerator PFI project
Malaysia Project in planning 313
3Nakhon Ratchasima waste-to-energy PPP project
Thailand Project in planning 62
4 Nonthaburi waste-to-energy PPP project Thailand Project in planning 114
Solar
1 100MW National Solar Park project Cambodia Project in planning Unavailable
Table 13: Development status of energy PPP projects in ASEAN
Source: InfraPPP World; PwC analysis
Energy PPP projects in the pipeline (non-exhaustive)
36 | Infrastructure Series Report 2 | PwC

Water and waste: Driven by urbanisation
Rapid urbanisation in the region is driving the need for increased water supply to meet the basic needs of a growing urban populace. It is also leading to an increased need for solid and liquid waste management and treatment. Indonesia has a large pipeline of drinking water treatment and supply projects across the country. Philippines and
Vietnam follow with a pipeline that includes water supply and waste water treatment projects. The InfraPPP World database lists solid waste management projects in Indonesia and Malaysia as well. Some of these projects are captured in Table 14.
Table 14: Development status of water and waste PPP projects in ASEAN
Source: InfraPPP World
No. Project Country Status Value (US$ million)
Water treatment and supply
1 Jatiluhur II drinking water PPP project Indonesia Project in tender 144
2 Banten drinking water PPP project Indonesia Project in tender 72
3 Desalination plant in Forest City (Johor) on PPP Malaysia Project in planning Unavailable
4 Tacloban city north bulk water supply project Philippines Project in planning Unavailable
5 Singapore’s fifth desalination plant Singapore Project in tender Unavailable
6 West Saigon wastewater treatment plant Vietnam Unsolicited proposal 80
Solid waste management
1Bandung solid waste management improvement in West Java
Indonesia Project in tender 65
Water and waste PPP projects in the pipeline (non-exhaustive)
PwC | Infrastructure Series Report 2 | 37
Chapter 4: What’s next?
The drivers influencing the pipeline of infrastructure projects in ASEAN are rapid economic growth and urbanisation; increasing need for efficient mobility; trade competitiveness; climate change and sustainability; and geopolitics. The influence of these drivers, or a combination of them, has resulted in various initiatives such as:
• Ambitious infrastructure strategic plans and targets announced by governments in ASEAN;
• regional and cross-regional initiatives that aim to integrate and improve connectivity within the region while influencing the geopolitical environment; and
• the push for clean energy by establishing an enabling policy environment and setting aggressive clean energy capacity targets.
This has translated into a strong pipeline of infrastructure projects, particularly in the transport and energy sectors. In transport, we see a continuing shift to rail-based transport over roads given the former’s advantages in transporting people more efficiently in terms of travel time, land take and pollution. In energy, there is clear and significant shift to all forms of renewable energy in a bid to address current and future power generation gaps in the region.
To achieve their ambitious infrastructure investment targets, governments in the region are actively looking to leverage PPPs to mobilise private capital and expertise. Most of the
countries in the region have, or intend to, establish a strong PPP ecosystem and this has translated into a long pipeline of PPP projects. We would, however, like to highlight that not all of the projects in the pipeline are 'investor ready' and can be brought to the market in the short term. In ASEAN, there has historically been a tendency for governments to bring projects to the market too early before proper preparation has been done. While this is understandable, given the developer and investor appetite for more projects and the availability of financing, in the long run, it actually slows down the project procurement timeline and governments risk losing credibility in the marketplace.
That said, to overcome these issues, we hope that ASEAN countries will adopt best practices in infrastructure planning and PPP project preparation processes as explained in our first report of this Infrastructure Series, Understanding infrastructure opportunities in ASEAN (2017). A robust planning and preparation process will ensure that the pipeline of projects is bankable. This will go a long way in building confidence with potential investors, and, when coupled with a strong policy environment, will help in attracting infrastructure investments.
Our third and final report, scheduled for release later in 2018, will cover the financing aspects of infrastructure projects, including developments in the investment landscape and alternative financing sources. Please look forward to it.
38 | Infrastructure Series Report 2 | PwC
Sources
1. BMI2. InfraPPP World3. PPP Knowledge Lab4. Capital Project and Infrastructure Spending: Outlook to 2025,
PwC, 20145. General Statistics Office of Vietnam6. Vietnam’s SEDP 2016-20207. RPJMN 2015-20198. PPP Country Profile – Indonesia, Economic Research Institute
for ASEAN and East Asia, June 20159. “What Are Indonesia's Priority Infrastructure Projects in 2016-
2019?”, Indonesia Investments, 21 June 2016, https://www.indonesia-investments.com/news/todays-headlines/what-are-indonesia-s-priority-infrastructure-projects-in-2016-2019/item6945
10. Overview of Indonesia’s Infrastructure Landscape, Indonesia Investment Coordinating Board, October 2015
11. “President Jokowi’s infrastructure projects: Quantity vs quality”, The Jakarta Post, February 2015
12. Philippine Development Plan 2017-202213. “NEDA rolls out new Philippines development plan”, The
Philippine Star, 4 June 201714. “Industry Trend Analysis - 'Dutertenomics' Infrastructure Focus
To Support Transport Sector”, BMI, May 201715. Enhancing Infrastructure Development for Thailand’s Future
Growth, Board of Investment, Thailand16. Thailand Infrastructure Report Q1 2018, BMI, October 201717. “Alibaba to set up regional logistics hub in Malaysia”, Reuters,
March 2017, https://www.reuters.com/article/us-malaysia-alibaba/alibaba-to-set-up-regional-logistics-hub-in-malaysia-idUSKBN16T0KW
18. Greater Mekong Subregion Economic Cooperation Program, ADB, 2015
19. GMS Information Portal20. Overview of the RIF 2022, ADB, September 201721. SBK Line, MRT Corporation22. SSP Line, MRT Corporation23. LRT 3, Suruhanjaya Pengangkutan Awam Darat (SPAD)24. “Construction starts on Malaysia’s $13bn East Coast Rail Link
project”, Railway Technology, August 2017
25. Pipeline of Projects, PPP Center, Philippines26. Meeting Asia’s Infrastructure Needs, ADB, 201727. The Pink Line, MRTA, http://www.mrta.co.th/en/
projectelectrictrain/pinkline/?AspxAutoDetectCookieSupport=1
28. MRTA Pink Line, Bangkok, Railway Technology, https://www.railway-technology.com/projects/mrta-pink-line-bangkok/
29. “BOI Board approves 4 energy projects”, Board of Investment, Thailand, March 2017
30. Renewable Energy Outlook for ASEAN, IRENA and ACE, 201631. ASEAN Power Cooperation Report, ACE and China Renewable
Energy Engineering Institute, July 201732. “Development of Renewable Energy Outlook for ASEAN – a
REmap 2030 analysis”, ACE, http://www.aseanenergy.org/engagements/development-of-renewable-energy-outlook-for-asean-a-remap-2030-analysis/
33. Mekong Strategic – Switching On; Cambodia’s Path to Sustainable Energy Security
34. Indonesia’ RUPTL, USAID35. ADB36. Malaysia’s National Renewable Energy Policy and Action Plan37. Philippines’ Department of Energy – National Renewable
Energy Program38. Singapore Energy Market Authority39. Thailand’s Alternative Energy Development Plan40. Vietnam’s Power Development Plan41. New Energy Outlook 2017, Bloomberg New Energy Finance,
2017, https://about.bnef.com/new-energy-outlook/42. Global trends in renewable energy investment 2017, UN
Environment Programme and Bloomberg New Energy Finance, 2017
43. 8th Five-Year National Socio-Economic Development Plan (2016-2020), Ministry of Planning and Investment, June 2016
44. Benchmarking PPP Procurement 2017, World Bank and PPIAF, 2017
45. The Global Competitiveness Report 2016-2017, World Economic Forum, 2016
46. Global Infrastructure Hub47. Oxford Economics
PwC | Infrastructure Series Report 2 | 39

At PwC, our purpose is to build trust in society and solve important problems. We’re a network of firms in 157 countries with more than 223,000 people who are committed to delivering quality in assurance, advisory and tax services. Find out more and tell us what matters to you by visiting us at www.pwc.com. This content is for general information purposes only, and should not be used as a substitute for consultation with professional advisors.
© 2018 PwC. All rights reserved. PwC refers to the PwC network and/or one or more of its member firms, each of which is a separate legal entity. Please see www.pwc.com/structure for further details.
170331-172344-JA-OS