SE/IT/PM Estimating Approaches for Service-Oriented ... · Service-Oriented Architecture...
24
SE/IT/PM Estimating Approaches for Service-Oriented Architecture Environments SCEA, June 2008 Hilary Eckberg, Kevin Snyder Northrop Grumman Corporation Presented at the 2008 SCEA-ISPA Joint Annual Conference and Training Workshop - www.iceaaonline.com
Transcript of SE/IT/PM Estimating Approaches for Service-Oriented ... · Service-Oriented Architecture...
SE/IT/PM Estimating Approaches for Service-Oriented Architecture
Environments
SCEA, June 2008
Hilary Eckberg, Kevin SnyderNorthrop Grumman Corporation
Presented at the 2008 SCEA-ISPA Joint Annual Conference and Training Workshop - www.iceaaonline.com
Outline
• Definitions
• Problem statement
• Data set
• Linear approaches– Regression-based CER with y-intercept– Regression-based CER without y-intercept– Simple ratio CER– Compare and contrast
• Nonlinear approach– Time-phasing using Beta curves– Potential issues
• Conclusions
• Next steps
Presented at the 2008 SCEA-ISPA Joint Annual Conference and Training Workshop - www.iceaaonline.com
Definitions
• SE/IT/PM– Systems Engineering, Integration and Test, and Program Management– Refers to the costs of performing the above activities
• PME– Prime Mission Equipment– Refers to software development, hardware development, and COTS software and
hardware purchases
• CER– Cost-Estimating Relationship
• SOA– Service-Oriented Architecture– Refers to a standards-based (e.g., Extensible Markup Language (XML) messaging,
Simple Object Access Protocol (SOAP), etc.) software architecture consisting of an application front-end, services, and an enterprise level service bus
– In layman’s terms: An architecture that allows additional system or functions to easily “plug into” it1
1 For more information on SOAs and cost-estimating challenges, please see “Service Oriented Architecture: SOA How is it Estimated?,”Snyder and McDonald, SCEA 2007
Presented at the 2008 SCEA-ISPA Joint Annual Conference and Training Workshop - www.iceaaonline.com
Problem statement
• Within the Intelligence Community, there is a movement towards breaking down stovepiped architectures and implementing SOAs.– The idea is that new programs will be integrated into an existing SOA
framework, thus allowing data sharing between programs.
• While the SE/IT/PM cost of simply adding PME to an existing system can be modeled using a regression-based CER, at this time the SOA framework is still immature.– The SOA does not have all the capabilities required to accommodate
incoming systems– As such, a program cannot simply “plug ‘n’ play” into the SOA framework.– Frequently some reengineering of the SOA must occur to accommodate a
new program, so a new program cannot simply capitalize on capabilities that are already there
• We are faced with the question: How do we estimate the SE/IT/PM costs of these new programs plugging into an immature SOA?
Presented at the 2008 SCEA-ISPA Joint Annual Conference and Training Workshop - www.iceaaonline.com
Data set
• Two sets of cost data corresponding to unique services– One service hardware-intensive, the other software-intensive
• Cost account data organized by quarter and WBS for the entire development period of both functions– Both services on the same contract, but separate WBS numbers were used
for the two services
• Costs were then mapped to SE/IT/PM or PME for each service– Contractor confirmed mappings are appropriate and accurate
Presented at the 2008 SCEA-ISPA Joint Annual Conference and Training Workshop - www.iceaaonline.com
Linear approach
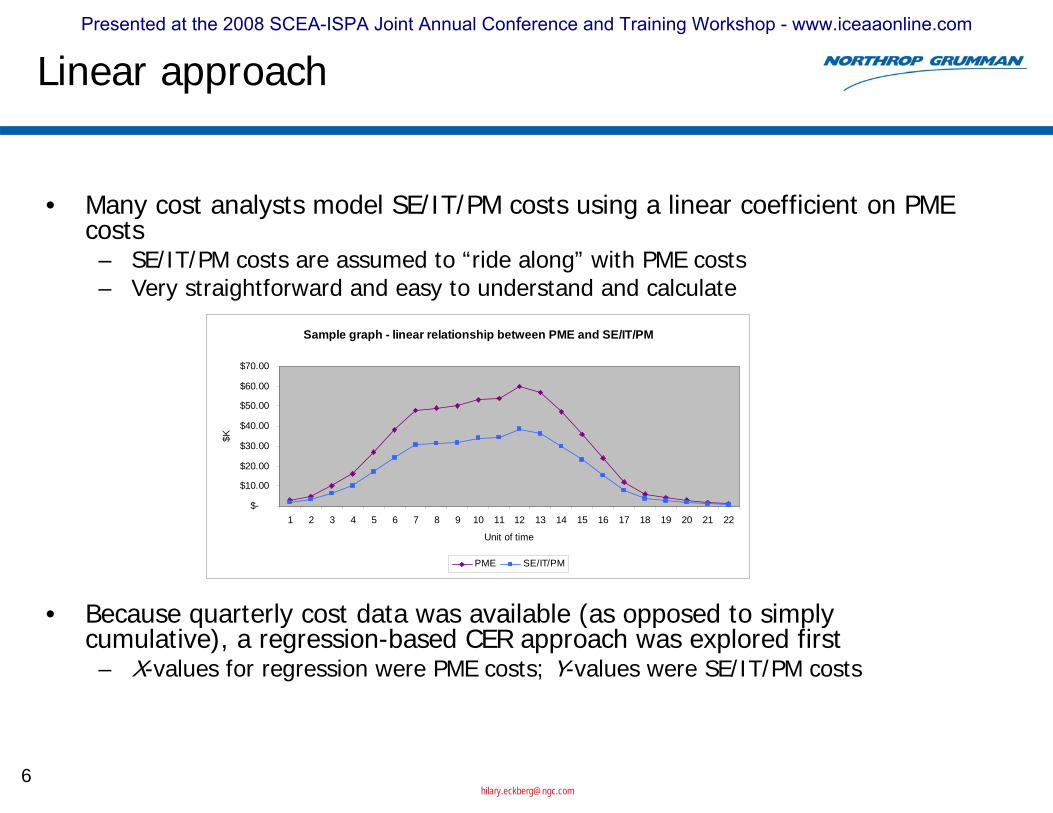
• Many cost analysts model SE/IT/PM costs using a linear coefficient on PME costs– SE/IT/PM costs are assumed to “ride along” with PME costs– Very straightforward and easy to understand and calculate
• Because quarterly cost data was available (as opposed to simply cumulative), a regression-based CER approach was explored first– X-values for regression were PME costs; Y-values were SE/IT/PM costs
Sample graph - linear relationship between PME and SE/IT/PM
$-
$10.00
$20.00
$30.00
$40.00
$50.00
$60.00
$70.00
1 2 3 4 5 6 7 8 9 10 11 12 13 14 15 16 17 18 19 20 21 22
Unit of time
$K
PME SE/IT/PM
Presented at the 2008 SCEA-ISPA Joint Annual Conference and Training Workshop - www.iceaaonline.com
Linear approach: Regression-based CER:Analysis results (with y-intercept)
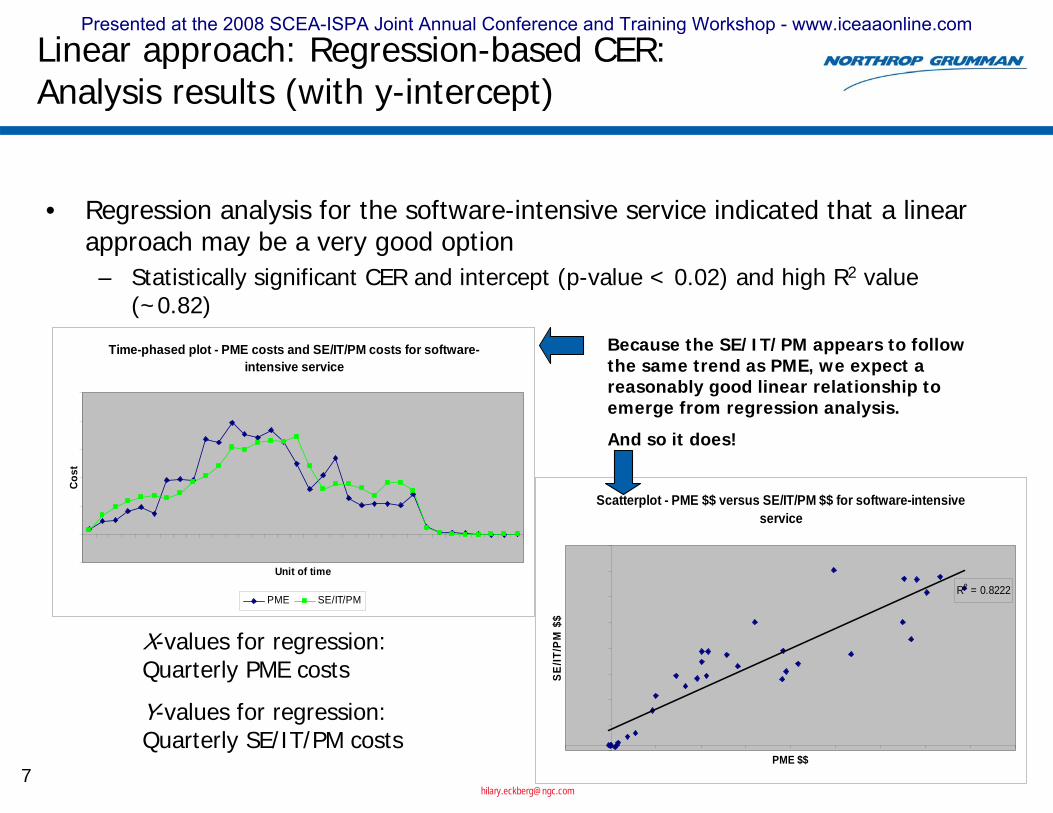
• Regression analysis for the software-intensive service indicated that a linear approach may be a very good option– Statistically significant CER and intercept (p-value < 0.02) and high R2 value
(~0.82)
Because the SE/IT/PM appears to follow the same trend as PME, we expect a reasonably good linear relationship to emerge from regression analysis.
And so it does!
X-values for regression: Quarterly PME costs
Y-values for regression: Quarterly SE/IT/PM costs
Time-phased plot - PME costs and SE/IT/PM costs for software-intensive service
Unit of time
Cos
t
PME SE/IT/PM
Scatterplot - PME $$ versus SE/IT/PM $$ for software-intensive service
R2 = 0.8222
PME $$
SE/IT
/PM
$$
Presented at the 2008 SCEA-ISPA Joint Annual Conference and Training Workshop - www.iceaaonline.com
Linear approach: Regression-based CER:Analysis results (with y-intercept)
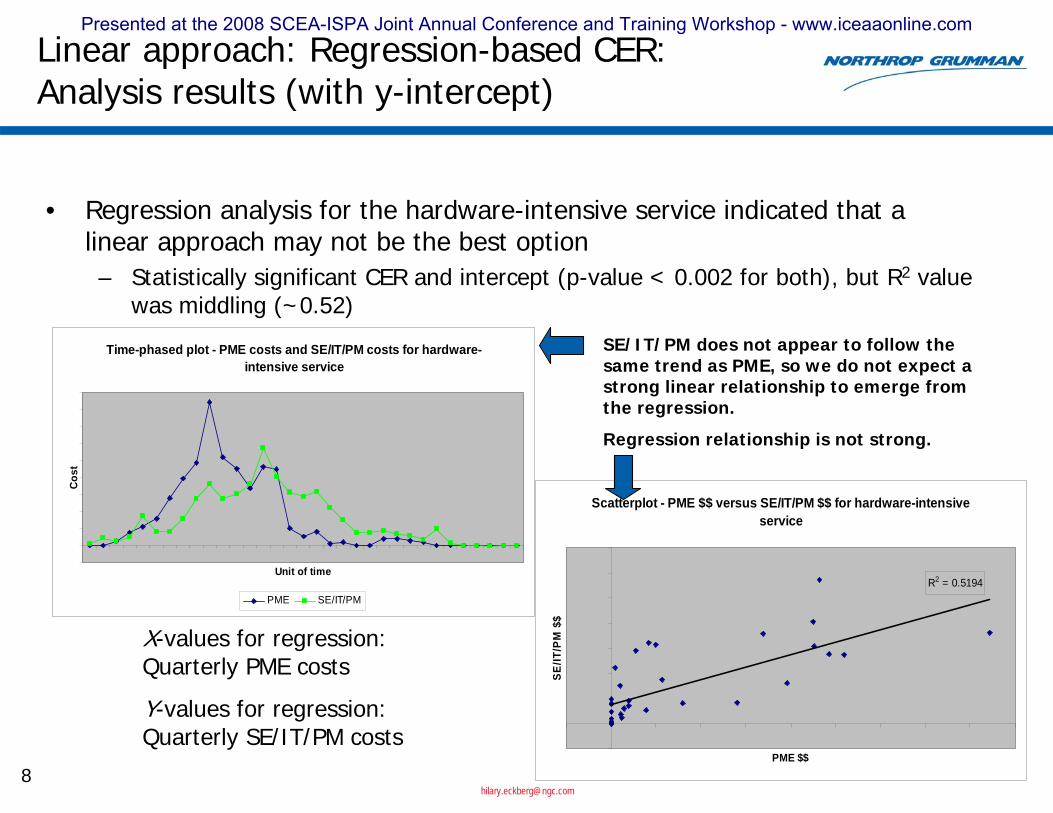
• Regression analysis for the hardware-intensive service indicated that a linear approach may not be the best option– Statistically significant CER and intercept (p-value < 0.002 for both), but R2 value
was middling (~0.52)
Time-phased plot - PME costs and SE/IT/PM costs for hardware-intensive service
Unit of time
Cos
t
PME SE/IT/PM
Scatterplot - PME $$ versus SE/IT/PM $$ for hardware-intensive service
R2 = 0.5194
PME $$
SE/IT
/PM
$$
SE/IT/PM does not appear to follow the same trend as PME, so we do not expect a strong linear relationship to emerge from the regression.
Regression relationship is not strong.
X-values for regression: Quarterly PME costs
Y-values for regression: Quarterly SE/IT/PM costs
Presented at the 2008 SCEA-ISPA Joint Annual Conference and Training Workshop - www.iceaaonline.com
Linear approach: Regression-based CER:Concern about the coefficient
• The coefficient of a regression equation is “the change in the mean of the probability distribution of Y per unit increase in X”2
– In this case, it is the additional incremental SE/IT/PM cost of adding PME to the existing system or framework
– Ideally, this is all we would need to estimate SE/IT/PM costs for a program “plugging into” an existing SOA framework
• However, the SOA framework in question, as mentioned previously,is not a mature framework– To date each program hoping to utilize the existing framework has had to
take into consideration both of the following:• The costs associated with the additional PME it is bringing in• The costs for updates and changes to the framework to allow it to “plug in”
– Because it is tied only to new PME, the coefficient of the regression will not capture these costs
2 Applied Linear Regression Models, Kutner, Nachtsheim, and Neter, fourth edition
Presented at the 2008 SCEA-ISPA Joint Annual Conference and Training Workshop - www.iceaaonline.com

Linear approach: Regression-based CER:Concern about the intercept
• The intercept of a regression equation is “the mean of the probability distribution of Y at X = 0”3
– The meaning of the y-intercept can be difficult or even impossible to determine
– Many statisticians will tell you it has no meaning at all4
– If we needed to estimate the cost of developing a new framework analogous to this one, we could use both the coefficient and the intercept to do so
• However, while the framework is not fully mature, programs integrating into the framework can still “leverage” functionality already in place in the framework– If we use the intercept and the coefficient to estimate the costs of a
program “plugging into” the framework, we will dramatically overestimate the SE/IT/PM costs
3 Kutner, et al4 For more information, please see “’To b or not to b’: The y-intercept in cost estimation,”Coleman, Summervile, Braxton, Cullis, and Druker, SCEA 2007
Presented at the 2008 SCEA-ISPA Joint Annual Conference and Training Workshop - www.iceaaonline.com
Linear approach: Simple ratio CER:Analysis
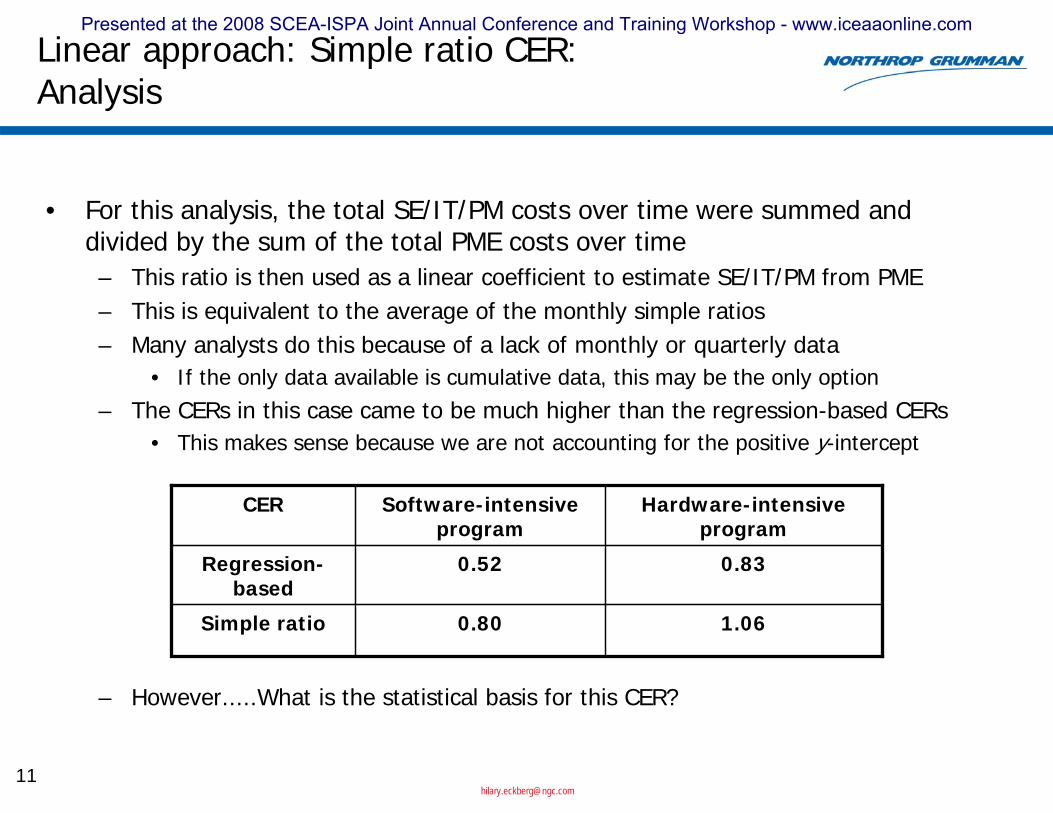
• For this analysis, the total SE/IT/PM costs over time were summed and divided by the sum of the total PME costs over time– This ratio is then used as a linear coefficient to estimate SE/IT/PM from PME– This is equivalent to the average of the monthly simple ratios– Many analysts do this because of a lack of monthly or quarterly data
• If the only data available is cumulative data, this may be the only option– The CERs in this case came to be much higher than the regression-based CERs
• This makes sense because we are not accounting for the positive y-intercept
– However.....What is the statistical basis for this CER?
Simple ratio
Regression-based
CER
1.060.80
0.830.52
Hardware-intensive program
Software-intensive program
Presented at the 2008 SCEA-ISPA Joint Annual Conference and Training Workshop - www.iceaaonline.com
Linear approach: Simple ratio CER:Concerns
• Practically speaking, there is no statistical basis for this CER– Intuitively, we believe that there must be a relationship between PME and
SE/IT/PM– However, this analysis forces a relationship where one may not exist, or
may exist in a different form
• However...– This method provides a higher CER and therefore more of a cushion to
account for costs not captured in the regression-based CER• For a program plugging into an immature SOA framework, this could help
account for the SE/IT/PM costs associated with reengineering the SOA to accommodate the new program
– The higher costs are linked to PME, while use of the y-intercept of the regression would not be
– It’s iffy but it’s conservative
Presented at the 2008 SCEA-ISPA Joint Annual Conference and Training Workshop - www.iceaaonline.com
Compare and contrast
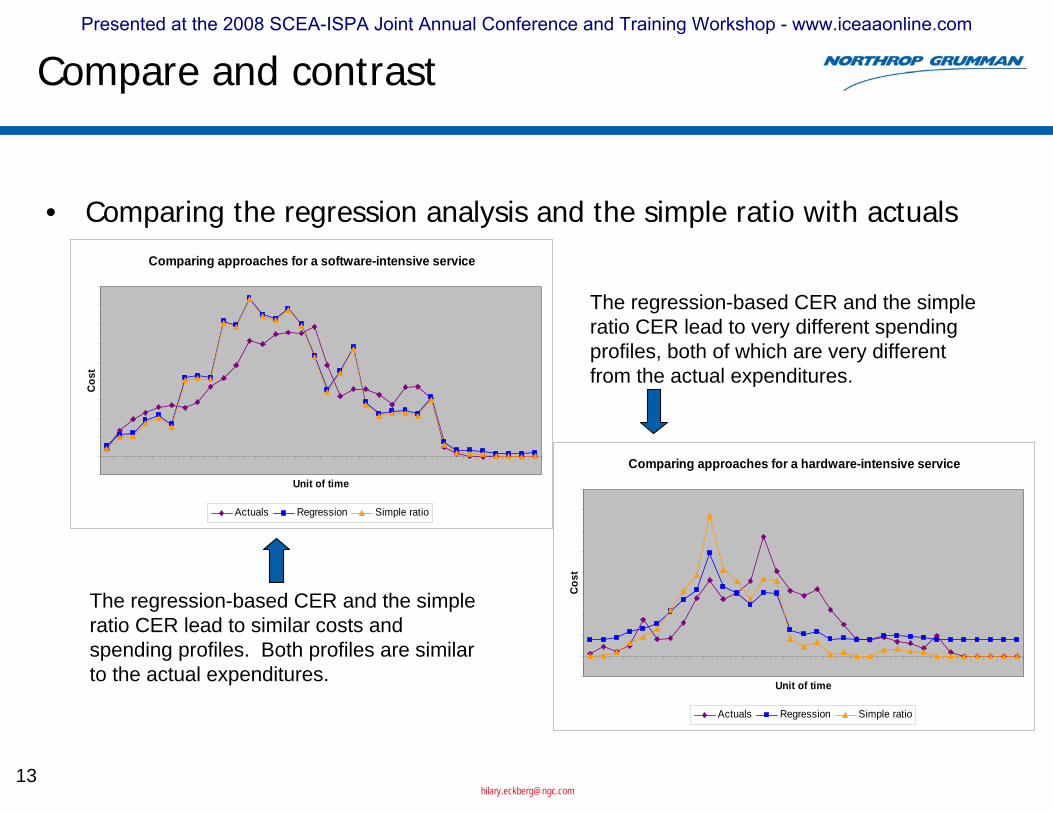
• Comparing the regression analysis and the simple ratio with actualsComparing approaches for a software-intensive service
Unit of time
Cost
Actuals Regression Simple ratio
Comparing approaches for a hardware-intensive service
Unit of time
Cost
Actuals Regression Simple ratio
The regression-based CER and the simple ratio CER lead to similar costs and spending profiles. Both profiles are similar to the actual expenditures.
The regression-based CER and the simple ratio CER lead to very different spending profiles, both of which are very different from the actual expenditures.
Presented at the 2008 SCEA-ISPA Joint Annual Conference and Training Workshop - www.iceaaonline.com
Nonlinear approach: Time-phasing using Beta curves
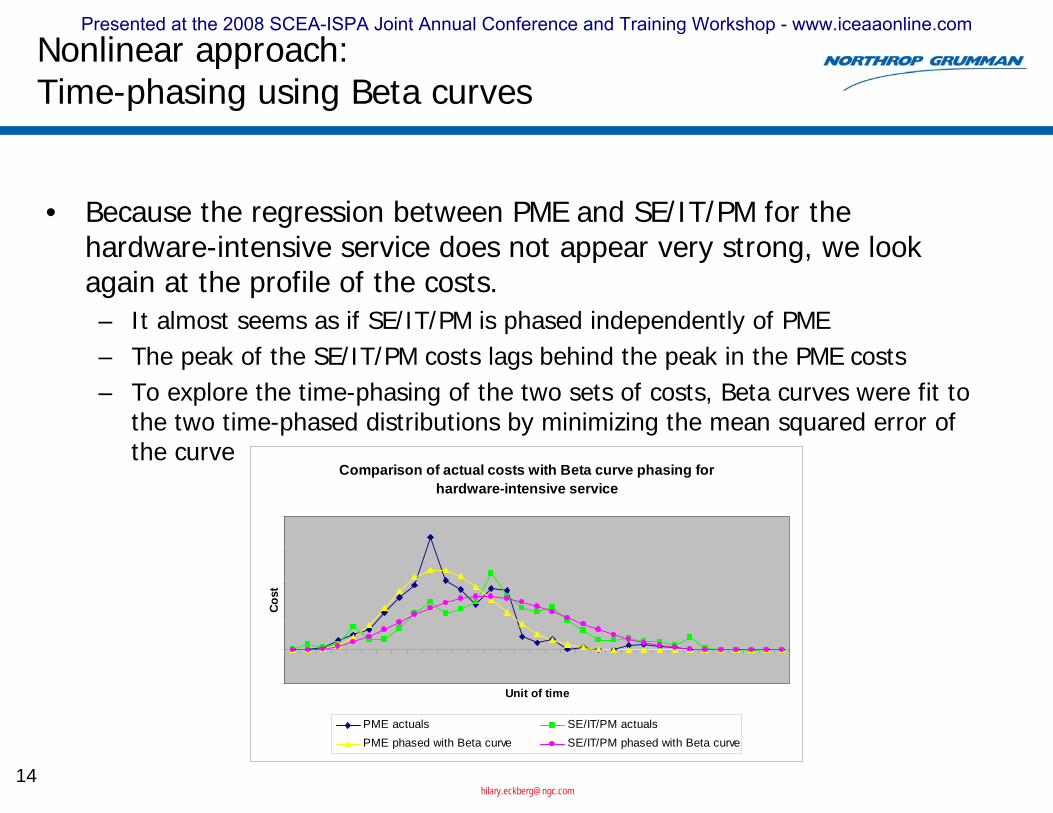
• Because the regression between PME and SE/IT/PM for the hardware-intensive service does not appear very strong, we look again at the profile of the costs.– It almost seems as if SE/IT/PM is phased independently of PME– The peak of the SE/IT/PM costs lags behind the peak in the PME costs– To explore the time-phasing of the two sets of costs, Beta curves were fit to
the two time-phased distributions by minimizing the mean squared error of the curve
Comparison of actual costs with Beta curve phasing for hardware-intensive service
Unit of time
Cost
PME actuals SE/IT/PM actualsPME phased with Beta curve SE/IT/PM phased with Beta curve
Presented at the 2008 SCEA-ISPA Joint Annual Conference and Training Workshop - www.iceaaonline.com
Nonlinear approach: Time-phasing using Beta curves
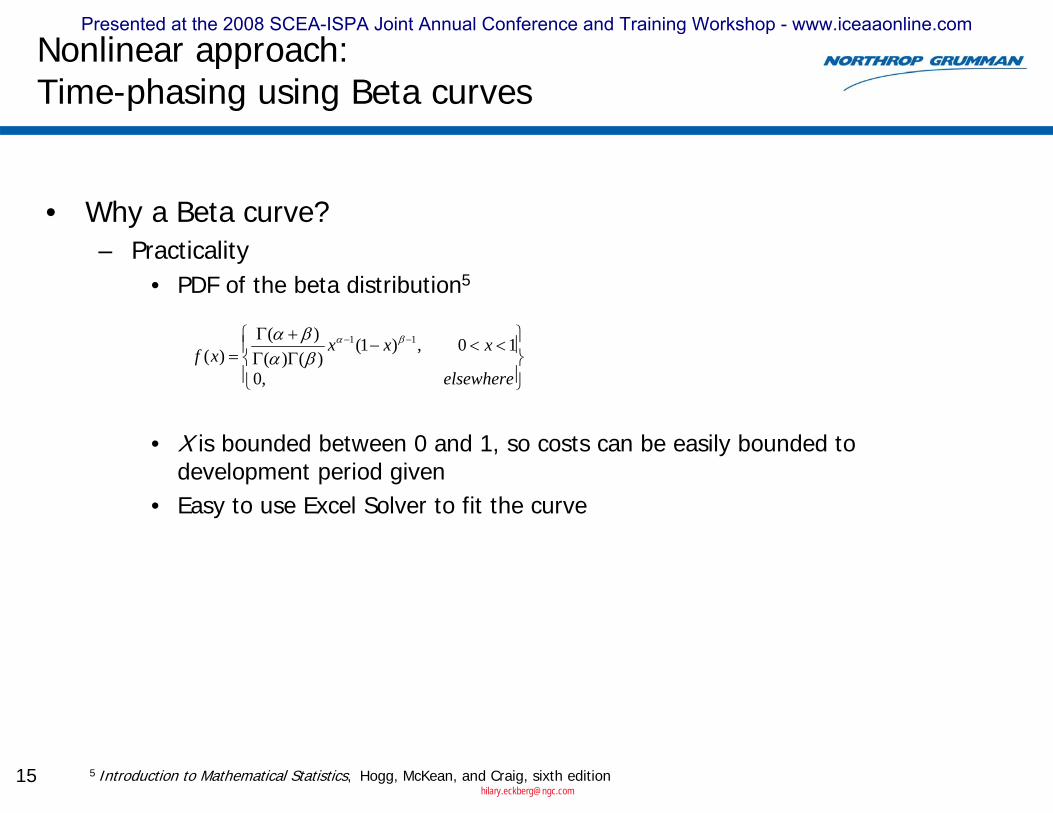
• Why a Beta curve?– Practicality
• PDF of the beta distribution5
• X is bounded between 0 and 1, so costs can be easily bounded to development period given
• Easy to use Excel Solver to fit the curve
⎪⎭
⎪⎬⎫
⎪⎩
⎪⎨⎧ <<−
ΓΓ+Γ
=−−
elsewhere
xxxxf,0
10,)1()()()(
)(11 βα
βαβα
5 Introduction to Mathematical Statistics, Hogg, McKean, and Craig, sixth edition
Presented at the 2008 SCEA-ISPA Joint Annual Conference and Training Workshop - www.iceaaonline.com
Nonlinear approach: Time-phasing using Beta curves
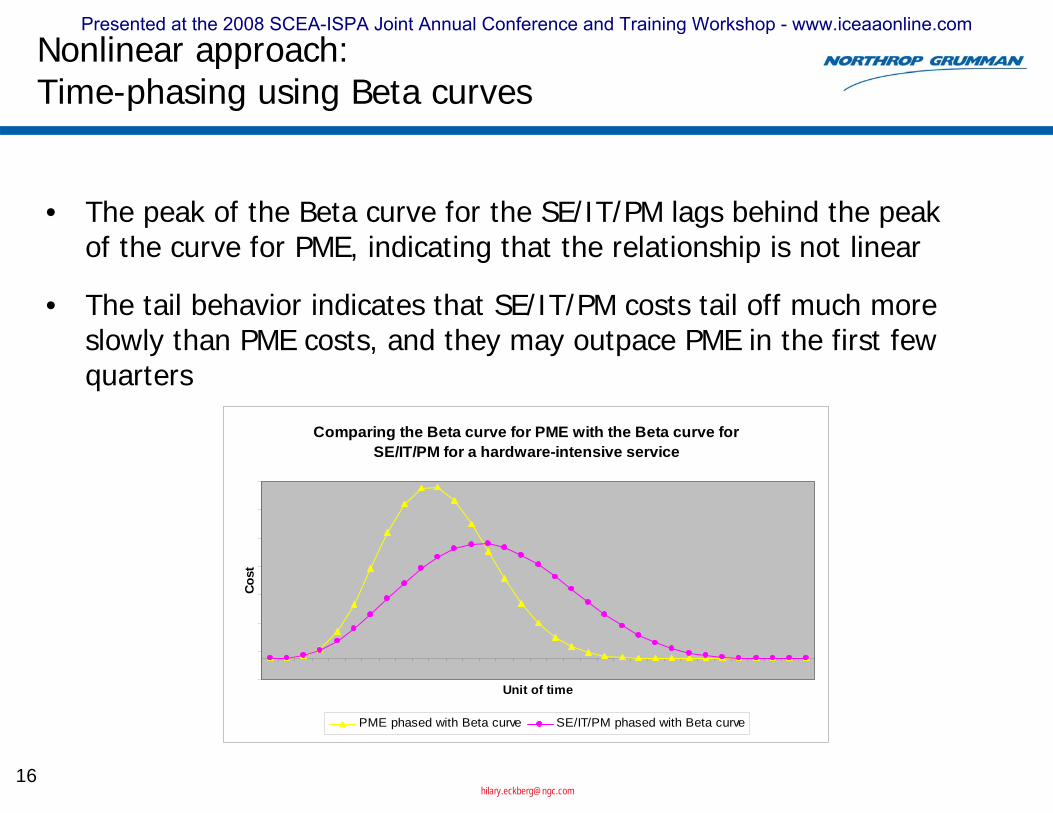
• The peak of the Beta curve for the SE/IT/PM lags behind the peakof the curve for PME, indicating that the relationship is not linear
• The tail behavior indicates that SE/IT/PM costs tail off much more slowly than PME costs, and they may outpace PME in the first fewquarters
Comparing the Beta curve for PME with the Beta curve for SE/IT/PM for a hardware-intensive service
Unit of time
Cost
PME phased with Beta curve SE/IT/PM phased with Beta curve
Presented at the 2008 SCEA-ISPA Joint Annual Conference and Training Workshop - www.iceaaonline.com
Nonlinear approach: Time-phasing using Beta curves
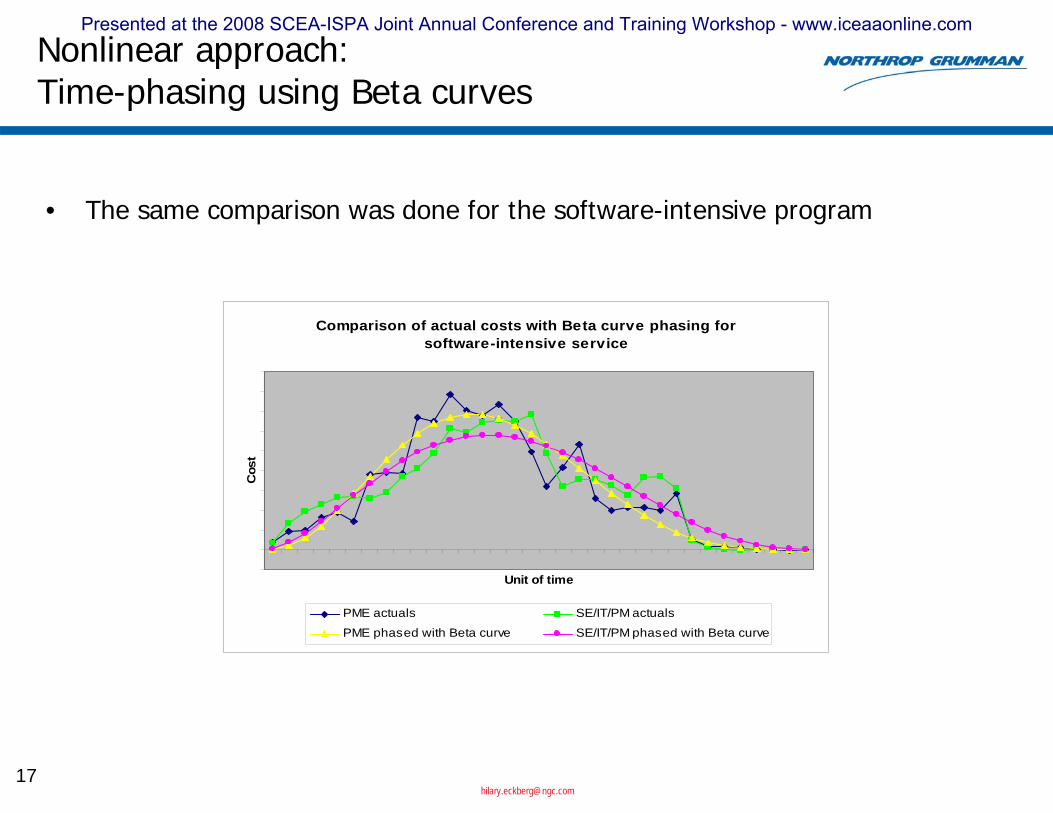
• The same comparison was done for the software-intensive program
Comparison of actual costs with Beta curve phasing for software-intensive service
Unit of time
Cos
t
PME actuals SE/IT/PM actuals
PME phased with Beta curve SE/IT/PM phased with Beta curve
Presented at the 2008 SCEA-ISPA Joint Annual Conference and Training Workshop - www.iceaaonline.com
Nonlinear approach: Time-phasing using Beta curves
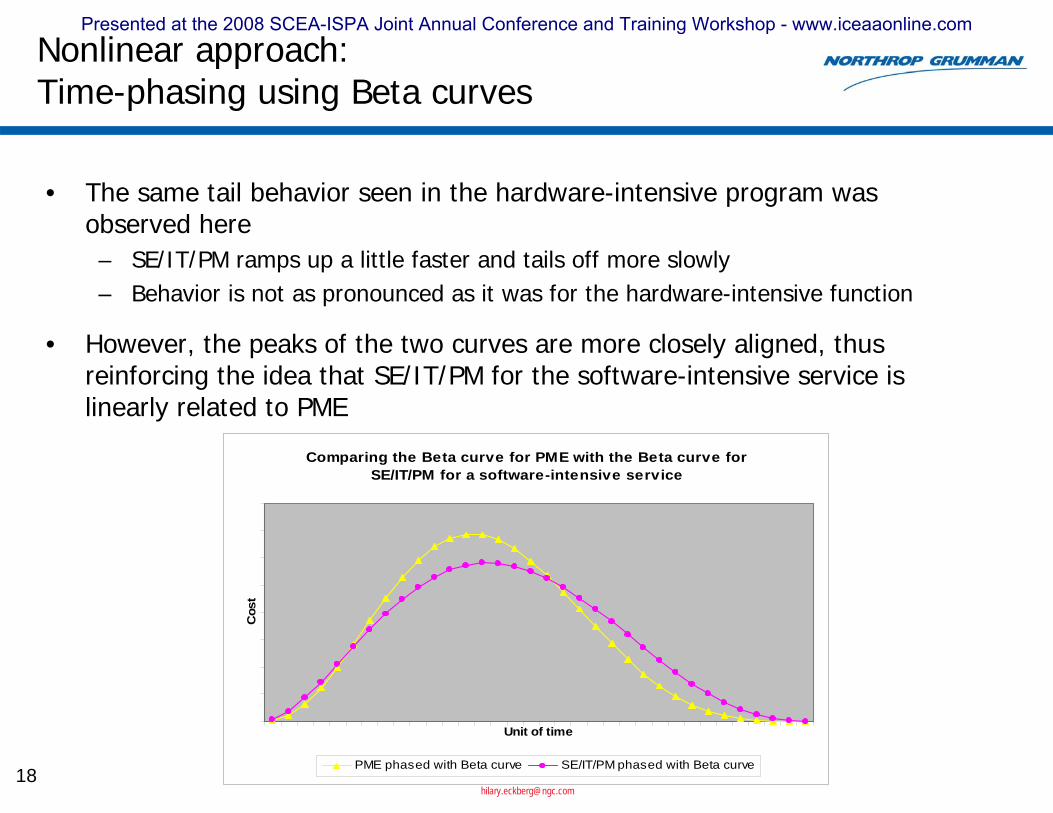
• The same tail behavior seen in the hardware-intensive program was observed here– SE/IT/PM ramps up a little faster and tails off more slowly– Behavior is not as pronounced as it was for the hardware-intensive function
• However, the peaks of the two curves are more closely aligned, thus reinforcing the idea that SE/IT/PM for the software-intensive service is linearly related to PME
Comparing the Beta curve for PME with the Beta curve for SE/IT/PM for a software-intensive service
Unit of time
Cos
t
PME phased with Beta curve SE/IT/PM phased with Beta curve
Presented at the 2008 SCEA-ISPA Joint Annual Conference and Training Workshop - www.iceaaonline.com

Nonlinear approach: Time-phasing using Beta curves
• Points of interest when comparing the four curves– Note how close the curves for SE/IT/PM are for the two different services– Note how close the curve for PME for the software-intensive service is to
the SE/IT/PM curves– Why is the PME for the hardware-intensive service so different?
Comparing Beta curves across services
0
0.02
0.04
0.06
0.08
0.1
0.12
0.14
Unit of Time
Perc
enta
ge
HW-intensive service PME phased w ith Beta curve HW-intensive service SE/IT/PM phased w ith Beta curve
SW-intensive service PME phased w ith Beta curve SW-intensive service SE/IT/PM phased w ith Beta curve
Presented at the 2008 SCEA-ISPA Joint Annual Conference and Training Workshop - www.iceaaonline.com
Nonlinear approach: Potential issues
• How can the analyst use a nonlinear approach?– Setting up the Beta curve phasing is not difficult
• Estimate the total SE/IT/PM cost• Calculate the percentage of SE/IT/PM per time period• Multiply
– However....How does an analyst estimate the total SE/IT/PM cost?• Simple ratio approach using PME
– As mentioned, no statistical basis
• Other basis?
Presented at the 2008 SCEA-ISPA Joint Annual Conference and Training Workshop - www.iceaaonline.com
Conclusions
• A regression-based CER for estimating SE/IT/PM based on PME for integrating into an immature SOA will fail to account for SE/IT/PM costs incurred for modifying the SOA to accommodate the new program in the event that the SOA does not have the services thenew program requires.
• For a hardware-intensive service, a linear approach to estimating SE/IT/PM costs based in PME costs may not be appropriate.– Analysts should remember that regression does not tell the whole story
Presented at the 2008 SCEA-ISPA Joint Annual Conference and Training Workshop - www.iceaaonline.com
Next steps
• Conduct similar analysis on more data sets– Different services– Different contracts
• Normalize data to account for bulk buys (i.e. COTS purchases)
• Look for alternatives to PME for basis for SE/IT/PM costs
Presented at the 2008 SCEA-ISPA Joint Annual Conference and Training Workshop - www.iceaaonline.com
Questions?Presented at the 2008 SCEA-ISPA Joint Annual Conference and Training Workshop - www.iceaaonline.com

Presented at the 2008 SCEA-ISPA Joint Annual Conference and Training Workshop - www.iceaaonline.com