Seismology Measuring the Interior-3
15
Solid Earth Geophysics Ali Oncel [email protected] Department of Earth Sciences KFUPM Today’s class: Seismology Measuring the Interior Reading: Fowler Chapter 4
-
Upload
ali-osman-oencel -
Category
Technology
-
view
984 -
download
1
Transcript of Seismology Measuring the Interior-3

Solid Earth Geophysics
Department of Earth SciencesKFUPM
Today’s class: Seismology Measuring the InteriorReading: Fowler Chapter 4
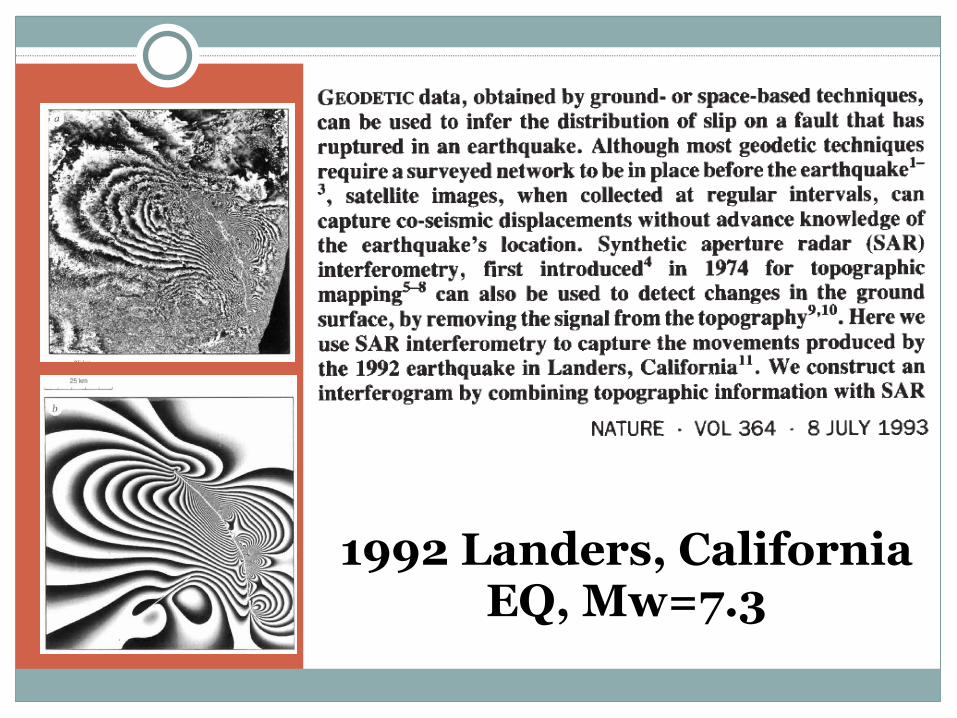
1992 Landers, California EQ, Mw=7.3

Earthquake Mechanisms
Compression and Dilation
ompression: P-wave first motion up
ilatation: P-wave first motion down
P and T axes
irectivity for Compression
irectivity for Tension
Moment Tensors
-D representation of faulting Encompasses the moment (energy)From: modified after http://quake.usgs.gov/recenteqs/beachball.htm

First Motions
the push or pull is recorded on seismogram as either an upward or downward displacement of the arrival of P-wave …look at ‘first motion’ of P-wave on seismogram
Look at first motions from many geographically dispersed seismograms to identify quadrants of compression, dilatation and delineate nodal planes
from: http://www.geo.lsa.umich.edu/~crlb/COURSES/270

..use equal area lower hemisphere projection (stereonet)
Station reports location relative to focus: Azimuth: relative to focus Angle of incidence: between ray vector and vertical
Azimuth and angle of incidence plot on net and first motion noted
From: Kearey and Vine, 1996
From: Rowland and Duebendorfer, 1994
Focal Mechanism
source
receiver
North
center

The angle of incidence, which often called the take-off angle, at the earthquake source is the angle from the vertical at which the ray leaves source, and thus the angle at which the ray intersects the lower hemisphere (Fig.4.2-8 of Stein and Wysession, 2003).
How is distance related to take-off angle?

Source: Stein and Wysession (2003) After Pho and Behe (1972)

Plotting Station LocationsExample 1: Plot seismograph station (azimuth N40°E from the earthquake; angle of first motion ray or take-off angle i= 60°) on an equal-area projection
Fig. 4.2.13 of Stein and Wysession, 2003South
North

Homework: First Motion Polarities Due to May 2
Go to site:http://www.seismo.unr.edu/ftp/pub/louie/class/333/mechanism.html
The data is what you could take from:http://www.seismo.unr.edu/ftp/pub/louie/class/333/weber-seis.pdf
Plot Polarities over the Steronet see Examples on Page 137, Fowler, 2005.
Interpreting Focal Mechanism see example in Fig.4.30 of Fowler’s book


Lon Lat Dist, km176.35° -40.250° 3.403
176.17° -40.292° 14.414
176.37° -40.061° 19.072
176.28° -40.408° 20.154
176.06° -40.106° 25.886
176.47° -40.453° 27.993
176.63° -40.339° 29.118
176.09° -40.429° 29.880
176.27° -40.618° 43.544
176.81° -39.989° 48.965
176.35° -39.699° 59.008
176.88° -39.665° 78.454
176.82° -39.541° 87.502
The Stations

Source: Stein and Wysession, 2003

Stresses Driven Faulting
From: http://earth.leeds.ac.uk/learnstructure/index.htm
Anderson’s theory of faulting
See pp.402, Bolt and Bullen
T
P

P=Maximum Compressive StressT=Minimum Compressive Stress
Stress Orientations
Source: Stein and Wysession, 2003

Let’s come back to discuss earthquake fault mechanism
b d