
Seismic Risk Assessment of Liquid Storage Tanks via a...
22
EARTHQUAKE ENGINEERING AND STRUCTURAL DYNAMICS Earthquake Engng Struct. Dyn. (2017) Published online XX in Wiley InterScience (www.interscience.wiley.com). DOI: XX Copyright © 2017 John Wiley & Sons, Ltd. Seismic Risk Assessment of Liquid Storage Tanks via a Nonlinear Surrogate Model Konstantinos Bakalis 1,*,† , Dimitrios Vamvatsikos 1 and Michalis Fragiadakis 1 1 School of Civil Engineering, Institute of Steel Structures, National Technical University of Athens, Greece SUMMARY A performance-based earthquake engineering approach is developed for the seismic risk assessment of fixed-roof atmospheric steel liquid storage tanks. The proposed method is based on a surrogate single-mass model that consists of elastic beam-column elements and nonlinear springs. Appropriate component and system-level damage states are defined, following the identification of commonly observed modes of failure that may occur during an earthquake. Incremental Dynamic Analysis and simplified Cloud are offered as potential approaches to derive the distribution of response parameters given the seismic intensity. A parametric investigation that engages the aforementioned analysis methods is conducted on three tanks of varying geometry, considering both anchored and unanchored support conditions. Special attention is paid to the elephant’s foot buckling formation, by offering extensive informa tion on its capacity and demand representation within the seismic risk assessment process. Seismic fragility curves are initially extracted for the component-level damage states, in order to compare the effect of each analysis approach on the estimated performance. The subsequent generation of system-level fragility curves reveals the issue of non-sequential damage states, whereby significant damage may abruptly appear without precursory lighter damage states. KEY WORDS: liquid storage tanks; uncertainty; performance-based earthquake engineering; fragility; demand; capacity; 1. INTRODUCTION Oil and gas products are generally stored in large-capacity atmospheric tanks. Safeguarding the integrity of such industrial facilities against earthquakes is vital not only for maintaining the flow of essential products and energy resources, but also for preventing any associated socioeconomic consequences of a potential disruption [1]. Ensuring an “appropriate” level of safety tantamount to the importance of liquid storage tanks, mandates the use of state-of-the- art seismic performance assessment techniques that take into account all possible sources of * Correspondence to: Konstantinos Bakalis, National Technical University of Athens, 9 Iroon Polytechneiou, Athens 15780, Greece. † E-mail: [email protected]
Transcript of Seismic Risk Assessment of Liquid Storage Tanks via a...

EARTHQUAKE ENGINEERING AND STRUCTURAL DYNAMICS
Earthquake Engng Struct. Dyn. (2017)
Published online XX in Wiley InterScience (www.interscience.wiley.com). DOI: XX
Copyright © 2017 John Wiley & Sons, Ltd.
Seismic Risk Assessment of Liquid Storage Tanks via a Nonlinear
Surrogate Model
Konstantinos Bakalis 1,*,†, Dimitrios Vamvatsikos1 and Michalis Fragiadakis1
1 School of Civil Engineering, Institute of Steel Structures, National Technical University of Athens, Greece
SUMMARY
A performance-based earthquake engineering approach is developed for the seismic risk
assessment of fixed-roof atmospheric steel liquid storage tanks. The proposed method is based
on a surrogate single-mass model that consists of elastic beam-column elements and nonlinear
springs. Appropriate component and system-level damage states are defined, following the
identification of commonly observed modes of failure that may occur during an earthquake.
Incremental Dynamic Analysis and simplified Cloud are offered as potential approaches to
derive the distribution of response parameters given the seismic intensity. A parametric
investigation that engages the aforementioned analysis methods is conducted on three tanks of
varying geometry, considering both anchored and unanchored support conditions. Special
attention is paid to the elephant’s foot buckling formation, by offering extensive information on
its capacity and demand representation within the seismic risk assessment process. Seismic
fragility curves are initially extracted for the component-level damage states, in order to
compare the effect of each analysis approach on the estimated performance. The subsequent
generation of system-level fragility curves reveals the issue of non-sequential damage states,
whereby significant damage may abruptly appear without precursory lighter damage states.
KEY WORDS: liquid storage tanks; uncertainty; performance-based earthquake engineering;
fragility; demand; capacity;
1. INTRODUCTION
Oil and gas products are generally stored in large-capacity atmospheric tanks. Safeguarding the
integrity of such industrial facilities against earthquakes is vital not only for maintaining the
flow of essential products and energy resources, but also for preventing any associated
socioeconomic consequences of a potential disruption [1]. Ensuring an “appropriate” level of
safety tantamount to the importance of liquid storage tanks, mandates the use of state-of-the-
art seismic performance assessment techniques that take into account all possible sources of
* Correspondence to: Konstantinos Bakalis, National Technical University of Athens, 9 Iroon Polytechneiou,
Athens 15780, Greece. † E-mail: [email protected]

2 K. BAKALIS, D. VAMVATSIKOS AND M. FRAGIADAKIS
Copyright © 2017 John Wiley & Sons, Ltd. Earthquake Engng Struct. Dyn. (2017)
DOI: XX
uncertainty. Nevertheless, the assessment methodology typically undertaken by engineers is
based on design code regulations/provisions and can be summarised in a prescriptive approach
that may deliver some acceptable (but actually unknown) level of accuracy, by engaging into a
deterministic process where blanket safety factors [2,3] are employed to approximately deliver
the required reliability.
In an attempt to rationalise seismic design and assessment procedures, the concept of
Performance-based Earthquake Engineering (PBEE) has emerged [4], thus facilitating a logical
decision-making process that relies on the probability of exceeding certain capacity thresholds
that even make sense to non-engineers [5]. Typically, the procedure begins with the seismic
hazard analysis [6], where ground motion parameters (e.g. peak ground acceleration, PGA)
known as seismic intensity measures (IM) are characterised in terms of mean annual frequency
(MAF) by taking into account all potential earthquake scenarios on the site of interest. It may
also be used to identify the scenarios that contribute most to the site-hazard and thus select
ground motion records suitable for the structural response analysis. Of essence in this case is
the estimation of the distribution of certain engineering demand parameters (EDPs, e.g. stress,
strain, displacement) conditioned on the seismic intensity. Different analysis methodologies can
be carried out to derive it, and the choice generally relies on a trade-off between accuracy and
computational burden. Normally, one can employ Incremental Dynamic Analysis (IDA) [7] for
a wide range of ground motion records and seismic intensity levels, to obtain a refined
representation of the EDP-IM space, bearing in mind that this analysis approach does not allow
rigorous record selection to cover up any IM-related deficiencies in terms of sufficiency [8].
Closely related is the stripe analysis [9] where different records may be employed at each IM
level to improve upon an insufficient IM [10]. Cloud analysis may similarly be employed using
even unscaled records, but requiring some global or local regression in post-processing, plus
perhaps some logistic regression to take care of collapse (i.e. global instability) points where
non-convergence appears [9]. The subsequent damage analysis conveniently summarises the
EDP distributions into fragility functions [11], thus assigning probabilities of exceedance on
certain damage state (DS) or limit state (LS) capacity thresholds. The aforementioned quantities
are finally translated into decision variables through the loss analysis that relies on cost data for
repair, downtime and casualties, with respect to the damage states examined [12]. The final
output is normally in the form of the MAF exceeding a (usually monetary) threshold of interest
that engages facility owners and stakeholders into comprehensive mitigation actions.
As much as PBEE has reached a mature state for plenty of mainstream civil engineering
structures (e.g. buildings, bridges), there are hardly any provisions regarding its application to
industrial equipment structures [13]. Parameters such as the geometry, the toxicity/flammability
of the stored materials, and the intrinsic failure modes, make the problem substantially different
from buildings or bridges, as the post-earthquake impact may span from operational costs only,
to uncontrollable environmental consequences that are often triggered due to the potential
leakage of the stored materials [13–15]. The devastating outcome of earthquake events such as
Kocaeli (1999) and Tohoku (2011), further enhances the view that comparatively little attention
has been paid to liquid storage tanks, even from an academic perspective. Previous research
efforts may be summarised to a fragility-based methodology using either costly finite element
models [16,17], or available observational (i.e., historical or empirical) data as shown by
O’Rourke and So [18]. Empirical fragility curves are also provided by Salzano et al. [19] using
the probit function to fit the available data, while Berahman and Behnamfar [20] adopt a
Bayesian approach to predict the associated probability of exceedance. Analytical fragility
curves for oil storage tanks are available by Iervolino et al. [21], yet they only cover a single
failure mode despite the consideration of various geometric characteristics that affect the
SEISMIC RISK ASSESSMENT OF LIQUID STORAGE TANKS VIA A SURROGATE MODEL 3
Copyright © 2017 John Wiley & Sons, Ltd. Earthquake Engng Struct. Dyn. 2017
DOI: XX
dynamic response of the tank. Other studies [22,23] compare large sets of analytical results to
observational ones, while there is at least one attempt to extend this train of thought to the entire
plant level [24], where fragility curves from various industrial structures (e.g. atmospheric
tanks, pressure vessels) should appropriately be combined to estimate the associated risk.
In any case, from a performance-based point of view, there are several pieces in the existing
literature (e.g. structural modelling, damage classification, cost assessment) that are either
missing or not adequately substantiated to properly translate the analysis output into decision-
making variables for liquid storage tanks. Bearing in mind that the individual steps of the PBEE
process are all equally important, this work emphasises the structural response and damage (or
fragility) analysis that are of particular interest to structural engineers. In specific, it offers an
approach that respects proper uncertainty propagation from all pertinent sources and is based
on a three-dimensional (3D) surrogate model, appropriate for efficiently running multiple
nonlinear response-history analyses, while also allowing to distinguish parts of the tank to offer
different levels of damage resolution: Either localised to individual segments and components
or generalised to refer to the entire structure, as needed.
2. MODELLING OF LIQUID STORAGE TANKS
Adopting the PBEE concept for the case of liquid storage tanks requires a series of tasks to be
tackled before the MAF of exceeding a specified LS capacity is estimated. Of particular concern
is the modelling of such complex structural systems. The fluid-structure-interaction, for
instance, imposes several constraints related to the computational effort required, and despite
the evolution of computer technology, explicitly modelling the contained fluid and the
associated contact properties with the tank shell results in costly finite element models. Given
that the number of scenarios considered within a performance-based framework is often
significantly larger compared to that of code-based methodologies (e.g. 3 or 7 nonlinear
response history analyses according to Eurocode 8 [25], vis-à-vis 40-60 analyses for
performance assessment [7,9]), simpler surrogate models are required for PBEE applications.
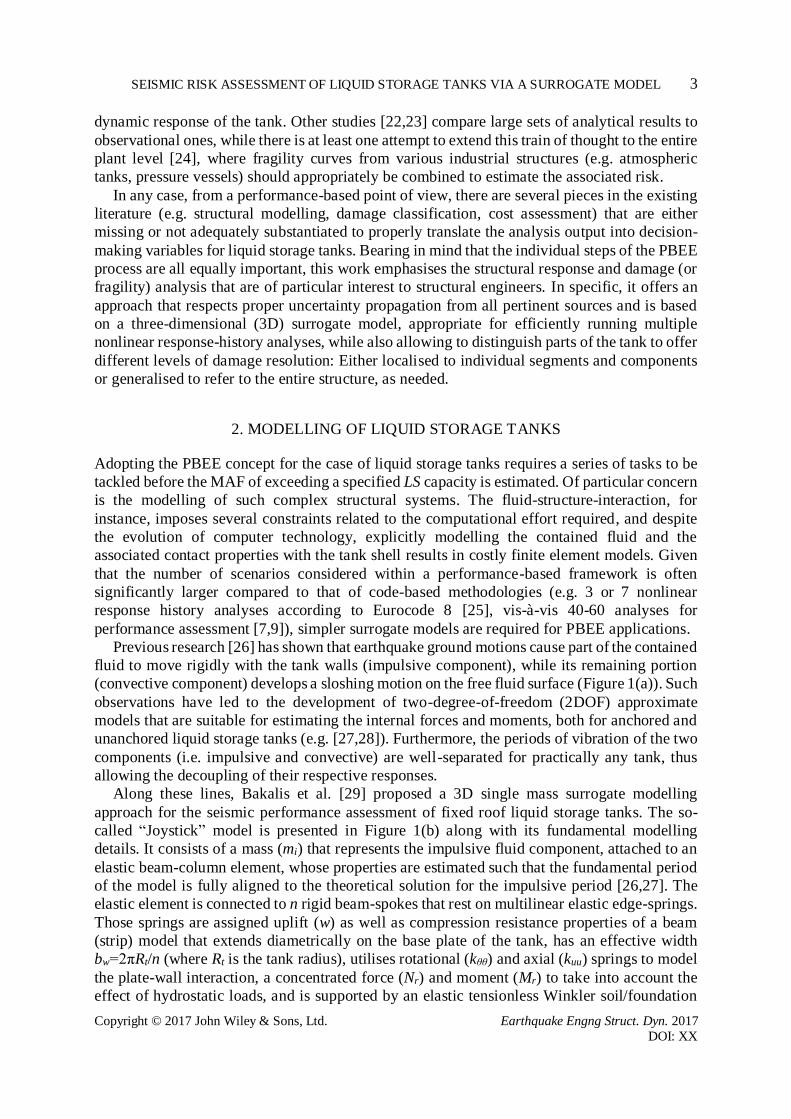
Previous research [26] has shown that earthquake ground motions cause part of the contained
fluid to move rigidly with the tank walls (impulsive component), while its remaining portion
(convective component) develops a sloshing motion on the free fluid surface (Figure 1(a)). Such
observations have led to the development of two-degree-of-freedom (2DOF) approximate
models that are suitable for estimating the internal forces and moments, both for anchored and
unanchored liquid storage tanks (e.g. [27,28]). Furthermore, the periods of vibration of the two
components (i.e. impulsive and convective) are well-separated for practically any tank, thus
allowing the decoupling of their respective responses.
Along these lines, Bakalis et al. [29] proposed a 3D single mass surrogate modelling
approach for the seismic performance assessment of fixed roof liquid storage tanks. The so-
called “Joystick” model is presented in Figure 1(b) along with its fundamental modelling
details. It consists of a mass (mi) that represents the impulsive fluid component, attached to an
elastic beam-column element, whose properties are estimated such that the fundamental period
of the model is fully aligned to the theoretical solution for the impulsive period [26,27]. The
elastic element is connected to n rigid beam-spokes that rest on multilinear elastic edge-springs.
Those springs are assigned uplift (w) as well as compression resistance properties of a beam
(strip) model that extends diametrically on the base plate of the tank, has an effective width
bw=2πRt/n (where Rt is the tank radius), utilises rotational (kθθ) and axial (kuu) springs to model
the plate-wall interaction, a concentrated force (Nr) and moment (Mr) to take into account the
effect of hydrostatic loads, and is supported by an elastic tensionless Winkler soil/foundation
4 K. BAKALIS, D. VAMVATSIKOS AND M. FRAGIADAKIS
Copyright © 2017 John Wiley & Sons, Ltd. Earthquake Engng Struct. Dyn. (2017)
DOI: XX
[29,30] (Figure 1(c)). Essentially, the “Joystick” model is a two-stage model that requires the
execution of the base-plate strip model “pre-analysis” step (Figure 1(c)) to determine the
properties of the “Joystick” model edge-springs (e.g. vertical force (V) versus uplift, separation
length (L), etc.). While the “pre-analysis” step requires a few minutes to complete, the
“Joystick” model has the ability to perform response history analysis using multiple ground
motion components in seconds, without repeating the relatively time-consuming “pre-analysis”
step when a different ground motion record or scale factor is adopted. It is also able to take the
effect of the anchor bolts into account, simply by modifying the aforementioned edge-springs
through a damageable gap-material, the stiffness of which corresponds to the equally-spaced
anchor bolts found on the effective width of each beam-spoke (bw). Sliding may also be
similarly incorporated using suitable friction elements. Overall, the simplified nature of the
“Joystick” model offers the ability to model practically any cylindrical liquid storage
configuration, regardless of geometry, support conditions and material/fluid properties.
Figure 1: (a) Impulsive versus convective fluid component, failure modes and system-level damage state classification on a fixed roof liquid storage tank. Depending on the presence of anchors, the system is either anchored or unanchored. (b) The “Joystick” surrogate model [29] and its deflected shape. (c) The strip model under tensile and compressive loading.
3. FAILURE MODES
An important consideration for the PBEE application is the ability of simplified models to
capture all major modes of failure that may be developed locally on the structural system.

SEISMIC RISK ASSESSMENT OF LIQUID STORAGE TANKS VIA A SURROGATE MODEL 5
Copyright © 2017 John Wiley & Sons, Ltd. Earthquake Engng Struct. Dyn. 2017
DOI: XX
Regardless of support conditions (i.e. anchored or unanchored), commonly observed modes of
failure on liquid storage tanks involve fracture of the base plate due to extreme base plate plastic
rotations (θpl), buckling of the tank shell and sliding. These modes of failure derive from the
liquid storage system’s trend during ground motion shaking to overturning. As seismic waves
arrive on site, the impulsive fluid component imposes pressure on the tank walls, causing
excessive overturning moments on the system that may in turn lead to sliding and/or partial
uplift of the base plate. The latter results in large-strain deformations on the plate-wall junction
that may rupture the base plate. At the same time, the compressive side of the tank suffers from
a biaxial stress condition, generated by the compressive meridional and tensile hoop
components, which may lead to an elastic-plastic buckling failure. The latter exhibits a
characteristic bulge along a considerable part on the tank’s circumference, also known as the
Elephant’s Foot Buckling (EFB). For the case of anchored tanks, damage on the anchor bolts
constitutes another potential failure mode. Fracturing of the anchors is also affected by the
impulsive-component-induced overturning, as the tension developed on the bolts may often
exceed their prescribed ultimate strength and ductility. Note that although anchored liquid
storage systems are usually considered fully fixed to the ground, their actual performance can
incorporate some rocking/uplift, especially when the anchor bolts begin to yield or fracture. At
this point, part of the base plate is uplifted and the response gradually resembles that of the
corresponding unanchored case [29]. The convective fluid component on the other hand,
determines any kind of damage related to the upper courses of the tank walls and the roof. It is
also known to offer additional overturning moments at the base of the system, but its
contribution with respect to the impulsive component is marginal for the majority of non-
slender tanks, and as a result it is often ignored. The failure modes outlined above are depicted
in Figure 1(a).
4. ENGINEERING DEMAND PARAMETERS
Capturing the potential failure modes using surrogate models requires a series of failure criteria
to be considered, which are expressed as a function of the engineering demand parameters
(EDPs) available from the model output. Such criteria are discussed herein for all the
aforementioned modes of failure with the exception of sliding, as it requires some elaborate
knowledge of the nozzle geometry and mechanical properties. The general view regarding the
criteria adopted for the seismic risk assessment of a structure, is that they should remain
objective (i.e. neither conservative nor unconservative). In the following, although certain code
equations are employed, it should be noted that most of them were presented prior to publication
of the codes considered and were not necessarily intended for code-based design. Apparently,
the methodology could easily be modified upon the availability of more refined criteria.
4.1. Base plate and wall-to-base connection
The deflected shape of the “Joystick” model (Figure 1(b)), reveals its ability to simulate the
uplift mechanism of liquid storage systems, which provides an indirect mapping to local EDPs
through the base plate strip model (Figure 1(c)). For instance, the base plate plastic rotation can
be estimated using either direct measurements from the simplified uplift response analysis of
the base plate strip [29,30], or with the aid of the Eurocode 8-4 [2] equation
t
plR
w
L
w
2
2 , (1)

6 K. BAKALIS, D. VAMVATSIKOS AND M. FRAGIADAKIS
Copyright © 2017 John Wiley & Sons, Ltd. Earthquake Engng Struct. Dyn. (2017)
DOI: XX
where w is the base uplift and L is the uplifted part of the tank. Note that Eurocode 8-4
provisions suggest a maximum permissible θpl value of 0.2rad, while experimental studies
suggest that this value is overly conservative, proposing a fracture capacity of 0.4rad instead
[31]. Actually, these values are proposed under the condition that fracture occurs outside the
weld that connects the plate to the tank wall; therefore, if a weak weld is suspected to be present,
the rotational θpl capacity may need to be reduced.
4.2. Anchorage
Anchorage failure is governed by yielding or fracture of the respective anchor bolts. There are
many ways to express this kind of failure (e.g. stress, strain, displacement), and most times the
choice of the appropriate EDP relies on the structural model that has been chosen to predict the
response. When the “Joystick” model [29] is adopted, response of the anchor bolts may be
estimated through the base uplift that essentially determines their deformation/elongation (δ).
Failure may then be captured by assuming that the entire number of anchor bolts corresponding
to each spoke (i.e. those along an arc length equal to bw) are uniformly stressed and respond
elastoplastically with a yield-displacement strength (δy) and fracture-displacement capacity (δu)
consistent with the connection ductility.
4.3. Sloshing
Sloshing damage is triggered upon the exceedance of the available freeboard df, (Figure 1(a)),
i.e. the available clearance of the free fluid surface (at rest) to the roof. The response is purely
dominated by the maximum convective wave height (d) developed during the earthquake.
Given the elastic treatment of this problem, Eurocode 8-4 offers the following simplified
equation for the sloshing response prediction
gTSRd fcat ,84.0 , (2)
where g is the gravity acceleration and Sa(Tc, κf) the convective period elastic response spectrum
acceleration for an appropriately defined fluid damping (e.g. κf=0.5% for water [2], bearing in
mind that more sophisticated solutions exist [32]). API-650 [3] also adopts a similar equation
using an acceleration coefficient for sloshing wave height calculation in place of the
0.84Sa(Tc,κf) term.
4.4. Elephant’s Foot Buckling
Elephant’s Foot Buckling depends on the compressive meridional stress demand (σm)
developed on the tank shell. This mode of failure is slightly more complex to determine, as the
edge-spring force (N) recorded from the “Joystick” model must be converted to stress before it
is compared to a critical buckling limit (σEFB). The latter may be estimated, for instance,
according to Rotter’s [33] formula (also adopted by Eurocode 8-4 [2]) as
1
250
12.1
111
15.11r
fr
rft
pR y
yw
tcEFB (3)
t
wc
R
tE6.01 (4)
SEISMIC RISK ASSESSMENT OF LIQUID STORAGE TANKS VIA A SURROGATE MODEL 7
Copyright © 2017 John Wiley & Sons, Ltd. Earthquake Engng Struct. Dyn. 2017
DOI: XX
400
wt tRr (5)
E is the steel elastic Young’s modulus, fy the corresponding yield strength, tw the wall thickness,
σc1 the ideal critical buckling stress for cylinders loaded in axial compression and p the
maximum interior pressure acting on the tank wall. The interior pressure is the direct sum of
the hydrostatic (ph) and impulsive component (pi). The latter may be estimated by adopting a
cylindrical coordinate system, using the non-dimensional coordinates ξ (radial), ζ (height), φ
(angle), as:
tAhCtp ffii cos,,,, (6)
Ci is a function that provides the distribution of pi along the tank elevation, ρf is the fluid density,
hf the contained fluid height and A(t) is the impulsive mass absolute acceleration response
history [34]. As a side note, the EFB check should not be limited to the lower course of the tank
shell where the maximum interior pressure occurs, but should rather be extended to the entire
tank elevation, especially when the wall thickness is not uniform. Although one could derive a
simple relationship for the stress distribution over height, this step may be ignored as in most
cases the lowest course is the most critical one.
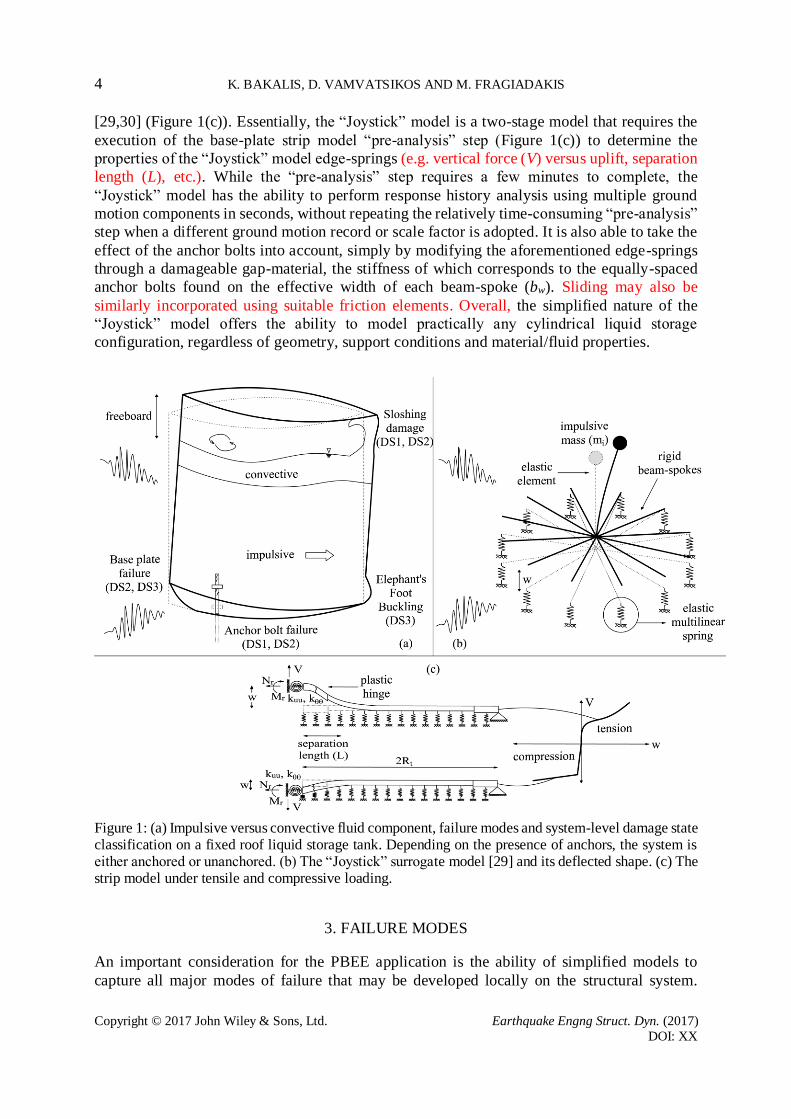
Figure 2: EFB violation check using the “Joystick” model instantaneous demand and deterministic capacity estimates.
4.5. Special considerations for EFB
4.5.1 EFB conditioned on the ground motion record
Eq. (3) provides a useful approximation to assess the occurrence of EFB. Still, its accurate
application is not as simple since the stress limit (σEFB) provided is a decreasing function of the
impulsive pressure (Eq. (6)) at each location (φ), and thus the absolute acceleration demand
(and hence the seismic intensity). According to Eq. (3)- (6), EFB stress capacity is both location
and time-dependent, and so is the corresponding stress demand. Thus, at every time step, σm(t)
and σEFB(t) need to be evaluated for each edge-spring on the “Joystick” model, effectively
discretising the continuous tank wall (as well as the associated checks) into n positions. It should
be noted that the EFB demand appears to be more sensitive to the base plate discretisation, thus
requiring a number of 30-60 spokes, as opposed to other global response parameters (e.g. uplift)
where only 8 spokes [29,35] are sufficient. In general, as the tank radius grows, the number of
spokes should be increased to achieve a better discretisation, and a good rule of thumb would

8 K. BAKALIS, D. VAMVATSIKOS AND M. FRAGIADAKIS
Copyright © 2017 John Wiley & Sons, Ltd. Earthquake Engng Struct. Dyn. (2017)
DOI: XX
be to target at least an arc length of 2-3m for each spoke.
For a given fraction of time, each evaluation consists of estimating the vector-sum of the
longitudinal and transverse component response accelerations (i.e. Ax(t), Ay(t)) and its
orientation (i.e. θ(t)), vis-à-vis the earthquake (EQ) “X” and “Y” axes (Figure 2). Using Eq. (6),
this results in the instantaneous pressure for each spoke located at an angle φ from the vector
of A(t). The sum of pi and ph determine the instantaneous σEFB(t) capacity of any single spoke.
Conversely, the strip model (Figure 1(c)) demand of compressive axial force N(t) at each edge-
spring, divided by the corresponding tank wall cross-section, provides the local stress demand
σm(t). Assuming no further uncertainties enter into the estimation of σEFB(t), a straightforward
comparison among σm(t) and σEFB(t) determines violation as shown in Figure 3 for the case of
a squat tank, the properties of which are summarised in Table 1 among other configurations
that will later be examined.
(a) (b)
Figure 3: IM, record and spoke-specific EFB capacity versus demand response histories for the unanchored tank A (Table 1): (a) intersection among time-dependent demand and capacity signals EFB; (b) EFB capacity is not exceeded even though the associated time-independent maximum demand and minimum capacity indicate so.
Capturing EFB becomes more complex when capacity dispersion appears due to uncertainty.
Given the time dependence of EFB capacity and demand, the EFB probability of exceedance
for a given record, IM level and spoke becomes the union of the individual probabilities of EFB
occurring at any single moment of time. To avoid a cumbersome bookkeeping and post-
processing procedure where entire σm(t) and σEFB(t) response histories would need to be
assessed, the simpler peak “demand-over-capacity” ratio exceeding unity is preferred (Figure
3). Evidently, the peak σm(t)/σEFB(t) ratio provides the demand and capacity values that should
be recorded for each spoke during every nonlinear response history analysis.
spokerecord|IM
t
tspokerecord|IM
EFB
m
t,, 1maxP,, EFBP
(7)
The vertical component of the ground motion has not been considered in the analyses, yet the
model framework can easily accommodate it. A preliminary investigation showed that the
effect of vertical acceleration was evident on the EFB capacity only (not on any demand), and
then for specific tanks and ground motion records. Overall, only tank B (Table 1) showed some
sensitivity, becoming more prone to EFB damage.

SEISMIC RISK ASSESSMENT OF LIQUID STORAGE TANKS VIA A SURROGATE MODEL 9
Copyright © 2017 John Wiley & Sons, Ltd. Earthquake Engng Struct. Dyn. 2017
DOI: XX
4.5.2 Extent of damage
Of potential interest is also the extent of EFB damage, as according to studies based on detailed
finite element models (e.g. [16,29]) it is highly unlikely that the examined buckling mode of
failure is restrained to small arc lengths covered by a single beam-spoke. Figure 4(a), compares
the EFB capacity for a given IM level and record to the corresponding demand along the
circumference of the tank. It seems that although the buckling zone spreads on a significant
number of beam spokes, there are several locations where the capacity has not been reached.
Lengthwise, buckling spreads on two nearly identical (as well as symmetrical) subzones, a fact
that is indicative of the system’s tendency (in this case) to rock along a maximum response axis.
Obviously, these results should be interpreted in tandem with experimental or finite element
analysis results, as the weakening of the tank wall, not captured by the “Joystick” model, may
indeed promote the spread of buckling beyond our simpler estimates.
4.5.3 EFB conditioned on the IM level
Figure 4(b) illustrates the EFB capacity and demand along the circumference of the tank, for a
given earthquake intensity, using a set of 135 large-magnitude ordinary (i.e. non pulsive, non
long-duration) ground motion pairs obtained from the PEER-NGA database [36]. The
considerable variability revealed for the capacity as well as the demand indicates that there are
certain records where capacity is not exceeded at any part of the tank, others where it is
exceeded everywhere, and some that follow the partial violation pattern shown in Figure 4(a).
One may also notice the effect of directionality that derives from the combination of
longitudinal and transverse earthquake components in time (Figure 2), determining a different
axis of maximum demand for each ground motion pair.
(a) (b)
Figure 4: EFB capacity versus demand stresses (in MPa) along the circumference of the unanchored tank A (Table 1), conditioned on PGA= 0.30g: (a) single record pair and (b) 135 record pairs.
4.5.4 EFB on the IDA plane
A better understanding regarding the detailed representation of EFB may be obtained through
IDA [7], for the record suite previously adopted. The results shown in Figure 5(a) display the
single-record (pair) IDA curves using the meridional stress as an appropriate EDP and the peak
ground acceleration (PGA) as a representative IM. It should be noted that the response history
analysis is performed using both longitudinal and transverse ground motion accelerograms
(Figure 2), which implies that a unique scale factor has been applied on both accelerograms for

10 K. BAKALIS, D. VAMVATSIKOS AND M. FRAGIADAKIS
Copyright © 2017 John Wiley & Sons, Ltd. Earthquake Engng Struct. Dyn. (2017)
DOI: XX
each ground motion pair and that the PGA refers to the geometric mean of the two. The light-
coloured solid lines form the demand for an arbitrary edge-spring on the “Joystick” model,
while the dark dashed ones depict the associated buckling capacity variability for the given
range of IM levels. The initial buckling capacity at rest (i.e. for a PGA=0) refers to the static
load case of the liquid storage system, where the maximum internal pressure equals the
corresponding hydrostatic. For larger PGA estimates, the impulsive pressure adds on to the
hydrostatic component on the compressive side of the tank, which results in a significant
reduction of the EFB capacity. Intersection among capacity and demand curves for each record
provides the individual EFB limit state capacity points.
Figure 5(b) shows a more comprehensive representation of EFB. In particular, the entire
capacity-demand space is presented through the single-record IDAs for every beam-spoke that
forms the base plate of the “Joystick” model. EFB capacity points that represent failure on any
single spoke (i.e. 1st-spoke failure pattern) are compared to a more extensive state of damage
that spreads on 50% of the tank circumference (i.e. multi-spoke failure pattern). The 50% spread
of damage is arbitrarily chosen and thus a different value could be used upon the availability of
relevant (experimental/structural analysis) data. Comparing the two approaches reveals a clear-
yet marginal-shift of the multi-spoke failure to higher PGA estimates, which practically triggers
the discussion between localised and widely spread buckling.
(a) (b)
Figure 5: (a) EFB demand versus capacity single-record (pair) IDA curves for an arbitrarily chosen edge-spring on the “Joystick” model. (b) Single versus multi-spoke EFB failure on the demand-capacity space formed by single-record (pair) IDA curves for the entire set of edge-springs found on the base of the “Joystick” model. The results refer to the unanchored tank A (Table 1).
Traditionally, common approaches for capturing buckling modes conservatively rely on the
first point/element on a structure whose demand exceeds the prescribed capacity (e.g. single-
spoke failure). Although for the purpose of this study the single-spoke pattern is conservatively
adopted to signal EFB, Figure 5(b) highlights the abilities of the “Joystick” model to capture
limit state capacities that are defined based on the extent of EFB (or any other) mode of failure
and could potentially provide a more refined approach in terms of loss. In reality, EFB induces
a local instability on the actual tank (not captured by the “Joystick” model) that causes a
modification of its properties such that buckling is potentially easier to spread than is shown
herein. This is generally tough to quantify, and thus the purpose of this analysis is to indicatively
shed some light on the spread of buckling, pending further calibration. The estimate provided
remains a useful approximation barring the use of more complex models.
SEISMIC RISK ASSESSMENT OF LIQUID STORAGE TANKS VIA A SURROGATE MODEL 11
Copyright © 2017 John Wiley & Sons, Ltd. Earthquake Engng Struct. Dyn. 2017
DOI: XX
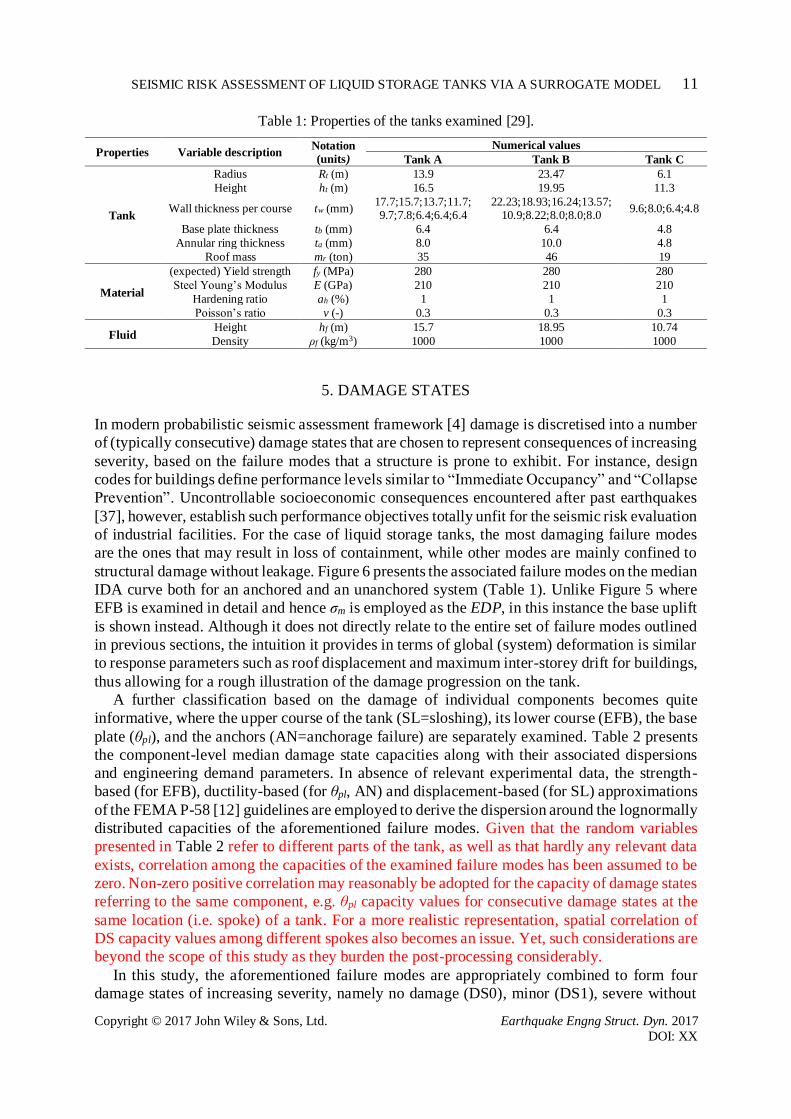
Table 1: Properties of the tanks examined [29].
Properties Variable description Notation
(units)
Numerical values
Tank A Tank B Tank C
Tank
Radius Rt (m) 13.9 23.47 6.1
Height ht (m) 16.5 19.95 11.3
Wall thickness per course tw (mm) 17.7;15.7;13.7;11.7;9.7;7.8;6.4;6.4;6.4
22.23;18.93;16.24;13.57;10.9;8.22;8.0;8.0;8.0
9.6;8.0;6.4;4.8
Base plate thickness tb (mm) 6.4 6.4 4.8
Annular ring thickness ta (mm) 8.0 10.0 4.8
Roof mass mr (ton) 35 46 19
Material
(expected) Yield strength fy (MPa) 280 280 280
Steel Young’s Modulus E (GPa) 210 210 210
Hardening ratio ah (%) 1 1 1
Poisson’s ratio v (-) 0.3 0.3 0.3
Fluid Height hf (m) 15.7 18.95 10.74
Density ρf (kg/m3) 1000 1000 1000
5. DAMAGE STATES
In modern probabilistic seismic assessment framework [4] damage is discretised into a number
of (typically consecutive) damage states that are chosen to represent consequences of increasing
severity, based on the failure modes that a structure is prone to exhibit. For instance, design
codes for buildings define performance levels similar to “Immediate Occupancy” and “Collapse
Prevention”. Uncontrollable socioeconomic consequences encountered after past earthquakes
[37], however, establish such performance objectives totally unfit for the seismic risk evaluation
of industrial facilities. For the case of liquid storage tanks, the most damaging failure modes
are the ones that may result in loss of containment, while other modes are mainly confined to
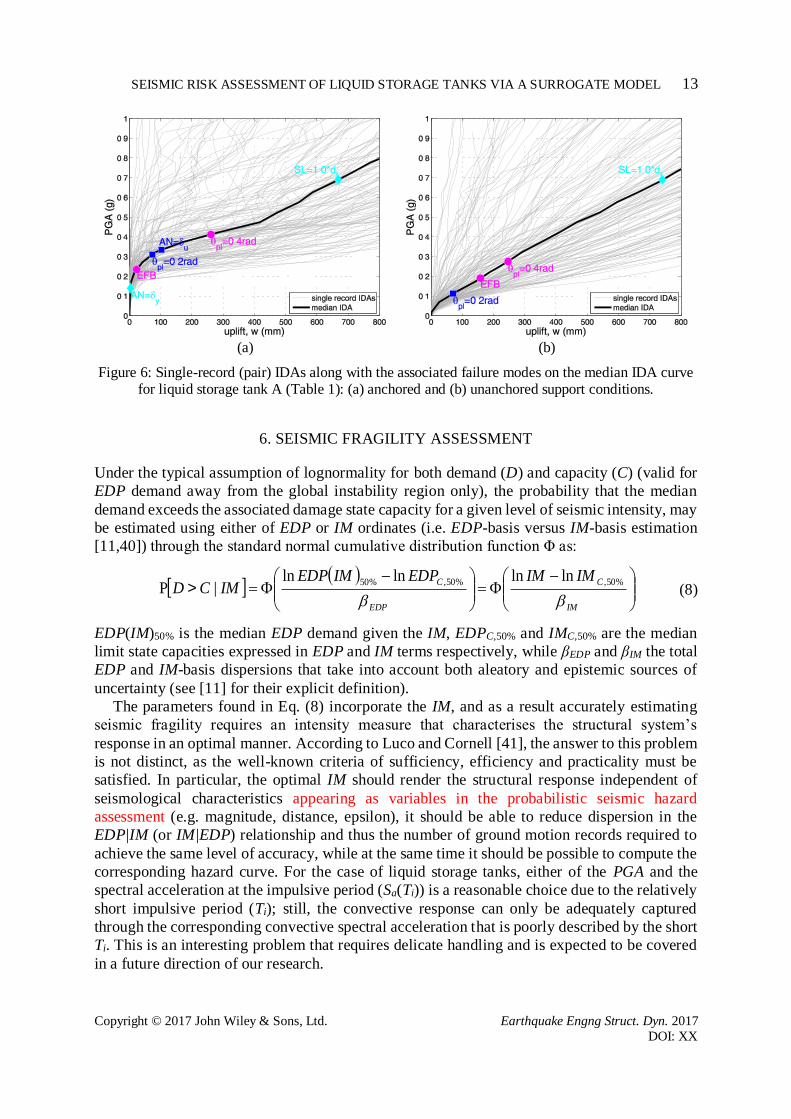
structural damage without leakage. Figure 6 presents the associated failure modes on the median
IDA curve both for an anchored and an unanchored system (Table 1). Unlike Figure 5 where
EFB is examined in detail and hence σm is employed as the EDP, in this instance the base uplift
is shown instead. Although it does not directly relate to the entire set of failure modes outlined
in previous sections, the intuition it provides in terms of global (system) deformation is similar
to response parameters such as roof displacement and maximum inter-storey drift for buildings,
thus allowing for a rough illustration of the damage progression on the tank.
A further classification based on the damage of individual components becomes quite
informative, where the upper course of the tank (SL=sloshing), its lower course (EFB), the base
plate (θpl), and the anchors (AN=anchorage failure) are separately examined. Table 2 presents
the component-level median damage state capacities along with their associated dispersions
and engineering demand parameters. In absence of relevant experimental data, the strength-
based (for EFB), ductility-based (for θpl, AN) and displacement-based (for SL) approximations
of the FEMA P-58 [12] guidelines are employed to derive the dispersion around the lognormally
distributed capacities of the aforementioned failure modes. Given that the random variables
presented in Table 2 refer to different parts of the tank, as well as that hardly any relevant data
exists, correlation among the capacities of the examined failure modes has been assumed to be
zero. Non-zero positive correlation may reasonably be adopted for the capacity of damage states
referring to the same component, e.g. θpl capacity values for consecutive damage states at the
same location (i.e. spoke) of a tank. For a more realistic representation, spatial correlation of
DS capacity values among different spokes also becomes an issue. Yet, such considerations are
beyond the scope of this study as they burden the post-processing considerably.
In this study, the aforementioned failure modes are appropriately combined to form four
damage states of increasing severity, namely no damage (DS0), minor (DS1), severe without

12 K. BAKALIS, D. VAMVATSIKOS AND M. FRAGIADAKIS
Copyright © 2017 John Wiley & Sons, Ltd. Earthquake Engng Struct. Dyn. (2017)
DOI: XX
leakage (DS2) and loss of containment (DS3), as originally proposed in [38,39]. It should be
noted that the loss of containment is generally the main concern post-earthquake, as it
constitutes a paramount source of industrial accidents with severe socioeconomic and
environmental consequences [24]. Still, structural damage itself (with or without leakage) is
also of concern, since its aftermath is not confined to monetary losses only. The reason is that
frequent earthquakes of moderate intensity, may trigger a list of actions that include drainage
of the tank, repair and refill. This is often inferred as a major disruption of business, the financial
impact of which cannot be ignored.
In that sense, for the case of unanchored (or self-anchored) liquid storage tanks, DS1 shall
represent minor damage induced by a sloshing wave height of the contained fluid equal to the
freeboard. DS2 shall refer to severe damage at any component of the tank without leakage,
where the exceedance of either a sloshing wave height equal to 1.4 times the available freeboard
or a plastic rotation of 0.2 rad at the base plate shall trigger the damage state violation. DS3,
finally, shall provide information on the loss of containment through the exceedance of either
the EFB capacity (σEFB) or the base plate plastic rotation of 0.4 rad. While some further
partitioning of the loss of containment damage states based on the amount of leakage would be
desirable, there is little data available to define appropriate EDP thresholds. As far as anchored
systems are concerned, yielding on the anchors or their connection to the tank may also be
considered for DS1, while fracture for DS2, as shown in Table 3. This classification reasonably
conveys the extent of system damage, yet one should bear in mind that the different mechanisms
involved in a single damage state may be associated with varying degrees of monetary loss or
repair actions. For instance, sloshing waves whose amplitude exceeds the available freeboard
represent relatively easy-to-repair damage at the top of the tank, compared to the exceedance
of a plastic rotation limit at the base, even though both might be categorised as moderate
damage. Therefore, it becomes more informative to also classify damage based on the actual
component that has failed, as shown in Table 2.
Table 2: Component-level DS classification for anchored and unanchored liquid storage tanks.
Component Failure Mode
Notation
Median EDP Capacity
(EDPC,50%) Reference Dispersion* [12]
Upper tank course SL 1.0×df (m) [3] 0.20
1.4×df (m) [3] 0.20
Lower tank course EFB σEFB (MPa) [2] 0.31
Base plate θpl 0.2 (rad) [2] 0.51
0.4 (rad) [31] 0.51
Anchors AN δy (mm) - 0.51
δu (mm) - 0.51 *The standard deviation of the log values
Table 3: System-level DS classification for anchored and unanchored liquid storage tanks.
System Support Conditions Damage States Damage State Capacities
Anchored
DS1 1.0×df or δy
DS2 1.4×df or θpl=0.2rad or δu
DS3 σEFB or θpl=0.4rad
Unanchored
DS1 1.0×df
DS2 1.4×df or θpl=0.2rad
DS3 σEFB or θpl=0.4rad
SEISMIC RISK ASSESSMENT OF LIQUID STORAGE TANKS VIA A SURROGATE MODEL 13
Copyright © 2017 John Wiley & Sons, Ltd. Earthquake Engng Struct. Dyn. 2017
DOI: XX
(a) (b)
Figure 6: Single-record (pair) IDAs along with the associated failure modes on the median IDA curve for liquid storage tank A (Table 1): (a) anchored and (b) unanchored support conditions.
6. SEISMIC FRAGILITY ASSESSMENT
Under the typical assumption of lognormality for both demand (D) and capacity (C) (valid for
EDP demand away from the global instability region only), the probability that the median
demand exceeds the associated damage state capacity for a given level of seismic intensity, may
be estimated using either of EDP or IM ordinates (i.e. EDP-basis versus IM-basis estimation
[11,40]) through the standard normal cumulative distribution function Φ as:
IM
C
EDP
C IMIMEDPIMEDPIMCD
%50,%50,%50 lnlnlnln|P > (8)
EDP(IM)50% is the median EDP demand given the IM, EDPC,50% and IMC,50% are the median
limit state capacities expressed in EDP and IM terms respectively, while βEDP and βIM the total
EDP and IM-basis dispersions that take into account both aleatory and epistemic sources of
uncertainty (see [11] for their explicit definition).
The parameters found in Eq. (8) incorporate the IM, and as a result accurately estimating
seismic fragility requires an intensity measure that characterises the structural system’s
response in an optimal manner. According to Luco and Cornell [41], the answer to this problem
is not distinct, as the well-known criteria of sufficiency, efficiency and practicality must be
satisfied. In particular, the optimal IM should render the structural response independent of
seismological characteristics appearing as variables in the probabilistic seismic hazard
assessment (e.g. magnitude, distance, epsilon), it should be able to reduce dispersion in the
EDP|IM (or IM|EDP) relationship and thus the number of ground motion records required to
achieve the same level of accuracy, while at the same time it should be possible to compute the
corresponding hazard curve. For the case of liquid storage tanks, either of the PGA and the
spectral acceleration at the impulsive period (Sa(Ti)) is a reasonable choice due to the relatively
short impulsive period (Ti); still, the convective response can only be adequately captured
through the corresponding convective spectral acceleration that is poorly described by the short
Ti. This is an interesting problem that requires delicate handling and is expected to be covered
in a future direction of our research.
14 K. BAKALIS, D. VAMVATSIKOS AND M. FRAGIADAKIS
Copyright © 2017 John Wiley & Sons, Ltd. Earthquake Engng Struct. Dyn. (2017)
DOI: XX
(a) (b)
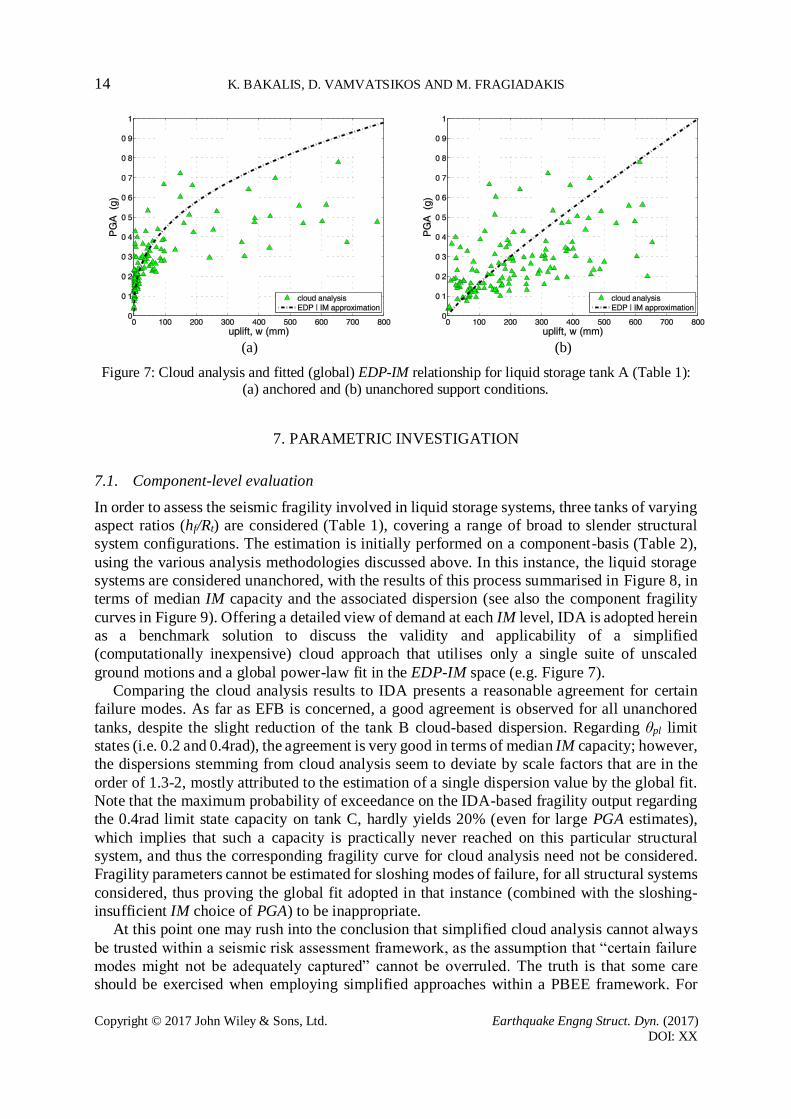
Figure 7: Cloud analysis and fitted (global) EDP-IM relationship for liquid storage tank A (Table 1): (a) anchored and (b) unanchored support conditions.
7. PARAMETRIC INVESTIGATION
7.1. Component-level evaluation
In order to assess the seismic fragility involved in liquid storage systems, three tanks of varying
aspect ratios (hf/Rt) are considered (Table 1), covering a range of broad to slender structural
system configurations. The estimation is initially performed on a component-basis (Table 2),
using the various analysis methodologies discussed above. In this instance, the liquid storage
systems are considered unanchored, with the results of this process summarised in Figure 8, in
terms of median IM capacity and the associated dispersion (see also the component fragility
curves in Figure 9). Offering a detailed view of demand at each IM level, IDA is adopted herein
as a benchmark solution to discuss the validity and applicability of a simplified
(computationally inexpensive) cloud approach that utilises only a single suite of unscaled
ground motions and a global power-law fit in the EDP-IM space (e.g. Figure 7).
Comparing the cloud analysis results to IDA presents a reasonable agreement for certain
failure modes. As far as EFB is concerned, a good agreement is observed for all unanchored
tanks, despite the slight reduction of the tank B cloud-based dispersion. Regarding θpl limit
states (i.e. 0.2 and 0.4rad), the agreement is very good in terms of median IM capacity; however,
the dispersions stemming from cloud analysis seem to deviate by scale factors that are in the
order of 1.3-2, mostly attributed to the estimation of a single dispersion value by the global fit.
Note that the maximum probability of exceedance on the IDA-based fragility output regarding
the 0.4rad limit state capacity on tank C, hardly yields 20% (even for large PGA estimates),
which implies that such a capacity is practically never reached on this particular structural
system, and thus the corresponding fragility curve for cloud analysis need not be considered.
Fragility parameters cannot be estimated for sloshing modes of failure, for all structural systems
considered, thus proving the global fit adopted in that instance (combined with the sloshing-
insufficient IM choice of PGA) to be inappropriate.
At this point one may rush into the conclusion that simplified cloud analysis cannot always
be trusted within a seismic risk assessment framework, as the assumption that “certain failure
modes might not be adequately captured” cannot be overruled. The truth is that some care
should be exercised when employing simplified approaches within a PBEE framework. For

SEISMIC RISK ASSESSMENT OF LIQUID STORAGE TANKS VIA A SURROGATE MODEL 15
Copyright © 2017 John Wiley & Sons, Ltd. Earthquake Engng Struct. Dyn. 2017
DOI: XX
example, the cloud method adopted is sensitive to pre-processing tasks such as the record
selection and the associated scaling. These parameters essentially determine the extent of the
EDP-IM space, and thus the ability to capture certain damage state capacities that are found in
rather large response parameter values. Undeniably, our case study also suffers from such
issues, as the (unscaled) record-set that has been used does not provide an adequate number of
analysis data points around certain EDP capacities of interest, that would otherwise lead to a
more accurate regression analysis output. Note that the simplified cloud-based assessment
cloud also be refined by adopting a local fit in place of the global one shown in Figure 7. Despite
the aforementioned problems and their rather complex nature, cloud analysis still remains
probably the best alternative to IDA, for cases that the latter is deemed computationally
prohibitive.
7.2. System-level evaluation
Following the comparison of the various analysis methodologies and their effect on the seismic
fragility parameters, the system-level evaluation is performed for the entire set of liquid storage
tanks, considering both anchored and unanchored support conditions (Table 3). The aim is to
assign a single damage state that could be useful in several instances such as regional loss
assessment or the assessment of an entire tank-farm, similar to the HAZUS methodology [13].
For the shake of brevity, only the IDA-based fragilities for unanchored support conditions are
illustrated in Figure 9. The entire seismic fragility assessment procedure is summarised in Table
4, where parameters such as the median IM capacity (IMC,50%) and the associated (total)
dispersion (β) are provided for the corresponding fragility curve construction. The dominant
failure mode (DFM) as well as the order that each damage state appears during a strong ground
motion, are also provided in order to highlight the complexities involved in the assessment of
cylindrical liquid storage systems. Special attention is paid to the compound system-level
damage states (i.e. damage states that depend on the union of the exceedance of two or more
failure mode capacities, e.g. DS2 and DS3 for unanchored tanks), where a simple Monte Carlo
integration is required to estimate the associated probability of exceedance [11]. A good
example to appreciate the importance of this procedure can be given through the final fragility
product of DS2 and DS3 for the unanchored tank A (Figure 9(b)). According to Figure 9(a), it
appears that although the plastic rotation clearly dominates the response of DS2, a similar
conclusion cannot be drawn for DS3 as the plastic rotation appears to influence lower IM levels
contrary to EFB that is more probable for higher ones.
A closer look on the results of Table 4 suggests that even though the sloshing mode governs
the response for all unanchored systems with respect to DS1, the corresponding response for
anchored tanks is dominated by yielding of the anchor bolts, for considerably smaller median
PGA estimates. DS2 on the other hand, reveals the plastic rotation as the dominant failure mode
for every case of unanchored tanks, while for the case of anchored ones the prevalent response
cannot be distinguished among the failure modes considered, and therefore it is deemed
“inconclusive”. In addition, EFB is the mode of failure that controls DS3 for all systems
examined (both anchored and unanchored). The beneficial effect of the anchors is also
highlighted through the seismic fragility estimation of DS2 and DS3, where each failure mode
(unrelated to anchors) is developed for significantly higher intensities, as shown in Table 4.
Finally, another major conclusion that can be drawn from the assessment procedure, is that the
damage states developed do not follow a priori the intuitive order which dictates that increasing
intensities result in increasing levels of damage. This issue of non-sequential damage states
highlights the fact that certain tanks may progress directly to catastrophic levels of damage

16 K. BAKALIS, D. VAMVATSIKOS AND M. FRAGIADAKIS
Copyright © 2017 John Wiley & Sons, Ltd. Earthquake Engng Struct. Dyn. (2017)
DOI: XX
without any warning (e.g. progression through lesser damage states).
Table 4: System-level seismic fragility assessment of the tanks examined.
Tank
DS1 DS2 DS3 Order
of DSi IMC,50%
(g) β DFM* IMC,50%
(g) β DFM* IMC,50%
(g) β DFM*
Unanchored A 0.689 1.349 SL 0.117 0.758 θpl 0.168 0.620 EFB 2-3-1
Anchored A 0.130 0.479 AN 0.274 0.383 inconclusive 0.233 0.359 EFB 1-3-2
Unanchored B 1.069 1.382 SL 0.090 0.829 θpl 0.056 0.767 EFB 3-2-1
Anchored B 0.089 0.480 AN 0.187 0.441 inconclusive 0.076 0.385 EFB 3-1-2
Unanchored C 0.468 1.012 SL 0.201 0.631 θpl 0.378 0.628 EFB 2-3-1
Anchored C 0.265 0.566 inconclusive 0.512 0.622 inconclusive 0.672 0.344 EFB 1-2-3 *Dominant Failure Mode
8. SEISMIC RISK ASSESSMENT
The ultimate goal of seismic assessment lies in the mean annual frequency (λ) estimation for
any set of consequences (or decision variables in the terminology of the Cornell-Krawinkler
PBEE framework [4]). This may be achieved, e.g., for monetary losses either by defining them
at the global system-level in a manner similar to HAZUS [13], or by employing the more
detailed local component-level DS classification and appropriate cost functions, thus adopting
a format akin to FEMA P-58 [12]. With such data available, the implementation according to
any of the two standards should be straightforward (see also [42]).
The simpler estimation of the MAF of discrete limit-states is normally performed through
an integration on the product of the site-specific hazard function λ(IM), typically obtained
through probabilistic seismic hazard analysis (PSHA), with any of the aforementioned fragility
curves (i.e. P[D>C|IM]) [40,43]:
IM
IMC|IMDDS d P > (9)
For the purposes of this study, the Elefsina, Greece hazard curve is adopted [44], targeting a
site of major refineries. The results shown in Figure 10 summarise the component as well as
system-level seismic risk assessment in terms of mean return period (Tr=1/λ). As expected, from
a qualitative perspective, the results are not any different from the ones shown in the seismic
fragility section (Figure 9). In fact, the discrepancies noticed among the various structural
systems and analysis methodologies are nearly identical. However, the view they offer is of a
slightly different nature, as they essentially provide an indication of how rare a certain failure
mode (or state of damage) is on the site under investigation, or in other words the failure modes
that each system is prone to experience during earthquakes consistent with the site. What really
matters in this case is the order of magnitude of the various return periods.
For instance, sloshing modes of failure can generally be considered rare events (for the given
combination of site and tanks), as the mean return periods they develop are considerably higher
compared to plastic rotation and EFB. The well-known return periods that correspond to “10%
in 10 years” and “10% in 50 years” probability of exceedance (i.e. 95 and 475 years
respectively) are also provided as reference lines, potentially useful as DS1 and DS2
performance targets respectively. As a general remark, the system-level results closely follow
the worst of the relevant component-level ones, unless the dominant failure mode is highly
inconclusive. At the same time, the majority of failure modes develop return periods that cannot
even capture the indicative “10% in 10 years” objective, which highlights the vulnerability of
the structural systems considered against the chosen site hazard. Catastrophic damage (i.e. DS2,

SEISMIC RISK ASSESSMENT OF LIQUID STORAGE TANKS VIA A SURROGATE MODEL 17
Copyright © 2017 John Wiley & Sons, Ltd. Earthquake Engng Struct. Dyn. 2017
DOI: XX
DS3) can be several times more probable than light sloshing damage (i.e. DS1 for unanchored
tanks), a direct consequence of the long convective period component that is not sufficiently
excited by the moderate magnitude events and the rocky profile of the Elefsina site. The
aforementioned observation stands regardless of the analysis approach, despite the considerable
differences in terms of mean return period.
(a) median (b) dispersion
(c) median (d) dispersion
(e) median (f) dispersion
Figure 8: IDA versus cloud-based component-level seismic fragility evaluation: [(a), (c), (e)] median IM capacity and [(b), (d), (f)] total dispersion. The results refer to the liquid storage tanks of Table 1
for unanchored support conditions.

18 K. BAKALIS, D. VAMVATSIKOS AND M. FRAGIADAKIS
Copyright © 2017 John Wiley & Sons, Ltd. Earthquake Engng Struct. Dyn. (2017)
DOI: XX
(a) component (b) system
(c) component (d) system
(e) component (f) system
Figure 9: IDA-based component [(a), (c), (e)] versus system-level [(b), (d), (f)] seismic fragility evaluation. The results refer to the liquid storage tanks of Table 1 for unanchored support conditions.

SEISMIC RISK ASSESSMENT OF LIQUID STORAGE TANKS VIA A SURROGATE MODEL 19
Copyright © 2017 John Wiley & Sons, Ltd. Earthquake Engng Struct. Dyn. 2017
DOI: XX
(a) component (IDA-Cloud) (b) system (IDA)
(c) component (IDA-Cloud) (d) system (IDA)
(e) component (IDA-Cloud) (f) system (IDA)
Figure 10: [(a), (c), (e)] Component (IDA and cloud) versus [(b)-(d)-(f)] system-level (IDA) mean return period evaluation. The results refer to the liquid storage tanks of Table 1 for unanchored support
conditions.
9. CONCLUSIONS
A reliability PBEE assessment methodology has been developed using a simplified surrogate
model for liquid storage tanks. Both component and system-level damage states are outlined,

20 K. BAKALIS, D. VAMVATSIKOS AND M. FRAGIADAKIS
Copyright © 2017 John Wiley & Sons, Ltd. Earthquake Engng Struct. Dyn. (2017)
DOI: XX
favouring the seismic risk assessment of a single liquid storage unit or an entire group of tanks,
respectively. Using the simplified cloud analysis to determine the EDP-IM relationship, and
thus the corresponding fragility curves and mean return period, presents a fairly straightforward
and rapid assessment approach, on the onset that some margin of error cannot be avoided
compared to more refined dynamic analysis methods such as IDA. In most cases, the margin of
error can further be improved by considering a larger number of records or even through
rigorous post-processing techniques (e.g. a more refined local fit). The benchmark solution
adopted herein through IDA provides a detailed representation of the EDP-IM space, although
it is slightly more expensive from a computational point of view (under the condition that a
surrogate model is available). On the downside, post-processing the IDA output is considerably
more demanding, especially if IM stipes are not available [7]. Regardless of the analysis
approach, EFB requires special attention, not only regarding the demand but also the capacity
representation. Their underlying (negative) correlation makes the buckling capacity point
substantially more difficult to determine, while at the same time suggests that this problem can
probably be effectively tackled using a 3D surrogate model. Finally, unlike well-studied
structural systems (e.g. moment resisting frames) where increasing seismic intensity triggers
higher states of damage, the progression of failure on liquid storage tanks is non-sequential
(using the limit state capacities considered), as quite often a higher damage state appears first,
hinting at the onset of severe damage with little or no warning.
ACKNOWLEDGEMENTS
This research has been co‐financed by the European Union (European Social Fund – ESF) and
Greek national funds through the Operational Program "Education and Lifelong Learning" of
the National Strategic Reference Framework (NSRF) ‐ Research Funding Program: THALES.
Investing in knowledge society through the European Social Fund.
REFERENCES
1. Krausmann E, Cruz AM. Impact of the 11 March 2011, Great East Japan earthquake and tsunami on the chemical industry. Natural Hazards 2013; 67(2): 811–828. DOI: 10.1007/s11069-013-0607-0.
2. CEN. Eurocode 8: Design of structures for earthquake resistance–Part 4: Silos, tanks and pipelines.
vol. 3. Brussels: 2006. 3. American Petroleum Institute. Seismic Design of Storage Tanks - Appendix E, Welded Steel Tanks
for Oil Storage. vol. 552. API 650, 11th Edition, Washington, D.C.: 2007. 4. Cornell CA, Krawinkler H. Progress and Challenges in Seismic Performance Assessment. PEER
Center News 2000; 3(2): 1–4. 5. Yang TY, Moehle J, Stojadinovic B, Der Kiureghian A. Seismic Performance Evaluation of
Facilities: Methodology and Implementation. Journal of Structural Engineering 2009; 135(10): 1146–1154. DOI: 10.1061/(ASCE)0733-9445(2009)135:10(1146).
6. Cornell CA. Engineering Seismic Risk Analysis. Bulletin of the Seismological Society of America 1968; 58(5): 1583–1606.
7. Vamvatsikos D, Cornell CA. Incremental dynamic analysis. Earthquake Engineering & Structural Dynamics 2002; 31(3): 491–514. DOI: 10.1002/eqe.141.
8. Luco N, Bazzurro P. Does amplitude scaling of ground motion records result in biased nonlinear structural drift responses? Earthquake Engineering & Structural Dynamics 2007; 36(13): 1813–1835. DOI: 10.1002/eqe.695.
9. Jalayer F. Direct Probabilistic Seismic Anaysis: Implementing Non-linear Dynamic Assessments.

SEISMIC RISK ASSESSMENT OF LIQUID STORAGE TANKS VIA A SURROGATE MODEL 21
Copyright © 2017 John Wiley & Sons, Ltd. Earthquake Engng Struct. Dyn. 2017
DOI: XX
Ph.D. dissertation, Dept. of Civil and Environmental Engineering, Stanford Univ., Stanford, CA, 2003.
10. Baker JW, Cornell CA. Spectral shape, epsilon and record selection. Earthquake Engineering and Structural Dynamics 2006; 35(9): 1077–1095. DOI: 10.1002/eqe.571.
11. Bakalis K, Vamvatsikos D. Seismic Fragility Functions via Nonlinear Dynamic Methods. Earthquake Engineering & Structural Dynamics 2016; (Submitted).
12. FEMA. Seismic Performance Assessment of Buildings. vol. 1. FEMA P-58, Prepared by the Applied Technology Council for the Federal Emergency Management Agency, Washington D.C: 2012.
13. FEMA. HAZUS-MH MR4 Multi-hazard Loss Estimation Methodology, Technical Manual. Washington D.C.: 2003.
14. American Lifelines Alliance. Seismic fragility formulation for water systems: Part 1-Guideline. ASCE: 2001.
15. American Lifelines Alliance. Seismic Fragility Formulation for Water Systems Part 2-Appendices. ASCE: 2001.
16. Buratti N, Tavano M. Dynamic buckling and seismic fragility of anchored steel tanks by the added mass method. Earthquake Engineering & Structural Dynamics 2014; 43(1): 1–21. DOI: 10.1002/eqe.2326.
17. Talaslidis DG, Manolis GD, Paraskevopoulos E, Panagiotopoulos C, Pelekasis N, Tsamopoulos JA. Risk analysis of industrial structures under extreme transient loads. Soil Dynamics and Earthquake Engineering 2004; 24(6): 435–448. DOI: 10.1016/j.soildyn.2004.02.003.
18. O’Rourke MJ, So P. Seismic Fragility Curves for On‐Grade Steel Tanks. Earthquake Spectra 2000; 16(4): 801–815. DOI: 10.1193/1.1586140.
19. Salzano E, Iervolino I, Fabbrocino G. Seismic risk of atmospheric storage tanks in the framework of quantitative risk analysis. Journal of Loss Prevention in the Process Industries 2003; 16(5): 403–
409. DOI: 10.1016/S0950-4230(03)00052-4. 20. Berahman F, Behnamfar F. Seismic Fragility Curves for Un-Anchored On-Grade Steel Storage
Tanks: Bayesian Approach. Journal of Earthquake Engineering 2007; 11(2): 166–192. DOI: 10.1080/13632460601125722.
21. Iervolino I, Fabbrocino G, Manfredi G. Fragility Of Standard Industrial Structures By a Response Surface Based Method. Journal of Earthquake Engineering 2004; 8(6): 927–945. DOI: 10.1080/13632460409350515.
22. Salzano E, Garcia Agreda A, Di Carluccio A, Fabbrocino G. Risk assessment and early warning
systems for industrial facilities in seismic zones. Reliability Engineering & System Safety 2009; 94(10): 1577–1584. DOI: 10.1016/j.ress.2009.02.023.
23. Razzaghi MS, Eshghi S. Probabilistic Seismic Safety Evaluation of Precode Cylindrical Oil Tanks. Journal of Performance of Constructed Facilities 2015; 29(6): 4014170. DOI: 10.1061/(ASCE)CF.1943-5509.0000669.
24. Fabbrocino G, Iervolino I, Orlando F, Salzano E. Quantitative risk analysis of oil storage facilities in seismic areas. Journal of Hazardous Materials 2005; 123(1–3): 61–69. DOI:
10.1016/j.jhazmat.2005.04.015. 25. CEN. Eurocode 8 : Design of structures for earthquake resistance - Part 1: General rules, seismic
actions and rules for buildings (EN 1998-1:2004). vol. 1. CEN, Brussels: 2004. 26. Haroun MA. Vibration studies and tests of liquid storage tanks. Earthquake Engineering &
Structural Dynamics 1983; 11(2): 179–206. DOI: 10.1002/eqe.4290110204. 27. Malhotra PK. Practical Nonlinear Seismic Analysis of Tanks. Earthquake Spectra 2000; 16(2): 473–
492. DOI: 10.1193/1.1586122.
28. Cortes G, Prinz GS. Seismic fragility analysis of large unanchored steel tanks considering local instability and fatigue damage. Bulletin of Earthquake Engineering 2017; 15(3): 1279–1295. DOI: 10.1007/s10518-016-9984-6.
29. Bakalis K, Fragiadakis M, Vamvatsikos D. Surrogate Modeling for the Seismic Performance Assessment of Liquid Storage Tanks. Journal of Structural Engineering 2017; 143(4): 4016199. DOI: 10.1061/(ASCE)ST.1943-541X.0001667.
30. Malhotra PK, Veletsos AS. Beam Model for Base‐Uplifting Analysis of Cylindrical Tanks. Journal

22 K. BAKALIS, D. VAMVATSIKOS AND M. FRAGIADAKIS
Copyright © 2017 John Wiley & Sons, Ltd. Earthquake Engng Struct. Dyn. (2017)
DOI: XX
of Structural Engineering 1994; 120(12): 3471–3488. DOI: 10.1061/(ASCE)0733-9445(1994)120:12(3471).
31. Cortés G, Nussbaumer A, Berger C, Lattion E. Experimental determination of the rotational capacity of wall-to-base connections in storage tanks. Journal of Constructional Steel Research 2011; 67(7): 1174–1184. DOI: 10.1016/j.jcsr.2011.02.010.
32. Habenberger J. Fluid damping of cylindrical liquid storage tanks. SpringerPlus 2015; 4(1): 515. DOI: 10.1186/s40064-015-1302-2.
33. Rotter JM. Elephant’s foot buckling in pressurised cylindrical shells. Stahlbau 2006; 75(9): 742–747. DOI: 10.1002/stab.200610079.
34. Malhotra PK, Veletsos AS. Uplifting Response of Unanchored Liquid‐Storage Tanks. Journal of
Structural Engineering 1994; 120(12): 3525–3547. DOI: 10.1061/(ASCE)0733-9445(1994)120:12(3525).
35. Malhotra PK, Veletsos AS. Uplifting Analysis of Base Plates in Cylindrical Tanks. Journal of Structural Engineering 1994; 120(12): 3489–3505. DOI: 10.1061/(ASCE)0733-9445(1994)120:12(3489).
36. Ancheta T, Darragh R, Stewart J, Seyhan E, Silva W, Chiou B, et al. PEER NGA-West2 Database, Technical Report PEER 2013/03. Pacific Earthquake Engineering Research Center, Berkeley, CA:
2013. 37. Girgin S. The natech events during the 17 August 1999 Kocaeli earthquake: aftermath and lessons
learned. Natural Hazards and Earth System Science 2011; 11(4): 1129–1140. DOI: 10.5194/nhess-11-1129-2011.
38. Vathi M, Karamanos SA, Kapogiannis I, Spiliopoulos K. Performance Criteria for Liquid Storage Tanks and Piping Systems Subjected to Seismic Loading. Proceedings of the ASME 2015 Pressure Vessels & Piping Division Conference, Boston, Massachusetts, USA: 2015.
39. Risk Assessment for the Seismic protection Of industRial facilities, THALES 2015; . http://excellence.minedu.gov.gr/thales/en/thalesprojects/379422.
40. Vamvatsikos D, Cornell CA. Applied Incremental Dynamic Analysis. Earthquake Spectra 2004; 20(2): 523–553. DOI: 10.1193/1.1737737.
41. Luco N, Cornell CA. Structure-Specific Scalar Intensity Measures for Near-Source and Ordinary Earthquake Ground Motions. Earthquake Spectra 2007; 23(2): 357–392. DOI: 10.1193/1.2723158.
42. D’Ayala D, Meslem A, Vamvatsikos D, Porter K, Rossetto T. Guidelines for Analytical Vulnerability Assessment - Low/Mid-Rise Buildings. Vulnerability Global Component Project:
2015. DOI: 10.13117/GEM.VULN-MOD.TR2014.12. 43. Vamvatsikos D. Derivation of new SAC/FEMA performance evaluation solutions with second-
order hazard approximation. Earthquake Engineering & Structural Dynamics 2013; 42(8): 1171–1188. DOI: 10.1002/eqe.2265.
44. Giardini D, Woessner J, Danciu L, Crowley H, Cotton F, Grünthal G, et al. Seismic Hazard Harmonization in Europe (SHARE): Online Data Resource 2013; . DOI: 10.12686/SED-00000001-SHARE.