SEISMIC RISK ASSESMENT OF AN EXISTING … RISK ASSESMENT OF AN EXISTING REINFORCED CONCRETE BRIDGE...
14
SEISMIC RISK ASSESMENT OF AN EXISTING REINFORCED CONCRETE BRIDGE GUIDO CAMATA, ANTONIO SARNI, ENRICO SPACONE Dipartimento PRICOS, Università di Chieti-Pescara, viale Pindaro 42, 65127 Pescara Abstract: This paper contains the results of the seismic risk assessment of an existing reinforced concrete viaduct erected in the 1960's. This study is part of an ongoing research that aims preparing new Italian design guidelines for the seismic vulnerability assessment of existing bridges. The bridge under consideration is a two-lane plan-irregular viaduct located along the main north-south highway 16 “Adriatica” in Vasto Marina, in the Abruzzo region, Italy. The structure consists of multiple reinforced concrete frames connected by Gerber beams. The bridge is studied using linear response spectrum analysis, nonlinear static pushover and nonlinear dynamic analyses. Two different models are prepared, one with lumped and the second one with distributed plasticity. The distributed plasticity model is calibrated to match the plastic hinge lengths provided by current design codes. The piers are idealized with beam elements and appropriate kinematic constrains, whereas the deck is modelled with shell and beam elements. The nonlinear static analyses are performed with the lumped plastic model, whereas the response time histories are performed with the distributed plasticity, force-based fiber-section model. The results point to the limitations of both linear and nonlinear static procedures, whereas the nonlinear time history analyses appear to be the most logical choice for the seismic vulnerability assessment of existing, irregular, non-ductile structures. Open issues also remain on the design check verifications of irregular structures where biaxial bending needs to be considered. 1. INTRODUCTION The seismic response of existing bridges can be assessed with different tools which range from simplified linear elastic hand calculations to sophisticated three dimensional nonlinear time history analyses. This paper applies linear and nonlinear dynamic analyses to an existing reinforced concrete bridge, using Eurocode 8 (2005) and the draft Italian guidelines for the seismic vulnerability assessment of existing bridges, prepared in the framework of the Re-Luis project, funded by the Italian Civil Protection Department in support of the new seismic design guidelines (OPCM 3431, 2005). The methods of analysis used are: Response Spectrum Analysis (RSA), Nonlinear Pushover Analysis (NPO) and Nonlinear Time History Analysis (NTH). RSA is used to determine the seismic demand computed as maximum response quantities from the inelastic design spectrum provided by the code. The design spectrum is obtained dividing the elastic spectrum by the force reduction factor q. This tool presents some issues and some simplifications that need further discussion. For existing structures, which were not designed following capacity design principles and that do not present appropriate seismic details, the values to adopt for the q factor are still under discussion. In addition, since the RSA is linear, it cannot provide insight on the post yielding behaviour of the structure. The realistic response of irregular bridges under the design seismic action is more appropriately estimated by means of a dynamic nonlinear time history analysis (Eurocode 8 – Part 2, 2005). An approximation of the nonlinear response may also be obtained by a combination of an equivalent linear analysis with a Nonlinear Pushover Analysis (Eurocode 8 – Part 2, 2005). The initial load step of both nonlinear procedures (NPO and NTH) is the application of the gravity loads. The gravity loads remain constant during the nonlinear analysis. Gravity loads affect the initial state of the structure by applying large compression forces to the piers. NPO can be a useful tool to investigate the nonlinear behaviour and to assess the seismic vulnerability of existing structures. Unfortunately, the NPO is not readily applicable to irregular structures, since it was originally developed for plane frames and its extension to space frames is not straightforward and may not be achievable. The NTH analysis is the most general nonlinear method of analysis and there are no computational peculiarities related to earthquake engineering analysis. The input force is the input ground motion, expressed in the form of one or more accelerograms. NTH appears to be the most accurate analysis method among the analytical tools available at present, even though there are still some important issues that need to be fully understood and solved. www.buildup.it 29.06.2007 - 1 -
Transcript of SEISMIC RISK ASSESMENT OF AN EXISTING … RISK ASSESMENT OF AN EXISTING REINFORCED CONCRETE BRIDGE...
SEISMIC RISK ASSESMENT OF AN EXISTING REINFORCED CONCRETE BRIDGE
GUIDO CAMATA, ANTONIO SARNI, ENRICO SPACONE Dipartimento PRICOS, Università di Chieti-Pescara, viale Pindaro 42, 65127 Pescara
Abstract: This paper contains the results of the seismic risk assessment of an existing reinforced concrete viaduct erected in the 1960's. This study is part of an ongoing research that aims preparing new Italian design guidelines for the seismic vulnerability assessment of existing bridges. The bridge under consideration is a two-lane plan-irregular viaduct located along the main north-south highway 16 “Adriatica” in Vasto Marina, in the Abruzzo region, Italy. The structure consists of multiple reinforced concrete frames connected by Gerber beams. The bridge is studied using linear response spectrum analysis, nonlinear static pushover and nonlinear dynamic analyses. Two different models are prepared, one with lumped and the second one with distributed plasticity. The distributed plasticity model is calibrated to match the plastic hinge lengths provided by current design codes. The piers are idealized with beam elements and appropriate kinematic constrains, whereas the deck is modelled with shell and beam elements. The nonlinear static analyses are performed with the lumped plastic model, whereas the response time histories are performed with the distributed plasticity, force-based fiber-section model. The results point to the limitations of both linear and nonlinear static procedures, whereas the nonlinear time history analyses appear to be the most logical choice for the seismic vulnerability assessment of existing, irregular, non-ductile structures. Open issues also remain on the design check verifications of irregular structures where biaxial bending needs to be considered. 1. INTRODUCTION The seismic response of existing bridges can be assessed with different tools which range from simplified linear elastic hand calculations to sophisticated three dimensional nonlinear time history analyses. This paper applies linear and nonlinear dynamic analyses to an existing reinforced concrete bridge, using Eurocode 8 (2005) and the draft Italian guidelines for the seismic vulnerability assessment of existing bridges, prepared in the framework of the Re-Luis project, funded by the Italian Civil Protection Department in support of the new seismic design guidelines (OPCM 3431, 2005). The methods of analysis used are: Response Spectrum Analysis (RSA), Nonlinear Pushover Analysis (NPO) and Nonlinear Time History Analysis (NTH). RSA is used to determine the seismic demand computed as maximum response quantities from the inelastic design spectrum provided by the code. The design spectrum is obtained dividing the elastic spectrum by the force reduction factor q. This tool presents some issues and some simplifications that need further discussion. For existing structures, which were not designed following capacity design principles and that do not present appropriate seismic details, the values to adopt for the q factor are still under discussion. In addition, since the RSA is linear, it cannot provide insight on the post yielding behaviour of the structure. The realistic response of irregular bridges under the design seismic action is more appropriately estimated by means of a dynamic nonlinear time history analysis (Eurocode 8 – Part 2, 2005). An approximation of the nonlinear response may also be obtained by a combination of an equivalent linear analysis with a Nonlinear Pushover Analysis (Eurocode 8 – Part 2, 2005). The initial load step of both nonlinear procedures (NPO and NTH) is the application of the gravity loads. The gravity loads remain constant during the nonlinear analysis. Gravity loads affect the initial state of the structure by applying large compression forces to the piers. NPO can be a useful tool to investigate the nonlinear behaviour and to assess the seismic vulnerability of existing structures. Unfortunately, the NPO is not readily applicable to irregular structures, since it was originally developed for plane frames and its extension to space frames is not straightforward and may not be achievable. The NTH analysis is the most general nonlinear method of analysis and there are no computational peculiarities related to earthquake engineering analysis. The input force is the input ground motion, expressed in the form of one or more accelerograms. NTH appears to be the most accurate analysis method among the analytical tools available at present, even though there are still some important issues that need to be fully understood and solved.
www.buildup.it 29.06.2007
- 1 -

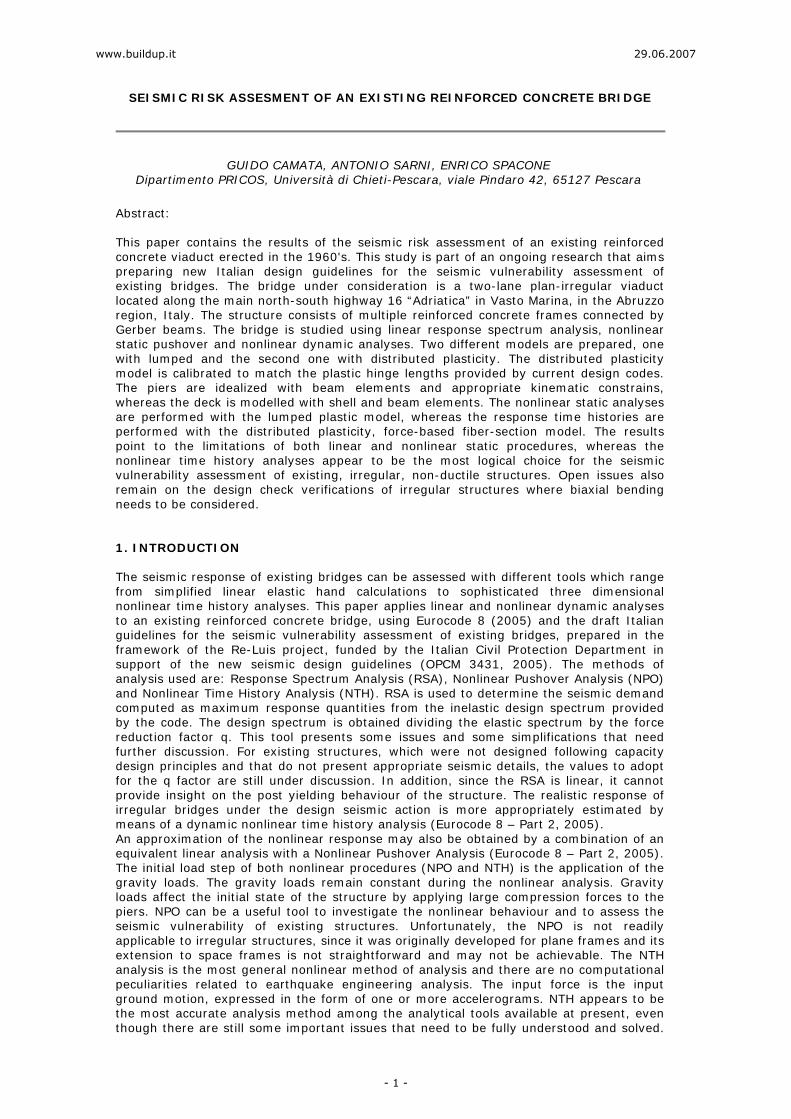
NTH is deemed unpractical by some because of the computational length of the analysis. In addition, the research community has not yet reached clear guidelines on the selection of the ground motions and on the amount of viscous damping to use. Finally, the directions along which the ground motions are applied to skewedirregular bridges cannot be easily identified. This paper applies the above mentioned three methods of analysis (RSA, NPO and NTH) to the seismic vulnerability assessment of an existing reinforced concrete bridge. The aim is to compare the results obtained with the different methods in order to critically evaluate them and to gain practical insight on the numerical investigations and on their results. 2. BRIDGE DESCRIPTION The viaduct is a two-lane reinforced concrete-curved bridge located along the national highway 16 “Adriatica” (the major north-south highway along the Adriatic Sea coast) near the town of Vasto Marina, south of Pescara in the Abruzzo Region, Italy. Figure 1 shows plan and elevation views of the 260 m long bridge with the basic structural dimensions. The bridge has a sharp bent about 1/3 from the south end, and is irregular in plan and height. The exact construction date is unknown, but based on the design details and the state of conservation it was most likely built in the 1960s. The bridge is separated into 7 sections by 14 Gerber hinges. The superstructure is partly continuous, with Gerber beams connecting the continuous sections of the bridge. The superstructure consists of 5 longitudinal precast prestressed concrete beams connected by transverse beams, which carry a cast-in-place reinforced concrete deck. The piers are made up of multicolumn bents connected by transverse beams above the foundations and by a cap beam at the top. The columns have variable height and have tapered sections.
www.buildup.it 29.06.2007
- 2 -
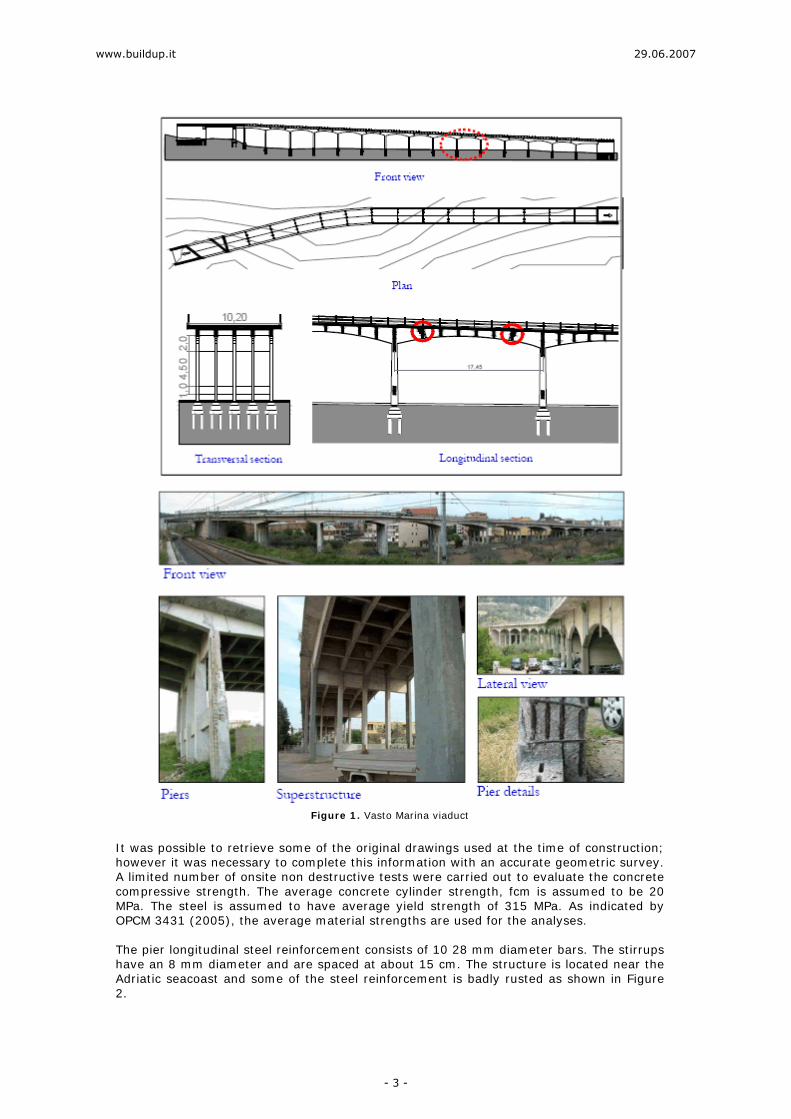
Figure 1. Vasto Marina viaduct
It was possible to retrieve some of the original drawings used at the time of construction; however it was necessary to complete this information with an accurate geometric survey. A limited number of onsite non destructive tests were carried out to evaluate the concrete compressive strength. The average concrete cylinder strength, fcm is assumed to be 20 MPa. The steel is assumed to have average yield strength of 315 MPa. As indicated by OPCM 3431 (2005), the average material strengths are used for the analyses. The pier longitudinal steel reinforcement consists of 10 28 mm diameter bars. The stirrups have an 8 mm diameter and are spaced at about 15 cm. The structure is located near the Adriatic seacoast and some of the steel reinforcement is badly rusted as shown in Figure 2.
www.buildup.it 29.06.2007
- 3 -

Figure 2. Bridge details
The structure sits on type C subsoil: deep deposits of dense or medium dense sand, gravel or stiff clay (Soft Soil - OPCM 3431, 2005). Four hazard levels are possibleaccording to the new Italian seismic codes (OPCM 3431, 2005). The ag value is selected with reference to the return period of the seismic action for the severe damage limit state (or equivalently the reference probability of exceedance in 50 years). For this site, which is zone 3, the ag value is 0.15g. 3. VIADUCT NUMERICAL MODEL The dynamic behaviour of simple bridges can be usually described by a limited number of vibration modes, with the fundamental period and mode shape providing a good indication of the bridge dynamic response. Also, many Italian long bridges, erected as simply supported multiple support girders, can be studied as separate structural subsystems, depending on the support details. Bridge systems with irregular geometry, such as the Vasto Marina viaduct, exhibit a complex dynamic response which cannot be captured in a separate subsystem analysis. The bridge is divided into frames by the Gerber hinges which act as movable supports. In the longitudinal direction, these joints are simple rollers that make the frames behave separately. Each frame develops its own characteristic dynamic response. Transversally, the hinges are restrained and do not allow any movement. Therefore, the single bent cannot be analyzed independently. Furthermore, the longitudinal girder direction changes, thus there is coupling between the longitudinal and transverse directions of the different bent supports. For these reasons, a global model of the entire bridge is built, with particular care on the joint and node models. Two structural models are developed with lumped and distributed plasticity with the commercial program Midas Civil v. 7.1.2. (Midas 2006). The piers, the longitudinal girders and the girder transverse beams are idealized with nonlinear beam elements. The top deck is modelled with linear shell elements, as shown in Figure 3.
www.buildup.it 29.06.2007
- 4 -

Figure 3. Numerical model
The shell elements used have incompatible modes and drilling degrees of freedom. A total of 3173 nodes, 1611 beam elements and 1562 shell elements are used. Because Midas program does not include tapered elements for the nonlinear analyses, the tapered section piers are idealized with at least two elements. The Gerber support hinges are modelled with two overlapping nodes connected by equal displacement kinematic constrains in the x,y and z direction (equal constraints). The roller joints are modelled in a similar manner but the x direction is not constrained. In order to simulate correctly the flexural behaviour of the piers in the longitudinal and transverse directions, two different constrains are inserted, as shown in Figure 3. At the column top, the longitudinal girder blocks flexure in the x-z plane. Where the columns cross the transverse beam above the foundations, the transverse beam prevents flexure of the column in the y-z plane. Appropriate constraints are added to model the above behaviours. It is also worth pointing out that the transverse beams above the foundations create short columns that typically attract large shear forces. The multicolumn bents are numbered from 1 to 14 from south to north, as shown in Figure 4.
Figure 4. Bent number
4. EFFECTIVE STIFFNESS The vertical and lateral forces cause cracking of the reinforced concrete piers. This implies a reduction in the pier flexural stiffness and therefore a softer dynamic behaviour than the elastic response of the bridge. This issue is of interest in the lumped plasticity model, where all elements remain linear elastic until the plastic hinges form, and nonlinearities are lumped at the plastic hinge locations only. The amount of stiffness reduction depends on the member ductility. The more ductile the piers are, the higher the reduction of the flexural stiffness. EC 8 Part 2 (2005) suggests to use the effective flexural stiffness calculated on the basis of the secant stiffness at the theoretical yield point for reinforced concrete members in bridges designed for ductile behaviour, whereas for structures with limited ductile behaviour, EC 8 suggests to use either the secant stiffness (or effective stiffness, defined in the following paragraph) or the flexural stiffness of the uncracked gross concrete sections. Since the bridge members have limited ductility, for comparison purposes RSA and NPO with the lumped plasticity model are carried out with both uncracked and effective stiffness. The effective stiffness is idealized reducing the section moment of inertias and is calculated as follows:
www.buildup.it 29.06.2007
- 5 -

Ieff =ν[MR(N)/φyEc] (1)
where Ec is the concrete elastic modulus, ν is a correction factor which takes into account
the higher stiffness of the uncracked length of the pier, MR(N) is the design ultimate
moment under a constant applied axial force N and φy is the section yield curvature. The
values of MR(N) and φy are obtained with a bilinear approximation of the moment-
curvature curve obtained from the section analysis of every pier. The axial force considered is that of the gravity loads only. The secant stiffness of the equivalent bilinear curve connects the origin with the yield point in such a way that the areas A and B are equal as shown in Figure 5.
Figure 5. Moment-curvature and equivalent bilinear curves at constant
axial load N=-822 kN for the east-end pier in bent 1
The ultimate curvature φu in Figure 5 is found from a section analysis, using the nonlinear
concrete and steel laws of Eurocode 2 (2005) and setting the ultimate concrete strain εcu=0.0035. Figure 5 shows the section analysis results in the longitudinal direction for
the base section of the east-end pier of bent 1 (labelled Pier 1A). The uncracked-to-effective stiffness ratios along both directions for Pier 1A (H=0.7m, B=0.35m) are 0.72 and 0.5 in the longitudinal and transverse direction respectively. This procedure is applied for every bridge pier. The average ratio is 0.7 in the longitudinal direction and 0.5 in the transversal direction. 5. LINEAR ANALYSIS (RSA) The linear method of analysis used is the classical response spectrum analysis (RSA) according to OPCM 3431 (2005). The seismic design action, AEd, is expressed in terms of
the reference seismic action, AEk, associated with a reference probability of exceedance,
PNCR, in 50 years or a reference return period, TNCR, and the importance factor γI:
AEd = γIAEk (2)
The Vasto Marina viaduct can be classified as class I bridge and the importance factor value given in OPCM 3431 (2005) is γI=1.3. Since the structure has limited ductility, the
behaviour factor ql in the longitudinal direction is set equal to 1.5. In the transverse
direction, the pier bases are quite squat and prone to shear failure, therefore the behaviour factor, qt is set equal to 1.0. Two analyses are performed with uncracked and effective stiffness for the piers. The modal responses obtained of the effective stiffness are shown in Figure 6.
www.buildup.it 29.06.2007
- 6 -

Figure 6. Mode shapes and mass participation factors for model with effective pier stiffness.
Figure 6 confirms that the bridge deck between two Gerber hinges behaves independently in the longitudinal direction, but not in the transverse direction. Subscripts UX and UY indicate the global translational directions x and y, while RZ indicate the global rotational direction z (rotation about the vertical axis). The first fundamental mode in the transverse direction for the analysis performed with the
effective stiffness is the 6th global mode, with a 0.6 sec period and a mass participation factor of 59% in the global transverse direction y. It is interesting to note that performing the analysis with the uncracked section, not only, as expected, the periods decrease because of the higher pier stiffness, but also the mass participation factors change. The mode periods and mass participation factors obtained with the uncracked pier sections are shown in Table 1.
Table 1. Mode periods and mass participation factors for model with uncracked pier stiffness.
This happens because some of the mode shapes change. Because of these changes the seismic forces may be redistributed differently and the uncracked section analysis may be unconservative. The vibration modes are combined using the CQC method. The multidirectional combination used is the 100/30 rule (Eurocode 8, 2005). The design value Ed of the action effects in the seismic design load combination is found as follows:
Ed = Gk "+" AEd (3)
Mode Period [sec] mUX mUY mRZ
1 0.96 0.202 0.007 0.004
2 0.81 0.158 0.000 0.000
3 0.69 0.021 0.000 0.000
4 0.67 0.123 0.008 0.001
5 0.52 0.131 0.000 0.000
6 0.49 0.000 0.610 0.159
7 0.49 0.131 0.000 0.000
8 0.35 0.200 0.001 0.001
www.buildup.it 29.06.2007
- 7 -

where “+” implies “to be combined with” and Gk are the actions due to the characteristic
values of the gravity loads. First, the results obtained using the effective stiffness are presented. Shear and flexural design checks of the pier critical sections are performed. The piers subjected to highest design forces are the less slender located at the bridge south end. For the design spectrum used, the bridge capacity is well below the demand. Figure 7 shows the interaction diagram of Pier 1A and the demand point for ag=0.15 g for
a compression axial load of 598 kN. The shear design forces calculated are: VSdx = 441
kN (longitudinal direction) and VSdy = 460 kN (transverse direction). The shear strengths
of Pier 1A are VRdx=276 kN and VRdy=136 kN in the longitudinal and transverse
directions, respectively. The maximum peak ground acceleration that can be sustained by the bridge according to the RSA is ag = 0.04g. The same analysis is performed using the
uncracked section properties and a design spectrum with ag = 0.04g. In this case both the
flexural and shear demands are higher than the section capacities.
Figure 7. Interaction diagram of Pier 1A and demand for a
g = 0.15g (P=-598 kN)
Table 2 compares the forces calculated using uncracked and effective stiffness.
Table 2. Comparison between the forces calculated with the uncracked and the effective stiffness.
In the case of Pier 1A the analysis carried out with the uncracked section is more conservative. The maximum peak ground acceleration that the bridge can withstand in shear using the uncracked section properties is ag = 0.03g
6. PUSHOVER ANALYSIS The NPO consists of applying monotonically increasing constant shape lateral load distributions to the structure under consideration. The viaduct model is three-dimensional, because of the plan irregularity of the structure. Two separate analyses with lateral loads applied in one direction only are performed with the aim of finding the ratio, αu/α1, that is
the ratio between the ultimate base shear and the base shear at the formation of the first plastic hinge. In addition, the NPO can provide information on the plastic hinge formation sequence and to check the structural performance for given design target displacements.
Comb InerziaP kN
VSdx
kN
VSdy
kN
MSdtransv
kN-m
MSdlong
kN-m
Max Icrack -598 116 118 198 267
Min Icrack -1042 -118 -124 -206 -271
Max Iuncrack -501 119 174 298 278
Min Iuncrack -1146 -120 -184 -311 -282
www.buildup.it 29.06.2007
- 8 -

In the longitudinal direction, the section between the Gerber hinges are considered dynamically independent and therefore the piers are considered as a single-degree of freedom oscillator. Two load distributions are applied to each bent: one proportional to the masses multiplied by the first mode shape and the second one proportional to the masses. In the transverse direction, the load distributions are applied to the entire bridge model. The NPO is performed with the lumped plasticity model only. Two hinge types are defined: one to simulate the flexural behaviour (deformation controlled) and the other one to simulate the shear behaviour (force controlled). The deformation controlled hinges are modelled with M-k curves according to the FEMA 356 (2000) Seismic Rehabilitation Guidelines for Buildings, and the force controlled hinges are modelled assigning the shear strengths computed with Eurocode 2 (2005). For each NPO in the longitudinal direction, a node at the pier top is selected as reference point, whereas in the transverse direction the centroid of the deck is selected as reference point. As indicated in Linee Guida (2005) and Eurocode 8 (2005), the target displacement dT is computed with a modal analysis performed with an elastic response spectrum, The target displacement represents the displacement that the reference point has to reach for each analysis for a given limit state. The capacity curve obtained with every analysis is approximated by an energy-equivalent bilinear curve. In the longitudinal direction, αu/α1 is approximately equal to
1.4. This results seems to justify a selection of ql=1.5, given the limited ductility offered
by the structure in the longitudinal direction. In the transverse direction the curve remains elastic until the formation of the first hinge. The first hinge is forcecontrolled and corresponds to shear failure of one of the piers of bent 1. A behaviour factor qt equal to 1
seems to be appropriate in the transversal direction. 7. TIME HISTORY ANALYSES NTH are performed with the program Midas Civil v. 7.1.2. (Midas 2006), using distributed plasticity, force-based, fiber-section frame elements. To perform the analysis, seven pairsof recorded accelerograms are used. The accelerograms have magnitudes, source distances, and mechanisms consistent with those that define the design seismic input. These earthquake records are part of a suite of ground motions that comply with the requirements of the new Italian seismic codes, OPCM 3431 (ag = 0.15g, Type C Subsoil).
They can be found at the website: http://reluis.rdm-web.com/pagine/Accelerogrammi.htm (file C3 (cor).zip). The main requirement is that the average spectral ordinates of the seven records must match (with a small tolerance), the elastic code spectrum. In particular, the average recorded spectral ordinates must not underestimate the code spectrum (ag = 0.15g) by
not more than 10% over a broad period range. Rayleigh damping ratio is used for the
analysis. The first longitudinal mode and the first transversal mode (6th mode) are assigned a damping ratio of 0.02. As previously stated, average material strength properties are used. The concrete is modelled using the Kent and Park model, whereas the steel is modelled using the Menegotto-Pinto model. The concrete section are not well confined by the stirrups, thus a brittle concrete post peak stress-strain behaviour is used, as shown in Figure 8. The sections are subdivided into 10x10 fibers. Because program Midas does not currently include tapered elements, the tapered piers are modelled with at least two elements and every element is integrated with 3 Gauss-Lobatto points. In the longitudinal direction, the pier height varies between 3 meters (Bent 1) and 10 meters (Bent 14), and the length of the first Gauss-Lobatto point varies between 250 mm and 367 mm. The base section dimensions of bent 1 are h=700 mm and b=350 mm, whereas the base section dimensions of bent 14 are h = 880 mm and b = 350 mm. The length of the first Gauss point was selected to match as close as possible the plastic hinge length Lp in the longitudinal direction. The piers are expected to fail predominantly in
flexure in the longitudinal direction. The plastic hinge length is found according to the following expression (EC8/2005): Lp = 0,10L+0,015 fykdbL (4)
where L is the distance from the end section of the plastic hinge to the point of zero moment in the pier (shear span length), fyk is the steel characteristic yield strength [MPa]
and dbl is the diameter of the longitudinal reinforcement. Assuming L equal to half of the
www.buildup.it 29.06.2007
- 9 -

column height, fyk = 315 MPa and dbl = 28 mm, Lp for bent 1 is 282.3 mm and for bent
14 is 379.3 mm. Both values are similar to the length of the first integration point. As for these two bents also the other length of the integration points were calibrated to match the plastic hinge lengths.
Figure 8. Concrete stress-strain behaviour
The design base acceleration for the site is ag=0.15g. The accelerograms used to perform
the NTHs are labeled in Table 3.
Table 3. Accelerogram pairs used
Both the ensemble of the 14 accelerograms and the ensemble of the 3 accelerogram pairs, NTH1, NTH3 and NTH5 satisfy the response spectrum compatibility requirements of OPCM3431 (2005). Five incremental dynamic analyses (IDA) are performed with 3 the accelerogram pairs, NTH1, NTH3 and NTH5 for ag = 0.15g, 0.12g, 0.09g, 0.06g and 0.03g. The absolute
maximum values (as indicated by Eurocode 8, 2005) obtained with the three analyses are considered. The shear strength is checked using the Eurocode 2 (2005) formulas, based on the modified compression field theory. The results obtained from the 3 accelerogram pairs using the maximum shear forces are shown in Figure 9.
Accelerogram pairs
X Dir Y Dir
NTH1 000333xa 000333ya
NTH2 000600xa 000600ya
NTH3 000879xa 000879ya
NTH4 001312xa 001312ya
NTH5 001726xa 001726ya
NTH6 006918xa 006918ya
NTH7 007329xa 007329ya
www.buildup.it 29.06.2007
- 10 -

Figure 9. Shear failures by NTH for different a
g
In Figure 9, Vx indicates shear failure in the longitudinal direction, Vy shear failure in the
transversal direction and Vxy shear failure in both directions. For ag = 0.03g the piers do
not fail. The first pier to fail in the longitudinal direction is in bent 1 for an acceleration ag = 0.06g.
The base shear of the first column to fail in shear is depicted in Figure 10 for different PGA levels.
Figure 10. Pier 1 base shear force
For an acceleration ag=0.15 g nearly all the pier columns fail in shear. The members
sections are assumed to fail in flexure when the ultimate concrete strain, εcu = 0.0035 is
reached. Figure 11 shows the deformed shape when the first column fails in flexure for ag = 0.06g.
In Figure 11, F stands for flexural failure and Y indicates section yielding . The picture clearly indicates that the high torsion of the first bent causes failure of the outmost external column, labeled Pier 1A.
www.buildup.it 29.06.2007
- 11 -

Figure 11. Flexural failure: accelogram called 000333xa(1) and 000333ya(1)
The base section at flexural failure is shown in Figure 12. The high biaxial bending causes a remarkable neutral axis rotation. The maximum concrete strain and shear forces reached at the Pier 1A base for ag=0.06g are shown in Table 4. If only three pairs of
accelerograms are considered εcmax=0.00353, VSdx,max=254.9 kN and VSdy,max=228.5
kN whereas the average of the results obtained with 7 pairs of accelerograms provide design values of εcmax=0.00318, VSdx,max=190.3 kN and VSdy,max=162.9 kN.
Figure 12. Base section at failure
Table 4. Maximum concrete strain and maximum shear at the base of column A
The moment-curvature behavior in the two orthogonal directions is shown in Figure 13.
εcmax
Strain x 1000
VSdx,max
kN
VSdy,max
kN
NTH1 3.53 198.0 201.7
NTH2 1.11 139.2 117.3
NTH3 3.32 254.9 219.9
NTH4 0.55 110.3 44.9
NTH5 2.38 200.0 228.5
NTH6 0.85 150.0 102.0
NTH7 10.57 279.8 226.0
www.buildup.it 29.06.2007
- 12 -

Figure 13. Moment-Curvature at the first Gauss point
In order to evaluate the maximum peak ground acceleration that the bridge can withstand, it is necessary to also account for the importance factor γI=1.3. Therefore,
considering the maximum results of three accelerograms, the acceleration which causes flexural failure of the bridge is 0.046g, whereas the shear failure acceleration is 0.028g. If the average of the results obtained with 7 accelerograms is considered, the peak ground accelerations that induce failure increase by about 10%. 8. CONCLUSIONS The main findings of this paper are summarized in hereafter. The Vasto Marina viaduct has a high risk of failure for the design seismic input corresponding to the severe damage limit state (reference return period of 50 years). The maximum peak ground accelerations that the viaduct can withstand according to RSA and NTH analyzes are similar if the uncracked section properties are used for the RSA. This result indicates that for bridges with limited ductility capacity, the uncracked sections may be used for the analyses. The NPO analyses are performed separately for each direction. In the case of irregular bridges, with high torsional forces and high biaxial bending the NPO appears to be difficult to apply and unreliable. On the other hand, the behaviour factors predicted with the NPO in the longitudinal and transverse directions seem to confirm the values originally selected for the RSA analysis. In several codes the ultimate bending capacity is estimated on the basis of the ultimate chord rotation. For example, Eurocode 8 (2005) uses the following formula: θp,u = (Φu-Φy)Lp(1-Lp/2L) (5)
where Φu is the ultimate curvature, Φy is the yielding curvature, Lp is the plastic hinge
length and L is the distance from the end section of the plastic hinge to the point of zero moment in the pier (shear span length). The formula was calibrated on the basis of simple bending tests. How reliable (and accurate) is the above approach for biaxial bending checks, such as those necessary for the bridge studied in this paper? Moreover, how can L be defined in the case of biaxial bending? It appears that further investigations are needed to improve the current design guidelines for seismic vulnerability assessment of existing concrete bridges. This paper presents the results of an ongoing effort. Further studies are necessary to test and improve the nonlinear methods of analyses currently included in seismic design codes. Such nonlinear methods, and in particular nonlinear dynamic analyses, appear to be the only logical and physically motivated approach to the study of older bridges, originally conceived and built without considering modern concepts of capacity design.
www.buildup.it 29.06.2007
- 13 -

ACKNOWLEDGEMENTS The authors are grateful to MIDAS Ltd. and CSP Fea for providing the finite element program Midas Civil and for the precious technical support. REFERENCES Priestley, M.J.N., Seible, F., Calvi, G.M. [1996] Seismic design and retrofit of bridges. John Wiley & Sons, Inc., New York, NY 10158-0012. Iervolino, I., Maddaloni, G., Cosenza, E. [2006] “Unscaled real record sets compliant with Eurocode 8,” First European Conference on Earthquake Engineering and Seismology, Geneva, Switzerland. MIDAS [2006], Civil Analysis Reference Manual, Civil (v7.12 Release No.1) Midas Information Technology Co. Ltd., 2006 OPCM 3431 [2005]– Ulteriori modifiche ed integrazioni all’OPCM3274, (in Italian, Technical Norms for design, evaluation and seismic rehabilitation of buildings). Linee Guida per la Valutazione della Sicurezza Sismica dei Ponti Esistenti, Bozza 1, Progetto DPC – ReLuis 2005-2008, Linea 3: Valutazione e Riduzione del Rischio Sismico di Ponti Esistenti, January [2005] (in Italian, Design Guidelines for Evaluating the Seismic Safety of Existing Bridges, Draft), personal communication. FEMA 356 [2000]: Prestandard and Commentary for the Seismic Rehabilitation of Buildings, Prepared by American Society of Civil Engineers, Washington, D.C. (U.S.A.), November. Eurocode 2 [2005]: Design of Concrete Structures, European Committee for Standardization. Eurocode 8 [2005]: Design of Structures for Earthquake Resistance - Part 1, European Committee for Standardization. Eurocode 8 [2005]: Design of Structures for Earthquake Resistance - Part 2, European Committee for Standardization. OPCM 3274 [2003]. Ordinanza del Presidente del Consiglio dei Ministri n. 3274 del 20 marzo 2003 e successive modificazioni e integrazioni. Norme tecniche per il progetto, la valutazione e l’adeguamento sismico degli edifici (in Italian, Technical Norms for design, evaluation and seismic rehabilitation of buildings).
www.buildup.it 29.06.2007
- 14 -