SEISMIC RESISTANCE OF A HYBRID SHEARWALL SYSTEMTen alternative interface designs, reflecting a...
153
SEISMIC RESISTANCE OF A HYBRID SHEARWALL SYSTEM Vom Fachbereich 13 - Bauingenieurwesen der Technischen Universität Darmstadt zur Erlangung der Würde eines Doktor Ingenieurs (Dr.-Ing.) genehmigte DISSERTATION vorgelegt von N. Mohammad Shirali ( M. Sc. ) aus Bander-e-turkman, Iran Darmstadt 2002 D 17
Transcript of SEISMIC RESISTANCE OF A HYBRID SHEARWALL SYSTEMTen alternative interface designs, reflecting a...

SEISMIC RESISTANCE OF A HYBRID SHEARWALL SYSTEM
Vom Fachbereich 13 - Bauingenieurwesen der Technischen Universität Darmstadt
zur Erlangung der Würde eines Doktor Ingenieurs
(Dr.-Ing.)
genehmigte DISSERTATION
vorgelegt von N. Mohammad Shirali ( M. Sc. )
aus Bander-e-turkman, Iran
Darmstadt 2002 D 17

Referent: Prof. Dr.–Ing. Jörg Lange Korreferent: Prof. Ir. Jack G. Bouwkamp Tag der Einreichung: 15.03.2002 Tag der mündlichen Prüfung: 29.05.2002

ABSTRACT
SEISMIC RESISTANCE OF A HYBRID SHEARWALL SYSTEM
Shirali, N. Mohammad, Ph. D. in Structural Engineering, May, 2002, 125 Pages
Keywords: Hybrid structure, Shear wall , Earthquake design, Interface connection,
Shear strength, Cyclic loads, Finite element method, Nonlinear response, Concrete,
Steel, Composite
Earthquake design of buildings involves the creation of a structural system capable of re-
sisting the seismic forces in a ductile manner. Postearthquake observations have shown that
the failure of many reinforced concrete buildings has been due to the inability of the lower-
story columns to resist the earthquake imposed loads. Failure of these members are often
related to an inappropriate layout of the reinforcement in the upper and lower regions of
these columns (insufficient column-tie sizing and spacing, leading to tie failure as well as
buckling of the longitudinal reinforcement). Considering these observations, a new hybrid
structural system for both moment resistant frame and shearwall buildings, which was pro-
posed by Bouwkamp 1990, has since been studied at the Darmstadt University of Technol-
ogy. The system involves the use of prefabricated composite columns consisting of steel
tubular thin-walled sections filled with concrete and typical reinforced concrete beam-slab
floors. In case of shear walls, the composite columns are used as edge members of the con-
crete shear walls. In principle, the steel tubular column section replaces effectively the lon-
gitudinal column reinforcement and provides the confinement for the (core) concrete.
Realizing that the connection between the composite columns and concrete beam-slab floor
as well as between the shear-wall edge members and concrete wall are critical, the connec-
tion design at the interface of the different elements has been a major subject of study. Ear-
lier research on the design and seismic response of hybrid moment resistant frames have
shown that this system can be used effectively for the aseismic design of ductile moment
resistant frames. The present study has focussed on the use of this system for shear wall
type buildings.
I

Ten alternative interface designs, reflecting a one-third scale model of the edge region of
the first story shear wall of an 8-story building, have been developed and tested. The model
shear wall was designed with a double-layered 10 x 10 cm mesh having � 8 mm bars verti-
cally and � 6mm bars horizontally. Horizontal anchor bars between composite column and
concrete wall extended through holes in the steel column section, were spaced at 10 cm o.c.
and directly connected to the wall reinforcement. Also, an interface arrangement with in-
clined (45-degree) anchor bars as well as headed shear studs welded to the steel tube sec-
tion were investigated. All specimen were tested under cyclic alternating displacement-
controlled loads.
Main results in terms of force-displacement, shear force- shear distortion and force-slip re-
lation are presented and discussed.
A non-linear FE computer program, ANSYS 5.7 has been used to study the inelastic cyclic
response under shear of the different interface connections (IFC) tested. Two models have
been developed to capture the interface behavior between edge column and RC wall panel.
Firstly, a model with non-linear springs, interconnecting the common interface nodal points
of the wall panel and steel tube have been introduced. The non-linear spring-characteristics
were taken from the empirically derived mechanical model idealising the force-slip rela-
tionship at the interface. Secondly, a simple truss-like model capable of capturing the inter-
face behavior has been derived. A comparison between experimental and numerical results
show an excellent agreement and clearly support the validity of the both models developed
in this study for predicting the non-linear response of the hybrid shear wall system under
earthquake load conditions.
II

KURZFASSUNG
HYBRIDES SCHUBWAND SYSTEM ZUR ANWENDUNG IN ERDBEBENGEBIETEN
Shirali, N. Mohammad, Dr.-Ing. in Bauingenieurwesen, Mai, 2002, 125 Seite
Schlüsselwörter: Hybrides Tragwerk, Schubwand, Erdbebenbemessung, Anschluss-
bereich, Schubkapazität, Zyklischenbelastung, Finite Elemente Methode, Nichtline-
are Verhalten, Beton, Stahl, Verbund
Die Erdbebenbemessung eines Gebäudes bezieht die Konstruktion einer Bauwerksstruktur
ein, die seismischen Kräften in einer duktilen Weise widerstehen kann. Nachbebenuntersu-
chungen haben gezeigt, dass Einstürze häufig durch Versagen der Stützen in den unteren
Geschossen des Stahlbetonrahmens verursacht wurden. Weiterhin sind lokale Schäden an
Randstützen in Stahlbetonschubwänden bemerkt worden. Ursache dafür ist hauptsächlich
mangelnde Umschnürung des Betonkernes (Abstand) und das Knicken der Längsbeweh-
rung, wie auch mangelhafte Qualitätsüberwachung und Baustelleninspektion.
In Betracht dieser Schadensbeobachtungen, um den Erdbebenwiderstand von Stahlbeton-
schubwänden und Stahlbetonrahmen zu verbessern, wurde, ein neues hybrides System für
die oben genannten Systeme von Bouwkamp 1990 vorgeschlagen. Diese Systeme wurden
seitdem an der Technische Universität Darmstadt experimentell untersucht. Dieses hybride
Systeme wird durch betongefüllte rechteckige Stahlhohlprofile als Verbundstützen gekenn-
zeichnet, welche die volle Umschnürung des Betonkernes und der Längsbewehrung her-
stellt. Verbundstützen, gebildet aus ausbetonierten rechteckigen Stahlhohlprofilen, werden
in typischer Stahlbauweise erstellt. Der Rest des Gebäudes, insbesondere die Decken wer-
den konventionell hergestellt. Die hybride Schubwand besteht aus Verbundstützen als
Randstützen und einer Stahlbetonwand, die miteinander durch eine Anschlussbewehrung
verbunden sind. Die Kombination von Beton und Stahlhohlprofil und die volle Umschnü-
rung des Kernbetons durch das Stahlhohlprofil erhöht die Tragfähigkeit, die Steifigkeit und
die Duktilität der Verbundrandstütze im hybriden Schubwandsystem.
III

Die Schlüsseleigenschaft für die Entwicklung dieses Wandsystems ist das Verhalten der
Verbindung zwischen der Verbundrandstütze und dem Stahlbetonpaneel. Eine frühere For-
schung auf dem Gebiet der Bemessung des seismischen Verhaltens der hybriden Stahlbe-
tonrahmen hat gezeigt, dass dieses System effektiv für erdbebengefährdete Regionen be-
nutzt werden kann. Die vorliegende Untersuchung hat sich auf den Gebrauch von Hybriden
Schubwandsystemen (HSW) und einen wirkungsvollen und ökonomischen Einsatz dieses
System in erdbebengefährdeten Gebieten konzentriert.
Zur Entwicklung einer optimalen Entwurfslösung für den Anschluss zwischen der Stahlbe-
tonwand und der Verbundstütze sind zehn alternative Entwürfe entwickelt und getestet
worden. Zu diesem Zweck ist ein 8-stöckiges Gebäude mit einer hybriden Schubwand als
horizontallasttragendes Element entworfen worden. Als Versuchskörper wurde der Verbin-
dungsteil des ersten Stockwerkes des Schubwandmodells im Maßstab 1:3 angenommen
und entworfen. Die Bemessung des ausgewählten Versuchsmodells ergab eine kreuzweise
Bewehrung mit 6 mm dicken Horizontalstäben und 8 mm dicken Vertikalstäben auf beiden
Seiten (zwei Schichten) der Wandscheiben. Als Parameter wurden der Durchmesser und
die Anordnung der Bewehrung untersucht. Es wurden folgende vier verschiedenen Mo-
dellvarianten untersucht:
1)
2)
3)
4)
Anschlussbewehrungen als durchgesteckte Bewehrung senkrecht zur Verbundfuge
durchgesteckte Bewehrung senkrecht zur Verbundfuge mit zusätzlich ange-
schweißten Kopfbolzen am Stahlhohlprofil
durchgesteckte Bewehrung mit 45 Grad Neigung zur Verbundfuge
angeschweißte Bewehrung am Stahlhohlprofil senkrecht zur Verbundfuge
Die Versuche wurden statisch-zyklisch, weggesteuert durchgeführt.
IV

Das Verhalten der Versuchskörper wurde in bezug auf Kraft-Verschiebungs-Beziehungen,
Kraft-Schub-Verformungs-Beziehungen und Kraft-Schlupf-Beziehungen angegeben und
analysiert.
Das nichtlineare FE –Programm ANSYS 5.7 wurde benutzt, um zyklisches nichtlineares
Verhalten der unterschiedlichen Anschlusslösungen unter zyklischer Schublast zu untersu-
chen. Zwei Modelle wurde entwickelt, um das Verhalten des Anschlusses zwischen den
Randstützen und dem Stahlbetonpaneel zu prüfen. Erst wurde ein Modell mit nichtlinearen
Federn im Anschlussbereich abgebildet. Die nichtlinearen Feder-Eigenschaften wurden aus
einem mechanischen Modell für eine idealisierte Kraft-Schlupf-Beziehung, die aus expe-
rimentellen Ergebnissen abgeleitet wurde, entwickelt. Als zweites wurde ein einfaches
Fachwerk Modell verwendet, dass in der Lage ist, das Anschlussverhalten abzubilden. Ein
Vergleich zwischen den experimentellen und numerischen Resultaten zeigt eine ausge-
zeichnete Übereinstimmung und bestätigt deutlich die Gültigkeit der beiden Modelle, die in
dieser Studie für die Voraussagen des nichtlinearen Verhaltens des hybriden Schubwand-
systems unter Erdbebenbelastung verwendet wurde.
V

VI

ACKNOWLEDGEMENTS The work described in this thesis was carried out during my research assistantship in the
Institute of Steel Construction and Fracture Mechanics at Darmstadt University of Tech-
nology under supervision of Prof. Dr.-Ing. Jörg Lange and Prof. Ir. Jack G. Bouwkamp.
The author wishes to express his sincere thanks to Prof. Ir. Jack G. Bouwkamp for his in-
valuable comments and extensive critical discussions and suggestions throughout the re-
search work.
The author would like also to express his sincere thanks to Prof. Dr.-Ing. Jörg Lange for his
guidance, encouragement, critical suggesstions and his painstaking reading of the manu-
script during this work. His invaluable support are greatly appreciated.
Acknowledgements are also due to Prof. Dr.-Ing. Eckehard Fehling from University of Ge-
samthochschule Kassel for his helpful discussion and invaluable support during all the
stages of the work.
Sincere thanks are also due to Prof. Dr.-Ing T. Seeger, head of Material Mechanics Labora-
tory at Darmstadt University of Technology, for his readiness to help and his assistance.
Sincere thanks are also due to Dr.-Ing. habil U. Akbay for his interest.
The efforts of all colleagues, laboratory and administrative staff members of the Institute of
steel construction are greatly appreciated. Especially, I would like to thank Dr.-Ing. Almut
Suppes and Mrs. Hedy Lang for their help and encouragement during this work.
My deepest gratitude goes to my family and friends who have always encouraged and sup-
ported me throughout my education.
N. M. Shirali
VII

VIII

TABEL OF CONTENTS ABSTRACT ........................................................................................................................I
KURZFASSUNG .............................................................................................................III
ACKNOWLEDGEMENTS .......................................................................................... VII
TABEL OF CONTENTS ................................................................................................IX
LIST OF FIGURES......................................................................................................XIII
LIST OF TABLES...................................................................................................... XVII
NOTATIONS ................................................................................................................XIX
1 INTRODUCTION ...................................................................................................... 1
1.1 General…...................................................................................................................1 1.2 Objectives ..................................................................................................................3 1.3 Scope .........................................................................................................................3
2 SEISMIC DESIGN OF HYBRID SHEARWALL ...................................................7
2.1 General.......................................................................................................................7 2.2 Design considerations................................................................................................7 2.3 Design procedure according to Eurocode..................................................................9
2.3.1 Determination of base shear force......................................................................9
2.3.2 Distribution of the base shear force..................................................................12 2.3.3 Analysis of the structure...................................................................................12 2.3.4 Design requirements of hybrid shear wall........................................................13
2.3.4.1 Design of wall pane…………………………………………………... 15
IX

2.3.4.2 Design of composite edge column…………………………………... 20 2.3.4.3 Interface connection design……..……………………………............ 21
2.4 Design procedure according to UBC 1994..............................................................22 2.4.1 Determination of base shear force....................................................................22 2.4.2 Distribution of the base shear force ............................................................... ..23 2.4.3 Analysis of the structure...................................................................................24
2.5 Building description ................................................................................................25 2.6 Earthquake analysis and design of prototype building according to Eurocode 8....25
2.6.1 Design of the hybrid shear-wall .......................................................................30 2.6.2 Design of composite columns:.........................................................................31
2.7 Analysis of prototype building according to UBC94 ..............................................32 2.8 Comparison of the EC8 and UBC94 .......................................................................34
3 EXPERIMENTAL PROGRAM ............................................................................. 35
3.1 General ....................................................................................................................35
3.2 Selection of test specimen .......................................................................................36 3.3 Test specimen design...............................................................................................41
3.3.1 Interface connection with reinforcing bars.......................................................41 3.3.2 Interface connection with reinforcing bars and shear studs .............................42 3.3.3 Interface connection with reinforcing bars welded to composite edge col. .....43
3.4 Construction of specimens ......................................................................................43
3.4.1 Concrete ...........................................................................................................43 3.4.2 Reinforcing Steel..............................................................................................49
X

3.4.3 Tubular Steel Section .......................................................................................49
3.5 Test setup.................................................................................................................50 3.6 Instrumentation........................................................................................................52 3.7 Test sequence...........................................................................................................53
4 TEST RESULTS AND DISCUSSIONS ................................................................. 57
4.1 General.....................................................................................................................57 4.2 Force – Displacement ..............................................................................................57
4.2.1 Test serie 1 .......................................................................................................57 4.2.2 Test serie 2 .......................................................................................................59
4.3 Shear Force – Shear Distortion................................................................................72
4.3.1 Test serie 1 .......................................................................................................72 4.3.2 Test serie 2 .......................................................................................................73
4.4 Force – Slip relationship..........................................................................................80
4.4.1 Test serie 1 .......................................................................................................80 4.4.2 Test serie 2 .......................................................................................................80
5 TEST EVALUATION AND CHARACTERIZATION OF CYCLIC FORCE –
SLIP RELATION .................................................................................................. 91
5.1 General.....................................................................................................................91 5.2 Idealized cyclic nonlinear Force – Slip relationships ..............................................91
XI

6 ANALYTICAL MODEL OF TEST SPECIMENS .............................................. 99
6.1 General ....................................................................................................................99 6.2 Failure Criteria of Concrete...................................................................................100 6.3 Concrete Modeling………..……………………………………………………..104
6.4 Steel Modelling .....................................................................................................106 6.5 Geometrical modelling of test specimen. ..............................................................107 6.6 Computer Model Formulation...............................................................................108
6.7 Analytical Studies..................................................................................................112
7 COMPARISON OF EXPERIMENTAL AND ANALYTICAL RESULTS ..... 115
7.1 General ..................................................................................................................115 7.2 Force – Displacement......................................................................................…..115
8 CONCLUSIONS AND RECOMMENDATIONS FOR
FUTURE RESEARCH .......................................................................................... 121
REFERENCES .............................................................................................................. 123
XII

LIST OF FIGURES
2.1: Elastic response spectrum.........................................................................…….. 10
2.2: Failure modes of RC wall with expected response....................................……. 14
2.3: 3D view of prototype building.....................................................................….. 28
2.4: Plan view of building........….........................................................................…. 29
2.5: Elevation view of selected hybrid shearwall..................................................…. 29
3.1: 1/3 Scale of hybrid shearwall (HSW).............................................................…. 39
3.2: General view of test specimen....................................................................……. 39
3.3: Reinforcement detail of specimen HSW7.....................................................…. 45
3.4: Reinforcement detail of specimen HSW10..................................................….. 45
3.5: Reinforcement detail of specimen HSW1 & HSW6.......................................… 46
3.6: Reinforcement detail of specimen HSW2 & HSW9…...................................… 46
3.7: Reinforcement detail of specimen HSW3.......................................................… 47
3.8: Reinforcement detail of specimen HSW4 & HSW8.......................................… 47
3.9: Reinforcement detail of specimen HSW5………….......................................… 48
3.10: Test setup....................................................................................................…… 51
3.11: Instrumentation of test specimen for test serie 1..........................................….. 54
3.12: Instrumentation of test specimen for test serie 2..........................................…. 55
3.13: Loading History............................................................................................…. 56
4.1: Force - displacement diagram for specimen HSW1.......................................… 63
4.2: Force - displacement diagram for specimen HSW2.......................................… 63
4.3: Force - displacement diagram for specimen HSW3.......................................… 64
4.4: Force - displacement diagram for specimen HSW4.......................................… 64
4.5: Force - displacement diagram for specimen HSW5.......................................… 65
4.6: Force - displacement diagram for specimen HSW6.......................................… 65
4.7: Force - displacement diagram for specimen HSW7.......................................… 66
4.8: Force - displacement diagram for specimen HSW8.......................................… 66
XIII

4.9: Force - displacement diagram for specimen HSW9....................................... 67
4.10: Force - displacement diagram for specimen HSW10..................................... 67
4.11: Cracking pattern of Specimen HSW2 at failure stage.................................... 68
4.12: Cracking pattern of Specimen HSW2 at failure stage..............................….. 68
4.13: Cracking pattern of Specimen HSW2 at failure stage...….......................….. 69
4.14: Cracking pattern of Specimen HSW2 at failure stage..............................….. 69
4.15: Cracking pattern of Specimen HSW7, front view..................................…… 70
4.16: Cracking pattern of Specimen HSW7, back view................................…….. 70
4.17: Cracking pattern of Specimen HSW7 at failure.stage...........................……. 71
4.18: Cracking pattern of Specimen HSW7at failure stage............................……. 71
4.19: shear strain - displacement relationship............................................……….. 73
4.20: Applied force - average shear strain for HSW1................................…..…… 75
4.21: Applied force - average shear strain for HSW2.................................…..….. 75
4.22: Applied force - average shear strain for HSW3................................…..…. 76
4.23: Applied force - average shear strain for HSW4...............................…...…. 76
4.24: Applied force - average shear strain for HSW5............................……..….. 77
4.25: Applied force - average shear strain for HSW6............................…......….. 77
4.26: Applied force - average shear strain for HSW7...........................……...….. 78
4.27: Applied force - average shear strain for HSW8............................…......….. 78
4.28: Applied force - average shear strain for HSW9.............................….....….. 79
4.29: Applied force - average shear strain for HSW10....................….............….. 79
4.30: Force - slip diagram for HSW1..................................................…………… 82
4.31: Force - slip diagram for HSW2........................................................………. 82
4.32: Force - slip diagram for HSW3..........................................................……… 83
4.33: Force - slip diagram for HSW4.....................................................…….…… 83
4.34: Force - slip diagram for HSW5....................................................……..…… 84
XIV

4.35: Force - slip diagram for HSW6.....................................................…....…… 84
4.36: Force - slip diagram for HSW7....................................................……..…… 85
4.37: Force - slip diagram for HSW8......................................................…....…… 85
4.38: Force - slip diagram for HSW9........................................................…..…… 86
4.39: Force - slip diagram for HSW10...................................................…....…… 86
4.40: Force - slip diagrams for HSW6 at different cycles.............................……. 87
4.41: Normalized force - slip envelope for HSW6 .......................................…… 87
4.42: Normalized force - slip envelope for HSW7 ......................................……. 88
4.43: Normalized force - slip envelope for HSW8 ..........................................….. 88
4.44: Normalized force - slip envelope for HSW9 ..........................................….. 89
4.45: Normalized force - slip envelope for HSW10 ........................................….. 89
5.1: Force - slip envelope curve for specimen with straight bars at IFC.….....…. 95
5.2: Force - slip envelope curve for specimen with diagonal bars at IFC…......… 95
5.3: Normalized force - slip envelope curve for straight bars..........................…. 96
5.4: Normalized force - slip envelope curve for diagonal bars........................….. 96
5.5: Interpolation curve based on Eq. 5.4 for straight bars.................................... 97
5.6: Interpolation curve based on Eq. 5.4 for diagonal bars..............................… 97
5.7: Interpolation curve and primary multilinear model for straight bars.........… 98
5.8: Interpolation curve and primary multilinear model for diagonal bars............ 98
6.1: Failure surface in 3D stress space…............................................................... 103
6.2: a) Meridian Plane……………………………..........................................…. 103
6.2: b) Deviatoric Plane………………………………………….….................... 103
6.3: Concrete stress-strain model…..……………………………………………. 105
6.4: Steel stress-strain model.………..............................................................….. 106
6.5: Finite element mesh layout…….................................................................… 110
6.6: A basic layout of the test structure with selected computer elements........… 111
XV

6.7: A truss-model layout for straight reinforcing bar……………....................… 112
7.1: Force-displacement comparison for specimen HSW1...............................…. 117
7.2: Force-displacement comparison for specimen HSW2...............................…. 117
7.3: Force-displacement comparison for specimen HSW6….................………… 120
7.4: Force-displacement comparison for specimen HSW9...............................…. 120
XVI

LIST OF TABLES
2.1: Values of the parameters defining the design spectrum..................................... 11
2.2: Force distribution in longitudinal direction of the building............................... 27
2.3: Force distribution for single shear-wall in longitudinal direction...................... 27
2.4: Force distribution for the building in longitudinal direction.........................… 33
2.5: Force distribution for a single shear-wall in longitudinal direction...............…. 33
3.1: Hybrid Shear wall System – Basic Reinforcement of Test Specimens...........… 40
3.2: Concrete properties of test specimens.............................................................… 49
4.1: Summary of test results..................................................................................…. 62
XVII

XVIII

NOTATIONS
Latin upper case symbols
A Cross-section area
Aa Cross sectional areas of the structural steel
Ac Gross cross-sectional area of concrete
Ae Minimum cross sectional area in any horizontal plane of a structural wall
in the first story of a structural wall
Ai Effective cross sectional area in any horizontal plane in the first story of a
structural wall
As Cross sectional areas of the reinforcement
Avf Shear-friction reinforcement across the shear plane
Ea Modulus of elasticity of the structural steel
Ec Modulus of elasticity of the concrete
Es Modulus of elasticity of the reinforcement
F Normalized force value
Fb Seismic base shear force
FR Experimental reference force value
Ft Top floor load
Fx, Fi, Fn Lateral force applied at level x, i or n
G Shear modulus
H Total height of the building
Hw Height of a wall
I Occupancy importance factor
I1 First invariant of the stress tensor, σij
Ia Moments of the inertia of the cross sectional areas of the structural steel
Ic Moments of the inertia of the cross sectional areas of the concrete
Is Moments of the inertia of the cross sectional areas of the reinforcement
J2 , J3 Second and third invariants of the deviatoric stress tensor, sij
XIX

K Experimental initial stiffness for the straight and diagonal-bar reinforcing
arrangements
Kd1 and Kd2 Exponents describing the design spectrum for vibration periods greater
than TC and TD
L Length
MSd Design bending moment at the base of the wall
MRd Design flexural resistance at the base of the wall
Mx Overturning moment at level x of the building
N Axial force
N Total number of stories above the base of the building
Npl, Rd Design value of ultimate plastic axial force resistance
NRd Design value of axial force resistance
Nsd Design value of acting axial force
Q Behavior factor
Rw Nonlinear response modification factor ranging from 4 to 12
S Subsoil factor (1.0 to 2.0)
S Normalized slip value
Sd (T1) Ordinate of the design spectrum at the fundamental period T1 of the building
Se(T) Ordinate of the elastic response spectrum
SR Experimental reference slip value
T Natural period of vibration of the building
TB, TC, TD Design-spectral parameters
T1 Fundamental period of vibration of the building
V Shear force
Vcd Shear resistance of concrete compression zone
Vdd Dowel resistance of bars
Vfd Friction resistance
Vid Shear resistance of inclined bars
)( RdMV Shear force corresponding at the state of the design flexural failure of the
critical wall region
XX

Vn Shear strength
VRd Design value of shear resistance
Vsd Design shear force
SdV � Shear force obtained from the analysis
wdV Contribution of the reinforcement to the shear resistance
Vx Shear force at any story x of the building
W Total weight of the building
Wj, Wi ,Wx Weight at jth, ith or xth level
Z Zoning factor for regional seismicity
Latin lower case symbols
bw Width of the web of a beam, thickness of the boundary element of a wall
bwo Thickness of the web of a wall
db Diameter of the reinforcing bar
bhd Diameter of the horizontal bar
bvd Diameter of the vertical bar
dbw Diameter of the hoop reinforcement in beams and columns
de Length of the structural wall in the first story oriented parallel to the applied
forces
f Strength of a material
1f High compressive stress point on the compressive meridian
2f High compressive stress point on the tensile meridian
bcf Biaxial compressive strength
cf Unaxial compresive strength
fcd Design value of concrete compressive strength
ckf Characteristic strength for concrete
ft Tensile strength of the reinforcement
XXI

tf Uniaxial tensile strength
fy Yield stress of the steel
fyd Design value of yield stress of the steel
fyk Characteristic value of yield stress of the steel
fyd,h Design yield strength of the horizontal web reinforcement
fyd,v Design value of the yield strength of the vertical web reinforcement
h Height, depth
hc Width of a column in the direction of a beam framing into the column
hcr Critical height of a reinforced concrete wall
hN Total height of the building in feet
hs Clear storey height
hw Depth of a beam
hx, hi , hn Height above ground of the levels x, i or n
k Coefficient, factor
l Length
lb Anchorage length of reinforcement
lc Length of a wall area with confining reinforcement
lcr Length of a critical region
lw Length of a wall
lwi Length of the structural wall in the first story in the direction parallel to the
applied forces
q Behavior factor
cr Compressive meridians
tr Tensile meridians
s Local sub-soil condition
sh Spacing of horizontal web reinforcement in a wall
sv Spacing of vertical web reinforcement in a wall
t Thickness
z Lever arm of internal forces
zj, zi Heights of masses above level of application
XXII

Greek symbols
� Angle, coefficient, factor, ratio
� Ratio of the peak ground acceleration to the acceleration of gravity
�s Shear ratio
�0 Spectral acceleration amplification factor for 5 % viscous damping
� Strain, coefficient, factor
� Magnification factor depending on the ductility class
�C Compressive strain in the concrete
�s Tensile strain in the steel
�I Floor displacements due to a set of lateral forces fi at floor levels
i=1,2,...., N in an N-story building
ƒ( ξ, r, θ) Haigh-Westergaard stress space
� Partial safety factor
� Unit weight of the concrete
�Rd Design value of the over strength ratio of steel
Rd� Global factor
� Factor accounting for the available shear resistance of plain concrete after
cyclic degradation in a beam-column joint
� Coefficient of the friction
Poisson's ratio
Reinforcement ratio
h Reinforcement ratio of the horizontal web bars
v Reinforcement ratio of the vertical web bars
� Shear stress
�Rd Basic design shear strength of members
� Moments reversal factor used in capacity design
σ1, σ2, σ3 Principle stresses
XXIII


1 INTRODUCTION
1.1 General
The subject of earthquake resistance design of structures has a long history. Hence, it has
been recognized that to design a safe and economic structure in seismic regions, the struc-
tural engineer needs to use to select an appropriate structural system. In multi-story build-
ings, reinforced concrete (RC) structural walls provide an efficient bracing system against
lateral forces. Buildings with shearwalls perform favorably in comparison with more flexi-
ble framed structures as far as damage to non-structural elements is concerned.
Recognizing the usefulness of structural walls, many experimental and analytical studies
have been carried out worldwide during the past four decades to better understand the
seismic behavior of these walls. As a result, substantial advances in the seismic design of
RC structural walls have been achieved as reflected in current codes. Postearthquake inves-
tigations, however, have shown that significant damage has still occurred in RC buildings,
primarily due to poor design details or / and construction. Damage to shear walls occurred
often in the edge columns (flanges) of such walls due to a lack of confinement of the con-
crete core and buckling of the longitudinal steel in these edge elements.
In order to improve the earthquake resistance of such RC shear wall buildings, a new hy-
brid structural-wall system has been proposed and studied at the Darmstadt University of
Technology (TUD). This system is characterized by concrete-filled square or rectangular
steel tubes serving as composite edge-member columns and a typical concrete shear wall.
The tubular steel sections provide full confinement of the core concrete and longitudinal
column reinforcing steel and allow deleting the typical, but often inadequate, stirrup rein-
forcement. The use of steel sections with filled-in concrete will improve the performance
(ductile behavior) of the edge members. In hybrid shearwalls with well-confined boundary
elements, some amount of web damage can occur without necessarily limiting the flexural
1

capacity of the wall. The present research covers the development of an experimental test
program and the evaluation of the experimental findings. Recommendations for an effec-
tive and economic design of hybrid shearwall systems (HSW), suitable for use in regions of
high-seismic risk, have been presented. A significant aspect of the hybrid wall system is the
design and performance of the interface connection reinforcement between the composite
edge member column and concrete wall.
The composite columns made of concrete filled steel tubes (CFST), are erected in a typical
steel construction manner. These concrete filled columns are prefabricated with the inter-
face-connection reinforcement for the walls, or possibly the beams, extended through holes
in the steel tubular walls. Typically, the girders and slab system are formed and constructed
as a typical reinforced concrete floor system. Also, the use of steel beams connected to the
composite concrete-filled steel columns, together with a composite slab could be an alter-
native. The composite columns can be fabricated in segments with nominal lengths of 1 ½
or 2 ½ stories for the first- and upper- floor regions. At intermediate floor levels the prefab-
ricated columns could typically have a length of 2 stories.
In the fabrication/construction process, holes for the interface connection reinforcement,
are drilled first in the tubular column wall. The necessary reinforcement is then placed be-
fore casting of the concrete. First, if necessary, a steel reinforcement cage will be placed in-
side the hollow column section. Then, the interface connection reinforcement to connect
the edge column to the RC wall panel or beams will be placed through the predrilled holes.
As an alternative interface connection, shear studs used in combination with the reinforcing
bars could be welded to the wall of the tubular steel column. Finally, the concrete will be
poured to fill the column section. The fabrication process can be carried out on-site or in a
construction yard.
2

1.2 Objectives
The main objective of this research program was aimed at evaluating experimentally the
cyclic force – slip behavior at the interface connection under cyclic displacement controlled
load reversals and to predict analytically the nonlinear static and dynamic response of such
hybrid shear walls under earthquake loading.
Accordingly, an experimental program for testing 1/3-scale hybrid shearwall specimens
was undertaken to obtain information on the behavior of the interface connection rein-
forcement (IFCR) between the RC wall panel and edge members. Different design solu-
tions were studied to develop an optimal interface connection (IFC).
Secondly, considering various solutions, an idealized numerical model of the composite
system, capable of predicting the cyclic force-slip behavior of the interface connection, has
been developed and its accuracy assessed in comparison with the experimental test data.
1.3 Scope
In order to assess the seismic behavior of the various IFCR layouts between tube and wall
panel, ten 1/3-scale wall elements with one-sided composite steel-tube columns (edge
members) have been studied under cyclic displacement controlled loads. The specimens
studied, represented a part of a 1/3-scale hybrid shearwall of a hybrid building system.
This report is divided into eight chapters. The opening chapter addresses the usefulness of
structural shear walls as lateral load resisting elements for buildings in seismic zones and
gives a brief description of the proposed hybrid wall system.
The second chapter describes both the principle aspects of RC shearwall design, as given in
two codes, namely, the European Seismic Code 8 (EC8) and the USA Uniform Building
Code (UBC-94), and the design considerations of the hybrid structural wall members.
Also, the design of the composite tubular steel section filled with concrete, as a boundary
3

element of the hybrid shear wall, is briefly discussed. The seismic design of a 8-story high,
hybrid shearwall structure is presented. The structure has been designed in detail using
simplified equivalent static lateral-load analysis procedures as defined in the EC8 and
UBC94 code provisions. In this process, code-defined approximate fundamental periods
and appropriate earthquake design spectra have been used, to determine the seismic base
shear force and the lateral force distribution over the height of the building.
In the third chapter, the experimental program has been described. The design and con-
struction of the test specimens and details of the wall reinforcements and interface connec-
tions are presented. Material properties, test procedures and the instrumentation layout are
given.
The experimental results are presented in chapter 4. In particular, the overall force – dis-
placement, the shear force - shear distortion behavior of the different test specimens and
the force – slip relationship at the interface between the composite edge column and shear
wall are given and discussed.
Considering the experimental results presented in chapter 4, chapter 5 covers the develop-
ment of an idealized nonlinear force – slip relationship of the interface connection for sub-
sequent correlative studies (chapter 7).
A nonlinear FE computer program has been used in chapter 6 to evaluate the overall cyclic
response of the hybrid shear walls for different interface connections (IFC) of the hybrid
shear wall system. Nonlinear material models for both reinforcing steel and concrete that
are capable of reproducing the hysteretic response of the hybrid shear wall are presented.
In chapter 7, the accuracy of the mathematical model to predict the cyclic nonlinear behav-
ior of the hybrid shear walls, with both straight and inclined interface reinforcement, has
been assessed by comparing the analytical results with the experimental force-slip results
of the test specimens.
4

Finally, chapter 8 covers the summary, conclusions and recommendations for further re-
search and design improvement.
5

6

2 SEISMIC DESIGN OF HYBRID SHEARWALL
2.1 General
Structural codes are legal documents which provide guidelines for the design, detailing and
construction of structures. Field observations in addition to experimental and analytical re-
search have been the main source in the development of seismic code requirements. Code
provisions can be seen as a minimum demand for structures with a more or less conven-
tional and regular configuration. Most seismic building codes permit the determination of
the design lateral forces using either a static lateral force procedure or a dynamic force ana-
lysis method.
Worldwide, the simple equivalent lateral force method combined with the capacity design
concept is the most commonly used method to evaluate the earthquake design forces. For
the preliminary seismic design of a prototype building used in this study, the simple static
lateral force procedures defined in the European and US Seismic codes (respectively the
1998 Eurocode 8 and the 1994 Uniform Building Code), have been used. The use of these
codes is justified as the prototype structure is regular in layout as defined in the both codes.
These two seismic design codes are used in order to show the current design method prac-
ticed in Europe and the USA. A brief description of the principal requirements of each
code with respect to the seismic design of RC shear walls have been summarized. An eight
story prototype building with hybrid shearwalls to resist the horizontally induced seismic
loads has been designed according to Eurocode 8. A comparison with UBC code require-
ments is presented.
2.2 Design considerations
Basically, the two codes reflect a design philosophy by which the structures should be able
to resist minor earthquakes without damage, moderate earthquakes without structural dam-
age but possibly with some nonstructural damage, and major earthquakes without collapse
but with both structural and nonstructural damage. The basic reason to permit substantial
7

building damage under major earthquake exposure lies in the high construction cost of a
structure designed to resist seismic forces without damage.
As current codes have not yet codified design procedures for the proposed hybrid wall sys-
tem, procedures specified for RC shear walls have been used. For the design of the com-
posite edge members, design rules for composite columns have to be followed. The inter-
face connection reinforcement, necessary to develop a monolithic hybrid wall system, is
designed in accordance with the shear friction design concept given in Eurocode 8 [18] and
UBC 94 [44].
These codes involve the following procedures for the design of the building:
1. Determination of the base shear force considering the seismicity zone, the earthquake
design spectrum and fundamental period of vibration of the building and the struc-
tural system ductility.
2. Determination of the dynamic forces over the height of the building by assuming a
basically triangular distribution of the base shear force.
3. Analyse the member forces of the building combining both vertical gravity loads and
horizontal forces.
4. Proportioning and detailing of the members and connections considering critical
member-force combinations.
In this study the hybrid shear wall is designed as a RC panel with composite edge member
columns. In order to achieve a monolithic behavior of the hybrid walls, different interface
connection designs between the boundary columns and concrete shear wall have been de-
veloped and tested as part of this study. The interface connection detailing is based on the
shear friction design method. It is assumed that all forces at the interface connection are
carried by the concrete reinforcing bars or/and other connectors (shear studs).
8

In the following sections, a summary of the shear wall design requirements using the EC2
[19], EC4 [17] and EC8 [18] codes are presented.
2.3 Design procedure according to Eurocode
Eurocode 8 is an European seismic code issued by the Commission of the European Com-
munities for the design and construction of buildings in seismic regions. The general pur-
pose of the code is to protect human lives and limit structural damages under earthquakes.
The capacity design criteria based on the ultimate limit state of structural systems and the
serviceability limit state of such systems are considered in this code. EC8 classifies two
distinct types of failure for RC walls, namely, flexural and shear failure. The behavior fac-
tor to be used in the analysis procedure reflects the expected ductility of the system as re-
flected by the anticipated type of failure. Based on these failure modes, design expressions
are given. A brief description of the design procedures for shear wall is listed in the follow-
ing sections.
2.3.1 Determination of base shear force
The seismic base shear force Fb is defined as:
� � WTSF db �� 1 2.1
where, Sd (T1) is the ordinate of the design spectrum at the fundamental period T1 of the
building and W is the total weight of the building.
Design spectrum Sd (T), as based on the elastic response spectrum shown in Figure 2.1, is
normalized by the acceleration of the gravity, and is defined by the following expressions:
BTT ��0 : ��
���
����� )1(1)( 0
qTTsTS
Bd
�� 2.2
CB TTT �� : q
sTSd0)( �
� ��� 2.3
9

DC TTT �� : 1
0)(dK
Cd T
Tq
sTS���
�
���
�����
� or 2.4 �20.0)( �TSd
TTD � : 1
0)(dK
Cd T
Tq
sTS���
�
���
�����
�2dK
D
TT
��
���
�� or 2.5 �20.0)( �TSd
where, � is the ratio of the peak ground acceleration to the acceleration of
gravity (�=ag/g) ,
s local sub-soil condition,
TB, TC, TD design-spectral parameters,
Kd1 and Kd2 are exponents describing the design spectrum for vibration
Periods greater than TC and TD, respectively – see Table 2.1,
�0 is the spectral acceleration amplification factor for 5 % viscous
damping and
q behavior factor.
The specific values of the several parameters pertinent to the different sub-soil classes are
shown in Table 2.1.
Figure 2.1: Elastic response spectrum
10

Table 2.1: Values of the parameters defining the design spectrum
Sub-soil
class
S �0 K1 K2 TB TC TD Kd1 Kd2
A 1.0 2.5 1.0 2.0 0.10 0.40 3.0 2/3 5/3
B 1.0 2.5 1.0 2.0 0.15 0.60 3.0 2/3 5/3
C 0.9 2.5 1.0 2.0 0.20 0.80 3.0 2/3 5/3
The natural period of vibration of the building, T, can be approximated by:
� = Ct � �4/3� 2.6
where, H is the total height of the building in meters and
Ct for a building with RC structural walls is 0.05 or, alternatively 0.075 cA/ ,
with AC being = A� i � �2wi ) H / l ( 0.2 � , where Ai is the effective cross
sectional area in any horizontal plane in the first story of a structural wall
and
lwi the length of the structural wall in the first story in the direction parallel to
the applied forces.
Alternatively, the period of the structure may be determined from Rayleigh's formula as
T = 2 � ����
N
i
ii
N
i
ii fgW11
/2�� 2.7
Where the Wi is the weight at the ith level , and � are the floor displacements due to a set
of lateral forces f
i
i at floor levels i=1,2,....,N in an N-story building.
11

2.3.2 Distribution of the base shear force
The base shear force determined from eq. 2.1 is distributed vertically as a set of lateral
forces Fi at any floor level i of the building in accordance with the following formula (2.8).
The resulting lateral force distribution along the height of the building is triangular in form,
linearly increasing from the base, and corresponds approximately to the dynamic forces
under the fundamental mode response.
Fi = Fb . ��
N
jjj
ii
zW
zW
1
2.8
Where
Fb = base shear
N = total number of stories above the base of the building
Fi = lateral force applied at level i
zj, zi = heights of masses above level of application
Wj, Wi = mass at jth or ith level
2.3.3 Analysis of the structure
The shear force Vx at any story x is given by the following formula as the sum of the lateral
seismic forces above the specified story, namely,
Vx = 2.9 ���
N
xiiF
1
Consequently, the overturning moment Mx at level x of the building is given by
Mx = 2.10 ���
�
N
xixii zzF
1)(
12

2.3.4 Design requirements of hybrid shear wall
The design of earthquake resistant hybrid shear walls is aimed at providing a structural sys-
tem with adequate energy dissipation and a sustained capacity to resist both horizontal and
vertical loads. In general, the designer needs to know the maximum possible shear and
moment values which can be expected considering the pattern of seismic forces. The de-
signer should be able to determine the shear and flexural capacities in the critical wall re-
gions in order to predict, given the different load combinations, if either flexural or shear
failure can be expected. In order to develop a ductile system, it is desired to provide struc-
tural walls with a shear capacity greater than the maximum shear associated with the avail-
able moment capacity. Hence, the wall design may call for a shear load capacity twice as
large as the shear force related directly with the flexural capacity of the walls.
The different design provisions in EC8 for RC slender and squat walls consider the differ-
ent modes of failures as reflected in the different “ductility classes” used in earthquake re-
sistant concrete design. Slender walls are defined as walls with a height to length ratio
greater than 2 and squat walls as walls with a corresponding ratio less than or equal to 2.
The basic two types of the failure, namely, flexural failure and shear failure are shown in
Figure 2.2.
Depending on the intended hysteretic energy dissipating capacity of concrete shear walls,
three ductility classes (DC), namely, low, medium and high can be selected. This selection
affects both the overall dynamic forces as reflected by the base shear force Fb – which is in-
fluenced by the behavior factor q – and the detailed design requirements associated with
the different “ductility classes”. In the following sections, design procedures for RC walls
and composite columns are summarized.
13

Figure 2.2: Failure modes of the RC wall with expected resp
14
Failure mode
Flexural, ductile
Flexural, brittle Shear, web diagonal failure in compression Shear, web diagonal failure in tension Shear, horizontal sliding
onse

2.3.4.1 Design of the wall panel
For slender walls, with the typical flexural mode of failure, the design shear force Vsd can
be expressed as:
SdSd VV ��� � 2.11
Where, is the shear force obtained from the analysis, and SdV �
�� is the magnification factor depending on the ductility class and calculated
as:
qTSTS
MM
e
ce
Sd
rdRd�����
2
1
))()((1.0)(�� 2.12
Where, is a global factor, intended to counterbalance the chosen partial safety factor Rd�
of steel and to cover partial hardening effects as well as uncertainties of the
models involved; it may taken equal to 1.25 in case of a high ductility class
design,
MSd is the design bending moment at the base of the wall,
MRd is the design flexural resistance at the base of the wall,
Se(T) is the ordinate of the elastic response spectrum,
T1 is the fundamental period of vibration of the building,
Tc is the upper limit period of the constant spectral acceleration branch, and
q is the behavior factor.
For squat walls, which typically fail in shear, there is no need to consider a dynamic ampli-
fication which would modify the wall bending moments and shear forces obtained from
the analysis. However, because the energy-dissipation capacity of a shear failure mode in
squat walls is not well defined, the design requirement calls for an increase in the shear
force obtained from the force analysis, namely,
15

SdSdRdRdSd VMMV ���� )(� 2.13 SdVq ���
In general, the distinction between the two types of failure may be made on the basis of the
ratio:
� )( RdMRd
Rd
VV�
�
� 2.14
Where is the minimum value of the design strength at shear failure mode RdV
(diagonal compression, diagonal tension or shear sliding),
)( RdMV is the shear force corresponding at the state of the design flexural
failure of the critical wall region,
Rd� is a global factor expressing the uncertainties of both the models
predicting the shear and flexural strength and the shear - ratio
value needed in order to translate MRd into V(MRd) values. For
a high ductility class� can be taken equal to 1.4. Rd
In correspondence to the different anticipated modes of failure, different q-factors can be
selected in the force analysis process. In the preliminary design of the wall reinforcement it
is necessary to assume a realistic �-value to assure the intended mode of failure. For slen-
der walls (height-to-length ratio larger than 2.0) designed for ductility classes H (high) or
M (medium) and intended to experience a flexural mode of failure, a �-value of more than
1.0 should be assumed. In case of squat walls (height-to-length ratio less than 0.75) de-
signed for one of the above ductility classes, a �-value of less than 0.50 should be assumed
if the wall is to experience shear failure. For the walls with height-to-length ratio between
0.75 and 2.0, a �-value between 0.5 and 1 are assumed with a mixed type of wall failure
(flexural and shear failure).
In assessing the potential development of a flexural or shear mode of failure, the reinforc-
ing layout in the “critical” region of the wall should be considered. This region extends
16

over part of the lower portion of the shear wall with a height of about equal to the length of
the wall or 1/6 of the height of the building.
In evaluating the shear capacity of the wall, the shear resistance of both the concrete and re-
inforcing steel has to be considered for several different modes of failure. For the concrete,
both the diagonal compression and tension failure the following inequality should satisfy,
namely:
For diagonal compression failure of the web,
VSd � VRd2 2.15 In this expression VRd2 may be calculated:
for the critical region as:
zbffV wcdckRd ������ 02 )200/7.0(4,0 2.16
and for the zone outside of the critical region as:
zbffV wcdckRd ������ 02 )200/7.0(5,0 2.17
where
z is the internal lever arm, which may be taken equal to 0,8.lw ,
bw0 is the web thickness of the wall, and
ckf is the characteristic strength for concrete in MPa, but limited to 40 MPa.
For diagonal tension failure of the web,
VSd V� Rd3 2.18
In which the shear resistance V is defined as: 3Rd
3RdV = V 2.19 wdcd V�
where, V is the contribution of the concrete, with a distinction made for the critical region
with normal tensile or compressive forces and V is the contribution of the reinforcement.
cd
wd
17

As the diagonal tension failure is affected by both the horizontal and vertical reinforcement
– acting in a simplified truss model in equilibrium with the concrete providing the diagonal
compressive strut elements – the web reinforcing bars together with the concrete should
satisfy the following conditions:
- horizontal web reinforcing bars (fully anchored to the wall boundary elements):
cdwhydhSd VzbfV ����� 0,� 2.20
where,
h� is the reinforcement ratio of the horizontal web bars ( ), hwhh sbA �� 0/�
fyd,h is the design yield strength of the horizontal web reinforcement,
z is the internal lever arm (c.o.c. distance of boundary elements), and
Vcd is the shear resistance due to mechanisms others than axial resistance of the
reinforcement and concrete-to-concrete friction.
In case of axial tension in the critical region Vcd is equal to zero; in case of axial compres-
sion in the critical region :
V 2.21 zbwRdcd ����� 0)402.1( ��
where, � is the basic design shear strength, and Rd
� the reinforcement ratio ( ) 2.22 zbA ws ./ 0��
vertical web reinforcement (properly anchored and spliced along the height of the wall):
V 2.23 SdcdwvydvSd NVzbf min0, ������ �
where,
v� is the reinforcement ratio of the vertical web bars ( ), vwvv sbA ./ 0��
fyd,v the design value of the yield strength of the vertical web reinforcement, and
Nsd the compressive force, taken positive.
18

As a minimal measure against lateral instability, the thickness bw0 of the web should not be
less than stipulated in the following:
� 20/;60/;150min0 sww hlqmmb �� � 2.24
The web reinforcement should form two identical orthogonal grids of bars with the same
bond characteristics. The minimum amount of reinforcement in both directions, to prevent
premature web shear cracking of the walls, should not be less than = = 0.002. min,h� min,v�
The following detailing provisions of the web reinforcement should be taken into account:
Horizontal bars:
002.0/ 0 ��� hwhh sbA� 2.25
bhd and 2.26 mm8� 8/0wb�
hs bhd�� 20 or 200 mm (for walls with high ductility class) 2.27
where, is the diameter of the horizontal bar and bhd hs is the spacing distance of the hori-
zontal bars.
Vertical bars:
002.0/ 0 ��� vwvv sbA� 2.28
bvd and 2.29 mm8� 8/0wb�
vs bvd�� 20 or 200 mm (for wall with high ductility class) 2.30
where, is the diameter of the vertical bar and bvd vs is the spacing distance of the vertical
bars.
19

2.3.4.2 Design of the composite edge column
Composite columns as boundary elements are designed in accordance to Eurocode 4 and
are assumed to carry the total factored vertical loads from gravity and the overturning mo-
ment due to the earthquake loads. Axial load strength��pl.Rd of composite rectangular col-
umn under compression is:
�pl.Rd = Aa fyd + Ac fcd + As fsd 2.31 Where
Aa, Ac, As are the cross sectional areas of the structural steel, the concrete
and the reinforcement, and
fyd, fcd, and fsd are the design strengths of the respective materials.
The design strengths of the materials are obtained by dividing characteristic strength by the
corresponding partial safety factors, namely,
fyd = fy / �Ma for structural steel �Ma = 1.10
fcd = fck / �c for concrete �c = 1.50
fsd = fsk / �s for reinforcement �s = 1.15
For columns under tension, the tensile strength of concrete is neglected. Hence, the axial
tensile strength of the composite column can be expressed as:
�pl.Rd = Aa fyd + As fsd 2.32
According to EC 4, the effective flexural stiffness of the composite column may be ex-
pressed as the sum of the flexural stiffnesses of the different components, namely,
( EI )e = EaIa + 0.8 EcdIc + EsIs 2.33
20

where, Ia ,Ic ,Is are, respectively, the moments of the inertia of the cross sectional
areas of the structural steel, the concrete (with the area in tension as-
sumed to be uncracked) and the reinforcement,
Ea, Es are the moduli of elasticity of the structural steel and the reinforce
ment, and 0.8 EcdIc is the effective flexural stiffness of the concrete
section with Ecd = Ecm /1.35, in which Ecm is the secant modulus of the
concrete.
In order to prevent local buckling of the concrete-filled steel tube, the depth to thickness ra-
tio should satisfy the following expression:
�52/ �th 2.34 where, h is the greater overall dimensions of the section, and
��
yf235 2.35
2.3.4.3 Interface connection design
When shear-friction reinforcement is perpendicular to the shear plane, the shear strength
Vn can be computed as,
Vn = Avf fy � 2.36
Where Avf is shear-friction reinforcement across the shear plane, fy is the yield strength of
reinforcement and � is effectively a coefficient of friction. In case reinforcing steel or
headed studs are positioned normal to the shear-friction plane the coefficient of friction is
equal to 0.7���The factor ��is equal to1.0 for normal weight concrete.
When shear-friction reinforcement is inclined to the shear plane such that the shear force
produces tension in shear-friction reinforcement, the shear strength can be computed as,
Vn = Avf fy � �11 cossin ��� � 2.37
Where� is the angle between the shear-friction reinforcement and shear plane. 1
21

2.4 Design procedure according to UBC 1994
The Uniform Building Code (UBC) is the common building code in the US and covers the
design requirements pertinent to the structural safety of buildings. The earthquake resis-
tant design requirements of this code are aimed primarily to safeguard against major struc-
tural failures and loss of life. The minimum seismic design forces stipulated by this code
are determined in accordance with a seismic-equivalent static lateral force procedure,
which has also been incorporated in Eurocode 8. A short summary of the design analysis is
given in the following sections.
2.4.1 Determination of base shear force
A critical design quantity in seismic design is the base shear force resulting from the earth-
quake induced dynamic motion of the building. Reflecting the anticipated earthquake in-
tensity or “effective peak ground acceleration”, expressed by a “zoning” factor Z, the “im-
portance” of the building, a spectral coefficient based on the earthquake design spectrum as
influenced by the local soil condition, and the expected ductility of the building, the total
base shear force can effectively be expressed as a percentage of the building weight,
namely,
V = WR
ZIC W 2.38
In which
C = 3/2
25.1T
S but not exceeding 2.75, and 2.39
I the occupancy importance factor (1.00 or 1.25),
22

S the subsoil factor (1.0 to 2.0),
Z the zoning factor for regional seismicity ranging in value from 0.075 to 0.40,
W the weight of the building and applicable portions of other loads (live loads),
and
Rw nonlinear response modification factor ranging from 4 to 12, and
T natural period of vibration of the building, approximated as:
T = Ct � �4/3Nh 2.40
Where,
hN is the total height of the building in feet, and
Ct = 0.02, or alternatively, for RC walls Ct = 0.1 cA , with Ac calculated as:
Ac = A� e � �2Ne ) h / d ( 0.2 � , where
Ae is the minimum cross sectional area in any horizontal plane of a structural
wall in the first story of a structural wall, and
de the length of the structural wall in the first story oriented parallel to the
applied forces.
Alternatively, the period of the structure may be determined from Rayleigh's formula as
given in Eq. 2.7.
2.4.2 Distribution of the base shear force
Other than a specified force Ft at the top of the building, reflecting the influence of higher
modes of vibration of the building under seismic ground excitation, the total remaining to-
tal force (V – Ft) is distributed vertically as dynamic loads Fx any level (x) of the building
in accordance with the following formula. The resulting distribution along the height of
the building reflects basically the response of the building according to the fundamental
mode.
23

Fx = ��
�
N
iii
xxt
hW
hWFV
1
)( 2.41
Where, Ft is the top floor load, with Ft = 0 for T 0.7 Sec, or �
Ft = 0.07.T.V � 0.25 V for T � 0.7 Sec,
V base shear
N total number of stories above the base of the building Fx, Fi, Fn lateral force applied at level x, i or n
hx, hi , hn height above ground of the levels x, i or n, and
Wx, Wi weight of the mass at xth or ith level
2.4.3 Analysis of the structure
The shear force Vx at any story x is given by the following formula as the sum of the lateral
seismic forces above that story, namely,
Vx = Ft + 2.42 ��
N
xiiF
Consequently, the overturning moment Mx at level x of the building is given by
Mx = Ft ( hn - hx ) + 2.43 ��
�
N
xixii hhF )(
Story drift or interstory displacement shall not exceed 0.04/Rw times the story height, nor
0.005 times the story height for the building less than 65 ft. Drift leads to second-order ef-
fects, and is the main source of both human discomfort under normal service conditions
and non-structural damages under earthquake conditions.
24

2.5 Building description
A 6-bay by 4-bay, 8-storey high hybrid shearwall building with rectangular floor plan di-
mensions of 36 m by 20 m and a height of 28 m has been designed to resist both gravity
and earthquake loads. The building – designed as an office building - has a typical storey
height of 3.5 m, except for the first floor which has a height of 4.5 m. While the vertical
loads are assumed to be carried by the columns, the lateral loads are resisted by four paral-
lel hybrid shear walls placed parallel to each of the principal directions. The walls in the
longitudinal direction of the building are 6 m long and 28 m high with a thickness of 0.25
m; in transverse direction the walls are 5 m long and 28 m high and have a thickness of
0.30 m. The building is symmetric in both directions, thus minimizing unfavourable tor-
sional effects which can be developed during an earthquake. Wall aspect ratios in longitu-
dinal and transverse directions are 4.6 and 5.6 respectively. Columns and shearwalls have
constant cross sections over the height of the building; beams and slabs also have the same
dimensions at each storey level. The plan and elevation of the building as well as the cross-
section and elevation of a hybrid shear wall in the longitudinal direction are shown in fig-
ures 2.3-2.5.
2.6 Earthquake analysis and design of prototype building according to
Eurocode 8
The building is assumed to be located in seismic zone 3 and founded on hard rock (sub-soil
class A). The normal live load is taken as 5 kN/m2 . For the preliminary design the equiva-
lent lateral load procedure has been used. Subsequently, a 3-D computer model has been
analyzed using both the ETABS and SAP2000.
25

Considering the earthquake zoning and sub-soil condition as well as the design ductility of
the building, the following spectral parameters define the design spectrum according to
Eq. 2.4:
=0.33, S=1.0, 0 =2.5, Tc=0.4, and q=5.
The fundamental period T1 of the building, according to Eq. 2.6, is calculated as 0.6 sec.
and the corresponding spectral design factor Sd (T1), according to Eq. 2.4, is calculated as
0.126. With a total weight of the building W (including partially contributing live loads) of
59976 kN and the spectral design factor of 0.126, the seismic base shear force Fb, accord-
ing to Eq. 2.1, has been calculated to be 7557 kN. The results of the calculations based on
procedures explained in sections 2.3.1 to 2.3.3 for the whole building and a single shear
wall in the longitudinal direction are listed in Tables 2.2 and 2.3, respectively.
26
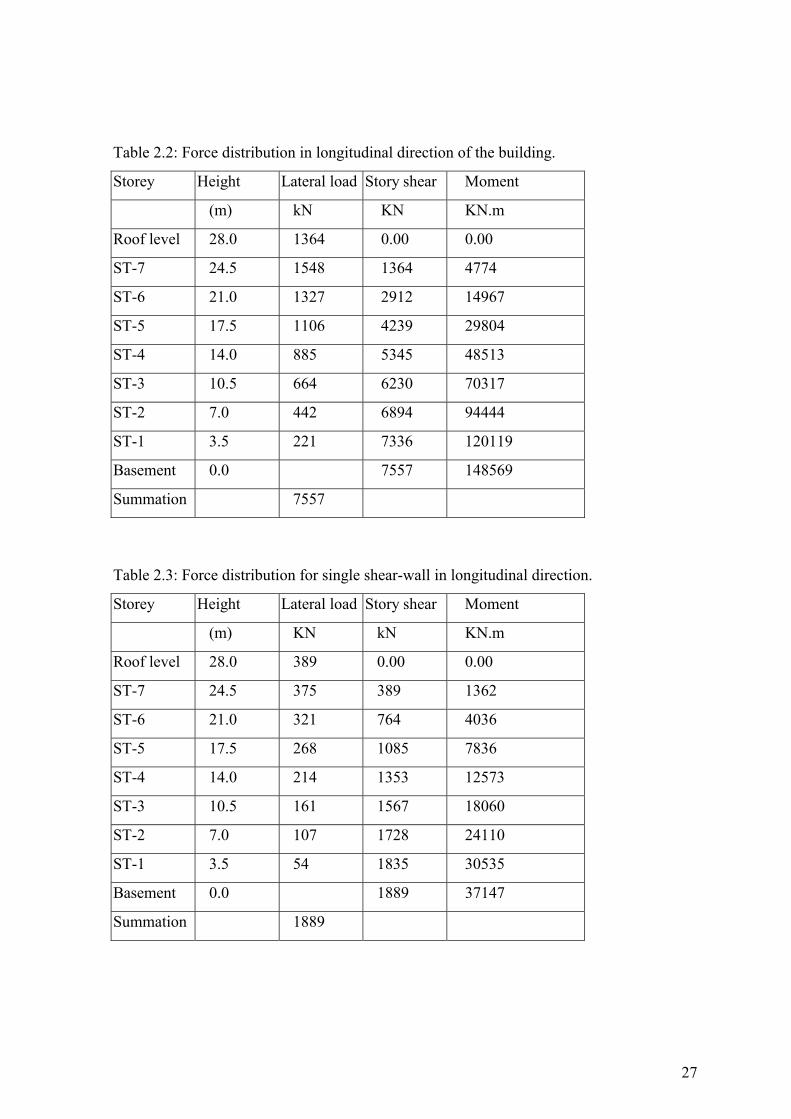
Table 2.2: Force distribution in longitudinal direction of the building.
Storey Height Lateral load Story shear Moment
(m) kN KN KN.m
Roof level 28.0 1364 0.00 0.00
ST-7 24.5 1548 1364 4774
ST-6 21.0 1327 2912 14967
ST-5 17.5 1106 4239 29804
ST-4 14.0 885 5345 48513
ST-3 10.5 664 6230 70317
ST-2 7.0 442 6894 94444
ST-1 3.5 221 7336 120119
Basement 0.0 7557 148569
Summation 7557
Table 2.3: Force distribution for single shear-wall in longitudinal direction.
Storey Height Lateral load Story shear Moment
(m) KN kN KN.m
Roof level 28.0 389 0.00 0.00
ST-7 24.5 375 389 1362
ST-6 21.0 321 764 4036
ST-5 17.5 268 1085 7836
ST-4 14.0 214 1353 12573
ST-3 10.5 161 1567 18060
ST-2 7.0 107 1728 24110
ST-1 3.5 54 1835 30535
Basement 0.0 1889 37147
Summation 1889
27

Figure 2.3: 3D view of building
28

4@5=
20 m
6@6=36 m
Composite Column 50 cm X 50 cm25
cm
30 cm
Hybrid Shearwall
g
Figure 2.4: Plan view of buildin
10.5
m17
.5 m
6.0 mFoundation
Figure 2.5: Elevation view of selectedhybrid shearwall
29

2.6.1 Design of the hybrid shear-wall
The hybrid shear wall in the longitudinal direction has been designed based on the proce-
dures described in section 2.3. For the preliminary design, a 0.25 m thick RC wall panel
with a 0.40 m square composite edge element had been selected. The following material
properties have been used for the calculations:
Material properties:
Concrete:
C30, characteristics strength, fck = 30000 kN/m2, unit weight of the concrete, � = 25 kN/m2
, modulus of elasticity of concrete, Ec = 3.2*107 kN/m2 and Poisson's ratio � = 0.20.
Reinforcing steel:
Yield strength, fsk =500000 kN/m2, modulus of elasticity of steel, Es = 2.0*108 kN/m2 .
Steel tube section:
Yield strength, fsk =240000 kN/m2 , modulus of elasticity of steel, Es = 2.1*108 kN/m2 .
The above material values lead to the following resistant values in accordance with the
EC8 stipulated procedures as explained in section 2.3.
Design of RC wall panel:
Considering that the base shear force with the load combination factor of 1.4 leads to a
base shear force of 1.4 x 1889 kN = 2645 kN. The design shear force Vsd for the wall, us-
ing Eq. 2.11 with an amplification factor of 1.98, is thus calculated as V 5273.23
kN.
�� �Sd
30

Checking the diagonal compression failure of the web, the shear resistance VRd2 is calcu-
lated from Eqs. 2.16 and 2.17 for both inside and outside of the critical region as 5280 kN
(inside the critical region) and 5293 kN (outside the critical region), respectively. Both val-
ues satisfy the inequality in Eq. 2.15 with VSd = 5273.23 kN.
For checking the diagonal tension failure of the web it is necessary to evaluate the contribu-
tion of the concrete and reinforcement in consideration of Eqs. 2.20 - 2.30 with particular
emphasis of the wall reinforcement, both horizontal and vertical. Considering the design
base shear force of 5273 kN and the material and dimensional parameters = 435
N/mm
vydf ,
2, bw0= 250 mm, Z= 0.8lw = 4800 mm and � = 0.34 N/mmRd2, the reinforcement ra-
tios were found to be =h� �v� �� 0.0094. Accordingly, the prototype shearwall contains
a reinforcing layout of two curtains of 16 mm vertical and horizontal reinforcing bars
spaced at 200 mm. Correspondingly, the shear resistance VRd3 is found to be 5549.81 kN
according to Eq. 2.19, with a contribution of the concrete of 643.01 kN and of the rein-
forcement of 4906.80 kN.
These results satisfy the inequality requirement (VSd � VRd3 ) of Eq. 2.18.
2.6.2 Design of composite columns:
The axial compressive and tensile strength��pl.Rd of the composite edge columns are calcu-
lated, using Eqs. 2.31 and 2.32, as 10149 kN and 5083 kN, respectively. The effective fle-
xural stiffness of the composite column is determined from Eq. 2.33 as 3399 kNm2. In
checking the local buckling of the steel tube wall, the width to thickness ratio of the wall is
32, satisfying Eq. 2.34.
31

2.7 Analysis of prototype building according to UBC94
In order to make a comparison of the design forces of the prototype building considering
both EC8 and UBC94 specifications, this section presents the analysis of the base shear
force and associated dynamic forces according to UBC94. The building is located in a US
seismic Zone 3, which has an acceleration response spectrum with an effective peak ground
acceleration of 0.30g. However, to permit a direct comparison with the EC8 analysis, in
which a spectrum with an effective spectral peak ground acceleration of 0.33g ( = 0.33)
had been assumed, the spectrum used for the UBC analysis has also been defined as having
an effective peak ground acceleration of 0.33g (Z = 0.33). In both cases the site condition
has been assumed to be hard rock (S = 1.0). The normal live load is taken the same, namely
5 kN/m2. The period of the structure (T1), according to Eq. 2.40 is of course the same as
for EC8, namely 0.6 sec. According to UBC94, for shear wall type buildings a system duc-
tility factor (Rw) has been defined. The building importance (I) has been rated the same as
for the EC8 calculations.
For calculating the base design force (V) according to UBC94 – see Eq. 2.38 - the follow-
ing factors, reflecting the code defined design earthquake and building characteristics noted
above have been used, namely, Z=0.33, I=1.0 , S=1.0 and Rw=8. Accordingly, with a total
building weight of 59976 kN, the base shear force was calculated as 4354 kN. The results
of the calculations for the entire building and for a single shear wall in the longitudinal di-
rection, are listed in Tables 2.4 and 2.5, respectively.
32

Table 2.4: Force distribution for the building in longitudinal direction.
H Fi Vx Mx
Storey Height Lateral load Storey shear Bending moment
(m) kN KN KN.m
Roof level 28 786 0.00
ST-7 24.5 892 785.93 2750.76
ST-6 21 765 1678.01 8623.78
ST-5 17.5 637.20 2442.64 17173.03
ST-4 14 509.76 3079.84 27952.48
ST-3 10.5 382.32 3589.60 40516.08
ST-2 7 254.88 3971.92 54417.79
ST-1 3.5 127.44 4226.80 69211.57
Basement 4354.24 84451.40
Summation 4354.24
Table 2.5: Force distribution for a single shear-wall in longitudinal direction.
H Fi Vx Mx
Storey Height Lateral load Storey shear Bending Moment
(m) KN kN KN.m
Roof level 28 224 0,00
ST-7 24.5 216 224 784.69
ST-6 21 185 440 2325.70
ST-5 17.5 154 625 4514.98
ST-4 14 123 779 7244.48
ST-3 10.5 92 1088.56 10406.17
ST-2 7 62 995.95 13891.99
ST-1 3.5 31 1057.69 17593.90
Basement 1088.56 21403.86
Summation 1087
33

2.8 Comparison of the EC8 and UBC94
A comparison of the base shear forces according to the two design codes shows a distinct
difference, namely 7557 kN (EC8) versus 4354 kN (UBC94). The reasons for these differ-
ent values result in part from a relatively small difference between the elastic response
spectral factors for T1 = 0.6 sec, namely, 0.630g for EC8 (being Sd (T) x q) and 0.585g for
UBC94 (being Z x C). A far greater difference results from the difference in the structural
ductility (behavior or performance) factor used in the two codes, namely, a “behavior fac-
tor” q of 5 for EC8 and a “structural system ductility factor” Rw of 8. As these factors ba-
sically reduce the elastic base-shear force coefficient – in percentage of total building
weight W – these factors become 0.630/5 = 0.126 for EC8 and 0.585/8 = 0.073 for UBC94.
This in turn results in the base shear force design values of 7557kN and 4354 kN, respec-
tively.
In designing the wall reinforcement in accordance to both codes, the design according to
EC8 leads to a less economic design (more steel) than in case of a design according to
UBC94. The larger code specified base shear force from EC8 results in a stronger, more
heavy reinforced wall which will remain elastic under increasing earthquake forces, as
compared to the wall designed in accordance with UBC94 specifications. The steel in the
latter wall will yield at an earlier force level and will potentially exhibit an earlier more ef-
fective energy dissipation. In principle, the EC8 design is conservative, as compared to the
UBC94 design solution.
34

3 EXPERIMENTAL PROGRAM
3.1 General
In developing an optimum design solution for the interface connection between the wall
panel and the composite edge member, several alternative interface designs have been de-
veloped and tested. For this purpose, a prototype building as explained in the previous
chapter, has been designed according to the provisions of Eurocodes EC2, EC4 and EC8.
The experimental program was divided into two series of tests. In all tests, a cyclic dis-
placement-controlled axial force was applied to the composite edge member causing a
shear transfer along the interface connection into the wall panel. The first series of tests
was carried out to evaluate the overall behavior of the hybrid wall, considering the cyclic
shear resistance of both the interface connection and the concrete shear wall. In the second
series of tests, the test setup was altered to study specifically the shear behavior of the dif-
ferent interface connections.
In fact, the results of the first test series showed in all cases a shear failure of the concrete
wall panel rather than a failure of the interface connections. Although these results clearly
showed that the interface design solutions were superior to the shear resistance of the
walls, it was not possible to make a comparative evaluation of the different interface de-
signs. Hence, the specific objective of the second series of tests was an assessment of the
hysteretic characteristics of the different types of interface connections. For that purpose,
the test set up was altered to allow a restraint of the wall panels. This arrangement in-
creased effectively the panel capacity and allowed an increase of the test loads in order to
cause failure in the interface connections and to allow a comparative evaluation of the dif-
ferent interface designs.
35
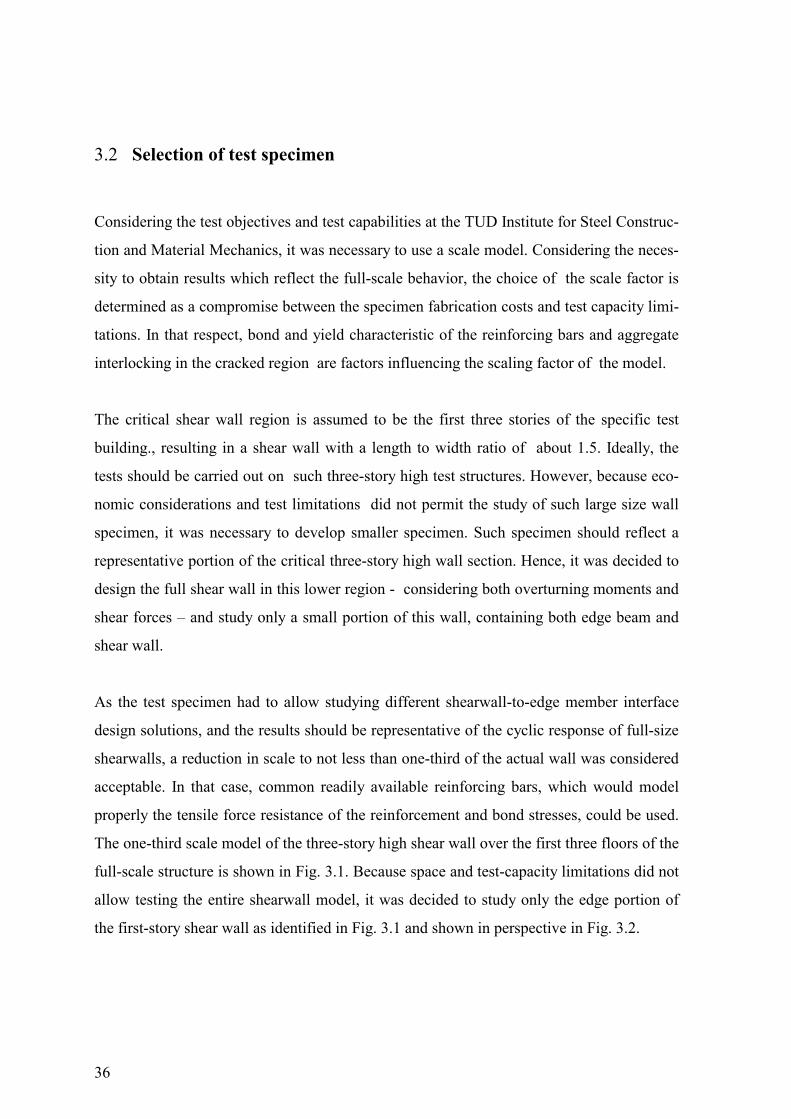
3.2 Selection of test specimen
Considering the test objectives and test capabilities at the TUD Institute for Steel Construc-
tion and Material Mechanics, it was necessary to use a scale model. Considering the neces-
sity to obtain results which reflect the full-scale behavior, the choice of the scale factor is
determined as a compromise between the specimen fabrication costs and test capacity limi-
tations. In that respect, bond and yield characteristic of the reinforcing bars and aggregate
interlocking in the cracked region are factors influencing the scaling factor of the model.
The critical shear wall region is assumed to be the first three stories of the specific test
building., resulting in a shear wall with a length to width ratio of about 1.5. Ideally, the
tests should be carried out on such three-story high test structures. However, because eco-
nomic considerations and test limitations did not permit the study of such large size wall
specimen, it was necessary to develop smaller specimen. Such specimen should reflect a
representative portion of the critical three-story high wall section. Hence, it was decided to
design the full shear wall in this lower region - considering both overturning moments and
shear forces – and study only a small portion of this wall, containing both edge beam and
shear wall.
As the test specimen had to allow studying different shearwall-to-edge member interface
design solutions, and the results should be representative of the cyclic response of full-size
shearwalls, a reduction in scale to not less than one-third of the actual wall was considered
acceptable. In that case, common readily available reinforcing bars, which would model
properly the tensile force resistance of the reinforcement and bond stresses, could be used.
The one-third scale model of the three-story high shear wall over the first three floors of the
full-scale structure is shown in Fig. 3.1. Because space and test-capacity limitations did not
allow testing the entire shearwall model, it was decided to study only the edge portion of
the first-story shear wall as identified in Fig. 3.1 and shown in perspective in Fig. 3.2.
36

In order to study several design solutions of the reinforcement along the column-wall in-
terface and in the wall connection region, it was decided to test a total of 12 specimens.
Because of cost restrictions, it was decided not to model the floors as edge elements on ei-
ther side of the test specimen, but rather introduce additional reinforcement along the free
edges of the wall in order to resist the overturning moment of the test specimen caused by
the horizontal cyclic test load acting along the column-wall interface. Structurally, this was
considered acceptable because of the basic shear loading of the wall specimen. Each spe-
cimen consisted of a tubular steel column with cross-sectional dimensions of 160 mm x160
mm and a wall thickness of 5.6 mm, attached, by interface connection (IFC) reinforcement,
to the RC wall panel which had a thickness of 85 mm.
In the real structure the shear walls, which are designed to resist the shear only (not consid-
ering overturning moments), were reinforced at both faces with 18 mm bars in both direc-
tions spaced at 30 cm. Considering the 1:3 model scale, the RC walls in the test specimens
were to be reinforced at both faces with 6 mm diameter bars in both the vertical and hori-
zontal directions, placed in a 10 cm spacing arrangement. However, in the test specimen
walls, 6 mm bars were only used in the vertical direction (perpendicular to the edge col-
umn). In the horizontal direction (parallel to the edge column) 8 mm diameter bars were
used instead. This heavier reinforcement was introduced to prevent possible premature di-
agonal cracking of the wall of the test specimen. In fact, squat walls have a tendency to ex-
perience premature cracking along the diagonal instead of multiple diagonal cracking of the
entire wall. With additional horizontal reinforcement cracking along the diagonal can be
prevented [ 33 ]
The experimental program considers the following basic types of interface connections
(IFCs):
1) Horizontal reinforcement extended from the steel composite tubular edge member
and connected directly to the horizontal panel reinforcement, with or without addi-
tional intermediate horizontal IFC reinforcement.
37

2) Diagonal reinforcement (45°) extended from the steel composite tubular edge mem-
ber and connected to the horizontal panel reinforcement, with or without additional
intermediate diagonal IFC reinforcement.
3) Horizontal panel reinforcement welded directly to the tubular wall of the steel tubular
composite edge column.
4) Shear studs welded to the steel tubular wall at intervals equal to the horizontal panel
reinforcement. In addition, horizontal connection reinforcement extended through
the wall of the tubular section and was connected to the typical horizontal panel rein-
forcement.
A summary of the reinforcing layouts for the several test specimens covering the different
IFC design solutions is presented in Table 3.1. A total of l0 test specimens, subdivided in
two test series, has been studied under cyclic shear along the interface plane between com-
posite column and concrete shear wall. It should be noted that the orientation of the hori-
zontal and vertical bars reflects the position of the wall element in the test frame (with the
edge member placed in a horizontal position). Although the basic reinforcement of the
model concrete shear wall was designed as a two-layered mesh of 6 mm bars at 10 cm in-
tervals in both horizontal and vertical directions, in the test specimens the horizontal bars –
running parallel to the edge beam – have been increased to 8 mm to prevent premature
cracking of the squat wall along the diagonal of the test specimen wall. In order to provide
for a dowel-type shear transfer along the interface, the interface connection reinforcement
consists basically of 8 mm bars spaced at 10 cm or 6 mm bars spaced effectively at 5 cm.
38

Figure 3.1: 1/3 Scale of hybrid shearwall (HSW)
Concrete filled steel tube
Concrete footing block
Figure 3.2: General view of test specimen
39

Table 3.1. Hybrid Shear wall System – Basic Reinforcement of Test Specimens
Nr. Test
specimen
Panel
reinforcement
Interface connection reinforcement
H.
Bars
V.
Bars
1
HSW-1 �8 �6 Straight anchor bars (�8) @ 10 cm
2 HSW-2 �8 �6 Diagonal anchor bars (�8) @ 10 cm
3
HSW-3 �8 �6 Straight anchor bars (�6 ) @ 10 cm plus
diagonal anchor bars (�6) @ 10 cm
4
HSW-4 �8 �6 Straight anchor bars (�6) @ 10 cm plus
(�9.52) with 12 cm long shear studs @ 10 cm
S
erie
1
5 HSW-5 �8 �6 Open stirrups with straight anchor bars (�8)
@ 10 cm welded to steel tube wall
6 HSW-6 �8 �6 Straight anchor bars (�8) @ 10 cm
7 HSW-7 �8 �6 Straight anchor bars (�6) @ 5 cm
8 HSW-8 �8 �6 Straight anchor bars (�6) @ 10 cm plus
(�9.52) with 12 cm long shear studs @ 10 cm
9 HSW-9 �8 �6 Diagonal anchor bars (�8) @ 10 cm
S
erie
2
10
HSW-10 �8 �6 Diagonal anchor bars (�6) @ 5 cm
HSW = Hybrid Shear Wall.
40

3.3 Test specimen design
The primary objective of this experimental program was the development of the most fa-
vorable design of the interface connection unter cyclic seismic-induced loading. Hence,
several alternative connection designs were tested. Detailed considerations for the different
interface connection solutions are presented in the following sub-sections. The design for
the IFC is based on shear-friction method of design (UBC 1994).
3.3.1 Interface connection with reinforcing bars
Reinforcing bars at the IFC are typically placed in pairs as in the RC wall panel. These bars
are placed either perpendicular or angular (45 degree) to the interface surface between the
composite column and concrete shear wall and have hooks inside the edge column to pro-
vide sufficient anchorage (Figure 3.3-3.7). Transverse holes in the tubular wall for the IFC
reinforcement at the edge column can be arranged in sets of 2 with a spacing distance equal
to the spacing distance of the horizontal wall reinforcement meshes. In case of both per-
pendicular and diagonal reinforcement a second set of holes at a reduced transverse dis-
tance will be necessary to accommodate the diagonal bars. Spacing of the holes along the
interface connection is equal to the full- or half-spacing distance of the typical wall rein-
forcement.
Considering the alternating shear forces along the interface, straight bars transfer the shear
by dowel action. In case of inclined bars, which are placed under 45° with the interface in
both forcing directions, the shear forces tend to produce tension in the reinforcement. The
dowel strength across the IFC can be developed by the shear strength across the bars and
the flexure resistance of the reinforcing bars. Under those circumstances, the required a-
mount of reinforcing steel at the IFC should be larger than in the RC wall section where the
concrete carries part of shear forces. Hence, either a larger bar size, spaced at the same
41

distance as the reinforcing steel in the RC wall panel, or the same bar size as the reinforc-
ing bars of the RC wall, but with a closer spacing distance, should be used. In comparison
to the straight bars, the diagonal bar size for the IFC reinforcement can be reduced because
of tension-compression force transfer rather than the dowel action under shear force trans-
fer. The following specimens are designed with straight or/and diagonal reinforcing bars:
HSW1, HSW2, and HSW3 of Series 1 and HSW6, HSW7, HSW9 and HSW10.
3.3.2 Interface connection with reinforcing bars and shear studs In these connections, straight bars having the same bar size (6 mm) and spacing distances
as in the RC wall panel have been used. These bars, which extended 30 cm outside the
edge column, were hooked and placed through holes drilled in the column wall. Subse-
quently, concrete was placed inside the tubular section. In addition, shear studs with a di-
ameter of 9.52 mm were welded at the same level as the reinforcing bars extending from
the composite concrete-filled steel tube (Figure 3.8). In this case the applied shear force is
mainly resisted by dowel action of the bars and shear studs. The shear stud diameter should
not be too large in comparison to the straight-bar diameter and the thickness of the steel
tube. Otherwise, because of the higher relative stiffness of the studs with respect to the re-
inforcing bars, the studs will resist a larger portion of the interface shear load than the bars
and may exhibit a shear failure of the studs or a tearing of the tubular wall. In case of such
failure, the load resisting capacity of the IFC decreases significantly and may lead to a fail-
ure of the reinforcing bars. This alternative solution, which is simple to fabricate, has been
studied in specimen HSW4 and HSW8.
42

3.3.3 Interface connection with reinforcing bars welded to composite
edge columns
A possible third design alternative is the welding of the RC wall panel horizontal rein-
forcement to the edge columns (Figure 3.9). In that case the 8 mm diameter hairpin type of
connection bars are welded to the steel tubular wall and lapped to the 6 mm horizontal wall
panel reinforcement. This design solution is studied in specimen HSW5.
3.4 Construction of specimens
The hybrid shearwall test specimens were constructed in a precast concrete workshop. Af-
ter inserting the connection bars through predrilled holes inside the steel tube section con-
crete was poured inside the column. After connecting the extended bars to the panel rein-
forcement, the plywood formwork for the wall was placed in position and the concrete was
poured. The concrete was poured with the column and wall in a (normal) vertical position.
Each time two specimens were poured from the same batch. The specimens were cured for
3 days while covered by plastic sheets. Prior to testing, each wall element was whitewashed
for ease in crack identification. In the following sub-sections material properties are pre-
sented.
3.4.1 Concrete
The concrete to be used in this study was specified as C30/35 according to Eurocode 2 with
characteristic mean values for the cylinder strength fck of 30 N/mm2 and the secant modu-
lus Ecm of 32 kN/mm2, respectively. The following concrete mix was used for the
construction of the specimens: normal-strength Portland cement 350 kg/m3, water 180 li-
ter/m3 and aggregate 1790 kg/m3 with a maximum aggregate size of 8 mm. In order to ob-
tain the necessary workability, special additives had to be used, to reach a slump value of
43

120 mm. For each batch of concrete, three concrete cubes (15 *15 cm) were made to
measure the concrete compressive strength and three cylinders with dimensions of (15 * 30
cm) were made to measure the modulus of elasticity of the concrete.
The results of of the compressive strength and modulus of elasticity tests are summarized
in Table 3.2. The respective tests were carried out a few days before testing the specific test
specimens. At that time the concrete had an age of 40 - 90 days. The test results, which
showed quite non-uniform results, were found to vary between compressive strength values
of 21.78 and 46.30 N/mm2 and moduli of elasticity Ec between 20500 and 28600 N/mm2.
The summary of theoretical and experimental values of the pertinent concrete properties of
the 5 batches of concrete are given in table 3.2.
44

Section A-A
Figure 3.3: Specimen HSW7
Figure 3.4: Specimen HSW10
Section A-A
45

Section A-A
Figure 3.5: Specimen HSW1 & HSW6
Figure 3.6: Specimen HSW2 & HSW9
Section A-A
11 8-0.53@ 0.10 m
��
11 8-0.64@ 0.10 m
��
46

47
Section A-A
Figure 3.8: Specimen HSW4 & HSW8 with shear studs
Figure 3.7: Specimen HSW3
Section A-A
5
5
10 6-0.64@ 0.10 m
��
11 6-0.53@ 0.10 m
�

Figure 3.9: Specimen HSW5 with welding
Section A-A
11 8-0.96@ 0.10 m
��
48

Table 3.2. Concrete properties of test specimens
Nr. Test Specimen Concrete Property
(N/mm2)
Theoretical Measured
1 HSW-1 30,00 38,30
2 HSW-2 30,00 28,78
3 HSW-3 30,00 38,30
4 HSW-4 30,00 21,78
5 HSW-5 30,00 33,26
6 HSW-6 30,00 46,30
7 HSW-7 30,00 46,30
8 HSW-8 30,00 21,78
9 HSW-9 30,00 33,26
10 HSW-10 30,00 28,78
3.4.2 Reinforcing steel
The yield strength of the reinforcing steel having a steel grade of BSt 500 averaged at about
500 N/mm2. All reinforcement used in the hybrid shearwall test specimens was taken from
the same mill.
3.4.3 Tubular steel section
Based on the original design of the 8-story high hybrid shear-wall structure, the decision to
use a 1/3 scale model to study the interface behavior resulted in test specimens with a
square steel tubular section of 160 mm x 160 mm and a wall thickness of 5.6 mm. The hot
49

rolled steel tubes used for the fabrication of the test specimens had a yield strength of
nominally 240 N/mm2.
3.5 Test setup
In order to evaluate the cyclic shear-load resistance of the interface connection between co-
lumn and wall panel, it was decided to use a displacement-controlled double-acting load
cylinder connected to the edge column with a forcing action directly along the interface. An
overall view of the test setup as used for both series of tests is presented in Fig. 3.9, and
shows the reaction frame, test specimen and double-acting actuator. The difference be-
tween the two test series is the external support condition of the wall edges of the test
specimen. In the first series of tests the edges of the wall panel were left free to deform to
allow for an unrestricted shear distortion of the wall (Figure 3.10). In the second series of
tests the edges of the wall were supported rigidly up to the mid-height of the test panel,
thus limiting the shear distortion and reducing bending effects in the wall panel (Figure
3.11).
The overall test setup, with the edge member in a horizontal position, was dictated by the
available test frame and actuator capacity. The one-third scale model test specimen, with a
length of 110 cm and a height of 68 cm (being a portion of the shearwall width, measured
to the edge-member center line), represents part of the first-story shearwall. The wall
thickness was set at 8.5 cm (or basically 1/3 of the proto-type wall thickness of 25 cm).
50
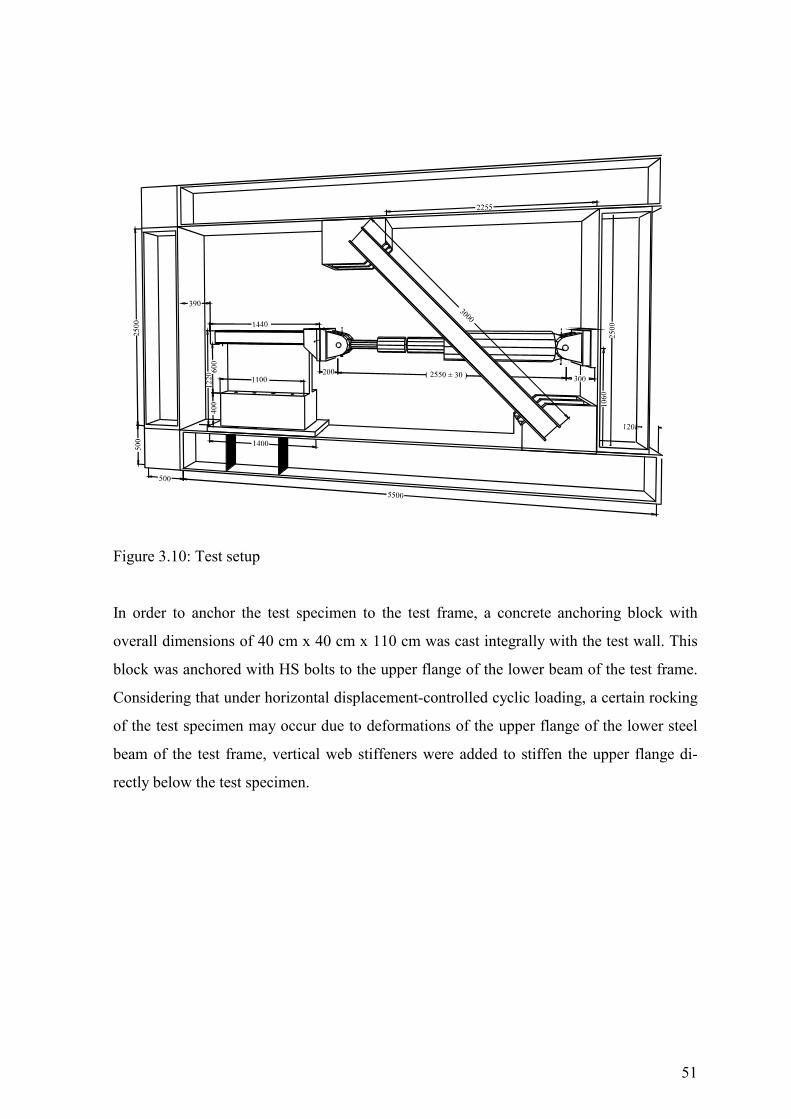
Figure 3.10: Test setup
In order to anchor the test specimen to the test frame, a concrete anchoring block with
overall dimensions of 40 cm x 40 cm x 110 cm was cast integrally with the test wall. This
block was anchored with HS bolts to the upper flange of the lower beam of the test frame.
Considering that under horizontal displacement-controlled cyclic loading, a certain rocking
of the test specimen may occur due to deformations of the upper flange of the lower steel
beam of the test frame, vertical web stiffeners were added to stiffen the upper flange di-
rectly below the test specimen.
51

3.6 Instrumentation
The instrumentation of the specimens was designed to obtain under increasing displace-
ment-controlled cyclic loads information about not only the axial force distribution along
the edge column, in order to evaluate the shear-force transfer along the interface, but also
the slip along the interface between column and panel as well as the bending and shear de-
formation of the concrete wall.
Strain gages (D30-D41, see Fig. 3.10) to record the axial forces were placed at three sec-
tions along the length of the column. In each section four gages were placed, two on each
side wall near the top and bottom of the section. In order to measure the relative slip be-
tween the column and RC-wall panel, three LV displacement transducers (LVDT) were
placed on one side of the wall only. The position of these LVDTs coincided with the in-
strumented sections of the tubular edge column. The bending and shear deformations of the
concrete panel were measured by transducers placed vertically and horizontally (against a
reference frame) and along the panel diagonals. Transducers at the bottom on both sides of
the specimen measure the movement attributed to the support.
Basically, the different interface connections were designed with the intend that the resis-
tance of the connections would be larger than the capacity of the shear wall. However, in
the first series of tests the shear wall failed prematurely before any significant slip along the
interface could be detected. In fact, the shear wall failed due to bending and shear in the
lower part of the wall. In order to prevent such failure and obtain a better assessment of the
interface connections, it was decided in the second series of tests to restrain the shear dis-
tortion of the lower part of the wall and reduce the overturning moment in the lower region.
This latter setup is shown in Fig. 3.11.
Considerin the instrumentation specifically, other than the typical test control transducers
for the displacement control and loadcell output, LVDT displacement transducers W10
through W22 were used to record the shear panel deformations (W10 – 13), the interface
52

slip (W14 – 16 with a gage length of 7 cm), and the bending deformations (W17 - 22, ver-
tically). The displacement potentiometers W23 - W26 were used to measure possible base
rocking motions. Furthermore, straingages (D30 - D41) were placed at the three previously
noted sections along the length of the steel column tube. Finally, displacement potentiome-
ters (SZ 2 and 3) were used to measure the overall shear distortions of the shear wall.
3.7 Test Sequence
The tests were performed under displacement controlled cyclic loading until complete fail-
ure of the specimens were observed. A typical displacement-controlled loading history is
shown in Figure 3.12. Specifically, the alternating displacements in sets of three cycles we-
re increased in 0.5 mm intervals from +/- 0.5 to 3.0 mm and in 1.0 mm intervals from +/-
4.0 to +/- 5.0. Hereafter, the displacements were applied in single cycles with an 1.0 mm
interval reduction to a displacement of +/- 2.0 mm. Subsequently, the displacements were
increased again as single cycles with an interval of 1.0 mm up to a displacement of +/- 5.0
mm. Finally, the test specimen was subjected in sets of two cycles to displacements of +/-
6.0, 7.0, 8.0, 9.0, 10.0, 12.0, 14.0, 16.0 mm etc., up to failure.
The displacement history of three or two cycles allowed in principle an assessment of the
deteriorating behavior under repeated displacements. The cyclic displacement reduction af-
ter the specimen had been subjected to cycles of up to +/- 5.0 mm, was introduced to eva-
luate the extend of permanent damage up to that level of distortion.
53

Test frame
Back view
Test frame
Front view
SZ1
SZ1
Figure 3.11: Instrumentation of test specimen for test serie 1
54

Test frame
Back view
Test frame
Front view
SZ1
SZ1
Figure 3.12: Instrumentation of test specimen for test serie 2
55
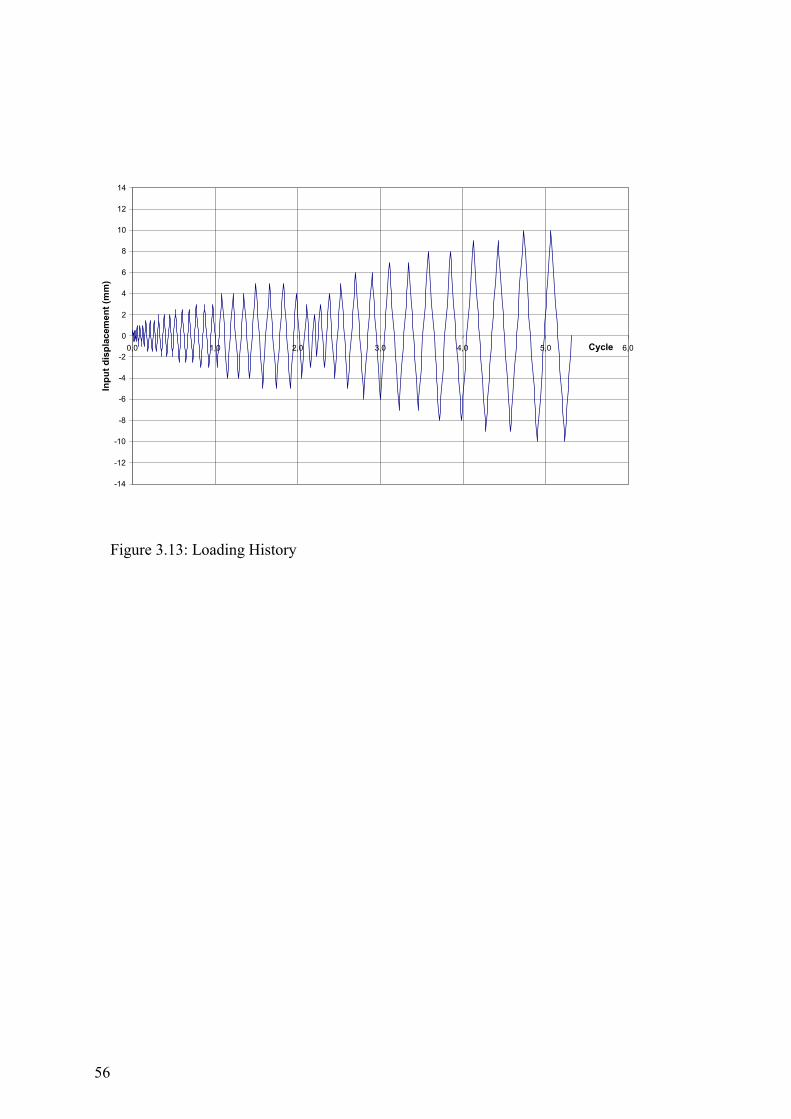
-14
-12
-10
-8
-6
-4
-2
0
2
4
6
8
10
12
14
0,0 1,0 2,0 3,0 4,0 5,0 6,0Cycle
Inpu
t dis
plac
emen
t (m
m)
Figure 3.13: Loading History
56

4 TEST RESULTS AND DISCUSSIONS
4.1 General
For the purpose of this study, characteristic test results, covering the load - displacement,
shear force - shear distortion and shear force – interface slip relationship as well as the
shear force distribution along the length of the interface have been evaluated.
The purpose of the straingage layout along the length of the column section was an evalua-
tion of the shear-force transfer along the interface between composite column and concrete
panel. Results showed under low force and displacement levels a force-transfer concentra-
tion near the loaded end of the column of about 1.4. However, under increasing displace-
ment levels and repeated loading cycles, the shear force distribution became more uniform.
Because the purpose of these measurements was limited to the relative force distribution
during testing, detailed test results are not presented in this report.
Test results on the force-displacement, shear distortion and interface slipping have been
evaluated and are presented in detail in the following sections. A qualitative assesment of
the cyclic response of the several specimens has been made from a direct comparison of the
various response parameters. In evaluating the test results, particular emphasis is paid to
the force - slip relationship indicative of the behavior of the interface connections.
4.2 Force – Displacement
4.2.1 Test serie 1
The hysteretic force displacement relationships for the specimens (HSW1-HSW5), show-
ing the actuator force versus the displacement at SZ1, are presented in Figs. 4.1 - 4.5. A
first observation of the different graphs shows a very high degree of pinching, typical for
57

the crack development in concrete under cyclic shear loads. In fact, in all specimens first
diagonal hairline cracking occured at a cyclic load of about 50 to 100 kN corresponding to
a displacement of about 0.5 to 1 mm. Before reaching the maximum resistance, cracking
was observed over a larger area of the wall panel. However, after having reached the
maximum resistance, failure was initiated by the appearence of widening cracks at the bot-
tom part of the wall panel beginning from the mid-height of the panel (bending) towards
the middle region at the bottom of the panel (shear). Under this continuing cyclic exposure,
the concrete cover at both sides of the panel was crushed and spalling of the concrete cover
was observed. Also, in this test phase the widening of the main cracks caused the vertical
reinforcement in the bottom part of the panel to rupture progressively from the outer edges
towards the middle of the panel. The failure was thus a flexure - shear failure originated by
concrete crushing and tearing of the vertical reinforcement of the wall panel. Maximum
forces and displacements reached during the experiments are tabulated in Table 4.1.
Considering the several graphs, it is obvious that before the specimens reached their maxi-
mum load resistance, repeating the cyclic displacements at the same displacement magni-
tude did not significantly reduce the cyclic load resistance (stable loops). However, at and
after the maximum resistance had been reached, subsequent repeated cycling at the same
displacement level exhibited invariably a significant reduction of the force resistance and
illustrates the progressive failure of one of the cracks. This phenomenon – of basically sta-
ble loops before raching the maximum load resistance and the subsequent reduction of the
resistance under repeated cycling at the same displacement level at or after the maximum
resistance had been reached – is clearly illustrated in Fig. 4.5.
Comparing the behavior of the different test specimens, it should be noted that the relative
low resistance of HSW1, and to a certain extent also HSW2, were in part due to the fact
that the concrete in the center region of the panels had been poorly compacted. Other than
for HSW1, it is of interest to note that the the maximum resistance in each of the 4 other
specimens occured at total shear displacements between 5 and 6 mm, reflecting basically
similar cracking pattern of the concrete wall panels. This could be expected as the rein-
58

forcement in the wall panel was the same for all specimens. In as far as the observed be-
havior failed to provide information about the resistant and displacement capacities of the
different interface connections, it was decided to study the remaining test specimens with
restrained side edges. In that case it could be expected that the shear load capacity would be
increased and an assessment of the interface design solutions could be made. The restraint
on both sides of the test specimens has been introduced by restraining the panel through the
introduction of steel blocks along the lower half of the wall panel.
4.2.2 Test serie 2
The actuator force-displacement response, showing the force versus interface displacement
for the several specimens of the 2nd test series is given in Figs. 4.6 thr. 4.10. The pertinent
test results, covering in fact the force and displacement capacities of the specimens at the
interface, are presented in Table 4.1. Considering the graphical test data, the cyclic re-
sponse shows, similarly to the results of the 1st test series, a considerable pinching of the
histeretic loops. In comparison with the test results from the 1st series of tests, the re-
strained test setup did invariable lead to increased horizontal load resistances. At the same
time, the recorded cyclic-load displacements were a combination of the shear distortions
(slippage) of the interface connection between edge-column and concrete panel, combined
with a shear distortion of the concrete panel.
As in the 1st test series, also in the 2nd series of tests the graphs show a significant pinching
effect. In comparison with the earlier results, also, the repeated cycles up to failure show
little deterioration. However, from the moment that the maximum resistance has been
reached, the load resistance under repeated displacement cycles reduces significantly.
Comparing the response of the different specimens, in order to assess the efficiency of the
different interface designs, the response of the specimens with straight anchor bars is less
effective than those with diagonal bars. In fact, considering the deterioration under repeated
59

alternating cyclic displacements after the maximum resistance had been reached, the first
three specimens (HSW6,HSW7and HSW8) with straight anchorage bars, as compared to
the two with diagonal bars, show a distinct loss of resistance. Specifically, specimen
HSW6, which had experiencied little loss of resistance up to a 3-cycle alternating dis-
placement of +/- 4.0 mm, exhibited after 3-cycles at +/- 5.0 mm a drop in resistance of 30%
(after 5.5 cycles the resistance had even dropped to 50%). The same basic phenomenon
was observed for specimen HSW7. In this case, after having observed virtually no-loss of
resistance up to a 3-cycle alternating displacement of +/- 3 mm, a loss of 30% was ob-
served after 3 cycles at +/- 4 mm (increasing to 40% in the next half cycle). Also, specimen
HSW8 showed a similar deteriorating behavior as specimens 6 and 7. Specifically, after the
loss of resistance under a 3-cycle displacement of +/- 4.0 mm had still been minimal, at +/-
5.0 mm, a loss of resistance of about 25% after 3 cycles occurred. This loss increased to
about 40% after 4.5 cycles.
In comparison, the other two specimens (HSW 9 and 10) with diagonal anchorage bars,
exhibited both a relatively gradual drop in resistance after the maximum resistance had
been reached and, under increased displacements, relatively little deterioration under re-
peated alternating cyclic deformations. In fact, after having reached the maximum resis-
tance under cyclic displacements at about +/- 4.0 mm, both specimens showed - up to cy-
clic displacements of +/- 6.0 mm – only a limited loss of resistance. Comparing these
results with those of specimens 6,7 and 8, it can be observed that under cyclic displace-
ments of +/- 6 mm the interface shear force resistance of specimens 6,7 and 8 had dropped
significantly to about 30 % of the maximum capacities (which were reached at cyclic dis-
placements of +/- 4.0 mm for specimens 6 and 7, and +/- 5.0 mm for specimen 8). Compar-
ing the results of specimens HSW9 and 10 directly, specimen 10, with two layers of 6 mm
45°-diagonal anchorage bars arranged at an interval of 5.0 cm, shows a better response than
specimen 9, with 8 mm 45° anchorage bars spaced at 10.0 cm.
Considering the results of both test series, the interface design of diagonally arranged 6 mm
anchoring bars, spaced at 5.0 cm and penetrating into the composite column, as used in
60

Specimen 10, seems to offer the best interface solution. In case welding on site would be
possible, welded hairpin bent 8 mm bars spaced at 10 cm, as basically in case of Specimen
5, offer an even more effective interface design.
The mode of failure of the specimens differed according to the arrangement of the reinforc-
ing bars at interface connection. All the test specimens in the first serie experienced a shear
mode of failure. During the first cycles of loading, hair line inclined cracks formed which
is distributed uniformly in the RC panel. Under increased reversed cyclic displacements,
significant cracks were initiated at lower parts of RC panel, in which the opening of such a
crack reached about 5-8 mm leaded to shear mode of failure, as presented in Figures 4.11-
4.14.
The specimens in the second series were mainly failed at interface connections as shown in
Figures 4.15-4.18. For the specimens with straight reinforcing bars, after initial hair line
cracks in RC panel at first stages of loading, the concrete at interface connection region
spalled off (destroyed) and interface reinforcing bars were buckled. In case of diagonaly re-
inforced bars at IFC, after the initial diagonal cracking of concrete, the horizontal forces
were mainly taken by the diagonal bars, thus the behavior of these specimens were gov-
erned by reinforcing bars. Hence, the specimens with diagonal reinforcement layout as
compared to specimens with straight bars having the same bar size led to an increased ul-
timate capacity at IFC. Therefoere, the diagonal reinforcing bars restrained the expansion
of cracks at the IFC region, and failure occured in central region of the RC panel.
61

Table 4.1. Summary of test results
Nr.
Tension
Compression
Calculated
Serie
Spe
cim
en N
umbe
r
Ulti
mat
e la
tera
l for
ce (V
u)
Dis
plac
emen
t at M
ax. V
u
Ulti
mat
e D
ispl
acem
ent
Ulti
mat
e la
tera
l fo
rce
(Vu)
Dis
plac
emen
t at M
ax. V
u
Ulti
mat
e D
ispl
acem
ent
Sid
e Su
ppor
t
Typ
e of
Fai
lure
She
ar S
treng
th a
t IFC
She
ar S
tr. o
f wal
l pan
el
kN mm mm kN mm mm kN kN
HSW1 231 3.5 7 -203 -4.5 -7 No WP1 327.3 436.8
HSW2 283 5 8 -290 -6 -8 No WP 562 378
HSW3 368 5 8 -315 -5 -8 No WP 469.4 436.8
HSW4 353 6 8 -305 -5 -8 No WP 374.7 329.4
Serie
1
HSW5 440 5 10 -435 -5 -10 No WP 528 407
HSW6 320 4 7 -330 -4 -7 Yes IFC2 327 480
HSW7 390 4 18 -440 -3 -18 Yes IFC 350 480
HSW8 422 5 15 -384 -4 -13 Yes IFC 375 329
HSW9 420 4.5 8 -435 -6 -8 Yes WP 562 407
Serie
2
HSW10 445 4 8 -520 -5 -8 Yes WP 601 378
1) Wall Panel
2) Interface Connection
62

Figure 4.1: Force - displacement diagram for HSW-1-500
-400
-300
-200
-100
0
100
200
300
400
500
-10 -8 -6 -4 -2 0 2 4 6 8 10
Input displacement (mm)
Forc
e (k
N)
Figure 4.2: Force - displacement diagram for HSW-2-500
-400
-300
-200
-100
0
100
200
300
400
500
-10 -8 -6 -4 -2 0 2 4 6 8 10
Input displacement (mm)
Forc
e(kN
)

64
Figure 4.4: Force - Displacement diagram for HSW-4 -500
-400
-300
-200
-100
0
100
200
300
400
500
-10 -8 -6 -4 -2 0 2 4 6 8 10
Displacement (mm)
Forc
e (k
N)
Figure 4.3: Force- displacement diagram for HSW-3-500
-400
-300
-200
-100
0
100
200
300
400
500
-10 -8 -6 -4 -2 0 2 4 6 8 10
Input displacement(mm)
Forc
e(kN
)

Figure 4.5: Force - Displacement diagram for HSW-5-500
-400
-300
-200
-100
0
100
200
300
400
500
-10 -8 -6 -4 -2 0 2 4 6 8 10
Displacement (mm)
Forc
e(kN
)
Figure 4.6: Force - Displacement diagram for HSW-6-500
-400
-300
-200
-100
0
100
200
300
400
500
-10 -8 -6 -4 -2 0 2 4 6 8 10
Displacement (mm)
Forc
e(kN
)
65

66
Figure 4.8: Force - Displacement diagram for HSW-8
-500
-400
-300
-200
-100
0
100
200
300
400
500
-10 -8 -6 -4 -2 0 2 4 6 8 10
Displacement (mm)
Forc
e(kN
)
Figure 4.7: Force - Displacement diagram for HSW-7-500
-400
-300
-200
-100
0
100
200
300
400
500
-10 -8 -6 -4 -2 0 2 4 6 8 10
Displacement (mm)
Forc
e(kN
)

Figure 4.9: Force - Displacement diagram for HSW-9-500
-400
-300
-200
-100
0
100
200
300
400
500
-10 -8 -6 -4 -2 0 2 4 6 8 10
Displacement (mm)
Forc
e (k
N)
Figure 4.10: Force - Displacement diagram for HSW-10-500
-400
-300
-200
-100
0
100
200
300
400
500
-10 -8 -6 -4 -2 0 2 4 6 8 10
Displacement (mm)
Forc
e (k
N)
67

6
Figure 4.11: Cracking pattern of Specimen HSW2Figure 4.12: Cracking pattern of Specimen HSW2
8

69
Figure 4.14: Cracking pattern of Specimen HSW2
Figure 4.13: Cracking pattern of Specimen HSW2

70
Figure 4.16: Cracking pattern of specimen HSW7, back view
Figure 4.15: Cracking pattern of specimen HSW7, front view

Figure 4.17: Cracking pattern of Specimen HSW7 at failure stage
Figure 4.18: Cracking pattern of Specimen HSW7 at failure stage
71

4.3 Shear Force – Shear Distortion
4.3.1 Test serie 1
In principle, the shear distortion of the wall panel can be derived from several displacement
measurements. In case the bending deformation of the wall is small, as in the present case
of squat walls, the shear distortion can be expressed by considering the horizontal dis-
placement measured by the linear displacement potentiometers (LVDTs) at the edge of the
panel (SZ2 in Fig. 3.10). In fact, in case the longitudinal slip along the interface between
the composite column and concrete shear wall panel is negliable, also the displacement
test-control values could be used directly. Even in case of larger slippage between column
and wall, the control displacement values can be used, provided that these values are cor-
rected by the measured slippage.
In general, considering that the deformation of the panel is a direct result of both shear and
bending distortions of the panel, the average shear strain in the wall panel can be evaluated
by considering the displacement measurements recorded by the two pairs of diagonally pla-
ced LVDTs (W10 + 11, and W12 + 13 in Fig. 3.10).
The general shear and bending moment distortion of the panel is shown in Figure 4.19.
Considering the panel deformations along each of the diagonals in general terms, as ex-
pressed in equations 4.1 and 4.2, the average shear distortions can be calculated by equa-
tion 4.3. In the present test setup the gage length of both diagonals is the same.
22
221 )()( ������ lxhd 4.1
21
212 )()( ������ lxhd 4.2
hldddddd
ave 2)()( 222111 �����
�� 4.3
72

In Figures 4.20 thr. 4.24, the average shear strains have been calculated by the above for-
mula and are presented graphically versus the cyclic displacement-controlled forces. In
fact, because of the limited slippage along the interface and the squat nature of the wall
(negliable bending distortions), the results are in close agreement with results derived di-
rectly from the test control displacements and the horizontal panel deformations recorded
by SZ2.
Figure 4.19: shear strain - displacement relationship
4.3.2 Test serie 2
In the 2nd test series, the test specimens were supported on the side to prevent an unrealistic
bending failure of the wall panel. In this case the shear strain, which was to be presented
graphically against the applied cyclic load, was determined by considering the shear distor-
tion of the wall panel resulting from the difference between the test displacement and the
slippage along the interface. The relationship between shear strain and test load are pre-
73

sented graphically in Figures 4.25 – 4.29. The shear strain values under maximum loads are
similar to those observed in the 1st test series. This is not surprising as the shear resistance
of the panels – because of the same mesh reinforcement for all specimens – should basi-
cally lead to the same shear resistance and associated shear distortion at failure.
74

Figure 4.20: Applied Force - Average Shear Strain (rad) for HSW-1-500
-400
-300
-200
-100
0
100
200
300
400
500
-0,02 -0,016 -0,012 -0,008 -0,004 0 0,004 0,008 0,012 0,016 0,02
Average Shear Strain (rad)
Forc
e(kN
)
Figure 4.21: Applied Force - Average Shear Strain (rad) for HSW-2 -500
-400
-300
-200
-100
0
100
200
300
400
500
-0,02 -0,016 -0,012 -0,008 -0,004 0 0,004 0,008 0,012 0,016 0,02
Average Shear Strain (rad)
Forc
e(kN
)
75

76
Figure 4.23: Applied Force vs. Average Shear Strain (rad ) for HSW-4-500
-400
-300
-200
-100
0
100
200
300
400
500
-0,02 -0,016 -0,012 -0,008 -0,004 0 0,004 0,008 0,012 0,016 0,02
Average shear strain (rad)
Forc
e (k
N)
Figure 4.22: Applied Force - Average Shear Strain (rad) for HSW-3-500
-400
-300
-200
-100
0
100
200
300
400
500
-0,02 -0,016 -0,012 -0,008 -0,004 0 0,004 0,008 0,012 0,016 0,02
Average Shear Strain(rad)
Forc
e(kN
)

Figure 4.24: Applied Force - Average Shear Strain (rad) for HSW-5-500
-400
-300
-200
-100
0
100
200
300
400
500
-0,02 -0,016 -0,012 -0,008 -0,004 0 0,004 0,008 0,012 0,016 0,02
Average Shear Strain(rad)
Forc
e(kN
)
Figure 4.25: Applied Force - Average Shear Strain (rad) for HSW-6-500
-400
-300
-200
-100
0
100
200
300
400
500
-0,02 -0,016 -0,012 -0,008 -0,004 0 0,004 0,008 0,012 0,016 0,02
Average Shear Strain(rad)
Forc
e(kN
)
77

Figure 4.26: Applied Force - Average Shear Strain (rad) for HSW-7-500
-400
-300
-200
-100
0
100
200
300
400
500
-0,02 -0,016 -0,012 -0,008 -0,004 0 0,004 0,008 0,012 0,016 0,02
Average Shear Strain (rad)
Forc
e(kN
)
Figure 4.27: Applied Force - Average Shear Strain (rad) for HSW-8 -500
-400
-300
-200
-100
0
100
200
300
400
500
-0,02 -0,016 -0,012 -0,008 -0,004 0 0,004 0,008 0,012 0,016 0,02
Average Shear Strain(rad)
Forc
e(kN
)
78

Figure 4.28: Applied Force - Average Shear Strain (rad) for HSW-9-500
-400
-300
-200
-100
0
100
200
300
400
500
-0,02 -0,016 -0,012 -0,008 -0,004 0 0,004 0,008 0,012 0,016 0,02
Average Shear Strain (rad)
Forc
e(kN
)
Figure 4.29: Applied Force - Average Shear Strain (rad) for HSW-10-500
-400
-300
-200
-100
0
100
200
300
400
500
-0,02 -0,016 -0,012 -0,008 -0,004 0 0,004 0,008 0,012 0,016 0,02
Average Shear Strain (rad)
Forc
e(kN
)
79

4.4 Force – Slip relationship
4.4.1 Test serie 1
The slip of the column relative to the RC wall panel has been recorded at three locations
along the length of the column member. In as far as in both test series the recorded slip dis-
placements at these locations were virtually the same under increasing loads (reflecting a
rather uniform load transfer), the slip recorded at the middle section was used in preparing
the graphs showing the force-slip relationship.
For the first series of tests the force-slip graphs for the 5 specimens of Series 1 are pre-
sented in Figures 4.30 thr. 4.34. Considering that, for Specimens HSW1 thr. 4, the slip val-
ues under maximum load were only 0.3 to 0.5 mm (Figs. 4.30 – 4.33) as compared to total
test displacements of +/- 4 to 6 mm at maximum load (Figs. 4.1 – 4.4), it is obvious that
the concrete panel sustained considerable shear distortion. In as far as the tests were to
evaluate the efficiency of different interface connection designs, the results of limited slip
and significant shear panel deformations – resulting in shear cracking and ultimate bending
failure of the panel – did not allow an assessment of the possible interface connection de-
sign solutions. Hence, it was decided for the specimens to be tested in Series 2, to effec-
tively strengthen the panel by supporting the panel up to its mid-height. Considering that in
Specimen HSW5 the anchorage bars were welded to the steel tubular column wall, the slip
should of course be virtually nil as supported by the results shown in Fig. 4.34.
4.4.2 Test serie 2
Similar as for the test specimens tested in Series 1, also in the second test series, the force
applied to the specific test specimen has been presented in relation to the slip of the edge
member column relative to the shear wall, as measured by LVDT W15 (see Figure 3.10).
80

The results are presented in Figures 4.35-4.39. The results clearly show that the specimens
with straight anchorage bars (HSW6, 7 and 8) exhibited considerable slippage along the
column-wall interface. On the otherhand, the specimens HSW8 and 9, with diagonally ori-
ented achorage bars, showed only a limited amount of slippage.
In these tests, response of the specimens changed as the number of cycle of the loading and
level of loading increased. This is illustrated in Figure 4.40, which shows typical force -
slip curves at different stages of loading. Response to succeeding cycles of loading is char-
acterized by a low shear stiffness at a low value and a gradual increase in shear stiffness
with increase in shear in both positive and negative directions. As the number of load cy-
cles increases, the shear stiffness at low shears decreases and the increase in stiffness with
increase in shear becomes greater. This causes the shear-slip curve for a complete loading
cycle to assume a progressively more pinched shape as the number of loading cycles in-
creases. For the specimens with failure at IFC, the max slip of +/- 3.5 mm with the spalling
of concrete adjacent to IFC is observed. The amount of the slip is proportional to load car-
rying capacity and correspondingly amount and distribution of reinforcing bars at IFC. The
slip, measured against a 7 cm gage length, reaches for the first three specimens, with
straight anchor bars and welded shear studs (in Specimen 8 only), displacements of close to
+/- 3.5 mm. For the specimens with diagonal anchorage bars, the slip reaches maximum
values of between 0.5 and 1.5 mm. In the case of the diagonal reinforcement the shear
transfer strength was about 25 % greater than in the case of straight reinforcement. A plot
of maximum envelop of the force - slip relationships are also given in Figures 4.41 - 4.45.
These envelop curves are used to develope an idealized cyclic force - slip relationship in
the next chapter.
81

82
Figure 4.31: Force - slip diagram for HSW-2 -500
-400
-300
-200
-100
0
100
200
300
400
500
-1-0,9-0,8 -0,7 -0,6 -0,5-0,4-0,3-0,2-0,100,10,20,3 0,4 0,5 0,60,7 0,8 0,9 1
Slip (mm)
Forc
e (k
N)
Figure 4.30: Force - slip diagram for HSW-1-500
-400
-300
-200
-100
0
100
200
300
400
500
-1 -0,9 -0,8 -0,7 -0,6 -0,5 -0,4 -0,3 -0,2 -0,1 0 0,1 0,2 0,3 0,4 0,5 0,6 0,7 0,8 0,9 1
Slip (mm)
Forc
e (k
N)

Figure 4.32: Force - slip diagram for HSW-3-500
-400
-300
-200
-100
0
100
200
300
400
500
-1 -0,9 -0,8 -0,7 -0,6 -0,5 -0,4 -0,3 -0,2 -0,1 0 0,1 0,2 0,3 0,4 0,5 0,6 0,7 0,8 0,9 1
Slip (mm)
Forc
e (k
N)
Figure 4.33: Force Slip diagram for HSW-4 -400
-300
-200
-100
0
100
200
300
400
-1 -0,9 -0,8 -0,7 -0,6 -0,5 -0,4 -0,3 -0,2 -0,1 0 0,1 0,2 0,3 0,4 0,5 0,6 0,7 0,8 0,9 1
Slip (mm)
Forc
e (k
N)
83

84
Figure 4.35: Force - slip diagram for HSW-6-500
-400
-300
-200
-100
0
100
200
300
400
500
-4 -3 -2 -1 0 1 2 3 4
Slip (mm)
Forc
e (k
N)
Figure 4.34: Force - Slip diagram for HSW-5-500
-400
-300
-200
-100
0
100
200
300
400
500
-1 -0,9 -0,8 -0,7 -0,6 -0,5 -0,4 -0,3 -0,2 -0,1 0 0,1 0,2 0,3 0,4 0,5 0,6 0,7 0,8 0,9 1
Slip (mm)
Forc
e (k
N)

Figure 4.36: Force - slip diagram for HSW-7-500
-400
-300
-200
-100
0
100
200
300
400
500
-4 -3 -2 -1 0 1 2 3 4
Slip (mm)
Forc
e (k
N)
Figure 4.37: Force - Slip diagram for HSW-8-500
-400
-300
-200
-100
0
100
200
300
400
500
-4 -3 -2 -1 0 1 2 3 4
Slip (mm)
Forc
e (k
N)
85

86
Figure 4.39: Force - Slip diagram for HSW-10-500
-400
-300
-200
-100
0
100
200
300
400
500
-4 -3 -2 -1 0 1 2 3 4
Slip (mm)
Forc
e (k
N)
Figure 4.38: Force - Slip diagram for HSW-9-500
-400
-300
-200
-100
0
100
200
300
400
500
-4 -3 -2 -1 0 1 2 3 4
Slip (mm)
Forc
e (k
N)

Figure 4.40: Force - slip diagrams for HSW-6 at different cycles-500
-400
-300
-200
-100
0
100
200
300
400
500
-4 -3 -2 -1 0 1 2 3 4
Slip (mm)
Forc
e (k
N)
6th cycle
15th cycle
Figure 4.41: Normalized force - slip envelope for HSW6-1,5
-1
-0,5
0
0,5
1
1,5
-1,5 -1 -0,5 0 0,5 1 1,5
Slip (mm)
Forc
e(kN
)
87

88
Figure 4.42: Normalized force - slip envelope for HSW7-1,5
-1
-0,5
0
0,5
1
1,5
-1,5 -1 -0,5 0 0,5 1 1,5
Slip(mm)
Forc
e(kN
)
Figure 4.43: Normalized force - slip envelope for HSW8 -1,5
-1
-0,5
0
0,5
1
1,5
-1,5 -1 -0,5 0 0,5 1 1,5
Slip (mm)
Forc
e(kN
)

Figure 4.44: Normalized force - slip envelope for HSW9-1,5
-1
-0,5
0
0,5
1
1,5
-1,5 -1 -0,5 0 0,5 1 1,5
Slip (mm)
Forc
e(kN
)
Figure 4.45: Normalized force - slip envelope for HSW10-1,5
-1
-0,5
0
0,5
1
1,5
-1,5 -1 -0,5 0 0,5 1 1,5
Slip(mm)
Forc
e(kN
)
89

90
5 TEST EVALUATION AND CHARACTERIZATION OF
CYCLIC FORCE – SLIP RELATION
5.1 General
In order to describe analytically the behavior of the hybrid shear wall with composite edge
member columns, an understanding of the interface behavior between edge member and
shear wall panel is essential. Hence, in the experimental studies a representative portion of
the hybrid wall has been investigated under cyclic alternating, displacement controlled,
shear loads acting parallel to the edge-member/wall interface. In principle, the experimen-
tal results provide guidance in developing numerical models which are capable to accu-
rately predict the edge-member/wall interface behavior. These models are essential to de-
scribe the overall shear wall behavior under extreme seismic action not only for the type of
wall investigated in this study, but also, in general, for walls with different edge-member
and wall design configurations. In this chapter, empirical derived force-slip curves describ-
ing the interface behavior are derived from the available test results and are used to develop
a force-slip relationship (describing the interface dowel action as a multi-linear spring) for
the type of edge-member/wall design here investigated.
5.2 Idealized cyclic nonlinear Force–Slip Relationships
In principle, an idealized force-slip hysteresis is required for hybrid shear walls in order to
perform an inelastic response analysis of the building subjected to earthquake ground mo-
tions. In order to develop a hysteresis model for a typical structural element (in this case the
interface force-slip behavior under shear), information of the pertinent experimental behav-
ior is required. Using the experimental results, typically, an envelope, or primary curve, can
91

be generated to describe the major hysteretic characteristics including the stiffness at vari-
ous stages and the ultimate strength under cyclic behavior.
In this process, it is necessary to correlate the observed experimental behavior with the per-
tinent geometric layout and material properties of the actual design of the test model. The
force - slip envelope curves for the specimens in the second series, with both straight and
diagonal reinforcing bars at the interface connection, are shown in Figures 5.1 and 5.2, re-
spectively.
Considering the overall behavior, the initial shear transfer causes typical shear and flexural
cracks in the wall. Subsequently, under increasing loads, also cracking and crushing of the
concrete in the interface region occurs as a result of the dowel action. As a result, under ul-
timate load, the shear force at the interface is transferred entirely by the reinforcing bars. In
Section 2.3.4.3 an expression for the dowel force capacity, based on the shear friction the-
ory, has been given. Experimental investigations [21,28,29,30] have shown that the inter-
face resistance depends mainly on the bar size, bar yield strength, the concrete strength,
concrete cover and spacing of the bars. For the concrete walls studied in this investigation,
the variables considered in this study are bar size and arrangement of the reinforcement.
In order to develop a multi-linear force-slip relation at the interface connection, for use in
the analytical model, the experimental force-displacement curves have been normalized to
the reference values FR (load) and SR (slip). Normalization of the force-slip relationship de-
scribing basic response is done with the aim of having an-easy-to-handle interpolated curve
(formula) for practical use. Having the key properties, namely; initial stiffness, K and
maximum shear force capacity, Fmax at IFC, the full shape of the mathematical model for
force/slip relation up to the ultimate load is defined.
The reference load has been defined as FR = Fmax , with Fmax being the calculated shear
strength according to Eqs. 2.26 or 2.37 for, respectively, a straight-bar or diagonal-bar in-
terface-reinforcing arrangement.
92

The reference slip SR, is expressed as SR = Fmax / K, where K is the initial stiffness for the
straight and diagonal-bar reinforcing arrangements, respectively, defined as:
)( ststss dndnK �� � 5.1
)sin/( �� dd dnK � 5.2
Where, � in kN/m2 , is defined as:
� = � nSCS EEE � and 5.3
ststddss dndndn ,, are the number and diameters of the straight or diagonal bars, or the shear
studs, respectively, and � is the angle of inclination of diagonal bars with the edge mem-
ber.
Using Eq. 5.3, the exponent n for every test specimen is determined by considering the ex-
perimental initial stiffness K and the pertinent reinforcing layout, together with the
Young’s moduli of steel and concrete. Averaging the values for n for the specimen with
straight bars and the diagonal bars, resulted in values of n =2.2 and n = 1.85, respectively.
The initial stiffness is, therefore, proportional to the reinforcing bar diameter, the stiffness
of the steel and the interaction between the stiffness of two materials namely, the concrete
and steel.
Using initial stiffness values K for determining , the experimental force-slip curves are
normalized to a
RS
F - S relationship according to:
RFFF /� and RSSS /�
93

The resulting curves of the normalization process for the specimen with straight-bar and
diagonal-bar reinforcements, are shown in Figs. 5.3 and 5.4, respectively. These curves
form the basis of the pertinent generalized force-slip envelope curve.
A possible generalized force - slip envelope curve for the connection interface, describing
in effect the connection spring element for use in a numerical analysis, can be expressed by
a tangent hyperbolic function, as follows:
))1/().(1/()(tanh 42 SSaSF ��� 5.4
For a best fit with the test results, a value for the constant , between zero and 0.3 is sug-
gested in this equation.
a
The generalized curves based on Eq. 5.4 are shown for straight and diagonal reinforcement
layouts in Figures 5.5 and 5.6, respectively, together with the pertinent normalized test
data. By expressing the response at IFC in the form of nonlinear force/slip curves, the
whole range of loading is covered up to the ultimate load.
For use as a mathematical model to define the shear-force/slip relationship of the connec-
tion element in the nonlinear finite element analysis of the hybrid shear-wall behavior, Eq.
5.4 can be approximated as a multi-linear model as shown in Figure 5.7 and 5.8 for the dif-
ferent reinforcing arrangements. These curves were used in the numerical studies presented
in the next chapter.
94

Force - Slip envelop diagram for straigth bars
0
50
100
150
200
250
300
350
400
450
0 0,5 1 1,5 2 2,5 3 3,5 4
Slip (mm)
Forc
e (k
N)
HSW-7
HSW-8
HSW-6
Figure 5.1: Force - slip envelope curve for specimen with straight bars at IFC
Force - Slip envelop diagram for diagonal bars
0
50
100
150
200
250
300
350
400
450
500
0 0,5 1 1,5 2 2,5 3 3,5 4
Slip (mm)
Forc
e (k
N)
HSW-10
HSW-9
Figure 5.2: Force - slip envelope curve for specimen with diagonal bars at IFC
95

Normalized Force - Slip envelope diagram for straight bars
0
0,2
0,4
0,6
0,8
1
1,2
0 0,5 1 1,5 2 2,5 3 3,5 4S / SR
F / F
max
HSW-7HSW-8HSW-6
Figure 5.3: Normalized force - Slip envelope curve for straight bars
Normalized Force - Slip envelope diagram for diagonal bars
0
0,2
0,4
0,6
0,8
1
1,2
0 0,2 0,4 0,6 0,8 1 1,2 1,4 1,6 1,8S / SR
F / F
max
HSW-10HSW-9
Figure 5.4: Normalized force - Slip envelope curve for diagonal bars
96

Interpolated curve from normalized Force - Slip envelope diagram, straight bars
0
0,2
0,4
0,6
0,8
1
1,2
0 0,5 1 1,5 2 2,5 3 3,5 4 4,5S / SR
F / F
max
HSW-7HSW-8HSW-6Interpolated curve
Figure 5.5: Interpolation curve based on Eq. 5.4
Interpolated curve from normalized Force - Slip envelope diagram, diagonal bars
0
0,2
0,4
0,6
0,8
1
1,2
0 0,5 1 1,5 2 2,5 3 3,5 4 4,5
S / SR
F / F
max
HSW-10HSW-9Interpolated curve
Figure 5.6: Interpolation curve based on Eq. 5.4
97

Interpolated curve and multilinear model for straight bars
0
0,2
0,4
0,6
0,8
1
1,2
0 0,5 1 1,5 2 2,5 3 3,5 4 4,5S / SR
F / F
max
Interpolated Curve
Mutilinear model
Figure 5.7: Interpolation curve and primary multilinear model for straight bars
Interpolated curve and multilinear model for diagonal bars
0
0,2
0,4
0,6
0,8
1
1,2
0 0,5 1 1,5 2 2,5 3 3,5 4 4,5S / SR
F / F
max
Interpolated Curve
Mutilinear model
Figure 5.8: Interpolation curve and primary multilinear model for diagonal bars
98

6 ANALYTICAL MODEL OF TEST SPECIMENS
6.1 General
The accurate prediction of the behavior of the structure during earthquake excitation de-
pends on the development of reliable analytical models of the critical regions. Analytical
models for RC structures have generally been based on replacing the reinforced concrete
composite continuum by an assembly of finite elements representing the concrete and the
steel reinforcement. These models should be able to reflect the behavior of concrete in ten-
sion and compression, the response of the reinforcing bars and their interaction with the
concrete. Hence, a realistic stress-strain relationship for both concrete and steel bars and a
failure theory are required to obtain basic information through an analytical model of the
structure.
Several approaches for defining the stress-strain behavior of the concrete under various
stress states are available, namely, nonlinear elasticity, plasticity based model, plastic frac-
turing theory and endochronic theory of plasticity, etc [13,14]. However, by using the finite
element method and performing a nonlinear analysis with appropriate constitutive rela-
tions, deformational and failure characteristics of reinforced concrete structures can be ac-
curately predicted.
Basically, the nonlinear response is caused by two major material effects, cracking of the
concrete and plasticity of the reinforcement and of the compression concrete. Other time–
independent effects arise from the nonlinear action of the individual constituents of rein-
forced concrete, such as bond slip between steel and concrete, aggregate interlock of a
cracked concrete and dowel action of reinforcing steel. The time–dependent effects such as
creep, shrinkage, and temperature change also contribute to the nonlinear response. In this
study, only the time-independent material nonlinearities (cracking and plasticity) will be
considered in the nonlinear analysis of the specimens.
99

The implementation of nonlinear constitutive relations in finite element analysis codes is
generally undertaken in one of two ways. In the first case the material behavior is pro-
grammed independently of the elements. Using this approach the choice of elements for a
particular structural system is not limited and best practice modelling techniques can be
used in identifying an appropriate element type to which any of the nonlinear material
properties are assigned. This is the most adaptable approach and does not limit the analyst
to specific element types in configuring the problem of interest. In spite of this, however,
following the second approach, certain software developers provide specific nonlinear ma-
terial capabilities only for dedicated element types. In order to achieve the analytical objec-
tive of this study, ANSYS 5.7 [2], a nonlinear three dimensional finite element computer
program, was used to simulate the response of the test specimens. ANSYS provides a dedi-
cated three-dimensional eight node solid isoparametric element, Solid65, to model the
nonlinear response of brittle materials based on a constitutive model for the triaxial behav-
iour of concrete after Williams and Warnke [46]. This model makes no attempt to include
the prediction of cyclic response because the model is intended for application to mono-
tonic loading cases.
In the following sections, the basic failure criteria of concrete, material model for both con-
crete and steel and the analytical modelling of the hybrid shearwall test specimen using the
ANSYS 5.7 computer program are described.
6.2 Failure Criteria of Concrete
Concrete is a nonlinear, inelastic and nonhomogeneous material with a very complex phy-
sical behavior, having a high compressive strength and low tensile strength. The load carry-
ing capacity of concrete under multiaxial stress conditions is a function of the state of
stress, and can be properly predicted by using an appropriate failure criteria. Most failure
criteria are given as a hypothesis whose application to different materials should be evalu-
ated from tests. Several failure criteria have been formulated for concrete under a general
100
stress state using various mathematical models with one to five parameters. Criteria such as
yielding, initiation of cracking and ultimate load carrying capacity, etc. have been used in
formulating the failure criteria. Simpler failure models, suitable for manual calculations,
employ only one or two parameters. In computer applications failure models are mostly
considering three, four or five parameters to define the failure criteria.
Considering a multi axial stress condition for an isotropic material, failure criteria can be
expressed as an invariant function of the stress conditions (i.e., principle stresses σ1, σ2,
σ3,) as follows:
ƒ( σ1, σ2, σ3,) = 0 6.1
Furthermore, one can replace this equation in terms of three principal stress invariants I1,
J2, J3 as
ƒ( I1, J2, J3,) = 0 6.2
where, I1 is the first invariant of the stress tensor σij and J2 , J3 are the second and third in-
variants of the deviatoric stress tensor, sij .
In order to supply both a geometrical and physical interpretation of the failure, the Haigh-
Westergaard stress space has been used to define the failure surface of concrete by either ƒ(
ξ, r, θ) or ƒ( σoct, τoct, θ). The general characteristics of the failure surface of the concrete
are determined from tests and can best be described by its cross sectional shapes in devia-
toric planes and its meridians in meridian planes. Type of failure in concrete can be classi-
fied into tensile and compressive failure, which is characterized by brittle and ductile be-
havior, respectively.
The Williams and Warnke three dimensional failure criteria which considers a five-
parameter failure surface model for concrete in both tension and compression has been
101

used in this study. This model has a conical shape, as shown in Figure 6.1, with curved me-
ridians (second order parabolas) and a noncircular deviatoric cross sections (with ellipsoids
in each quadrants) as shown in Figures 6.2a and 6.2b, respectively.
The failure surface is defined as:
� �� �� �
� � � �2222
21222222
2cos445cos4)2(cos)(2,
tctc
ctttcctctccmf rrrr
rrrrrrrrrrrr���
������
�
�
���� 6.3
where, r and are, respectively, the tensile and compressive meridians expressed as: t cr
2
210 ���
����
����
c
m
c
mt f
af
aar �� 6.4
2
210 ���
����
����
c
m
c
mc f
bf
bbr �� 6.5
The five parameters required to define the William-Warnke failure surface are:
The unaxial compresive strength ( ) cf
The uniaxial tensile strength ( ) tf
The biaxial compressive strength ( ) bcf
The high compressive stress point ( ) on the compressive meridian 1f
The high compressive stress point ( ) on the tensile meridian 2f
102

Figure 6.1: Failure surface in 3D stress space
ƒ1 r = τ
ƒt
ƒc
ƒbc
ξ = σm / ƒc
oct / ƒc θ = 0 0 tensile meridian, rt
θ = 60 0 compresive meridian, rc
ƒ2
Figure 6.2a: Meridian plane
����ƒc
���ƒc
�����ƒc
Figure 6.2b: Deviatoric plane
103

6.3 Concrete Modelling
Under loading, micro- and macrocracks occur in the concrete. The stress-strain behavior of
concrete is affected by the development of these cracks. There are two main approaches
for modelling the cracking of the concrete, namely, the discrete and smeared crack ap-
proach. The former one treats cracking by adapting the geometry of the structure and keep-
ing the interior of the body linear elastic, whereas the second approach keeps the geometry
fixed, and models the cracking process entirely via a constitutive law. In early studies the
tension cut-off was used, assuming that after exceeding the tensile strength a complete loss
of coherence occurred in the direction of the major principle stress. The performance of the
smeard fixed-crack model has been improved with the introduction of tension stiffening,
tension softening and degradation of shear capacity due to cracking. The fixed-crack model
has been further developed to fixed multi crack and rotating crack models in order to ac-
count for the formation of cracks in other directions.
In ANSYS 5.7, the plasticity based model of concrete from Willam and Warnke has been
used. The stress-strain behavior of concrete has been separated into a recoverable (elastic)
and an irrecoverable (plastic) component. Each component is treated separately. The
model accounts for both cracking and crushing, considering a smeared crack analogy for
cracking and a plasticity algorithm to account for the possibility of concrete crushing. The
tensile strength is assumed to be 0.65 cf MPa, with fc being the compressive strength in
MPa. Since cracked concrete cannot transfer tensile stresses, the tensile strength drops sud-
denly after cracking. In the FE model, the actual compressive strength and modulus of elas-
ticity of the concrete, as obtained from cube and cylinder tests, has been used. Each ele-
ment has eight integration points at which cracking and crushing checks are performed.
The element behaves in a linear elastic manner until either of the specified tensile or com-
pressive strengths are exceeded. Cracking or crushing of an element is initiated once one of
the element principal stresses, at an element integration point, exceeds the tensile or com-
pressive strength of the concrete. Cracked or crushed regions are then formed perpendicular
104
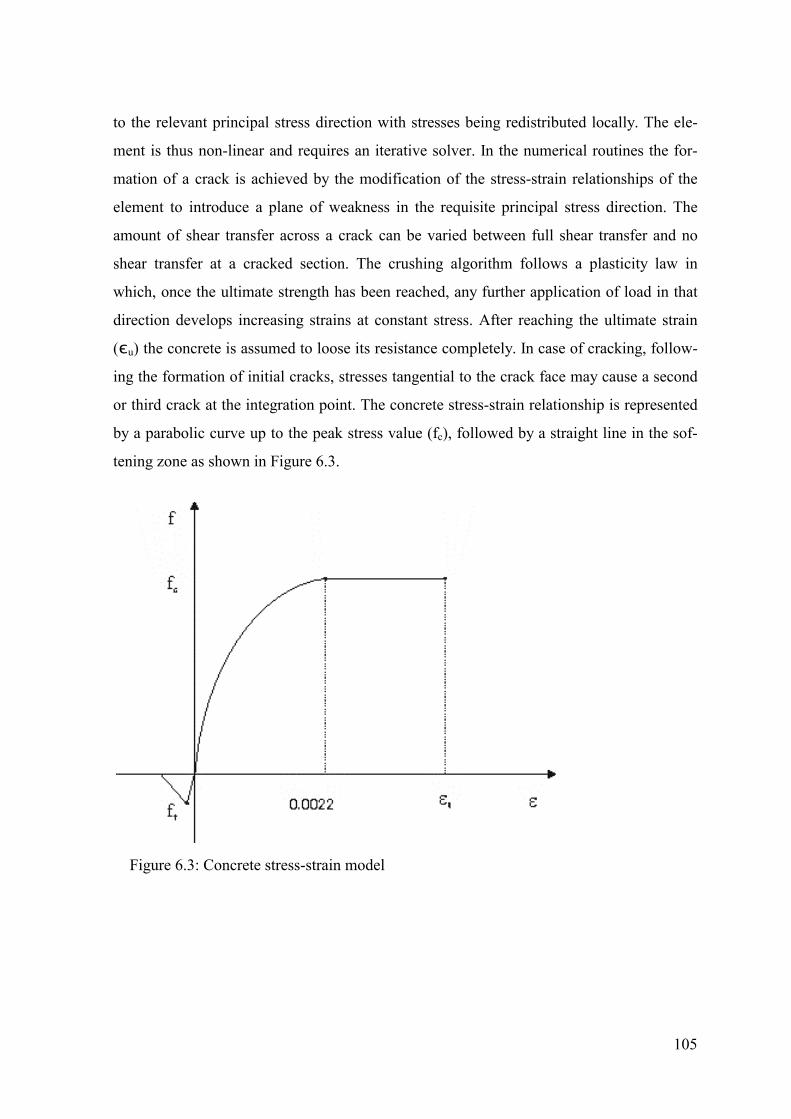
to the relevant principal stress direction with stresses being redistributed locally. The ele-
ment is thus non-linear and requires an iterative solver. In the numerical routines the for-
mation of a crack is achieved by the modification of the stress-strain relationships of the
element to introduce a plane of weakness in the requisite principal stress direction. The
amount of shear transfer across a crack can be varied between full shear transfer and no
shear transfer at a cracked section. The crushing algorithm follows a plasticity law in
which, once the ultimate strength has been reached, any further application of load in that
direction develops increasing strains at constant stress. After reaching the ultimate strain
(єu) the concrete is assumed to loose its resistance completely. In case of cracking, follow-
ing the formation of initial cracks, stresses tangential to the crack face may cause a second
or third crack at the integration point. The concrete stress-strain relationship is represented
by a parabolic curve up to the peak stress value (fc), followed by a straight line in the sof-
tening zone as shown in Figure 6.3.
Figure 6.3: Concrete stress-strain model
105

6.4 Steel Modelling
As the reinforcing bars are long and relatively slender, they are generally assumed capable
of transmitting axial forces only. Hence, a uni-axial stress-strain relationship has been
adopted. The reinforcement bars may be incorporated in the finite element model according
to either a discrete model (individual bars), or through a smeared model. In the discrete
model, one dimensional elements carrying axial force are used. For the smeared model, the
steel is assumed to be distributed over the concrete element with a particular orientation
angle. In that case, a perfect bond between the concrete and reinforcing steel is assumed.
The smeared modelling is more convenient from a user´s point of view, since only rein-
forcement ratio and steel properties of each direction need to be introduced. However, in
ANSYS 5.7, the reinforcing bars can be modelled by either the smeared or discrete method.
In either case, the bilinear kinematic hardening stress - strain relationship is used to simu-
late the behaviour of steel reinforcement. Actual material properties of the steel obtained
from material tests are used in the modelling. The steel stress-strain model as shown in
Figure 6.4 has been used with the following parameters:
Ee =210000 MN/m2, fy = 500000 kN/m2
f
fy
�u �
Figure 6.4: Steel stress-strain model
106

6.5 Geometrical modelling of test specimen
In order to perform a comparative analysis of the response of the test specimen a FE model
reflecting the specimen geometry has to be developed. In principle, the concrete fixing
beam and composite steel-tube edge column as well as the reinforced concrete shear wall
panel can be modelled using standard ANSYS 8-noded solid elements with smeared or
discrete reinforcing bars. Because of the complex force transfer (friction and dowel action)
at the interface between wall panel and edge column, special consideration has been given
in developing an appropriate model at the interface to capture the interface behaviour
(slip).
One possibility considered has been directed to developing a spring element between wall
panel and edge column. In this case, empirical (load versus slip) data have been used to de-
scribe such a spring for both the “straight” and “diagonal” interface reinforcement used in
this study. Although such an approach can provide basically a good correlation between
experimental and analytical results, its general validity is limited as it pertains to the spe-
cific layout tested in this investigation. Therefore, it was considered essential to develop a
general model of the interface region which would be capable of capturing for any given
reinforcing layout along the interface, the progressive failure and associated deformations
along the interface under increasing loads. For this purpose a concrete truss model acting in
conjunction with the reinforcing bars in the interface region has been developed. The cor-
relative studies, presented in Chapter 7, clearly prove the general validity of the truss mod-
elling procedure.
Generally, support points at the bottom of the fixing beam were restrained from transla-
tional and rotational movement in all directions. Full Newton-Raphson procedure with line
search, predicator and automatic time stepping was used for the analysis. The frontal solver
method was used to solve the simultaneous equations. A typical finite element mesh layout
107

of the wall specimen tested, without showing the interface reinforcement and connection
design, is shown in figure 6.5.
6.6 Computer Model Formulation
The appropriate element layout and size (meshing) is an important aspect in finite element
modelling to capture the behaviour of interest. However, a competent user must understand
how elements behave in order to choose suitable types, sizes, and shapes of elements and
where the mesh should be fine or coarse. It takes experience to find the “best” mesh. If the
mesh is too fine, one might get singularities in the solution, stress concentrations where
they should not appear, or the solver will take an extraordinarily long time to run. But if the
mesh is too coarse, then the solution will not be accurate enough.
Three dimensional finite element models (FEM) representing the test specimen geometry
were generated to analytically predict the response of the tested specimen under the perti-
nent load condition. In fact, four different models representing the two basic specimens
with straight and diagonal reinforcing bars at the interface connection have been developed
and analyzed.
In order to model the concrete in the wall panel, three dimensional eight-node elements,
Solid65 of ANSYS, with three translational degrees of freedom at each node, were used.
Considering the two-layered reinforcing mesh (mesh-size 100 mm) and wall-thickness of
90 mm, the element dimensions selected were 50x50x40 mm. The element mesh size of 50
mm reflects a mesh density of about 5% of the overall wall dimension. The mesh reinforc-
ing bars, with only uniaxial stiffness, are assumed to be smeared throughout the element.
The element is capable to capture both cracks due to tensile stresses (cracking in tension)
and cracks due to excessive compressive stresses (crushing in compression). Cracking is
modelled through an adjustment of the material properties which effectively treat the crack-
ing as smeared cracks rather than discrete cracks.
108

The fixing beam, which was anchored to the test frame, had a far greater stiffness than the
wall panel and was assumed to remain elastic during the tests. Therefore, the concrete and
the reinforcement in the fixing beam was modelled with 3D-eight-node elastic elements,
Solid45 of ANSYS, having three translational degrees of freedom at each node.
The reinforced concrete of the concrete-filled steel-tube composite edge member has been
modelled with concrete Solid65 elements and discrete reinforcing bars, connected at the
element nodal points. For modelling the steel tube, four-node shell elements, Shell43 of
ANSYS, with six degrees of freedom at each node, were used.
In modelling the interface connection of the test specimen, with both straight and diagonal
interface reinforcement, two different interface models have been used. In first instance, a
model with non-linear springs, interconnecting the common interface nodal points of the
wall panel and steel tube have been used. Specifically, a non-linear spring element, Com-
bin39 of ANSYS, with 6 degrees of freedom was selected. The non-linear spring-
characteristics for both types of specimen were taken from the empirically derived load-
displacement curves measured at the interface between wall panel and edge member. In
both cases the non-linear springs were modelled in a tri-linear fashion as shown in Figures
5.4-5.8. A basic layout of the test structure with selected computer elements is shown in
Figure 6.6.
109

1
Figure 6.5: Finite element mesh layout
10

In second instance, a general applicable interface-truss model has been derived for com-
parison with the experimental test results. In that case the concrete in the entire test speci-
men, other than a 50 mm high zone just below the edge member, has been modelled with
unreinforced concrete solid elements: Solid65 to capture the nonlinear concrete behavior of
the wall panel and Solid45 for describing the linear behavior of the fixing beam. Reflecting
the position of the reinforcing meshes over the thickness of the wall panel, the element
thicknesses were 20 mm, 40 mm and 20 mm, respectively. The reinforcement has been
modelled “externally” as discrete reinforcing bars using three-dimensional spar elements
with plasticity, Link8 of ANSYS, embedded within the solid mesh. In the upper 50 mm in-
terface connection region of the wall panel, directly adjacent to the composite edge column,
a truss system was modelled with the typical reinforcing bars and diagonally arranged con-
crete compression- strutt elements. In general, the program considers full displacement
compatibility between the reinforcement and the concrete (without bond slippage). The
truss-model layouts for both the straight and diagonal reinforcing layouts are shown in Fig-
ure 6.7.
Solid 45 for fixing beam
Panel concrete with Solid 65
Panel reinforcement with Link 8
Detail A
Detail A: Interface connection
Tube concrete with Solid 65
b) Truss model
a) Spring element Combin 39
Figure 6.6: A basic layout of the test structure with selected computer elements
111

Figure 6.7: A truss-model layout for the straight reinforcing bar
6.7 Analytical Studies
In order to check the accuracy of the analytical models through comparison with the test re-
sults, computer models for both straight (vertical) and diagonal reinforcement in the wall-
to-edge member interface region were developed as discussed in the previous section. In
the analyses both types of specimen were analyzed without and with a rigid side support of
the wall panel at a level 30 cm above the fixing beam. Hence, a comparison of the follow-
ing test cases, as presented in Chapter 7, will be possible:
112
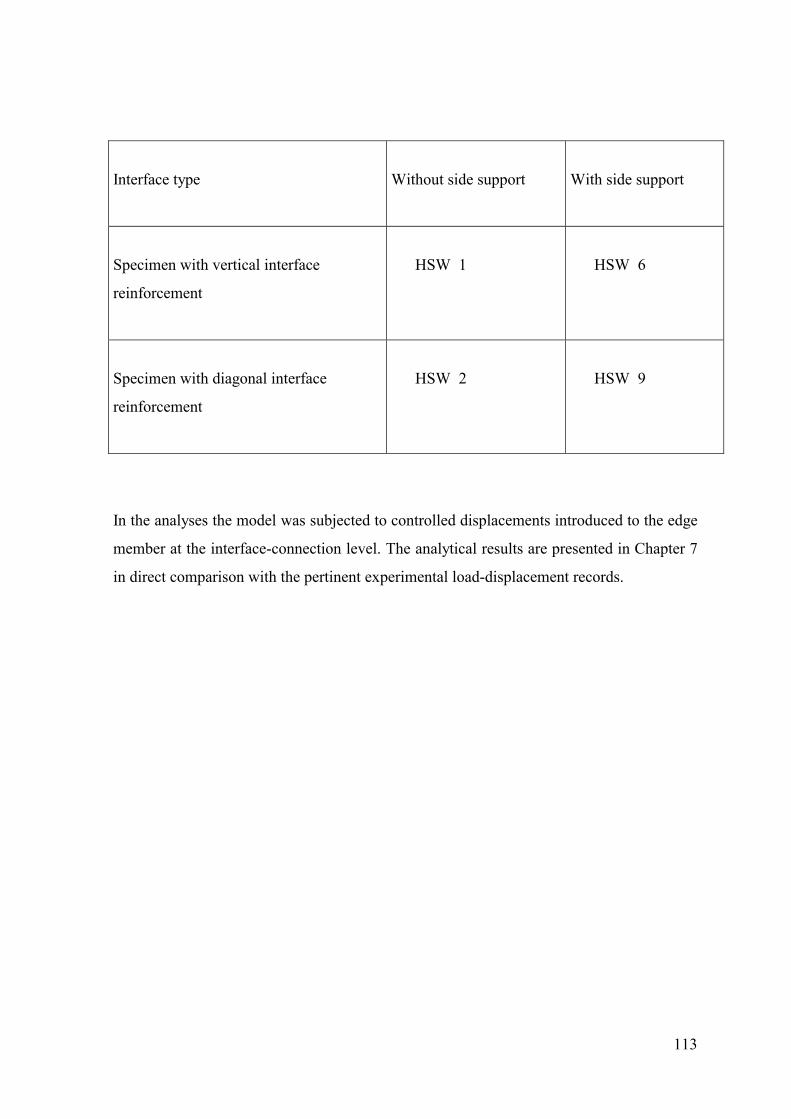
Interface type
Without side support
With side support
Specimen with vertical interface
reinforcement
HSW 1
HSW 6
Specimen with diagonal interface
reinforcement
HSW 2
HSW 9
In the analyses the model was subjected to controlled displacements introduced to the edge
member at the interface-connection level. The analytical results are presented in Chapter 7
in direct comparison with the pertinent experimental load-displacement records.
113

114

7 COMPARISON OF ANALYTICAL AND EXPERIMENTAL
RESULTS
7.1 General
In this chapter, the analytically predicted response of the hybrid shear wall specimens are
compared with the experimental test results. Specifically, the analytically derived force-
displacement response at the interface level is compared with the experimentally deter-
mined cyclic peak load-values for successively increased displacement levels. Also, the re-
duced load values due to cyclic deterioration under three repeated displacement levels are
considered in this comparative assessment. The correlative studies allow an evaluation of
the accuracy of the two different model concepts for the interface region presented in the
previous chapter.
7.2 Interface Force – Displacement Behavior
Considering the importance of capturing the interface behavior analytically, a comparison
of the numerically derived load displacement behavior under monotonic loading will be
compared with the experimental cyclic results. Such a comparison will give a basic evalua-
tion of the accuracy of the analytical model and procedures developed in this study. The
development of a cyclic nonlinear computer program, capable of capturing the cyclic dete-
rioration of the wall panel, particularly in the interface region between wall panel and edge-
member, was considered outside the scope of this investigation.
For the two specimen without side supports of the wall panel, the analytical force – dis-
placement behavior is shown in Figures 7.1 and 7.2. Specifically, these figures show, re-
spectively, for the specimen with vertical and diagonal interface reinforcement, the mono-
115

tonic, step-wise increased, displacement-controlled lateral force, acting at the interface
level, versus the lateral displacement of the wall at that same level. In both figures the re-
sults, using an interface-spring model as well as an interface-truss model at the „interface
connection“ (IFC), are being presented. For comparison, these figures also show the ex-
perimental results covering not only the first positive cyclic peak-load values at the prede-
termined displacement levels but also the loads observed after subjecting the specimen to
two more successive displacements of the same magnitude. In fact, the experimental results
present the positive loading branch of the envelope of the cyclic alternating hysteretic load-
displacement curves.
Comparing the numerical results with the experimental data, the analytical results indicate
that the finite element analyses are capable of predicting the experimental behavior of the
tested specimen when these had been subjected to a monotonic, displacement controlled
horizontal load. In that case the cyclic deterioration would not have occurred and a more
“elevated” experimental “curve”, in close agreement with the analytical results, would have
resulted. It is particularly important to note that the generally applicable “truss”- type
model would indeed have shown an excellent agreement with an experimental “mono-
tonic” curve (disregarding the cyclic load deterioration at each displacement level). This
gives ground to use this modelling technique with confidence, also in case of other rein-
forcing configurations. That also the empirically derived interface “spring model” shows
good agreement, is not surprising as it has been developed using the observed test results.
116

Force - displacement diagram
0
50
100
150
200
250
300
350
400
450
500
0 1 2 3 4 5 6 7 8 9 10Displacement (mm)
Forc
e (k
N)
Experimentel
Truss system at IFC
Spring element at IFC
Figure 7.1: Force-displacement comparison for specimen HSW1
Force - displacement diagram
0
50
100
150
200
250
300
350
400
450
500
0 1 2 3 4 5 6 7 8 9 10Displacement (mm)
Forc
e (k
N)
Experimentel
Truss system at IFC
Spring element at IFC
Figure 7.2: Force-displacement comparison for specimen HSW2
117

For the two specimen tested with side-supported walls, the analytical force – displacement
behavior along the interface in comparison with the experimentally derived data for the
straigt and diagonal interface bars is shown in Figures 7.3 and 7.4, respectively. The results
are taken from the second series of tests, in which the test setup was altered to reduce the
moment effect in the wall panel and study specifically the shear behaviour of the different
interface connections. In agreement with the experimental setup, the analytical model had
been formulated with the wall panel being side-supported over a length of 30 cm above the
fixing beam (see Figure 3.11).
Figures 7.3 and 7.4 show, for the specimens with vertical and diagonal interface reinforce-
ment, respectively, the monotonic, step-wise increased, displacement-controlled, lateral
force, acting at the interface level, versus the corresponding lateral displacement of the wall
at that same level. In both figures the results, using an interface-spring model as well as an
interface truss model at the „interface connection“ (IFC), have been presented. For com-
parison, these figures also present the experimental results showing not only the positive
cyclic peak-load values at the predetermined displacement levels but also the subsequent
deteriorated loads observed after subjecting the specimen to two more successive dis-
placements of the same magnitude. Considering the analytical and experimental results one
can conclude that the numerical methods, as described in Chapter 6, are capable to capture
the experimental response quite well. The basic difference between the results presented in
Figures 7.3 and 7.4 is due to the deteriorating load effects resulting from the cyclically in-
troduced displacement-controlled loads. Specifically, disregarding the deteriorating losses
in load resistance and considering the experimentally derived envelope between the succes-
sive displacement steps, the “resulting” experimental curve agrees very well with the ana-
lytical results.
That the analytical models, developed for predicting the interface behavior between the
edge-column and wall-panel, are indeed capable to successfully predict the load resistance
under increasing displacements is also substantiated by the excellent coincidence of the
118

corresponding maximum loads and displacements at failure. In fact, the numerically de-
rived maximum loads in the computer model are directly associated with the occurrence of
a brittle failure (sudden crushing) of the concrete struts in the truss-like interface model.
The predicted ultimate load values for the four different specimens discussed in this Chap-
ter are 258 kN (HSW1), 315 kN (HSW2), 340 kN (HSW6) and 437 kN (HSW9), respec-
tively. These values are within 10% of the ultimate test loads of 231 kN, 291 kN, 320 kN
and 420 kN, respectively.
119

Force - displacement diagram
0
50
100
150
200
250
300
350
400
450
500
0 1 2 3 4 5 6 7 8 9 10Displacement (mm)
Forc
e (k
N)
Experimentel
Truss system at IFC
Spring element at IFC
Figure 7.3: Force-displacement comparison for specimen HSW6
Force - displacement diagram
0
50
100
150
200
250
300
350
400
450
500
0 1 2 3 4 5 6 7 8 9 10Displacement (mm)
Forc
e (k
N)
Experimentel
Truss system at IFC
Spring element at IFC
Figure 7.4: Force-displacement comparison for specimen HSW9
120

8 CONCLUSIONS AND RECOMMENDATIONS FOR
FUTURE RESEARCH
Based on a series of alternating, displacement-controlled load tests on ten one-third scale
models, to study the behavior of the interface of a hybrid shear wall system and earlier
studies on moment resistant connections with hybrid columns by Bouwkamp et al [12], it
can be concluded that the concept of hybrid construction in earthquake prone regions is
feasible. The hybrid shear-wall system consists of typical reinforced concrete shearwalls
with composite edge members or flanges. The edge members, which are formed by com-
posite hollow steel square column sections with infilled concrete and reinforcing bars con-
nected to typical shear wall reinforcing steel, are prefabricated with reinforcing bars ex-
tending through the wall of the column for connection to the shear wall reinforcing steel.
The remainder of the building is constructed like a typical reinforced concrete structure.
In this study, ten different anchorage bar arrangements to evaluate the column-shearwall in-
terface behaviour under cyclic shear forces acting along the interface between column and
wall panel have been developed. Five test specimens had straight (horizontal) column an-
chorage bars and four specimen had diagonally oriented anchorage bars passing through
holes in the tube wall. A tenth specimen had horizontal anchorage bars welded to the wall
of the tubular column. In all cases the column reinforcing bars were connected to the wall
reinforcement through overlapping.
Results showed that the diagonally arranged bars at the column-wall interface, performed
better under cyclically induced alternating interface shear-loads than the interface connec-
tions with horizontal anchorage bars. In the latter case dowel action of the bars at the direct
interface causes significant slip between column and wall. In fact, an alternative design
with horizontal anchorage bars welded to the column wall exhibited the least slip between
edge member and wall. For developing a rather stiff integrated behavior of the hybrid shear
wall with the edge column member, either diagonally arranged anchor bars extending from
121

the column or welded horizontal stirrups to be connected (lapped) to the shear wall rein-
forcement are recommended. However, in case a softer interface connection between edge
column and shear wall should be desired, a design using straight bars, extending through
the wall of the edge member column and connected (lapped) to the wall reinforcement may
be considered.
Finite element models of the test specimens, using available ANSYS Solid 8-noded ele-
ments capable to capture the integrated concrete and reinforcing steel behavior in the wall
panels have been developed. Special models have been developed to capture the interface
behavior between edge column and shear wall. Specifically, using the experimental test re-
sults, a spring element idealizing the force-displacement relationship at the interface, has
been introduced. Also, a more generally applicable truss-like model capable of capturing
the interface behavior between edge column and wall has been developed. In this model
concrete struts in combination with the horizontal and vertical reinforcement in the wall
near the edge column allow a general description of the composite behavior in the wall in-
terface region. A comparison between experimental and numerical results show an excel-
lent agreement and clearly support the validity of the truss model developed in this study
for predicting the non-linear response of the hybrid wall system under earthquake load
conditions.
With the numerical model capability developed in this study, it is possible to predict the
seismic response of hybrid shear walls. Depending on the design of the edge columns and
the reinforcing layout in the interface regions between edge columns and shear wall over
the height of the building, it is possible to develop a highly efficient ductile wall system
which permits optimizing the axial stiffness of the edge member columns and interface re-
gions in order to increase the wall ductility and allow an increase of the q factor. Future
studies may focus on this design optimization process and should be supplemented with
full or medium-size model studies of entire hybrid shear walls or portions thereof.
122

REFERENCES [1] ACI 318-89, 1989, Building code requirements for reinforced concrete, Detroit,
Michigan: American Concrete Institute, USA. [2] ANSYS, 2001, User's - Theory Manual for Revision 5.7, Swanson analysis system's
Inc., USA. [3] Architectural Institute of Japan, 1987, AIJ standard for structural calculation of steel
reinforced concrete structures. Revised 1991. [4] Ashadi H. W., 1997, A Hybrid Composite-Concrete Structure Earthquake Resistant
System , Dissertation, Technische Universität Darmstadt. [5] Bazant Z. P., 1976, Instability, Ductility and Size Effect in Strain Softening Con-
crete, Journal of Engineering Mechanics, ASCE, Vol. 102(2), pp. 331-344. [6] Bazant Z. P., Belytschko T. B., Chang, T.-P., 1984, Continuum Theory for Strain
Softening, Journal of Engineering Mechanics, ASCE, Vol. 110, pp. 1666-1692. [7] Bazant Z. P., Prat P., 1988, Microplane model for brittle plastic materials. I: The-
ory, II: Verification, Journal of Engineering Mechanics, ASCE, Vol. 114, pp. 1672-1702.
[8] Belytschko T., Liu W. K., Moran B., 2000, Nonlinear Finite Elements for Continua
and Structures, John Wiley & Sons, New York, USA. [9] Bergmann R., 1981, Traglastberechnung von Verbundstützen, Mitteilung Nr. 81-2,
Technisch-wissenschaftliche Mitteilungen Institut für Konstruktiven Ingeunieurbau Ruhr-Universität Bochum.
[10] Betten J., 1993, Kontinuumsmechanik, Springer-Verlag, Berlin. [11] Boresi A. P., Chong K. P., 1987, Elasticity in Engineering Mechanics, Elsevier Sci-
ence Publishers, England. [12] Bouwkamp J.G., Ashadi H.W.,1992, A seismic hybrid composite structural frame
system for buildings. International symposium on Earthquake disaster prevention, Mexico City, Mexico.
[13] Chen W. F., 1982, Plasticity in Reinforced Concrete, McGraw-Hill Book Company
Inc., USA.
123

[14] Chen W.F. & Han,D.J., 1988, Plasticity for Structural Engineers, Springer-Verlag, New York Inc. USA.
[15] Comite International pour le development et etude de la construction tubulaire,
1970, Concrete filled hollow section steel columns, British edition, London. [16] Darwin D., Pecknold D. A., 1976, Analysis of RC Shear Panels under Cyclic Load-
ing, Journal of the Structural Devision, ASCE,Vol. 102, No. ST2, pp. 355-369,USA.
[17] European Committee for standardization, 1992, Eurocode-4,common unified rules
for composite steel and concrete structures, ECSC-EEC-EAEC, Brus-sels:Luxembourg.
[18] European Committee for standardization, 2000, Draft No. 1, Eurocode-8, Design
Structures for Earthquake resistance, Brussels. [19] European Committee for standardization,1994, Design provision of earthquake re-
sistance structures, Central European Norm. [20] Fajfar Peter, Krawinkler Helmut, 1992, Nonliear Seismic Anylysis and Design of
Reinforced Concrete Building, Elsevier Applied Science, London, England. [21] Finite Element Analysis of Reinforced Concrete, 1982, State of the Art Report,
American Soceity of Civil Engineers, New York, USA. [221] Ghosh S. K.,1991, Earthquake-Resistant Concrete Structures, Inelastic Response
and Design, American Concrete Institute, SP-127, USA. [23] Hsu T. C. C., Mau S. T., 1992, Concrete Shear in Earthquake, Elsevier Science
Publisher Ltd. England. [24] Jacob Lubiner, 1990, Plasticity Theory. Macmillan Publishing Company, United
States of America. [25] Kahn A. S., Huang S.,1995, Continuum Theory of Plasticity, John Wiley & Son,
New York, USA. [26] Krätzig W. B., Niemann H. J., 1996, Dynamic of civil Engineering Structures, A.A.
Balkema, Rotterdam, Netherlands. [27] Lemaitre J., Chaboche J., 1990, Mechanics of Solid Materials, Cambridge Univer-
sity Press, Cambridge, Great Britain.
124

[28] Mattock Alan H., 1981, Cyclic Shear Transfer and Type of Interface, ASCE, Vol. 107, No. ST10, pp. 1945-1964.
[29] Mattock Alan H., Hawkin Neil M., 1972, Shear Transfer in Reinforced Concrete –
Recent Research, PCI Journal. [30] Meyer C., Okamura H., 1985, Finite Element Analysis of Reinforced Concrete
Structure, Proceedings of Seminar - State of the Art Report, American Soceity of Civil Engineers, New York, USA.
[31] Meyer C., 1987, Finite Element Idealization for Linear Elastic Static and Dynamic
Analysis of Structures in Engineering Practice, American Soceity of Civil Engi-neers, New York, USA.
[32] Ottosen N. S., 1977, A Failue Criterion for Concrete, Journal of Engineering Me-
chanics, ASCE, Vol. 103, pp. 527-535. [33] Ozcebe G., Saatcioglu M., 1989, Hysteretic Shear Model for Reinforced Concrete
Members, Journal of Structural Engineering, ASCE, Vol. 115, No. 1, pp. 132-147. [34] Paulay, T., Bachmann H., Moser K., 1990, Erdbebenbemessung von Stahlbeton-
hochbauten, Birkhäuser Verlag, Basel:Switzerland. [35] Paz Mario, 1991, Structural Dynamics, Theory and Computation, Van Nostrand
Reinhold, New York, USA. [36] Pradhan A. P., Bouwkamp J. G., 1992, Hybrid Shearwall, Proc. of 12th WCEE, Ma-
drid, Spain [37] Roik K., 1989, Experimentelle und theoretische Untersuchungen zum plastischen
Verhalten von Verbundstützen bei großen Deformation, Stahlbau 58, H. 11, 1989, pp. 321-330.
[38] SAP2000, 1996, Analysis Reference Vol. 1 & 2, Computer and Structures Inc.,
Berkely, California, USA. [39] Shirali N. M., 1989, Seismic shear strength of reinforced masonry piers, M.
Sc.Thesis, Middle East Technical University, Ankara, Turkey. [40] Shirali N. M., Bouwkamp J. G., 1998, Hybrid shearwall system – Shear strength at
interface connection, Proc. of 11th European Conference on Earthquake Engineer-ing, European Association of Earthquake Engineer, Paris: France.
[41] Srinivasan C.N., Behavior of concrete in-filled tubular columns, AICAP-CEB
symposium , CEB, Bulletin d'Information, No. 131, Rome, Italy.
125

[42] Sucuoglu H., Shirali N. M., 1989, Seismic shear strength of reinforced masonry
piers, Proc. of 8th European Conference on Earthquake Engineering, European As-sociation of Earthquake Engineer, Moscow: Russia.
[43] Takeda T., Sozen M. A., Nielsen N. N., 1970, Reinforced concrete response to
simulated earthquakes. Journal of Structural Division ASCE, Vol. 96, No. ST 12, Dec.:2557-2573.
[44] Uniform Building Code, 1994, Structural Engineering Design Provisions, Interna-
tional Conference of Building Officials, USA. [45] Valenas J. M., Bertero V. V., Popov E. P., August 1979, Hysteretic behavior of re-
inforced concrete structural walls, Report No. UCB/EERC-79/20, University of California . Berkeley, California, USA.
[46] Willam K. J., Warnke E., 1974, Constitutive Model for Triaxial Behavior of Con-
crete, Proc. Concrete Structures Subjected to Triaxial Stresses, International Asso-ciation for Bridge and Structural Engineers, Section III, pp. 1-30, Bergamo, Italy.
[47] Wight J. K., 1985, Earthquake Effects on Reinforced Concrete Structures, U.S. –
Japan research, American Concrete Institute, SP-84, USA.
126

LEBENSLAUF Zur Person: N. Mohammad Shirali
Geboren in Bander-e-turkman, Iran
Familienstand: ledig
Staatsangehörigkeit: Iran
Studium und berufliche Tätigkeit:
1979 - 1985 : Ingenieursstudium an der Middle East Technical University
in Ankara mit Abschluss des
„Bachelors of Science in Civil Engineering“.
1985 - 1986 : Tätigkeit im Ingenieurbüro Enka in Ankara als Statiker.
1986 - 1989 : Ingenieursstudium an der Middle East Technical University
in Ankara mit Abschluß des
„Master of Science in Civil Engineering”.
1990 – 1997 : Wissenschaftlicher Mitarbeiter bei Prof. Ir. J. G. Bouwkamp im
Institut für Stahlbau und Werkstoffmechanik der TU Darmstadt.
1992 - 1997 : Freier Mitarbeiter (als Statiker ) im Ingenieurbüro Bouwkamp,
Fehling und Partner, Landskronstraße 31, 64285 Darmstadt.
1998 - 2002 : Wissenschaftlicher Mitarbeiter bei Prof. Dr. J. Lange, Institut für
Stahlbau und Werkstoffmechanik der TU Darmstadt.
Seit 2002 : PWW, Ingenieurbüro für Bauwesen, Ingelheimerstraße 3
64295 Darmstadt
127