Seismic performance of steel frames designed using ... · ORIGINAL ARTICLE Seismic performance of...
9
ORIGINAL ARTICLE Seismic performance of steel frames designed using different allowable story drift limits Hamdy Abou-Elfath * , Mostafa Ramadan, Mohamed Meshaly, Heba Alzobair Fdiel Structural Eng. Dept., Faculty of Engineering, Alexandria University, Alexandria, Egypt Received 17 July 2016; accepted 28 August 2016 KEYWORDS Steel frame; Story drift; Earthquake; Pushover; Seismic damage; Performance evaluation Abstract The design of Moment Resisting Steel Frames (MRSFs) is usually governed by drift lim- its rather than strength because of their high flexibility. The purpose of this study is to evaluate the seismic performance of a 6-story MRSF designed according to the Egyptian code with three differ- ent levels of allowable story drift limits: 0.5%, 0.75% and 1.0%. Seismic evaluation in this study has been carried out by static pushover analysis and time history earthquake analysis. Ten ground motions with different PGA levels are used in the analysis. The mean plus one standard deviation values of the roof-drift ratio, the maximum story drift ratio and the maximum beam- and column- strain responses are used as the basis for the seismic performance evaluations. The results obtained indicated that the strength and the initial stiffness of the designed frames decrease as the allowed story drift limit of the frame increases. Two of the designed frames exhibit maximum story drifts that are higher than the allowed limits specified by the code. The maximum story drift and beam-strain responses of the designed frames under the earthquake loading increase with the increase in the allowable story drift limits. Ó 2016 Production and hosting by Elsevier B.V. on behalf of Faculty of Engineering, Alexandria University. This is an open access article under the CC BY-NC-ND license (http://creativecommons.org/ licenses/by-nc-nd/4.0/). 1. Introduction The main objective of seismic codes including the recent Egyp- tian code (ECP-201) [1] is to achieve satisfactory performance of structural systems when subjected to earthquake loading. However, seismic design of building structures is usually con- ducted by approximate procedures that rely on using elastic static analysis instead of the actual inelastic dynamic one. This highlights the importance of evaluating the actual dynamic inelastic performance of the code designed structures under the effect of real earthquake records. Such evaluation is essen- tial to provide information on the level of protection afforded to the code designed structures against seismic loading. The Egyptian code provisions for the seismic design of MRSFs have been evaluated through parametric and compar- ative investigations using different analysis procedures and numerical models. The analysis has been conducted at either the structure-level or the beam-to-column connection level. Shehata et al. [2] analyzed MRSFs designed according to the Egyptian code with strong and weak-joint approaches. The global and local performance parameters of the frames are evaluated under lateral loading conditions. The results indi- cated satisfactory performance of both the design approaches. * Corresponding author. E-mail address: [email protected] (H. Abou-Elfath). Peer review under responsibility of Faculty of Engineering, Alexandria University. Alexandria Engineering Journal (2016) xxx, xxx–xxx HOSTED BY Alexandria University Alexandria Engineering Journal www.elsevier.com/locate/aej www.sciencedirect.com http://dx.doi.org/10.1016/j.aej.2016.08.028 1110-0168 Ó 2016 Production and hosting by Elsevier B.V. on behalf of Faculty of Engineering, Alexandria University. This is an open access article under the CC BY-NC-ND license (http://creativecommons.org/licenses/by-nc-nd/4.0/). Please cite this article in press as: H. Abou-Elfath et al., Seismic performance of steel frames designed using different allowable story drift limits, Alexandria Eng. J. (2016), http://dx.doi.org/10.1016/j.aej.2016.08.028
-
Upload
truonghanh -
Category
Documents
-
view
220 -
download
1
Transcript of Seismic performance of steel frames designed using ... · ORIGINAL ARTICLE Seismic performance of...

Alexandria Engineering Journal (2016) xxx, xxx–xxx
HO ST E D BY
Alexandria University
Alexandria Engineering Journal
www.elsevier.com/locate/aejwww.sciencedirect.com
ORIGINAL ARTICLE
Seismic performance of steel frames designed using
different allowable story drift limits
* Corresponding author.
E-mail address: [email protected] (H. Abou-Elfath).
Peer review under responsibility of Faculty of Engineering, Alexandria
University.
http://dx.doi.org/10.1016/j.aej.2016.08.0281110-0168 � 2016 Production and hosting by Elsevier B.V. on behalf of Faculty of Engineering, Alexandria University.This is an open access article under the CC BY-NC-ND license (http://creativecommons.org/licenses/by-nc-nd/4.0/).
Please cite this article in press as: H. Abou-Elfath et al., Seismic performance of steel frames designed using different allowable story drift limits, Alexandri(2016), http://dx.doi.org/10.1016/j.aej.2016.08.028
Hamdy Abou-Elfath *, Mostafa Ramadan, Mohamed Meshaly, Heba Alzobair Fdiel
Structural Eng. Dept., Faculty of Engineering, Alexandria University, Alexandria, Egypt
Received 17 July 2016; accepted 28 August 2016
KEYWORDS
Steel frame;
Story drift;
Earthquake;
Pushover;
Seismic damage;
Performance evaluation
Abstract The design of Moment Resisting Steel Frames (MRSFs) is usually governed by drift lim-
its rather than strength because of their high flexibility. The purpose of this study is to evaluate the
seismic performance of a 6-story MRSF designed according to the Egyptian code with three differ-
ent levels of allowable story drift limits: 0.5%, 0.75% and 1.0%. Seismic evaluation in this study has
been carried out by static pushover analysis and time history earthquake analysis. Ten ground
motions with different PGA levels are used in the analysis. The mean plus one standard deviation
values of the roof-drift ratio, the maximum story drift ratio and the maximum beam- and column-
strain responses are used as the basis for the seismic performance evaluations.
The results obtained indicated that the strength and the initial stiffness of the designed frames
decrease as the allowed story drift limit of the frame increases. Two of the designed frames exhibit
maximum story drifts that are higher than the allowed limits specified by the code. The maximum
story drift and beam-strain responses of the designed frames under the earthquake loading increase
with the increase in the allowable story drift limits.� 2016 Production and hosting by Elsevier B.V. on behalf of Faculty of Engineering, Alexandria
University. This is an open access article under the CC BY-NC-ND license (http://creativecommons.org/
licenses/by-nc-nd/4.0/).
1. Introduction
The main objective of seismic codes including the recent Egyp-tian code (ECP-201) [1] is to achieve satisfactory performance
of structural systems when subjected to earthquake loading.However, seismic design of building structures is usually con-ducted by approximate procedures that rely on using elastic
static analysis instead of the actual inelastic dynamic one. Thishighlights the importance of evaluating the actual dynamic
inelastic performance of the code designed structures underthe effect of real earthquake records. Such evaluation is essen-tial to provide information on the level of protection afforded
to the code designed structures against seismic loading.The Egyptian code provisions for the seismic design of
MRSFs have been evaluated through parametric and compar-ative investigations using different analysis procedures and
numerical models. The analysis has been conducted at eitherthe structure-level or the beam-to-column connection level.Shehata et al. [2] analyzed MRSFs designed according to the
Egyptian code with strong and weak-joint approaches. Theglobal and local performance parameters of the frames areevaluated under lateral loading conditions. The results indi-
cated satisfactory performance of both the design approaches.
a Eng. J.

2 H. Abou-Elfath et al.
Serror et al. [3] investigated how to define the boundarybetween special moment resisting frame and ordinary momentresisting frame in the ECP-201. The seismic provisions of ECP-
201 have been compared with those of the Euro-Code 8 andthe Uniform Building Code with regard to ductility classesand their impact on the response modification factor. They
suggested specifying a structure as special moment resistingframe means that its members should adhere to class 1 (com-pact width-to-thickness ratio) requirements; while specifying
a structure as ordinary moment resisting frame means thatusing members of class 2 (non-compact/slender width-to-thickness ratio) is permitted.
Finite element modeling of MRSF connections has been
conducted by Mashaly et al. [4,5]. The software packageANSYS is used to model the joint under the effect of lateralloading. The results confirmed that the chosen parameters such
as material and section geometry of the joint, played effectiveroles on the energy dissipation of the connection under seismicloading.
El-Shaer [6] evaluated the effect of earthquake on steelframes with partial rigid connection. The analysis was basedon the nonlinear dynamic analysis considering both geometri-
cal and material nonlinearities. The analysis demonstrated thatthe calculated displacement responses are close to those pro-posed by different seismic codes. Abdel Raheem [7] evaluatedthe Egyptian code provisions for the seismic design of
moment-resistant frame multi-story building through usingnonlinear time history analysis, equivalent static load andresponse spectrum analysis methods. He found that diaphragm
flexibility caused an increase in the fundamental period and infloor displacements compared with the case of rigid dia-phragms of equivalent buildings. He concluded that the code
empirical methods under-predict the fundamental period ofstructures with flexible diaphragms. He also concluded thatthe equivalent static force approach of the ECP-201 is not
accurate as it overestimates the base shear. Serror and Abdel-moneam [8] evaluated the performance of MRSFs designedaccording to the Egyptian code. The focus of their study wason the effect of beam slenderness limit on the anticipated duc-
tility of MRSFs. They proposed guidelines to estimate theappropriate force reduction factor, R-factor, based on thebeam slenderness limit.
Most recent seismic codes, including the Egyptian code forcalculating loads (ECP-201) are developed with two perfor-mance levels. One, with the intent of limiting damage during
frequent moderate earthquakes namely the serviceability limitstate and the other is for ensuring collapse prevention during amajor earthquake namely the ultimate limit state [9]. Displace-ment parameters often offer better evaluation of damage
effects than force parameters when assessing structures to aserviceability limit state [10]. Therefore limiting displacementis a requirement for controlling the seismic damage.
In order to estimate the actual inelastic displacement thatdevelops in strong earthquakes, ECP-201 specifies that thecomputed displacement from the reduced lateral forces is
amplified by a factor that is equal to 0.7 � R-factor. The R-factor is the force reduction factor that accounts for the ductileinelastic behavior of the structural system. For the case of
moderate frequent earthquake, the displacement demand isestimated by reducing the strong-earthquake displacement toaccount for the difference in return periods between the strongearthquake and the frequent one. ECP-201 uses a displacement
Please cite this article in press as: H. Abou-Elfath et al., Seismic performance of stee(2016), http://dx.doi.org/10.1016/j.aej.2016.08.028
reduction factor m for this purpose. The value of the displace-ment reduction factor m is 0.4 for important structures and 0.5for ordinary buildings.
Seismic codes specify limits on the lateral displacementdemand corresponding to moderate frequent earthquakes tocontrol seismic damage to nonstructural components for ser-
viceability considerations. Traditionally lateral displacementhas been defined in terms of story drift which is the relative lat-eral displacement occurring between two successive floors.
Limitations on story drift ratios vary among the codes, gener-ally ranging from 0.25% to 1.5% depending on the type of thenon-structural elements. The Egyptian code specifies threelevels of allowable story drift limit depending on the type of
the non-structural elements and their arrangements into thestructure. The code specifies 0.5% allowable story drift ratiofor brittle partitions, 0.75% for ductile partitions and 1.0%
for structural systems with partitions fully isolated from thestructure motion.
The objective of this study is to evaluate the seismic perfor-
mances of a 6-story MRSF designed according to the Egyptiancode with different levels of allowable story drift limits. Threedesign cases of the 6-story MRSFs, D1, D2, and D3 are consid-
ered in this study. These design cases are corresponding toallowable story drift limits of 0.5, 0.75, and 1.0%, respectively.Seismic evaluation in this study has been carried out using sta-tic pushover analysis and time history earthquake analysis
using the SeismoStruct computer program [11]. Ten groundmotions with different PGA levels are used in the analysis.Each of the ground motion records is scaled to different
PGA levels to excite the structure well into the inelastic rangeof deformation. The mean plus one standard deviation valuesof the roof-drift ratio, the maximum story drift ratio and the
maximum beam- and column-strain responses are used asthe basis for the seismic performance evaluations.
2. Prototype frames and computer program
The prototype steel building considered in this study is a 6-story office building located in Cairo, Egypt with a design
PGA of 0.15 g. The plan of the building, shown in Fig. 1,has a rectangular configuration with 5-bays in the short direc-tion and 7-bays in the long direction. The bay width in bothdirections is constant and equals to 7.5 m. The story height
is 4.5 m for the ground floor and 3.5 m for other floors withthe total building height of 22.0 m. The floors consist of10 cm light weight concrete slab over a composite metal deck.
Structural members are selected from the American wideflange sections (W-sections). The usual structural steel specifi-cation for W-sections is ASTM A992. The yield strength is
345 MPa, modulus of elasticity is 200 GPa, strain hardeningratio is 0.01, and the shear modulus is 81 GPa.
The building is considered to have MRSFs in the perimeterof the short direction and braced steel frames in the perimeter
of the long direction to carry the seismic loads. A typicalperimeter MRSF in the short direction is shown in Fig. 2.The dead load is assumed equal to 5 kPa and it includes
weights of deck, beams, girders, ceiling, partitions andmechanical and electrical systems. Surface weight of the exte-rior walls is considered equal to 1.25 kPa. The applied live load
considered is taken 3 kPa for office buildings.
l frames designed using different allowable story drift limits, Alexandria Eng. J.
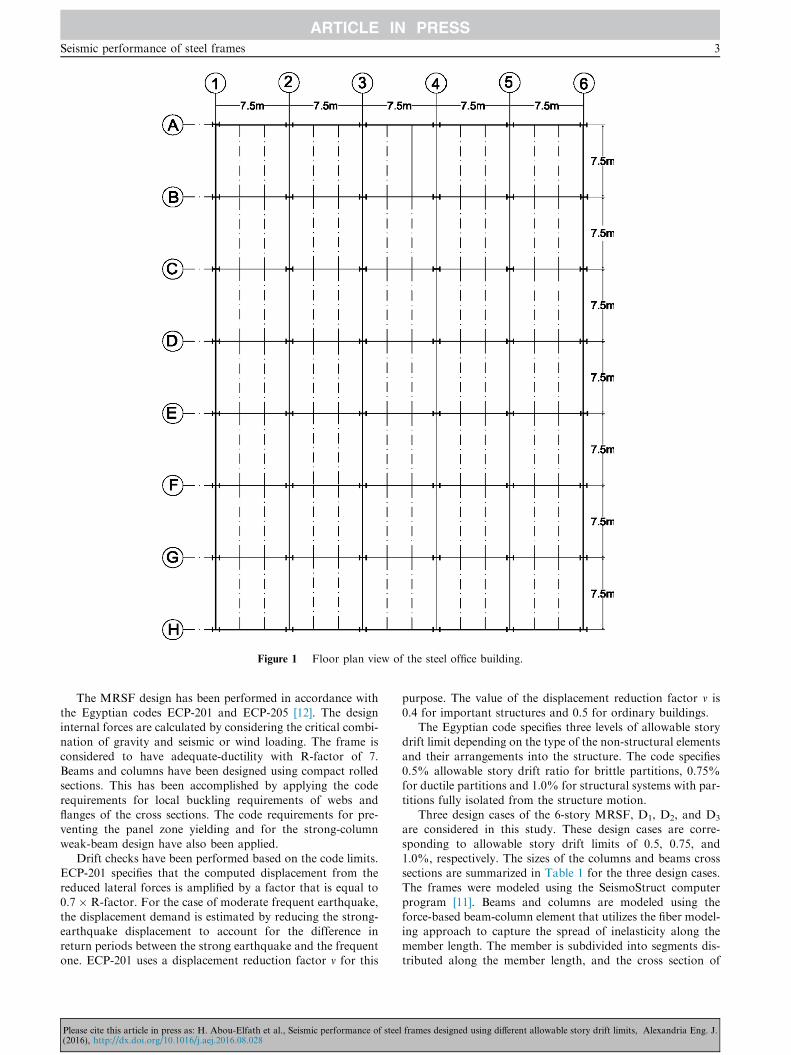
Figure 1 Floor plan view of the steel office building.
Seismic performance of steel frames 3
The MRSF design has been performed in accordance withthe Egyptian codes ECP-201 and ECP-205 [12]. The designinternal forces are calculated by considering the critical combi-nation of gravity and seismic or wind loading. The frame is
considered to have adequate-ductility with R-factor of 7.Beams and columns have been designed using compact rolledsections. This has been accomplished by applying the code
requirements for local buckling requirements of webs andflanges of the cross sections. The code requirements for pre-venting the panel zone yielding and for the strong-column
weak-beam design have also been applied.Drift checks have been performed based on the code limits.
ECP-201 specifies that the computed displacement from the
reduced lateral forces is amplified by a factor that is equal to0.7 � R-factor. For the case of moderate frequent earthquake,the displacement demand is estimated by reducing the strong-earthquake displacement to account for the difference in
return periods between the strong earthquake and the frequentone. ECP-201 uses a displacement reduction factor m for this
Please cite this article in press as: H. Abou-Elfath et al., Seismic performance of steel(2016), http://dx.doi.org/10.1016/j.aej.2016.08.028
purpose. The value of the displacement reduction factor m is0.4 for important structures and 0.5 for ordinary buildings.
The Egyptian code specifies three levels of allowable storydrift limit depending on the type of the non-structural elements
and their arrangements into the structure. The code specifies0.5% allowable story drift ratio for brittle partitions, 0.75%for ductile partitions and 1.0% for structural systems with par-
titions fully isolated from the structure motion.Three design cases of the 6-story MRSF, D1, D2, and D3
are considered in this study. These design cases are corre-
sponding to allowable story drift limits of 0.5, 0.75, and1.0%, respectively. The sizes of the columns and beams crosssections are summarized in Table 1 for the three design cases.
The frames were modeled using the SeismoStruct computerprogram [11]. Beams and columns are modeled using theforce-based beam-column element that utilizes the fiber model-ing approach to capture the spread of inelasticity along the
member length. The member is subdivided into segments dis-tributed along the member length, and the cross section of
frames designed using different allowable story drift limits, Alexandria Eng. J.
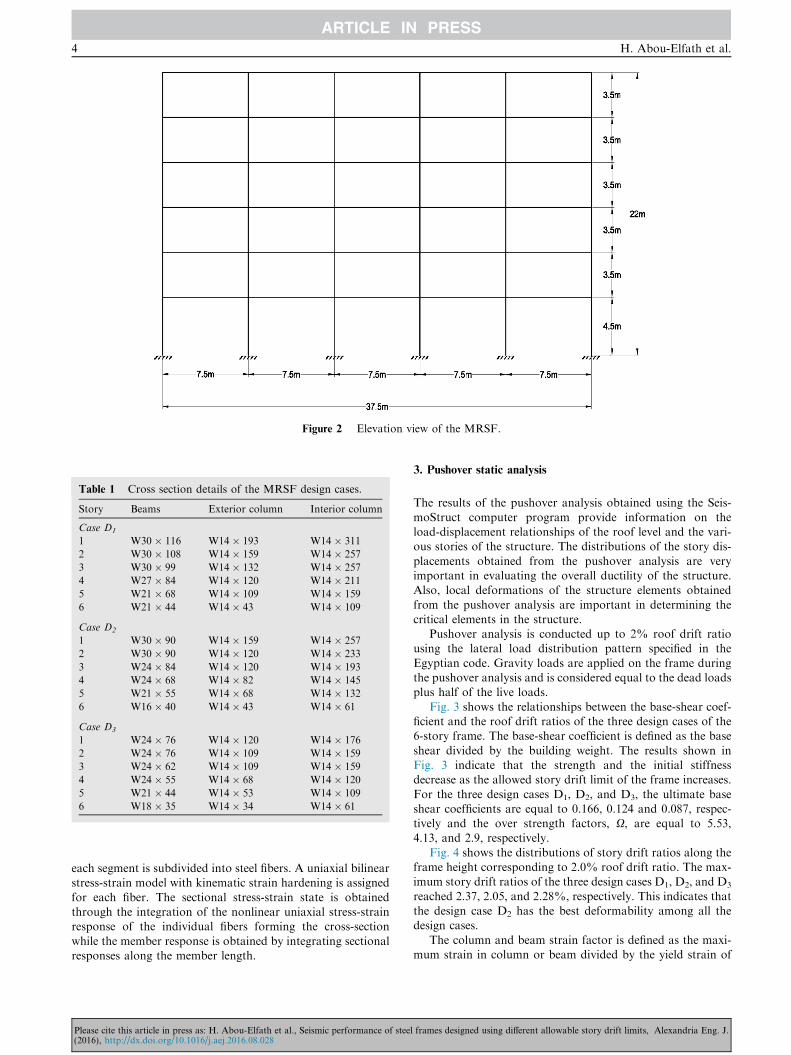
Figure 2 Elevation view of the MRSF.
Table 1 Cross section details of the MRSF design cases.
Story Beams Exterior column Interior column
Case D1
1 W30 � 116 W14 � 193 W14 � 311
2 W30 � 108 W14 � 159 W14 � 257
3 W30 � 99 W14 � 132 W14 � 257
4 W27 � 84 W14 � 120 W14 � 211
5 W21 � 68 W14 � 109 W14 � 159
6 W21 � 44 W14 � 43 W14 � 109
Case D2
1 W30 � 90 W14 � 159 W14 � 257
2 W30 � 90 W14 � 120 W14 � 233
3 W24 � 84 W14 � 120 W14 � 193
4 W24 � 68 W14 � 82 W14 � 145
5 W21 � 55 W14 � 68 W14 � 132
6 W16 � 40 W14 � 43 W14 � 61
Case D3
1 W24 � 76 W14 � 120 W14 � 176
2 W24 � 76 W14 � 109 W14 � 159
3 W24 � 62 W14 � 109 W14 � 159
4 W24 � 55 W14 � 68 W14 � 120
5 W21 � 44 W14 � 53 W14 � 109
6 W18 � 35 W14 � 34 W14 � 61
4 H. Abou-Elfath et al.
each segment is subdivided into steel fibers. A uniaxial bilinearstress-strain model with kinematic strain hardening is assigned
for each fiber. The sectional stress-strain state is obtainedthrough the integration of the nonlinear uniaxial stress-strainresponse of the individual fibers forming the cross-section
while the member response is obtained by integrating sectionalresponses along the member length.
Please cite this article in press as: H. Abou-Elfath et al., Seismic performance of stee(2016), http://dx.doi.org/10.1016/j.aej.2016.08.028
3. Pushover static analysis
The results of the pushover analysis obtained using the Seis-
moStruct computer program provide information on theload-displacement relationships of the roof level and the vari-ous stories of the structure. The distributions of the story dis-
placements obtained from the pushover analysis are veryimportant in evaluating the overall ductility of the structure.Also, local deformations of the structure elements obtained
from the pushover analysis are important in determining thecritical elements in the structure.
Pushover analysis is conducted up to 2% roof drift ratiousing the lateral load distribution pattern specified in the
Egyptian code. Gravity loads are applied on the frame duringthe pushover analysis and is considered equal to the dead loadsplus half of the live loads.
Fig. 3 shows the relationships between the base-shear coef-ficient and the roof drift ratios of the three design cases of the6-story frame. The base-shear coefficient is defined as the base
shear divided by the building weight. The results shown inFig. 3 indicate that the strength and the initial stiffnessdecrease as the allowed story drift limit of the frame increases.
For the three design cases D1, D2, and D3, the ultimate baseshear coefficients are equal to 0.166, 0.124 and 0.087, respec-tively and the over strength factors, X, are equal to 5.53,4.13, and 2.9, respectively.
Fig. 4 shows the distributions of story drift ratios along theframe height corresponding to 2.0% roof drift ratio. The max-imum story drift ratios of the three design cases D1, D2, and D3
reached 2.37, 2.05, and 2.28%, respectively. This indicates thatthe design case D2 has the best deformability among all thedesign cases.
The column and beam strain factor is defined as the maxi-mum strain in column or beam divided by the yield strain of
l frames designed using different allowable story drift limits, Alexandria Eng. J.

0
0.02
0.04
0.06
0.08
0.1
0.12
0.14
0.16
0.18
0 0.2 0.4 0.6 0.8 1 1.2 1.4 1.6 1.8 2
Bas
e Sh
ear C
oeff
icie
nt
Roof Drift Ratio (%)
Design Base Shear=0.03
D1
D2
D3
Figure 3 Relationships between the base shear coefficient and
the roof drift ratio of the three design cases.
0 0.5 1 1.5 2 2.5 3
1
2
3
4
5
6
Story Drift Ratio (%)
Stor
y N
umbe
r
D1
D2
D3
Figure 4 Height-wise distribution of story drift ratios of the
three design cases at 2.0% roof drift ratio.
0 2 4 6 8 10
1
2
3
4
5
6
Beam Strain Factor
Stor
y N
umbe
r D1
D2
D3
Figure 5 Height-wise distribution of beam strain factors at 2.0%
roof drift ratio.
0 2 4 6 8 10 12 14
1
2
3
4
5
6
Column Strain Factor
Stor
y N
umbe
r D1
D2
D3
Figure 6 Height-wise distribution of column strain factors at
2.0% roof drift ratio.
Seismic performance of steel frames 5
steel (ey ¼ 0:0017). The distribution of maximum strain factors
along the frame stories corresponding to 2.0% roof drift ratios
is shown in Fig. 5 for beams and Fig. 6 for columns. For thethree design cases D1, D2, and D3, the maximum beam strainfactors occurred in the first story and reached 8.8, 7.05, and
6.4%, respectively, and the maximum column strain factorsoccurred also in the first story and reached 11.7, 10, and9.4%, respectively. These results show that the design case
D1 exhibited the highest levels of beam and column strains,while case D3 showed the lowest levels of beam and columnstrains. This indicates that at any specific roof drift ratio, the
higher the allowable story drift limit is, the lower is the maxi-mum strains in columns and beams.
4. Fundamental periods of the designed MRSFs
The fundamental periods of the designed MRSFs calculatedby the SeismoStruct computer program are 1.87, 2.2 and2.67 s for the design cases D1, D2 and D3, respectively. The
fundamental periods of the D2 and D3 design cases are17.7%, and 42.8% higher than the D1 design case. Theseresults indicate that the fundamental period of the frame
Please cite this article in press as: H. Abou-Elfath et al., Seismic performance of steel(2016), http://dx.doi.org/10.1016/j.aej.2016.08.028
increases with the increase in the allowable story drift limit.The fundamental period of the frames calculated by theECP-201 equation (T = Ct H3/4) is equal to 0.86 s. It can be
observed that the exact fundamental periods of the framesare much longer than the values suggested by ECP-201. Thecode equation is empirical and its value is expected to be in
the safe side. In other words, the code prediction has to be les-ser than the exact values calculated from the exact analysis.
5. Earthquake response of the MRSFs
The earthquake analysis of the MRSFs is performed using atime step increment of 0.005 s and Rayleigh damping whichis defined to achieve 5.0% viscous damping in the first two nat-
ural modes of the building. Ten ground motions with differentPGA levels are used in the analysis. The Earthquake data andsite information for the selected ground motions records are
presented in Table 2.The seismic performances of the investigated MRSFs are
assessed using four performance parameters which include
the roof drift ratio, the maximum story drift ratio, the maxi-
frames designed using different allowable story drift limits, Alexandria Eng. J.
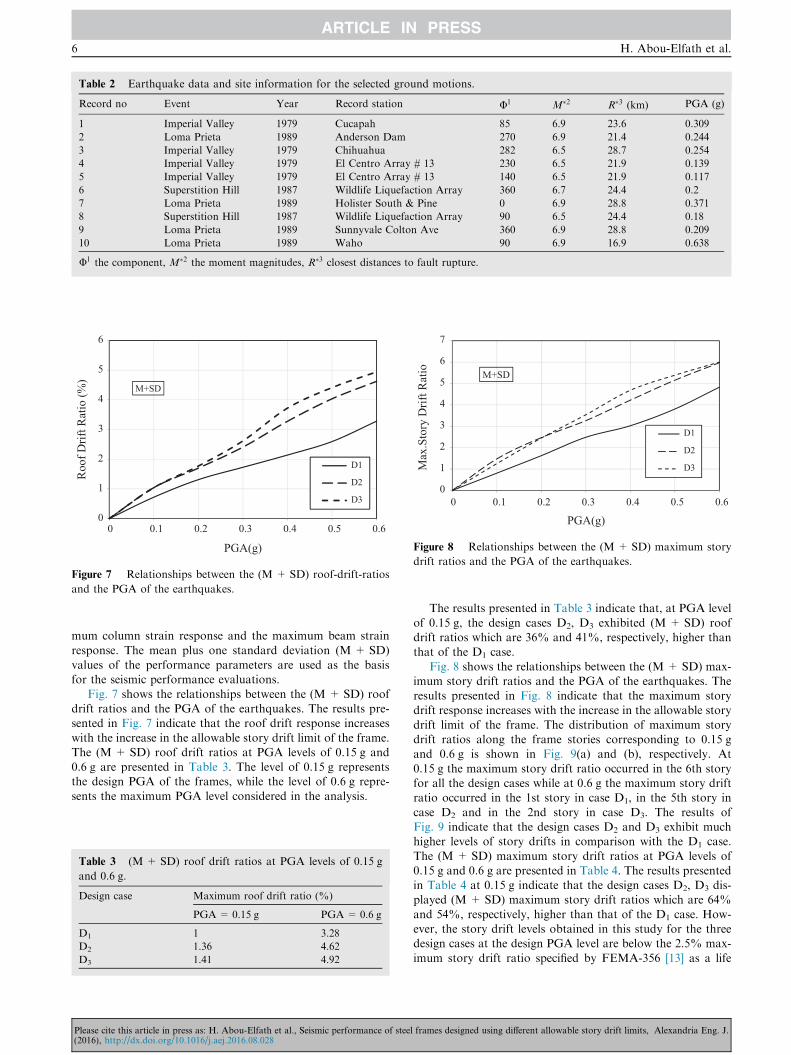
Table 2 Earthquake data and site information for the selected ground motions.
Record no Event Year Record station U1 M�2 R�3 (km) PGA (g)
1 Imperial Valley 1979 Cucapah 85 6.9 23.6 0.309
2 Loma Prieta 1989 Anderson Dam 270 6.9 21.4 0.244
3 Imperial Valley 1979 Chihuahua 282 6.5 28.7 0.254
4 Imperial Valley 1979 El Centro Array # 13 230 6.5 21.9 0.139
5 Imperial Valley 1979 El Centro Array # 13 140 6.5 21.9 0.117
6 Superstition Hill 1987 Wildlife Liquefaction Array 360 6.7 24.4 0.2
7 Loma Prieta 1989 Holister South & Pine 0 6.9 28.8 0.371
8 Superstition Hill 1987 Wildlife Liquefaction Array 90 6.5 24.4 0.18
9 Loma Prieta 1989 Sunnyvale Colton Ave 360 6.9 28.8 0.209
10 Loma Prieta 1989 Waho 90 6.9 16.9 0.638
U1 the component, M�2 the moment magnitudes, R�3 closest distances to fault rupture.
0
1
2
3
4
5
6
0 0.1 0.2 0.3 0.4 0.5 0.6
Roo
f Drif
t Rat
io (%
)
PGA(g)
M+SD
D1
D2
D3
Figure 7 Relationships between the (M + SD) roof-drift-ratios
and the PGA of the earthquakes.
0
1
2
3
4
5
6
7
0 0.1 0.2 0.3 0.4 0.5 0.6
Max
.Sto
ry D
rift R
atio
PGA(g)
M+SD
D1
D2
D3
Figure 8 Relationships between the (M + SD) maximum story
drift ratios and the PGA of the earthquakes.
6 H. Abou-Elfath et al.
mum column strain response and the maximum beam strain
response. The mean plus one standard deviation (M+ SD)values of the performance parameters are used as the basisfor the seismic performance evaluations.
Fig. 7 shows the relationships between the (M + SD) roofdrift ratios and the PGA of the earthquakes. The results pre-sented in Fig. 7 indicate that the roof drift response increases
with the increase in the allowable story drift limit of the frame.The (M + SD) roof drift ratios at PGA levels of 0.15 g and0.6 g are presented in Table 3. The level of 0.15 g representsthe design PGA of the frames, while the level of 0.6 g repre-
sents the maximum PGA level considered in the analysis.
Table 3 (M + SD) roof drift ratios at PGA levels of 0.15 g
and 0.6 g.
Design case Maximum roof drift ratio (%)
PGA= 0.15 g PGA= 0.6 g
D1 1 3.28
D2 1.36 4.62
D3 1.41 4.92
Please cite this article in press as: H. Abou-Elfath et al., Seismic performance of stee(2016), http://dx.doi.org/10.1016/j.aej.2016.08.028
The results presented in Table 3 indicate that, at PGA level
of 0.15 g, the design cases D2, D3 exhibited (M+ SD) roofdrift ratios which are 36% and 41%, respectively, higher thanthat of the D1 case.
Fig. 8 shows the relationships between the (M+ SD) max-imum story drift ratios and the PGA of the earthquakes. Theresults presented in Fig. 8 indicate that the maximum storydrift response increases with the increase in the allowable story
drift limit of the frame. The distribution of maximum storydrift ratios along the frame stories corresponding to 0.15 gand 0.6 g is shown in Fig. 9(a) and (b), respectively. At
0.15 g the maximum story drift ratio occurred in the 6th storyfor all the design cases while at 0.6 g the maximum story driftratio occurred in the 1st story in case D1, in the 5th story in
case D2 and in the 2nd story in case D3. The results ofFig. 9 indicate that the design cases D2 and D3 exhibit muchhigher levels of story drifts in comparison with the D1 case.
The (M + SD) maximum story drift ratios at PGA levels of0.15 g and 0.6 g are presented in Table 4. The results presentedin Table 4 at 0.15 g indicate that the design cases D2, D3 dis-played (M + SD) maximum story drift ratios which are 64%
and 54%, respectively, higher than that of the D1 case. How-ever, the story drift levels obtained in this study for the threedesign cases at the design PGA level are below the 2.5% max-
imum story drift ratio specified by FEMA-356 [13] as a life
l frames designed using different allowable story drift limits, Alexandria Eng. J.

0 1 2 3
1
2
3
4
5
6
Story Drift Ratio
(a) 0.15g
Stor
y N
umbe
r M+SD
D1
D2
D3
0 2 4 6 8 10
1
2
3
4
5
6
Story Drift Ratio(b) 0.6 g
Stor
y N
umbe
r
M+SD
D1
D2
D3
Figure 9 Height-wise distribution of the (M + SD) maximum story drift ratios of the three design cases.
Table 4 (M + SD) maximum story drift ratios at PGA levels
of 0.15 g and 0.6 g.
Design case Maximum story drift ratios (%)
PGA= 0.15 g PGA= 0.6 g
D1 1.2 4.82
D2 1.97 5.9
D3 1.85 6
0
5
10
15
20
25
30
35
40
45
0 0.1 0.2 0.3 0.4 0.5 0.6
Max
imum
Stra
in F
acto
rs
PGA(g)
M+SD
D1
D2
D3
Figure 10 Relationships between the PGA and the (M + SD)
maximum column-strain-factor.
Seismic performance of steel frames 7
safety performance level for earthquake with 10% probabilityof being exceeded in 50 years which is equivalent to the designearthquake.
Fig. 10 shows the relationships between the (M + SD)
maximum column strain factor and the PGA of the earth-quakes. The results presented in Fig. 10 indicate that the max-imum column strain factor increases with the increase in the
allowable story drift limit of the frame. The distribution of col-umn strain factors along the frame stories corresponding to0.15 g and 0.6 g is shown in Fig. 11(a) and (b), respectively.
At 0.15 g and 0.6 g the maximum column strain factors
Please cite this article in press as: H. Abou-Elfath et al., Seismic performance of steel(2016), http://dx.doi.org/10.1016/j.aej.2016.08.028
occurred in the 6th story for all the design cases. The (M
+ SD) maximum column strain factors at PGA levels of0.15 g and 0.6 g are presented in Table 5. The results presentedin Fig. 11 and Table 5 indicate that cases D2 and D3 exhibited
higher levels of maximum column strains than that of the D1
case.Fig. 12 shows the relationships between the (M+ SD)
maximum beam strain factor and the PGA of the earthquakes.The distribution of beam strain factors along the frame storiescorresponding to 0.15 g and 0.6 g is shown in Fig. 13(a) and (b), respectively. At 0.15 g the maximum beam strain
factors occurred in the 4th story in cases D2 and D3 and inthe 5th story in the D1 case. At 0.6 g, the maximum beamstrain factors occurred in the 1st story in all the design cases.
The (M + SD) maximum beam strain factors at PGA levelsof 0.15 g and 0.6 g are presented in Table 6. The results pre-sented in Fig. 13 and Table 6 indicate an increase in the levels
of maximum beam strains of cases D2 and D3 in comparisonwith that of the D1 case.
6. Displacement results versus the displacement design limits
The (M + SD) maximum story drift ratios at the design PGAlevel of 0.15 g are presented in Table 4. The three design casesD1, D2 and D3 exhibited (M + SD) maximum story drift
ratios of 1.2%, 1.97% and 1.85%, respectively. These levelsof maximum story drift ratios correspond to the strong earth-quake case. For the case of moderate frequent earthquake, the
displacement demand is estimated by reducing the strong-earthquake displacement to account for the difference inreturn periods between the strong earthquake and the frequent
one. ECP-201 uses a displacement reduction factor m for thispurpose. The value of the displacement reduction factor m is0.4 for important structures and 0.5 for ordinary buildings.
This indicates that the (M + SD) maximum story drift ratioscorresponding to moderate frequent earthquake are 0.6%,0.99% and 0.93% for the design cases D1, D2 and D3,respectively.
The allowable maximum story drift ratios for the designcases D1, D2 and D3 are 0.5%, 0.75% and 1.0%, respectively.This shows that case D3 satisfies the code requirements, while
cases D1 and D2 exhibit maximum story drift ratios that are
frames designed using different allowable story drift limits, Alexandria Eng. J.

0 2 4 6 8
1
2
3
4
5
6
Column Strain Factor(a) 0.15g
Stor
y N
umbe
r
M+SD
D1
D2
D3
0 10 20 30 40
1
2
3
4
5
6
Column Strain Factor(b) 0.6g
Stor
y N
umbe
r
M+SD
D1
D2
D3
Figure 11 Height-wise distribution of the (M + SD) maximum column strain factors of the three design cases.
Table 5 (M+ SD) maximum column strain-factors at PGA
levels of 0.15 g and 0.6 g.
Design case Maximum column strain-factors
PGA= 0.15 g PGA= 0.6 g
D1 6 28.5
D2 5.4 38.1
D3 7.9 37.9
0
5
10
15
20
25
30
0 0.15 0.3 0.45 0.6
Max
imum
Stra
in F
acto
rs
PGA(g)
M+SD
D1
D2
D3
Figure 12 Relationships between the PGA and the (M + SD)
maximum beam-strain-factors.
0 2 4 6 8
1
2
3
4
5
6
Beam Strain Factor(a) 0.15g
Stor
y N
umbe
r
M+SD
D1
D2
D3
Figure 13 Height-wise distribution of the (M + SD) ma
Table 6 (M + SD) maximum beam strain-factors at PGA
levels of 0.15 g and 0.6 g.
Design case Maximum beam strain-factors
PGA= 0.15 g PGA= 0.6 g
D1 2.70 19.97
D2 4.5 24.62
D3 4.80 24.17
8 H. Abou-Elfath et al.
Please cite this article in press as: H. Abou-Elfath et al., Seismic performance of stee(2016), http://dx.doi.org/10.1016/j.aej.2016.08.028
20% and 32%, respectively, higher than the allowed limitsspecified by the ECP-201.
7. Conclusion
Based on the analysis conducted by this study, the following
conclusions can be drawn:
(a) The strength and the initial stiffness of the designed
MRSFs decrease as the allowed story drift limit of theframe increases.
0 10 20 30
1
2
3
4
5
6
Beam Strain Factor(b) 0.6 g
Stor
y N
umbe
r M+SD
D1
D2
D3
ximum beam strain factors of the three design cases.
l frames designed using different allowable story drift limits, Alexandria Eng. J.

Seismic performance of steel frames 9
(b) The maximum story drift response of the designed
frames under the earthquake loading increase with theincrease in the allowable story drift limits. At the designPGA level (0.15 g), the maximum story drifts of the
designed frames with 0.75% and 1.0% allowed storydrifts are 64% and 54%, respectively, higher than thatof the design case with 0.5% allowed story drifts. Thistrend may be attributed to the fact that the frame
strengths decrease with the increase in the allowablestory drifts.
(c) The levels of maximum story drifts of the three designed
frames at the design PGA are below the 2.5% maximumstory drift ratio specified by FEMA-356 [13] as a lifesafety performance level for earthquake with 10% prob-
ability of being exceeded in 50 years.(d) Under the earthquake loading, the maximum strain
response of the MRSF beams increase with the increasein the allowable story drift limits. At the design PGA
level (0.15 g), the maximum beam-strain of the designedframes with 0.75% and 1.0% allowed story drifts are67% and 78%, respectively, higher than that of the
design case with 0.5% allowed story drifts. This behav-ior may also be attributed to the decrease in framestrengths with the increase in the allowable story drifts.
(e) The designed frame with 1.0% allowed story drift satis-fies the code requirements with respect to the maximumstory drift, while the other design cases with 0.5% and
0.75% allowed story drifts exhibit maximum story driftratios that are 20% and 32%, respectively, higher thanthe allowed limits specified by the ECP-201.
It should be noted that the conclusions drawn by this studyare based on one building and ten earthquake records. Moreanalysis is required on buildings having different heights and
with more earthquake records to achieve more reliableconclusions.
References
[1] ECP-201, Egyptian Code for Calculating Loads and Forces in
Structural Work and Masonry, Housing and Building National
Please cite this article in press as: H. Abou-Elfath et al., Seismic performance of steel(2016), http://dx.doi.org/10.1016/j.aej.2016.08.028
Research Center, Ministry of Housing, Utilities and Urban
Planning, Cairo, 2012.
[2] M.R. Shehata, G.A. Al-Saadi, H. Abou-Elfath, E.A. El-Hout,
Push over static analysis of moment resisting steel frames, in:
Sixth Alexandria International Conference on Structural and
Geotechnical Engineering, AICSGE 6, Alexandria, Egypt, 2007,
pp. ST133–ST149.
[3] M.H. Serror, M.M. Hassan, S.A. Mourad, Towards a boundary
between special and ordinary steel moment resisting frames in
the Egyptian code, in: Proc. of 14th European Conference on
Earthquake Engineering, Paper 197, Ohrid, 2010.
[4] E. Mashaly, M. El-Heweity, H. Abou-Elfath, M. Osman,
Behavior of four-bolt extended end-plate connection subjected
to lateral loading, Alexandria Eng. J. 50 (1) (2011) 79–90.
[5] E. Mashaly, M. El-Heweity, H. Abou-Elfath, M. Osman, Finite
element analysis of beam-to-column joints in steel frames under
cyclic loading, Alexandria Eng. J. 50 (1) (2011) 91–104.
[6] M.A.A. El-Shaer, Effect of earthquake on steel frames with
partial rigid connection, J. Eng. Sci., Assiut Univ. 40 (2) (2012)
343–352.
[7] S. Abdel Raheem, Evaluation of Egyptian code provisions for
seismic design of moment-resisting-frame multi-story buildings,
Int. J. Adv. Struct. Eng. 5 (2013) 1–20.
[8] M.H. Serror, M.N. Abdelmoneam, Seismic performance
evaluation of Egyptian code-designed steel moment resisting
frames, HBRC J. (2016) (in press).
[9] S.H. ElKassas, M.A. Haroun, Estimation method of inelastic
displacement demands of moment resisting frame buildings in
moderate seismic zones, in: Proc. of the 2nd Int. Eng. Mechanics
and Materials Specialty Conference, Ottowa, Canada, Paper
No. EM-056, 2011, 2011.
[10] M.J.N. Priestley, Displacement-based seismic assessment of
reinforced concrete buildings, J. Earthquake Eng. 1 (1) (1997)
157–192.
[11] SeismoStruct v7.0 – A Computer Program for Static and
Dynamic Nonlinear Analysis of Framed Structures, 2014.
<http://www.seismosoft.com>.
[12] ECP-205: Egyptian Code of Practice for Steel Construction,
Load and Resistance Factor Design (LRFD), Housing and
Building National Research Center, Ministry of Housing,
Utilities and Urban Planning, Cairo, 2008.
[13] FEMA 356, Prestandard and Commentary for the Seismic
Rehabilitation of Buildings, Federal Emergency Management
Agency, Washington, DC, USA, 2000.
frames designed using different allowable story drift limits, Alexandria Eng. J.