Seismic Load Determination for Residential...
14
WOOD DESIGN FOCUS V. 23, N. 2 9 Garrett H. Lyman, and Donald A. Bender, Ph.D., P.E., J. Daniel Dolan, Ph.D., P.E. Seismic Load Determination for Residential Decks Introduction Both the 2009 International Residential Code (IRC) Sec- tion R502.2.1 (ICC 2009b) and the 2009 International Building Code (IBC) Section 1604.8.3 (ICC 2009a) re- quire decks to be designed for vertical and lateral loads. This paper is part of a larger project to characterize lat- eral loads on residential decks caused by seismic, wind, and occupancy. In this paper, we focus on seismic load determination using the standard ASCE/SEI 7-10 Mini- mum Design Loads for Building and Other Structures (ASCE 2010). Specific objectives of this paper are to illustrate a method and example calculation for determin- ing the seismic loads on residential decks and provide a parameter sensitivity study to gain understanding as to the relative magnitudes of seismic loads in various re- gions in the US. Method for Determining Equivalent Lateral Seismic Force One of the analytical procedures permitted in ASCE 7 for calculating seismic loads is the equivalent lateral force procedure. This is a simplified procedure that can be used for seismic analysis on residential decks be- cause residential structures are built with light-frame construction. The equivalent lateral force procedure in ASCE 7 determines the seismic base shear in a given direction and the lateral seismic design forces are then distributed to each floor according to an inverted triangu- lar distribution. The seismic base shear force is a func- tion of the seismic response coefficient and the effective seismic weight. The seismic response coefficient is a function of the spectral response acceleration parameter in the short period range, the structural system, and the occupancy importance factor. Table 1 summarizes the steps to determine seismic loads. Steps 1-10 represent the usual procedure for cal- culating seismic loads on each story of a light-frame building. Steps 11 and 12 describe how we determined the seismic loads for the deck attached at the second story. We assume the deck is attached to the second story of a house using lag screws and tension hold-down hardware as per IRC Section R502.2.2, resulting in a stiff connection. Hence the seismic load path is from the ground, to the house, to the deck. Referring back to Table 1, in Step 11 we calculate the acceleration on the second story floor by dividing the seismic load from Step 10 by the mass of the second story. Finally, in Step 12, we determine the seismic load on the deck by multiply- ing the acceleration from Step 11 by the deck mass. Example Below is an example following the equivalent lateral force procedure for a residential deck with the following assumptions: Deck is located in high-risk seismic zone Site class D 2-story house with a floor plan area of 1,400 square feet Deck height of 10 ft Deck dimensions of 12 ft by 12 ft Allowable stress design (ASD) format Determine building weight Typical Roof/ceiling dead load: Roof truss top and bottom chord dead loads 15 psf ½ wall weight (partition load) 5 psf Total 20 psf Roof weight: (1400 ft 2 )(20 lb/ft 2 ) = 28 kips
Transcript of Seismic Load Determination for Residential...

WOOD DESIGN FOCUS V. 23, N. 2 9
Garrett H. Lyman, and Donald A. Bender, Ph.D., P.E., J. Daniel Dolan, Ph.D., P.E.
Seismic Load Determination for Residential
Decks
Introduction
Both the 2009 International Residential Code (IRC) Sec-
tion R502.2.1 (ICC 2009b) and the 2009 International
Building Code (IBC) Section 1604.8.3 (ICC 2009a) re-
quire decks to be designed for vertical and lateral loads.
This paper is part of a larger project to characterize lat-
eral loads on residential decks caused by seismic, wind,
and occupancy. In this paper, we focus on seismic load
determination using the standard ASCE/SEI 7-10 Mini-
mum Design Loads for Building and Other Structures
(ASCE 2010). Specific objectives of this paper are to
illustrate a method and example calculation for determin-
ing the seismic loads on residential decks and provide a
parameter sensitivity study to gain understanding as to
the relative magnitudes of seismic loads in various re-
gions in the US.
Method for Determining Equivalent Lateral Seismic
Force
One of the analytical procedures permitted in ASCE 7
for calculating seismic loads is the equivalent lateral
force procedure. This is a simplified procedure that can
be used for seismic analysis on residential decks be-
cause residential structures are built with light-frame
construction. The equivalent lateral force procedure in
ASCE 7 determines the seismic base shear in a given
direction and the lateral seismic design forces are then
distributed to each floor according to an inverted triangu-
lar distribution. The seismic base shear force is a func-
tion of the seismic response coefficient and the effective
seismic weight. The seismic response coefficient is a
function of the spectral response acceleration parameter
in the short period range, the structural system, and the
occupancy importance factor.
Table 1 summarizes the steps to determine seismic
loads. Steps 1-10 represent the usual procedure for cal-
culating seismic loads on each story of a light-frame
building. Steps 11 and 12 describe how we determined
the seismic loads for the deck attached at the second
story. We assume the deck is attached to the second
story of a house using lag screws and tension hold-down
hardware as per IRC Section R502.2.2, resulting in a
stiff connection. Hence the seismic load path is from the
ground, to the house, to the deck. Referring back to
Table 1, in Step 11 we calculate the acceleration on the
second story floor by dividing the seismic load from Step
10 by the mass of the second story. Finally, in Step 12,
we determine the seismic load on the deck by multiply-
ing the acceleration from Step 11 by the deck mass.
Example
Below is an example following the equivalent lateral
force procedure for a residential deck with the following
assumptions:
Deck is located in high-risk seismic zone
Site class D
2-story house with a floor plan area of 1,400
square feet
Deck height of 10 ft
Deck dimensions of 12 ft by 12 ft
Allowable stress design (ASD) format
Determine building weight
Typical Roof/ceiling dead load:
Roof truss top and bottom chord dead loads 15 psf
½ wall weight (partition load) 5 psf
Total 20 psf
Roof weight: (1400 ft2)(20 lb/ft
2) = 28 kips

WOOD DESIGN FOCUS V. 23, N. 2 10
Typical second floor dead load:
Walls (partition load) 10 psf
Plywood, ½” thick 1.6 psf
Gypsum, ½” thick 2.0 psf
Joists 6.0 psf
Lights/misc. 1.0 psf
Total 20.6 psf (Assume 20 psf)
Second floor weight: (1400 ft2)(20 lb/ft
2) = 28 kips
Dead load summary:
Roof 28 kips
Second floor 28 kips
Total 56 kips
Residential building: Risk Category II
Step 1: Determine importance factor
Ie = 1
Step 2: Determine the mapped spectral response
acceleration parameters
SS = 1.5
S1 = 1.25
Note: According to ASCE 7-10 Section 12.8.1.3, for reg-
ular structures five stories or less above the base and
with a period of 0.5 seconds or less, Cs is permitted to
be calculated using a value of 1.5 for Ss.
Step 3: Determine site coefficients
Soil Site Class D
Fa @ SS ≥ 1.25 = 1
Fv @ S1 ≥ 0.5 = 1.5
Step 4: Calculate the spectral response acceleration
SMS = FaSS = (1)(1.5) = 1.5
SM1 = FvS1 = (1.5)(1.25) = 1.88
Step 5: Calculate the design spectral response ac-
celeration parameters
SDS = 2/3SMS = (2/3)(1.5) = 1
SD1 = 2/3SM1 = (2/3)(1.88) = 1.25
Step 6: Determine the response modification factor
Response modification factor: R = 6.5
Note: The response modification factor was used for a
wood frame house utilizing a bearing wall system of
light-framed walls sheathed with wood structural panels
rated for shear resistance.
Table 1. Steps to Determine Seismic Load on Residential Decks Using ASCE
7-10 (all tables and equations cited in Table 1 are from ASCE 7-10)
Step 1: Determine importance factor, Ie (Table 1.5-2)
Step 2: Determine the mapped spectral response acceleration parameters, SS and S1 (Figure 22-2) or use USGS website
Step 3: Determine site coefficients, Fa and Fv (Table 11.4-1 and 11.4-2)
Step 4: Calculate the MCEr Spectral Response Acceleration, SMS and SM1 (Eq. 11.4-1 and 11.4-2) Step 5: Calculate the design spectral response acceleration parameters, SDS and SD1 (Eq. 11.4-3
and 11.4-4)
Step 6: Determine response modification factor, R (Table 12.2-1)
Step 7: Calculate the approximate fundamental period, Ta (Section 12.8.2.1)
Step 8: Calculate the seismic response coefficient, Cs (section 12.8.1.1)
Step 9: Calculate seismic base shear, V (Eq. 12.8-1)
Step 10: Distribute the lateral seismic forces to the floors and roof
Step 11: Find acceleration on second floor to distribute to the deck
Step 12: Determine the seismic load on the deck

WOOD DESIGN FOCUS V. 23, N. 2 11
Step 7: Calculate the approximate fundamental
period
Building height, hn = 25 ft
Ct = 0.02
x = 0.75
Ta = Cthnx = (0.02)(25
.75) = 0.22
Note: The values for the approximate period parameters
were chosen using the structure type of all other structur-
al systems
Step 8: Calculate the seismic response coefficient
Cs shall not exceed:
Cs = 0.15 is less than 0.86, therefore OK
Note: TL was determined to be 12 seconds from
ASCE 7 Fig. 22-12 which is greater than Ta
Cs shall not be less than:
Cs = 0.044SDSIe = (0.044)(1)(1) = .04 ≥ 0.01
Cs = 0.15 is greater than 0.044 therefore OK
Since S1 is greater than 0.6g, Cs shall not be less than:
Cs = 0.15 is greater than 0.1, therefore OK
Step 9: Calculate seismic base shear
V = CsW = (0.15)(56 kips) = 8.62 kips
Step 10: Distribute the lateral seismic forces to the
floors and roof
Fx = CvxV
For structures having a period of 0.5 seconds or less,
k = 1.
F2 = Cv2V = 2.87 kips
Step 11: Solve for acceleration on second floor to
distribute to the deck
Note: Mass and acceleration were determined at the 2nd
floor of the building to distribute to the deck.
Step 12: Determine the seismic load on the deck
Ad = 144 ft2
Note: To be conservative the deck weight included a 10
psf dead load and a 40 psf live load.
Fd = mda2 = (224 slugs)(3.3ft/s2) = 738 lbs
FASD = 0.7Fd = (0.7)(738) = 517 lbs
Figure 1. Hold-down Forces Due to Maximum ASD Seismic Load
15.0
1
5.6
1
e
DSS
I
R
SC
L1 TTfor 86.0
1
5.622.0
25.1
e
a
D
I
RT
S
1.0
1
5.6
25.15.05.0 1
eI
R
S
n
i
k
ii
k
xxVX hwhwC1
667.020281028
2028
333.020281028
1028
22
2
22
2
2
ftkipsftkips
ftkipsC
ftkipsftkips
ftkipsC
VR
V
22
2
22 /ftsecondkip87.0
s
ft2.32
kips28
g
Wm
2
2
2
2
22 ft/s3.3
ft
skips87.0
kips87.2
m
Fa
lbs200,7ft144s
lb50
ft
lb50 2
22
dd AW
slugs224
s
ft2.32
lbs7200
2
g
Wm dd

WOOD DESIGN FOCUS V. 23, N. 2 12
Therefore the ASD-factored load on the deck is 517 lb.
To analyze the hold-down force at the reactions, the seis-
mic load can be placed at the center of mass, which is
typically near the center of the deck (Figure 1). The ef-
fect of the posts resisting lateral loads will be conserva-
tively neglected. The reaction forces were assumed to
occur at the hold-down tension devices that were at-
tached at the corners of the deck. To gain an under-
standing of decks with different length-to-width ratios,
hold-down forces with different deck aspect ratios using a
deck area of 144 ft2 are summarized in Table 2.
Parameter Sensitivity Analysis
To gain an understanding of the typical seismic loads
across the United States, an investigation of seismic
loads for different spectral response acceleration param-
eters and site classes was performed (Table 3 and Fig-
ure 2). Seismic loads were calculated using the assump-
tions from the above example. The largest ASD-factored
seismic loads occurred for Site Classes D, C, and B with
a spectral response acceleration parameter of 1.5g. The
maximum load calculated was 517 lb. The maximum
value of 1.5g was used for the SS parameter because
ASCE 7-10 Section 12.8.1.3 permits a value of 1.5g for
regular structures five stories or less.
According to the permitted lateral load connection in the
2009 IRC, Figure R502.2.2.3, there needs to be a mini-
mum of at least two hold-down tension devices with an
allowable stress design capacity of not less than 1,500
lb. Based on our seismic analyses with the stated as-
sumptions, and using the equivalent lateral load provi-
sions in ASCE 7-10, hold-down requirements significantly
lower than 1,500 lb can be justified when seismic loads
govern. From our analyses, a maximum ASD-factored
seismic load of 1,250 lb would be reasonable, resulting in
hold-down requirements of approximately 625 lb. This
can be achieved through a variety of hardware solutions.
Deck ratio Hold down forces (lb)
1.5:1 388
1:1 259
1:1.5 173
Table 2: Hold-down Forces Due to ASD Seismic Load for Different Deck Ratios
Figure 2. Approximate ASD Seismic Deck Loads for Site Class D
Ss ≥ 1.5g, F = 517 lb
Ss = 1.0g, F = 379 lb
Ss = 0.5g, F = 242 lb
Ss ≤ 0.25g, F ≤ 138 lb

WOOD DESIGN FOCUS V. 23, N. 2 13
Summary and Conclusions
Seismic loads were calculated using the equivalent lat-
eral force procedure in ASCE 7-10. An example was pre-
sented along with a summary of the calculation steps
involved. Seismic loads for different seismic zones were
determined using the assumptions from the example pre-
sented herein. The largest ASD-factored seismic load
calculated was 517 lb. After analysis of this load on a 12
ft by 12 ft deck, the reaction hold-down force was 259 lb.
This load is smaller than the permitted hold-down tension
devices that require an allowable stress design capacity
of 1,500 lb each in the 2009 IRC, Section 502.2.2.3. An
allowable design capacity of 625 lb would be sufficient to
resist the seismic lateral loads based on the assumptions
and calculations given in this paper. By accurately char-
acterizing the lateral loads on decks, design profession-
als can pursue a range of rational, economical solutions
to resist lateral loads.
References
American Society of Civil Engineers. 2010. ASCE/SEI 7-
10 Minimum Design Loads for Buildings and Other
Structures. American Society of Civil Engineers,
Reston, Virginia.
ICC. (2009a.) “International Building Code (IBC).” http://
publicecodes.cyberregs.com/icod/ibc/2009/index.htm
ICC. (2009b.) “International Residential Code for One-
and-Two Family Dwellings (IRC).” http://
publicecodes.cyberregs.com/icod/irc/2009/index.htm
Notation:
a2 – second floor acceleration
Ad – area of the deck
Cs – seismic response coefficient
Ct – building period coefficient
Cvx – vertical distribution factor
Cv2 – 2nd
floor vertical distribution factor
Cvr – roof vertical distribution factor
g – acceleration due to gravity (32.2 ft/s2)
Ie – the seismic importance factor
Fa – short-period site coefficient
FASD – allowable stress design load on the deck
Fd – load on the deck
Fv – long-period site coefficient
Fx – portion of the seismic base shear, V, induced at
Level i, respectively
F2 – portion of seismic base shear on second floor
hi,hx – the height above the base to level i
hn – structure height
k – distribution exponent
m2 – mass on the second floor of building
md – mass of the deck
R – response modification coefficient
Ss – mapped MCER, 5 percent damped, spectral re-
sponse acceleration parameter at short
periods
S1 – mapped MCER, 5 percent damped, spectral re-
sponse acceleration parameter at period 1s
SDS – design, 5 percent damped, spectral response
acceleration parameter at short periods
SD1 – design, 5 percent damped, spectral response
acceleration parameter at a period of 1s
SMS – the MCER, 5 percent damped, spectral response
acceleration parameter at short periods adjusted
for site class effects
SM1 – the MCER, 5 percent damped, spectral response
Spectral response acceleration parameters
Seismic Force, F (lb)
Ss S1 Site class E Site class
D Site class C
Site class B
0.25 0.1 216 138 104 86
0.5 0.2 293 242 207 172
1 0.3 310 379 344 344
1.5 0.6 466 517 517 517
1.5 1.25 466 517 517 517
Table 3. ASD Seismic Loads for Different Response Acceleration Parameters and Site Classes

WOOD DESIGN FOCUS V. 23, N. 2 14
acceleration parameter at a period of 1s adjusted
for site class effects
T – fundamental period of the building
Ta – approximate fundamental period of the building
TL – long-period transition period
V – total design lateral force or shear at the base
W – effective seismic weight of the building
Wd – weight of the deck
wi,wx – portion of W that is located at or assigned to
Level I, respectively
w2 – weight of second floor of building
Garret H. Lyman, former graduate student, Civil and En-
vironmental Engineering, Washington State Univer-
sity, Pullman, WA.
Donald A. Bender, Ph.D., P.E., Director, Composite Ma-
terials and Engineering Center, and Weyerhaeuser
Professor, Civil and Environmental Engineering,
Washington State University, Pullman, WA,
J. Daniel Dolan, Ph.D., P.E., Professor, Civil and
Environmental Engineering, Washington State
University, Pullman, WA, [email protected]
WOOD DESIGN FOCUS V. 23, N. 2 23
the DCA 6, each lag screw was thoroughly tightened,
without over-tightening to prevent wood crushing, which
resulted in a tensile force of approximately 500 lb in
each lag screw. Due to stress relaxation, this force was
slightly less at the initiation of tests.
While the joist hanger manufacturer permits their hang-
ers to be installed with either nails or screws as speci-
fied in their technical literature, screws were used in this
study. IRC-2009 Section R507.1 (ICC 2009b) and IBC-
2009 1604.8.3 (ICC 2009a) both state that the deck at-
tachment to an exterior wall shall not be accomplished
by nails subject to withdrawal. These provisions have
been widely interpreted as applying to the deck ledger
attachment; however, they should also apply to deck
joist hanger attachment to the deck ledger needed to
complete the lateral load path from the deck to house.
Joist hanger screws were #9 (0.131 inch diameter, 1.5
inches long) SST Structural-Connector Screws (Model
No. SD9112) and #10 (0.161 inch diameter, 1.5 inches
long) SST Structural-Connector Screws (Model No.
SD10112). These screws have a Class 55 2006 IRC
compliant mechanical galvanized coating which is re-
quired to resist corrosion. The deck boards were at-
tached to each deck joist with two #9 SST Composi-
LokTM
Composite-Decking Screws (Model No.
DCLG212). Each deck board screw was installed ap-
proximately 1 inch from the deck board edge, and each
deck board was cut to length (no splices).
The hold-down connectors used on the second deck
configuration were SST DTT2Z with a “ZMAX” protective
coating. The hold-down was 14-gauge steel and a 0.5
inch diameter threaded rod was used to connect the
hold-downs from the deck to the house. The screws
used with the hold-down were (0.25 inches by 1.5 inch-
es) Simpson Strong-Tie Strong-Drive screws (Model No.
SDS25112). These screws had a double-barrier coat-
ing, which SST rates as equivalent corrosion resistance
to hot-dip galvanized.
Test Methods
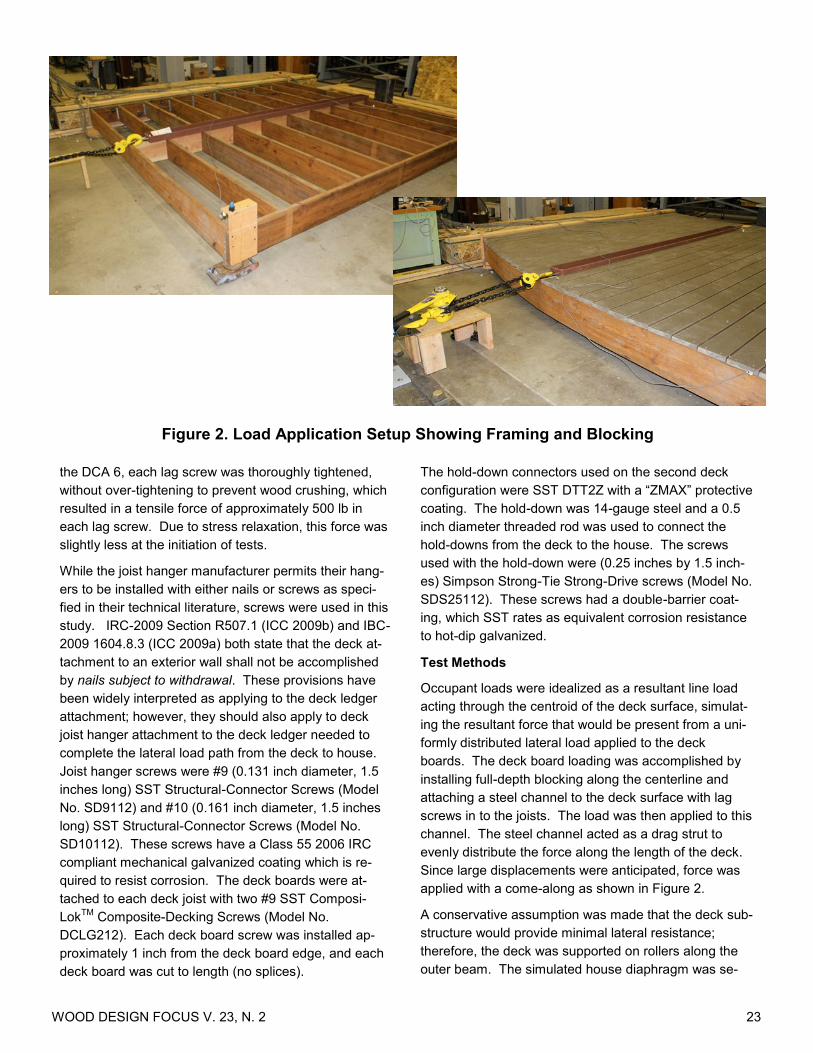
Occupant loads were idealized as a resultant line load
acting through the centroid of the deck surface, simulat-
ing the resultant force that would be present from a uni-
formly distributed lateral load applied to the deck
boards. The deck board loading was accomplished by
installing full-depth blocking along the centerline and
attaching a steel channel to the deck surface with lag
screws in to the joists. The load was then applied to this
channel. The steel channel acted as a drag strut to
evenly distribute the force along the length of the deck.
Since large displacements were anticipated, force was
applied with a come-along as shown in Figure 2.
A conservative assumption was made that the deck sub-
structure would provide minimal lateral resistance;
therefore, the deck was supported on rollers along the
outer beam. The simulated house diaphragm was se-
Figure 2. Load Application Setup Showing Framing and Blocking

WOOD DESIGN FOCUS V. 23, N. 2 24
curely anchored to the laboratory reaction floor.
A 10 kip load cell was installed in-line with the come-
along to record the force applied to the deck. Load cells
made out of steel sleeves and strain gages were used to
record forces in lag screws connecting the deck ledger
to the diaphragm rim board and hold-downs. Parsons
(2012) gives a detailed description of these load cells
and other experimental details. Seven string potentiom-
eters were used to measure various deck displace-
ments.
Results and Discussion
Lateral Force Resisting Mechanism
A large portion of lateral resistance was provided by
moment couples formed by the screws in the deck
board-to-deck joist connection, as shown in Figure 3. A
test was conducted without deck boards installed to de-
termine the initial stiffness of the bare frame (Figure 2),
which resulted in a value of 98.8 lb/in. This low amount
of stiffness was primarily provided by the rotational stiff-
ness of the joist hangers and the supporting rollers. The
initial stiffness determined after the deck boards were
installed was approximately 2,600 lb/in for both decks.
Therefore, 96% of the initial lateral stiffness was provid-
ed by the deck board-to-joist connections. The magni-
tude of each resisting couple is a function of the dis-
tance between the two screws and capacity is limited by
the screw strength and joist strength in tension perpen-
dicular to grain.
Observed Damage
In both tests, splitting of the top edges of the deck joists
was the main source of damage, and was caused by the
couple from the deck screws that induced stresses per-
pendicular to the grain. Splitting propagated along the
longitudinal axis of the wood. Each deck joist complete-
ly split, to the depth of screw penetration, from the load
drag strut to the ledger board. Significant yielding and
fracture of deck board screws was also observed in this
region. Minimal joist splitting and screw yielding was
seen in the region from the load drag strut to the outer
deck beam. In both tests, no damage was observed in
the deck ledger to house rim board connection. A maxi-
mum separation of 0.1 inches when hold-downs were
used and 0.15 inches when hold-downs were not used
was recorded between the deck ledger and diaphragm
rim board at the tension chord of the deck. No damage
was observed in the simulated house diaphragm.
In the test that used hold-down tension connectors, deck
joists fractured in weak axis bending due to the hold-
down installed on the compression chord producing
larger rotational joist stiffness at the ledger connection
than the joist hangers provided on the other joists. This
caused load from the other deck joists to be attracted to
the end joist, resulting in fracture. Once the end joist
fractured, the remaining joists fractured due to progres-
sive failure.
Load-Displacement Curves
For the test with no hold-down, the load displacement
curve at the load drag strut, shown in Figure 4, can be
divided into three segments. The first segment was a
softening curve that is seen in tests of many mechani-
cally connected structural assemblies as slip occurs and
damage initiates. At a displacement of approximately
3.5 inches, significant joist splitting has occurred and
most of the diaphragm stiffness from the deck board
attachment is lost. The second segment of the load-
displacement curve from 3.5 to 17 inches is approxi-
mately linear, with stiffness nearly equal to that of the
bare frame (shown at bottom of Figure 4). After 17 inch-
es, the third segment shows an unexpected large in-
crease in stiffness.
For the test with hold-downs, slightly higher stiffness
and load at 4 inch displacement were observed due to
the hold-downs resisting rotation of the deck joists. Sim-
ilar to the first test, the second segment from 4 to 15
inches reflects the frame stiffness with deck boards con-
tributing little. At a displacement of approximately 16
inches, the outer deck joists ruptured in weak-axis bend-
ing, followed by a sharp drop-off in load. In the third
Figure 3. Deck Board to Joist Connection and Resisting Couple Providing Lateral
Resistance

WOOD DESIGN FOCUS V. 23, N. 2 25
segment, a large increase in stiffness was once again
seen at approximately a displacement of 17 inches even
after deck joists had severely fractured.
When displacements reached approximately 17 inches
at the load drag strut, a large unexpected increase in
stiffness was seen in both decks (Figure 4). This large
change in stiffness is not fully understood, but could be
due to two phenomena. The increase in stiffness is
most likely caused by large lateral deflections and the
resulting rotation of the deck joists. This caused in-
creased portions of the lateral load to be resisted by axi-
al tension of the joists and hangers (recall the joist hang-
ers were attached with screws, thereby provided signifi-
cant withdrawal resistance). A second explanation could
be a function of deck board spacing. The stiffness in-
crease could occur at the point where deck boards be-
gan to bear against each other (i.e., the gap between
deck boards has closed), causing a large portion of the
force to be resisted by compression between deck
boards. Determining the exact reason for this large in-
crease in stiffness is probably not practically significant
since it occurred at extreme levels of displacement that
would most likely cause column instability under gravity
loads. Also, at this point significant damage was present
in the joists, which would compromise the safety of the
deck. From a practical standpoint, deck failure could be
defined as the point when the diaphragm stiffness was
lost by joist splitting at a displacement of approximately
4 inches.
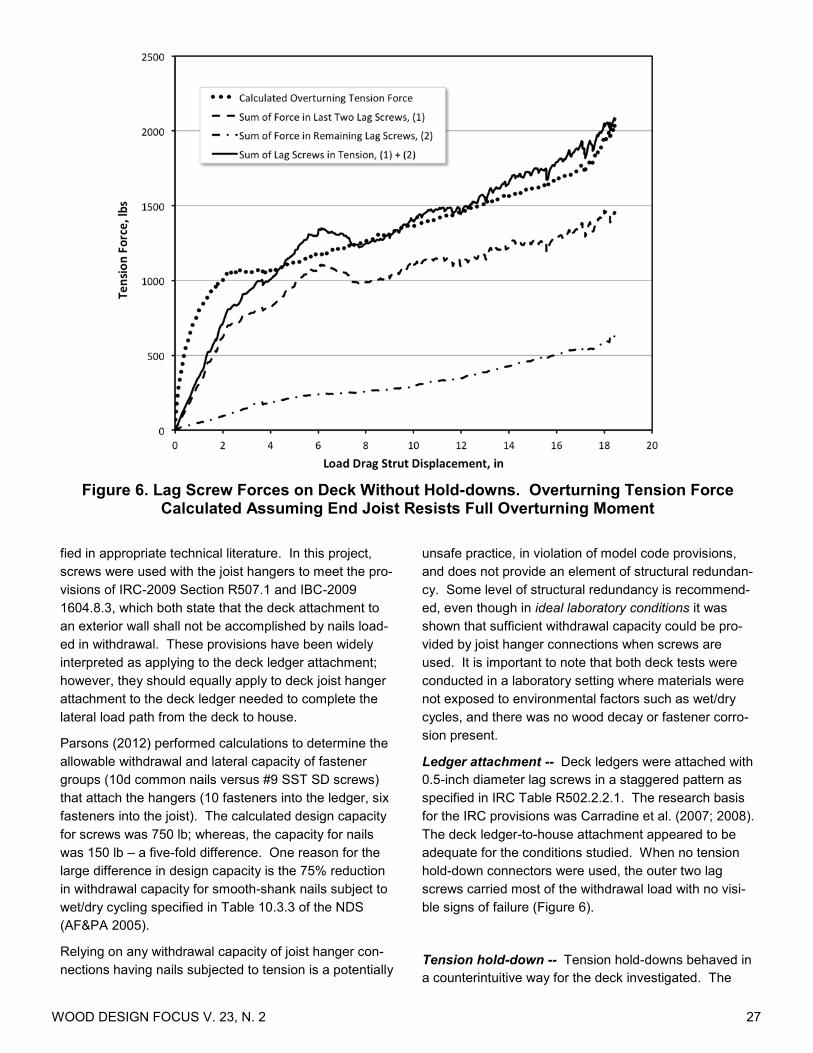
Lag Screw Forces
The lag screws to one side of the ledger board center-
line were in tension and the other side compression, as
expected. The two outermost lag screws in tension re-
sisted most of the chord force and the sum of the forces
in all the lag screws located in the tension region of the
deck agree well with the calculated overturning tension
force (Figure 6). Furthermore, even though the two
outermost lag screws carried most of the force, these lag
screws did not show any visible signs of withdrawal at a
maximum load of approximately 7,000 lbs (Figure 5)
Hold-Down Behavior and Geometric Effects
If the deck behaved as a rigid body, the tension chord
forces can be calculated using simple statics as given in
Equation 4.3-7 of the 2008 Special Design Provisions for
Wind and Seismic (AF&PA, 2008), and are shown in
Figure 7. However, due to the flexibility of the deck, the
measured forces in the hold-down connectors were dra-
matically different than expected. The hold-down ex-
pected to resist overturning tension forces actually di-
minished to zero as the deck deformed. The hold-down
Figure 4. Load-Displacement Curves for Deck With and Without Hold-downs

WOOD DESIGN FOCUS V. 23, N. 2 26
installed on the compression chord, which was expected
to resist no tension forces, actually had significant ten-
sion force due to a geometric prying effect caused by
joist rotation.
Significant rotations of the joists occurred due to large
displacements. Figure 8 illustrates how the tension
chord rotation caused a gradual loss of hold-down pre-
tension force until there was zero tension force in the
hold-down. This outcome demonstrated that the geo-
metric effect that was reducing the force in the hold-
down was larger than any tension force in the joist from
overturning moments. At this point, the joist hanger was
resisting the entire tension force in the joist, bypassing
the hold-down altogether. It can also be seen that the
hold-down on the compression chord is moving away
from the ledger as deck joist rotations increased. Even-
tually, the result was a significant tension force that
caused yielding of the hold-down. These same effects
are not seen in typical light-frame shear walls because
the chord framing members experience much smaller
rotations.
Due to this geometric effect, the hold-downs in their in-
stalled locations, behaved in a way that was completely
counterintuitive. The hold-downs might be more effec-
tive if the deck stiffness was increased, by installing the
decking diagonally. According to the 2008 Special De-
sign Provisions for Wind and Seismic (AF&PA, 2008),
shear walls and diaphragms sheathed with diagonally
oriented boards compared to horizontal results in four-
fold increase in stiffness. Also, if the joist connections to
the ledger had low withdrawal capacity, such as when
nails are used in the hangers, or toe-nails, then the ten-
sion hold-down connection would be expected to func-
tion as intended.
Design Implications
Joist hangers -- Joist hangers are typically rated for
gravity (vertical) loads. When a deck is loaded laterally,
the outermost joists are loaded in tension. Joist hangers
are not load-rated in tension (i.e. joist withdrawal from
the hanger). Preliminary experiments revealed that joist
hangers that utilized a toe-nailed fastener orientation did
not perform well when the toe-nailed connection was
subject to tension loads. As such, hangers used in this
project had fasteners installed perpendicular to the joist
faces.
Joist hanger manufacturers generally permit joist hang-
ers to be installed with either nails or screws as speci-
Figure 5. Load-Time Curves for Deck With and Without Hold-downs
WOOD DESIGN FOCUS V. 23, N. 2 27
fied in appropriate technical literature. In this project,
screws were used with the joist hangers to meet the pro-
visions of IRC-2009 Section R507.1 and IBC-2009
1604.8.3, which both state that the deck attachment to
an exterior wall shall not be accomplished by nails load-
ed in withdrawal. These provisions have been widely
interpreted as applying to the deck ledger attachment;
however, they should equally apply to deck joist hanger
attachment to the deck ledger needed to complete the
lateral load path from the deck to house.
Parsons (2012) performed calculations to determine the
allowable withdrawal and lateral capacity of fastener
groups (10d common nails versus #9 SST SD screws)
that attach the hangers (10 fasteners into the ledger, six
fasteners into the joist). The calculated design capacity
for screws was 750 lb; whereas, the capacity for nails
was 150 lb – a five-fold difference. One reason for the
large difference in design capacity is the 75% reduction
in withdrawal capacity for smooth-shank nails subject to
wet/dry cycling specified in Table 10.3.3 of the NDS
(AF&PA 2005).
Relying on any withdrawal capacity of joist hanger con-
nections having nails subjected to tension is a potentially
unsafe practice, in violation of model code provisions,
and does not provide an element of structural redundan-
cy. Some level of structural redundancy is recommend-
ed, even though in ideal laboratory conditions it was
shown that sufficient withdrawal capacity could be pro-
vided by joist hanger connections when screws are
used. It is important to note that both deck tests were
conducted in a laboratory setting where materials were
not exposed to environmental factors such as wet/dry
cycles, and there was no wood decay or fastener corro-
sion present.
Ledger attachment -- Deck ledgers were attached with
0.5-inch diameter lag screws in a staggered pattern as
specified in IRC Table R502.2.2.1. The research basis
for the IRC provisions was Carradine et al. (2007; 2008).
The deck ledger-to-house attachment appeared to be
adequate for the conditions studied. When no tension
hold-down connectors were used, the outer two lag
screws carried most of the withdrawal load with no visi-
ble signs of failure (Figure 6).
Tension hold-down -- Tension hold-downs behaved in
a counterintuitive way for the deck investigated. The
Figure 6. Lag Screw Forces on Deck Without Hold-downs. Overturning Tension Force Calculated Assuming End Joist Resists Full Overturning Moment

WOOD DESIGN FOCUS V. 23, N. 2 28
Figure 7. Recorded Hold-down Force Versus SDPWS Calculations
Figure 8. Plan View of Deck Joist Rotation and Resulting “Prying” Effect on Hold-down
WOOD DESIGN FOCUS V. 23, N. 2 29
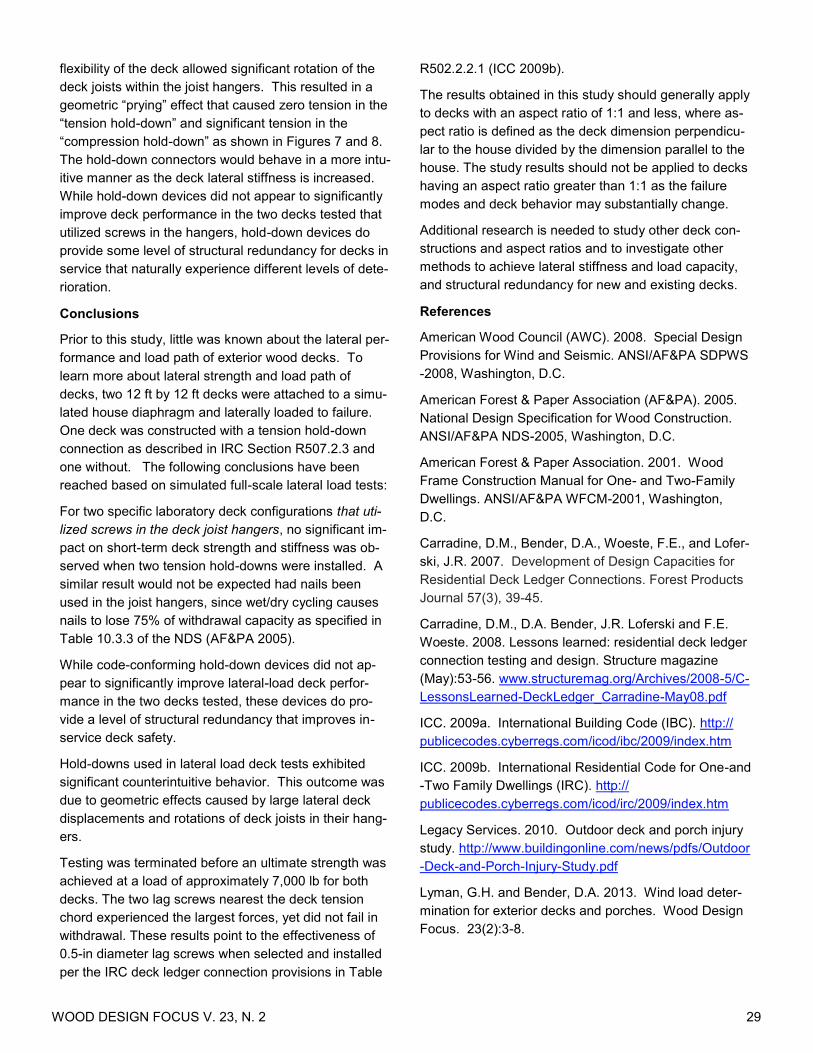
flexibility of the deck allowed significant rotation of the
deck joists within the joist hangers. This resulted in a
geometric “prying” effect that caused zero tension in the
“tension hold-down” and significant tension in the
“compression hold-down” as shown in Figures 7 and 8.
The hold-down connectors would behave in a more intu-
itive manner as the deck lateral stiffness is increased.
While hold-down devices did not appear to significantly
improve deck performance in the two decks tested that
utilized screws in the hangers, hold-down devices do
provide some level of structural redundancy for decks in
service that naturally experience different levels of dete-
rioration.
Conclusions
Prior to this study, little was known about the lateral per-
formance and load path of exterior wood decks. To
learn more about lateral strength and load path of
decks, two 12 ft by 12 ft decks were attached to a simu-
lated house diaphragm and laterally loaded to failure.
One deck was constructed with a tension hold-down
connection as described in IRC Section R507.2.3 and
one without. The following conclusions have been
reached based on simulated full-scale lateral load tests:
For two specific laboratory deck configurations that uti-
lized screws in the deck joist hangers, no significant im-
pact on short-term deck strength and stiffness was ob-
served when two tension hold-downs were installed. A
similar result would not be expected had nails been
used in the joist hangers, since wet/dry cycling causes
nails to lose 75% of withdrawal capacity as specified in
Table 10.3.3 of the NDS (AF&PA 2005).
While code-conforming hold-down devices did not ap-
pear to significantly improve lateral-load deck perfor-
mance in the two decks tested, these devices do pro-
vide a level of structural redundancy that improves in-
service deck safety.
Hold-downs used in lateral load deck tests exhibited
significant counterintuitive behavior. This outcome was
due to geometric effects caused by large lateral deck
displacements and rotations of deck joists in their hang-
ers.
Testing was terminated before an ultimate strength was
achieved at a load of approximately 7,000 lb for both
decks. The two lag screws nearest the deck tension
chord experienced the largest forces, yet did not fail in
withdrawal. These results point to the effectiveness of
0.5-in diameter lag screws when selected and installed
per the IRC deck ledger connection provisions in Table
R502.2.2.1 (ICC 2009b).
The results obtained in this study should generally apply
to decks with an aspect ratio of 1:1 and less, where as-
pect ratio is defined as the deck dimension perpendicu-
lar to the house divided by the dimension parallel to the
house. The study results should not be applied to decks
having an aspect ratio greater than 1:1 as the failure
modes and deck behavior may substantially change.
Additional research is needed to study other deck con-
structions and aspect ratios and to investigate other
methods to achieve lateral stiffness and load capacity,
and structural redundancy for new and existing decks.
References
American Wood Council (AWC). 2008. Special Design
Provisions for Wind and Seismic. ANSI/AF&PA SDPWS
-2008, Washington, D.C.
American Forest & Paper Association (AF&PA). 2005.
National Design Specification for Wood Construction.
ANSI/AF&PA NDS-2005, Washington, D.C.
American Forest & Paper Association. 2001. Wood
Frame Construction Manual for One- and Two-Family
Dwellings. ANSI/AF&PA WFCM-2001, Washington,
D.C.
Carradine, D.M., Bender, D.A., Woeste, F.E., and Lofer-
ski, J.R. 2007. Development of Design Capacities for
Residential Deck Ledger Connections. Forest Products
Journal 57(3), 39-45.
Carradine, D.M., D.A. Bender, J.R. Loferski and F.E.
Woeste. 2008. Lessons learned: residential deck ledger
connection testing and design. Structure magazine
(May):53-56. www.structuremag.org/Archives/2008-5/C-
LessonsLearned-DeckLedger_Carradine-May08.pdf
ICC. 2009a. International Building Code (IBC). http://
publicecodes.cyberregs.com/icod/ibc/2009/index.htm
ICC. 2009b. International Residential Code for One-and
-Two Family Dwellings (IRC). http://
publicecodes.cyberregs.com/icod/irc/2009/index.htm
Legacy Services. 2010. Outdoor deck and porch injury
study. http://www.buildingonline.com/news/pdfs/Outdoor
-Deck-and-Porch-Injury-Study.pdf
Lyman, G.H. and Bender, D.A. 2013. Wind load deter-
mination for exterior decks and porches. Wood Design
Focus. 23(2):3-8.

WOOD DESIGN FOCUS V. 23, N. 2 30
Lyman, G.H., Bender, D.A., and Dolan, J.D. 2013. Seis-
mic load determination for exterior decks and porches.
Wood Design Focus. 23(2):9-14.
Parsons, B.J. 2012. Understanding the lateral strength,
load path, and occupant loads of exterior decks. MS The-
sis, Department of Civil and Environmental Engineering,
Washington State University, Pullman, WA.
Parsons, B.J., Bender, D.A., Dolan, J.D., Tichy, R.J., and
Woeste, F.E. 2013. Lateral load path and capacity of
exterior decks. ASCE Practice Periodical on Structural
Design and Construction (in review).
Schutt, C.A. 2011. Improving deck safety. LBM Journal
(May/June): 26-28. http://mydigimag.rrd.com/publication/
frame.php?i=71105&p=28&pn=&ver=flex
Brian J. Parsons, former graduate student, Civil and
Environmental Engineering, Washington State University,
Pullman, WA.
Donald A. Bender, Ph.D., P.E., Director, Composite
Materials and Engineering Center, and
Weyerhaeuser Professor, Civil and Environmental
Engineering, Washington State University,
Pullman, WA, [email protected].
J. Daniel Dolan, Ph.D., P.E., Professor, Civil and
Environmental Engineering, Washington State
University, Pullman, WA, [email protected]
Robert J. Tichy, Ph.D., Research Engineer, Composite
Materials & Engineering Center, Washington State
University, Pullman, WA [email protected]
Frank E. Woeste, Ph.D., P.E., Professor Emeritus,
Virginia Tech, Blacksburg, VA [email protected]