SEISMIC HAZARD ZONE REPORT FOR THE PALMDALE...
65
SEISMIC HAZARD ZONE REPORT 105 SEISMIC HAZARD ZONE REPORT FOR THE PALMDALE 7.5-MINUTE QUADRANGLE, LOS ANGELES COUNTY, CALIFORNIA 2003 DEPARTMENT OF CONSERVATION California Geological Survey STATE OF CALIFORNIA GRAY DAVIS GOVERNOR THE RESOURCES AGENCY MARY D. NICHOLS SECRETARY FOR RESOURCES DEPARTMENT OF CONSERVATION DARRYL YOUNG DIRECTOR
Transcript of SEISMIC HAZARD ZONE REPORT FOR THE PALMDALE...

SEISMIC HAZARD ZONE REPORT 105
SEISMIC HAZARD ZONE REPORT FOR THE PALMDALE 7.5-MINUTE QUADRANGLE, LOS ANGELES COUNTY, CALIFORNIA
2003
DEPARTMENT OF CONSERVATION California Geological Survey
STATE OF CALIFORNIA
GRAY DAVIS GOVERNOR
THE RESOURCES AGENCY MARY D. NICHOLS
SECRETARY FOR RESOURCES
DEPARTMENT OF CONSERVATION DARRYL YOUNG
DIRECTOR

CALIFORNIA GEOLOGICAL SURVEY
MICHAEL S. REICHLE, ACTING STATE GEOLOGIST
Copyright © 2003 by the California Department of Conservation. All rights reserved. No part of this publication may be reproduced without written consent of the Department of Conservation.
“The Department of Conservation makes no warrantees as to the suitability of this product for any particular purpose.”

SEISMIC HAZARD ZONE REPORT 105
SEISMIC HAZARD ZONE REPORT FOR THE PALMDALE 7.5-MINUTE QUADRANGLE, LOS ANGELES COUNTY, CALIFORNIA
CALIFORNIA GEOLOGICAL SURVEY'S PUBLICATION SALES OFFICES:
Southern California Regional Office 888 South Figueroa Street, Suite 475 Los Angeles, CA 90017 (213) 239-0878
Publications and Information Office 801 K Street, MS 14-31 Sacramento, CA 95814-3531 (916) 445-5716
Bay Area Regional Office 345 Middlefield Road, MS 520 Menlo Park, CA 94025 (650) 688-6327

List of Revisions – Palmdale SHZR 105
5/31/05 BPS address correction, web link updates
10/10/05 Bay Area Regional Office and Southern California Regional Office addresses updated


CONTENTS
EXECUTIVE SUMMARY .......................................................................................................... vii
INTRODUCTION ...........................................................................................................................1
SECTION 1 LIQUEFACTION EVALUATION REPORT Liquefaction Zones in the Palmdale 7.5-Minute Quadrangle, Los Angeles County, California ..............................................3
PURPOSE....................................................................................................................................3
BACKGROUND .....................................................................................................................4
METHODS SUMMARY.........................................................................................................4
SCOPE AND LIMITATIONS.................................................................................................5
PART I .........................................................................................................................................5
PHYSIOGRAPHY...................................................................................................................5
GEOLOGY ..............................................................................................................................6
ENGINEERING GEOLOGY ..................................................................................................9
GROUND WATER .................................................................................................................9
PART II......................................................................................................................................10
LIQUEFACTION POTENTIAL ...........................................................................................10
LIQUEFACTION SUSCEPTIBILITY..................................................................................11
LIQUEFACTION OPPORTUNITY .....................................................................................12
LIQUEFACTION ZONES ....................................................................................................14
ACKNOWLEDGMENTS .........................................................................................................16
REFERENCES ..........................................................................................................................16
AIR PHOTOS ............................................................................................................................20
iii

SECTION 2 EARTHQUAKE-INDUCED LANDSLIDE EVALUATION REPORT Earthquake-Induced Landslide Zones in the Palmdale 7.5-Minute Quadrangle, Los Angeles County, California .......................................................................................................................................21
PURPOSE..................................................................................................................................21
BACKGROUND ...................................................................................................................22
METHODS SUMMARY.......................................................................................................22
SCOPE AND LIMITATIONS...............................................................................................23
PART I .......................................................................................................................................24
PHYSIOGRAPHY.................................................................................................................24
GEOLOGY ............................................................................................................................25
ENGINEERING GEOLOGY ................................................................................................30
PART II......................................................................................................................................32
EARTHQUAKE-INDUCED LANDSLIDE HAZARD POTENTIAL.................................32
EARTHQUAKE-INDUCED LANDSLIDE HAZARD ZONE ............................................35
ACKNOWLEDGMENTS .........................................................................................................36
REFERENCES ..........................................................................................................................36
AIR PHOTOS ............................................................................................................................38
APPENDIX A Source of Rock Strength Data...........................................................................39
SECTION 3 GROUND SHAKING EVALUATION REPORT Potential Ground Shaking in the Palmdale 7.5-Minute Quadrangle, Los Angeles County, California ......................................41
PURPOSE..................................................................................................................................41
EARTHQUAKE HAZARD MODEL .......................................................................................42
APPLICATIONS FOR LIQUEFACTION AND LANDSLIDE HAZARD ASSESSMENTS 46
USE AND LIMITATIONS........................................................................................................49
REFERENCES ..........................................................................................................................50
iv
ILLUSTRATIONS
Figure 2.1. Yield Acceleration vs. Newmark Displacement for the 1992 Landers Earthquake SCE Lucerne Record. .........................................................................................33
Figure 3.1. Palmdale 7.5-Minute Quadrangle and portions of adjacent quadrangles, 10 percent exceedance in 50 years peak ground acceleration (g)—Firm rock conditions. ........43
Figure 3.2. Palmdale 7.5-Minute Quadrangle and portions of adjacent quadrangles, 10 percent exceedance in 50 years peak ground acceleration (g)—Soft rock conditions. .........44
Figure 3.3. Palmdale 7.5-Minute Quadrangle and portions of adjacent quadrangles, 10 percent exceedance in 50 years peak ground acceleration (g)—Alluvium conditions. .........45
Figure 3.4. Palmdale 7.5-Minute Quadrangle and portions of adjacent quadrangles, 10 percent exceedance in 50 years peak ground acceleration—Predominant earthquake..........47
Figure 3.5. Palmdale 7.5-Minute Quadrangle and portions of adjacent quadrangles, 10 percent exceedance in 50 years magnitude-weighted pseudo-peak acceleration for alluvium - Liquefaction opportunity......................................................................................48
Table 1.1. Map Units Used in the Palmdale Quadrangle..........................................................7
Table 1.2. Quaternary Map Units Used in the Palmdale 7.5-Minute Quadrangle and Their Geotechnical Characteristics and Liquefaction Susceptibility. ............................................12
Table 2.1. Summary of the Shear Strength Statistics for the Palmdale Quadrangle...............31
Table 2.2. Summary of Shear Strength Groups for the Palmdale Quadrangle. ......................31
Table 2.3. Hazard Potential Matrix for Earthquake-Induced Landslides in the Palmdale Quadrangle.. ...........................................................................................................................35
Plate 1.1. Quaternary geologic map of the Palmdale 7.5-Minute Quadrangle, California.. ..52
Plate 1.2. Depth to historically shallowest ground water and locations of boreholes used In this study, Palmdale 7.5-Minute Quadrangle, California.. ................................................53
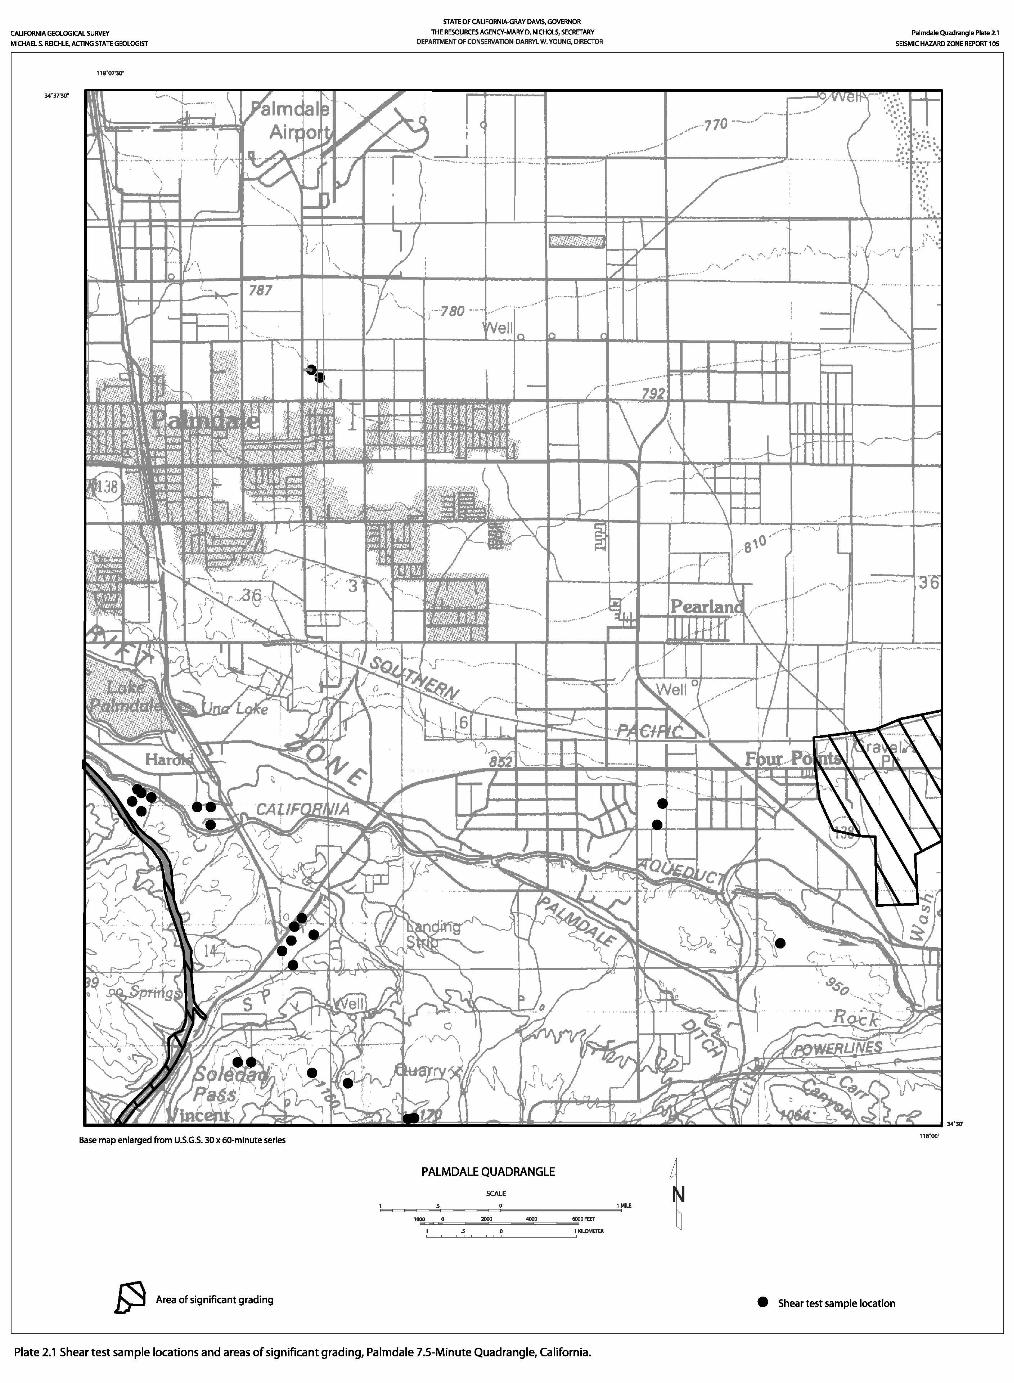
Plate 2.1. Shear test sample locations and areas of significant grading, Palmdale 7.5-Minute Quadrangle.. ........................................................................................................54
v


EXECUTIVE SUMMARY
This report summarizes the methods and sources of information used to prepare the Seismic Hazard Zone Map for the Palmdale 7.5-Minute Quadrangle, Los Angeles County, California. The map displays the boundaries of zones of required investigation for liquefaction and earthquake-induced landslides over an area of approximately 62 square miles at a scale of 1 inch = 2,000 feet.
The Palmdale Quadrangle lies in the Antelope Valley in northeastern Los Angeles County 37 miles north of the Los Angeles Civic Center. Typical high desert terrain of low local relief characterizes the northern two-thirds of the quadrangle. The San Andreas Fault Zone cuts across the mountainous southern part of the area as a series of trough-like valleys and linear ridges. At the western boundary is Lake Palmdale, a reservoir within the fault zone. Soledad Pass is in the southwestern corner. The City of Palmdale covers about two thirds of the quadrangle. Palmdale Airport and the surrounding land within the site of the proposed Palmdale International Airport covers the northern third of the quadrangle. The California Aqueduct crosses the entire quadrangle near the San Andreas Fault Zone. In recent decades, residential tract development and expansion of commercial and industrial facilities has characterized the rapid growth of the City of Palmdale. Access to the region is via State Highway 14 (Antelope Valley Freeway) and State Highway 138 and a grid of east-west avenues (lettered) and north-south streets (numbered).
The map is prepared by employing geographic information system (GIS) technology, which allows the manipulation of three-dimensional data. Information considered includes topography, surface and subsurface geology, borehole data, historical ground-water levels, existing landslide features, slope gradient, rock-strength measurements, geologic structure, and probabilistic earthquake shaking estimates. The shaking inputs are based upon probabilistic seismic hazard maps that depict peak ground acceleration, mode magnitude, and mode distance with a 10 percent probability of exceedance in 50 years.
In the Palmdale Quadrangle the liquefaction zone coincides with low-relief terrain along the San Andreas Rift Zone, including the Lake Palmdale depression, and areas associated with Little Rock Creek and Little Rock Wash. No landslides have been mapped in the Palmdale Quadrangle. The earthquake-induced landslide zone covers about two percent of the quadrangle It is restricted to areas of steep topography in the southern one-third of the quadrangle.
vii

How to view or obtain the map
Seismic Hazard Zone Maps, Seismic Hazard Zone Reports and additional information on seismic hazard zone mapping in California are available on the California Geological Survey's Internet page: http://www.conservation.ca.gov/CGS/index.htm
Paper copies of Official Seismic Hazard Zone Maps, released by CGS, which depict zones of required investigation for liquefaction and/or earthquake-induced landslides, are available for purchase from:
BPS Reprographic Services 945 Bryant Street San Francisco, California 94105 (415) 512-6550
Seismic Hazard Zone Reports (SHZR) summarize the development of the hazard zone map for each area and contain background documentation for use by site investigators and local government reviewers. These reports are available for reference at CGS offices in Sacramento, San Francisco, and Los Angeles. NOTE: The reports are not available through BPS Reprographic Services.

INTRODUCTION
The Seismic Hazards Mapping Act (the Act) of 1990 (Public Resources Code, Chapter 7.8, Division 2) directs the California Department of Conservation (DOC), Division of Mines and Geology (DMG) [now called California Geological Survey (CGS)] to delineate seismic hazard zones. The purpose of the Act is to reduce the threat to public health and safety and to minimize the loss of life and property by identifying and mitigating seismic hazards. Cities, counties, and state agencies are directed to use the seismic hazard zone maps in their land-use planning and permitting processes. They must withhold development permits for a site within a zone until the geologic and soil conditions of the project site are investigated and appropriate mitigation measures, if any, are incorporated into development plans. The Act also requires sellers (and their agents) of real property within a mapped hazard zone to disclose at the time of sale that the property lies within such a zone. Evaluation and mitigation of seismic hazards are to be conducted under guidelines adopted by the California State Mining and Geology Board (SMGB) (DOC, 1997). The text of this report is on the Internet at http://gmw.consrv.ca.gov/shmp/webdocs/sp117.pdf
The Act directs SMGB to appoint and consult with the Seismic Hazards Mapping Act Advisory Committee (SHMAAC) in developing criteria for the preparation of the seismic hazard zone maps. SHMAAC consists of geologists, seismologists, civil and structural engineers, representatives of city and county governments, the state insurance commissioner and the insurance industry. In 1991 SMGB adopted initial criteria for delineating seismic hazard zones to promote uniform and effective statewide implementation of the Act. These initial criteria provide detailed standards for mapping regional liquefaction hazards. The Act also directed CGS to develop a set of probabilistic seismic maps for California and to research methods that might be appropriate for mapping earthquake-induced landslide hazards.
In 1996, working groups established by SHMAAC reviewed the prototype maps and the techniques used to create them. The reviews resulted in recommendations that 1) the process for zoning liquefaction hazards remain unchanged and 2) earthquake-induced landslide zones be delineated using a modified Newmark analysis.
This Seismic Hazard Zone Report summarizes the development of the hazard zone map. The process of zoning for liquefaction uses a combination of Quaternary geologic mapping, historical ground-water information, and subsurface geotechnical data. The process for zoning earthquake-induced landslides incorporates earthquake loading, existing landslide features, slope gradient, rock strength, and geologic structure. Probabilistic seismic hazard maps, which are the underpinning for delineating seismic hazard zones, have been prepared for peak ground acceleration, mode magnitude, and mode distance with a 10 percent probability of exceedance in 50 years (Petersen and others, 1996) in accordance with the mapping criteria.
1

This report summarizes seismic hazard zone mapping for potentially liquefiable soils and earthquake-induced landslides in the Palmdale 7.5-Minute Quadrangle.

SECTION 1 LIQUEFACTION EVALUATION REPORT
Liquefaction Zones in the Palmdale 7.5-Minute Quadrangle,
Los Angeles County, California
By Cynthia L. Pridmore
California Department of Conservation
California Geological Survey
PURPOSE
The Seismic Hazards Mapping Act (the Act) of 1990 (Public Resources Code, Chapter 7.8, Division 2) directs the California Department of Conservation (DOC), Division of Mines and Geology (DMG) [now called California Geological Survey (CGS)] to delineate Seismic Hazard Zones. The purpose of the Act is to reduce the threat to public health and safety and to minimize the loss of life and property by identifying and mitigating seismic hazards. Cities, counties, and state agencies are directed to use seismic hazard zone maps developed by CGS in their land-use planning and permitting processes. The Act requires that site-specific geotechnical investigations be performed prior to permitting most urban development projects within seismic hazard zones. Evaluation and mitigation of seismic hazards are to be conducted under guidelines adopted by the California State Mining and Geology Board (SMGB) (DOC, 1997). The text of this report is on the Internet at http://gmw.consrv.ca.gov/shmp/webdocs/sp117.pdf
Following the release of DMG Special Publication 117 (DOC, 1997), agencies in the Los Angeles metropolitan region sought more definitive guidance in the review of geotechnical investigations addressing liquefaction hazards. The agencies made their request through the Geotechnical Engineering Group of the Los Angeles Section of the American Society of Civil Engineers (ASCE). This group convened an implementation committee under the auspices of the Southern California Earthquake Center (SCEC).
3

CALIFORNIA GEOLOGICAL SURVEY SHZR 105 4
The committee, which consisted of practicing geotechnical engineers and engineering geologists, released an overview of the practice of liquefaction analysis, evaluation, and mitigation techniques (SCEC, 1999). This text is also on the Internet at: http://www.scec.org/
This section of the evaluation report summarizes seismic hazard zone mapping for potentially liquefiable soils in the Palmdale 7.5-minute Quadrangle. Section 2 (addressing earthquake-induced landslides) and Section 3 (addressing potential ground shaking) complete the report, which is one of a series that summarizes production of similar seismic hazard zone maps within the state (Smith, 1996). Additional information on seismic hazards zone mapping in California is on CGS’s Internet web page: http://www.conservation.ca.gov/CGS/index.htm
BACKGROUND
Liquefaction-induced ground failure historically has been a major cause of earthquake damage in southern California. During the 1971 San Fernando and 1994 Northridge earthquakes, significant damage to roads, utility pipelines, buildings, and other structures in the Los Angeles area was caused by liquefaction-induced ground displacement.
Localities most susceptible to liquefaction-induced damage are underlain by loose, water-saturated, granular sediment within 50 feet of the ground surface. These geological and ground-water conditions exist in parts of southern California, most notably in some densely populated valley regions and alluviated floodplains. In addition, the potential for strong earthquake ground shaking is high because of the many nearby active faults. The combination of these factors constitutes a significant seismic hazard in the southern California region in general, including areas in the Palmdale Quadrangle.
METHODS SUMMARY
Characterization of liquefaction hazard presented in this report requires preparation of maps that delineate areas underlain by potentially liquefiable sediment. The following were collected or generated for this evaluation:
• Existing geologic maps were used to provide an accurate representation of the spatial distribution of Quaternary deposits in the study area. Geologic units that generally are susceptible to liquefaction include late Quaternary alluvial and fluvial sedimentary deposits and artificial fill.
• Ground-water maps constructed to show the historically highest known ground-water levels
• Geotechnical data analyzed to evaluate liquefaction potential of deposits
• Information on potential ground shaking intensity based on CGS probabilistic shaking maps

2003 SEISMIC HAZARD ZONE REPORT FOR THE PALMDALE QUADRANGLE 5
The data collected for this evaluation were processed into a series of geographic information system (GIS) layers using commercially available software. The liquefaction zone map was derived from a synthesis of these data and according to criteria adopted by the SMGB (DOC, 2000).
SCOPE AND LIMITATIONS
Evaluation for potentially liquefiable soils generally is confined to areas covered by Quaternary (less than about 1.6 million years) sedimentary deposits. Such areas within the Palmdale Quadrangle consist mainly of alluviated valleys, floodplains, and canyons. CGS’s liquefaction hazard evaluations are based on information on earthquake ground shaking, surface and subsurface lithology, geotechnical soil properties, and ground-water depth, which is gathered from various sources. Although selection of data used in this evaluation was rigorous, the quality of the data used varies. The State of California and the Department of Conservation make no representations or warranties regarding the accuracy of the data obtained from outside sources.
Liquefaction zone maps are intended to prompt more detailed, site-specific geotechnical investigations, as required by the Act. As such, liquefaction zone maps identify areas where the potential for liquefaction is relatively high. They do not predict the amount or direction of liquefaction-related ground displacements, or the amount of damage to facilities that may result from liquefaction. Factors that control liquefaction-induced ground failure are the extent, depth, density, and thickness of liquefiable materials, depth to ground water, rate of drainage, slope gradient, proximity to free faces, and intensity and duration of ground shaking. These factors must be evaluated on a site-specific basis to assess the potential for ground failure at any given project site.
Information developed in the study is presented in two parts: physiographic, geologic, and hydrologic conditions in PART I, and liquefaction and zoning evaluations in PART II.
PART I
PHYSIOGRAPHY
Study Area Location and Physiography
The Palmdale 7.5-Minute Quadrangle covers approximately 62 square miles in the Antelope Valley in northeastern Los Angeles County. The center of the area is 37 miles north of the Los Angeles Civic Center. Typical high desert terrain of low local relief characterizes the northern two-thirds of the quadrangle. The northwest-trending San Andreas Rift Zone cuts across the mountainous southern part of the area. It is manifested as a series of trough-like valleys and linear ridges. At the western boundary of the quadrangle is Lake Palmdale, a reservoir created by increasing the capacity of a closed

CALIFORNIA GEOLOGICAL SURVEY SHZR 105 6
depression within the rift zone through construction of a dam. Soledad Pass is in the southwestern corner of the area. In the southeastern corner Little Rock Wash forms an “S-curve” where it crosses the San Andreas Fault Zone. The highest point in the quadrangle is just east of Soledad Pass at 4,183 feet. The lowest point, below 2,510 feet, is at the center of the northern boundary.
The City of Palmdale covers about two thirds of the quadrangle. Palmdale Airport (Air Force Plant 42) and the surrounding land within the site of the proposed Palmdale International Airport covers the northern third of the quadrangle. Land in Soledad Pass and south of the California Aqueduct, which crosses the entire quadrangle near the San Andreas Rift Zone, is mostly unincorporated Los Angeles County land. In the past two decades residential tract development and expansion of commercial and industrial facilities have characterized the rapid growth of the city of Palmdale. Access to the region is via State Highway 14 (Antelope Valley Freeway), State Highway 138 (Palmdale Boulevard, Fort Tejon Road, and Pearblossom Highway) and a grid of east-west avenues (lettered) and north-south streets (numbered). Railroad tracks cross the entire quadrangle from south to north and nearly the entire area from east to west.
GEOLOGY
Bedrock and Surficial Geology
Geologic units that are generally susceptible to liquefaction include late Quaternary alluvial and fluvial sedimentary deposits and artificial fill. To evaluate the geology of the Palmdale Quadrangle a single, 1:24,000-scale geologic map was compiled. Detailed geologic strip maps of the San Andreas Fault Zone (Barrows and others, 1985) were spliced with maps from Ponti and Burke (1980) and Ponti and others (1981) to provide the Quaternary geology for the northern portion of the Palmdale Quadrangle. These geologic maps were provided in digital form by the Southern California Areal Mapping Project [SCAMP]. In addition, part of a geologic map by Dibblee (2001) was digitized by CGS to fill in the southern portion of the Palmdale Quadrangle.
Plate 1.1 shows the generalized Quaternary geology of the Palmdale Quadrangle using, for reasons of scale, the more generalized maps of Dibblee (2001), Ponti and Burke (1980), and Ponti and others (1981). Note that in preparing Plate 1.1 CGS made no attempt to resolve differences among the maps. CGS staff addressed differences only during construction of the liquefaction zone map using techniques and tools such as topography, areal photography, satellite imagery, and limited fieldwork.
The distribution of Quaternary deposits on the 1:24,000-scale map was used in combination with other data, to evaluate liquefaction susceptibility and develop the Seismic Hazard Zone Map. As shown on Plate 1.1, Quaternary alluvial deposits cover more than 80 percent of the quadrangle. These Pleistocene through Holocene surficial deposits are summarized in Table 1.1 and discussed below. The remainder of the quadrangle consists of pre-Quaternary sedimentary, granitic, and metamorphic rocks.
2003 SEISMIC HAZARD ZONE REPORT FOR THE PALMDALE QUADRANGLE 7
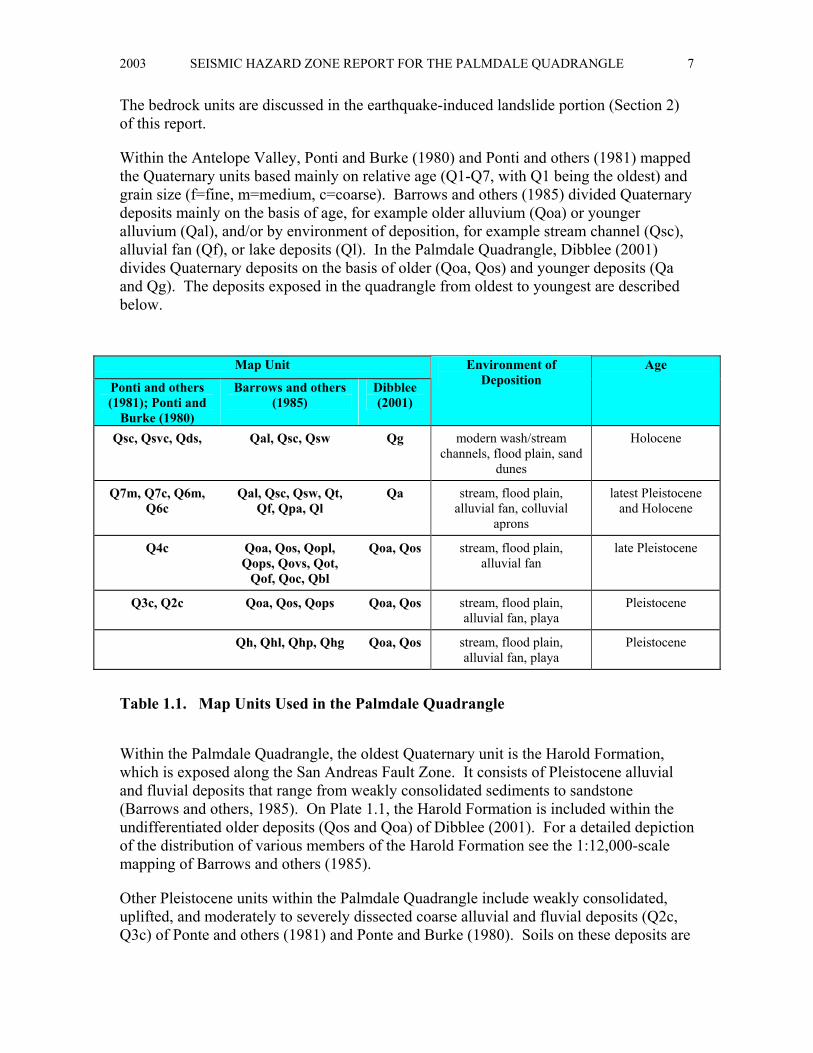
The bedrock units are discussed in the earthquake-induced landslide portion (Section 2) of this report.
Within the Antelope Valley, Ponti and Burke (1980) and Ponti and others (1981) mapped the Quaternary units based mainly on relative age (Q1-Q7, with Q1 being the oldest) and grain size (f=fine, m=medium, c=coarse). Barrows and others (1985) divided Quaternary deposits mainly on the basis of age, for example older alluvium (Qoa) or younger alluvium (Qal), and/or by environment of deposition, for example stream channel (Qsc), alluvial fan (Qf), or lake deposits (Ql). In the Palmdale Quadrangle, Dibblee (2001) divides Quaternary deposits on the basis of older (Qoa, Qos) and younger deposits (Qa and Qg). The deposits exposed in the quadrangle from oldest to youngest are described below.
Map Unit
Ponti and others (1981); Ponti and
Burke (1980)
Barrows and others (1985)
Dibblee (2001)
Environment of Deposition
Age
Qsc, Qsvc, Qds, Qal, Qsc, Qsw Qg modern wash/stream channels, flood plain, sand
dunes
Holocene
Q7m, Q7c, Q6m, Q6c
Qal, Qsc, Qsw, Qt, Qf, Qpa, Ql
Qa stream, flood plain, alluvial fan, colluvial
aprons
latest Pleistocene and Holocene
Q4c Qoa, Qos, Qopl, Qops, Qovs, Qot,
Qof, Qoc, Qbl
Qoa, Qos stream, flood plain, alluvial fan
late Pleistocene
Q3c, Q2c Qoa, Qos, Qops Qoa, Qos stream, flood plain, alluvial fan, playa
Pleistocene
Qh, Qhl, Qhp, Qhg Qoa, Qos stream, flood plain, alluvial fan, playa
Pleistocene
Table 1.1. Map Units Used in the Palmdale Quadrangle
Within the Palmdale Quadrangle, the oldest Quaternary unit is the Harold Formation, which is exposed along the San Andreas Fault Zone. It consists of Pleistocene alluvial and fluvial deposits that range from weakly consolidated sediments to sandstone (Barrows and others, 1985). On Plate 1.1, the Harold Formation is included within the undifferentiated older deposits (Qos and Qoa) of Dibblee (2001). For a detailed depiction of the distribution of various members of the Harold Formation see the 1:12,000-scale mapping of Barrows and others (1985).
Other Pleistocene units within the Palmdale Quadrangle include weakly consolidated, uplifted, and moderately to severely dissected coarse alluvial and fluvial deposits (Q2c, Q3c) of Ponte and others (1981) and Ponte and Burke (1980). Soils on these deposits are

CALIFORNIA GEOLOGICAL SURVEY SHZR 105 8
reddish brown and are moderately to well developed with well-formed horizons and clay accumulations. As shown on Plate 1.1 these units are exposed in the west-central part of the quadrangle and are also included within the undifferentiated older deposits (Qos and Qoa) of Dibblee (2001).
Late Pleistocene alluvial and fluvial deposits (Q4c) occur in the central and northwestern portion of the Palmdale Quadrangle. These deposits also correspond in part to deposits mapped as older alluvium (Qoa, Qos) by Dibblee (2001) and a variety of units mapped by Barrows and others (1985) south of the San Andreas Fault in the southern portion of the quadrangle. Ponti and others (1981) describe Q4c as unconsolidated, uplifted, and slightly dissected coarse-grained deposits that have moderately developed soils and clay accumulation.
Latest Pleistocene to Holocene alluvial fan, stream, flood plain, and colluvial deposits (Q7m, Q7c, Q6m, Q6c; Ponti and others, 1981; Ponti and Burke, 1980) are exposed throughout the northern half of the quadrangle, and to a lesser extent in the southern portion (Qa; Dibblee, 2001). They consist of predominantly unconsolidated, sandy and silty sediments with weakly developed soils.
The youngest map units in the quadrangle consist of modern wash/stream channel and dune deposits (Qsc, Qsvc, Qds). Wash deposits consist of unconsolidated, coarse to very coarse-grained materials that occupy the modern stream channels. These units are equivalent to Qal and Qsc of Barrows and others (1985) and to Qg of Dibblee (2001). Within the Palmdale Quadrangle dune sand consists of medium to fine-grained sand and occurs near Little Rock Wash in the northeastern portion of the quadrangle.
Structural Geology
The dominant structural feature within the Palmdale Quadrangle is the San Andreas Fault Zone. It diagonally crosses the quadrangle and separates geologic terranes with dissimilar rock assemblages. Topographically, the San Andreas Fault lies within the San Andreas Rift Zone, which is defined by linear ridges, troughs, and deflected and offset drainage courses. These features have resulted from numerous surface-faulting earthquakes in late Quaternary time. This segment includes traces that ruptured during the great 1857 Fort Tejon earthquake. Active faults within and adjacent to the rift zone have been included in the Official Earthquake Fault Zone prepared by CGS (DOC, 1974). The San Andreas Fault is considered to be a major potential seismic source (Petersen and others, 1996; also see section 3 of this report).
Within the Palmdale Quadrangle, the San Andreas Fault Zone includes other regional faults tectonically associated with the main trace of the San Andreas Fault. These include the Little Rock Fault and the Cemetery Fault to the north of the main trace, and the Nadeau Fault to the south.

2003 SEISMIC HAZARD ZONE REPORT FOR THE PALMDALE QUADRANGLE 9
ENGINEERING GEOLOGY
As stated above, soils that are generally susceptible to liquefaction are mainly late Quaternary alluvial and fluvial sedimentary deposits and artificial fill. Deposits that contain saturated, loose sandy and silty soils are most susceptible to liquefaction. Lithologic descriptions and soil tests reported in geotechnical borehole logs provide valuable information regarding subsurface geology, ground-water levels, and the engineering characteristics of sedimentary deposits. For this investigation, about 200 logs were collected from the files of Earth Systems, Leighton and Associates, Los Angeles County Public Works Department, City of Palmdale, California Department of Water Resources, and California Department of Transportation. Lithologic and engineering data from 84 logs were entered into the CGS geotechnical GIS database. The characteristics of the Quaternary map units are generalized in Table 1.2 (see Part II -Liquefaction Susceptibility).
Of particular value in liquefaction evaluation are logs that report the results of Standard Penetration Tests (SPTs). SPT's provide a uniform measure of the penetration resistance of geologic deposits and are commonly used as an index of soil density. This in-field test is formally defined and specified by the American Society for Testing and Materials in test method D1586 (ASTM, 1999). Non-SPT geotechnical sampling results are converted to SPT-equivalent values. The actual and converted SPT values are normalized to a common-reference [effective-overburden pressure of one atmosphere (approximately one ton per square foot) and a hammer efficiency of 60 percent using a method described by Seed and Idriss (1982) and Seed and others (1985)].
In addition to the SPTs, the results of other engineering tests (dry density, moisture content, sieve analysis, etc.) are used in the Seed-Idriss Simplified Procedure (Seed and Idriss, 1971) to evaluate liquefaction potential of a site (see Part II - Quantitative Liquefaction Analysis). All engineering characteristics, as well as the results of the liquefaction analysis, are posted onto GIS generated cross sections and aid in the overall three dimensional evaluation of the Quaternary deposits.
Examination of the obtained borehole logs and Quaternary geology maps indicate that much of area north of the San Andreas Fault is covered by sedimentary deposits composed of young, loose to moderately dense, sandy and silty sediments. South of the fault, less extensive deposits of young, loose sediments are found in isolated areas and within major stream drainages.
GROUND WATER
An essential element in evaluating liquefaction susceptibility is the determination of the depths at which soils are saturated by ground water. Saturated conditions reduce the normal effective stress acting on loose, near-surface sandy deposits, thereby increasing the likelihood of liquefaction (Youd, 1973). For zoning purposes, "near surface deposits" include those sediment layers between 0 and 40 feet deep, the interval being derived from item 4a of the SMGB criteria for delineating seismic hazard zones in California (DOC,

CALIFORNIA GEOLOGICAL SURVEY SHZR 105 10
2000; see Criteria for Zoning section of this report). Liquefaction evaluations, therefore, concentrate on areas where investigations indicate that young Quaternary sediments be saturated within 40 feet of the ground surface. Unfortunately, unpredictable and dramatic fluctuations in ground water caused by natural processes and human activities make it impossible to anticipate water levels that might exist at the time of future earthquakes. For that reason, CGS uses historically high ground-water levels for evaluating and zoning liquefaction potential. This approach assumes that even in areas where current levels are deep, ground water could return to historically high levels in the future. This has occurred in basins where heavy pumping has ceased and in areas where large-scale ground-water recharge programs have been employed.
Plate 1.2 depicts the depths to historically shallowest ground water in areas covered by Quaternary deposits within the Palmdale Quadrangle. This includes part of the Antelope Valley, San Andreas Rift Zone, and stream canyons in the foothills of the San Gabriel Mountains. Throughout much of the quadrangle, ground-water levels have been documented at depths of greater than 40 feet. Exceptions are: (1) alluviated areas within the San Andreas Rift Zone where subsurface flow is restricted by ground-water barriers; (2) the active Little Rock Wash that extends out onto the Antelope Valley floor from the San Gabriel Mountains; and (3) restricted stream canyons environments where saturation is assumed to occur during wet seasons.
Sources of ground-water data used in this report include: Johnson (1911); Thompson (1929); and California Department of Water Resources (1966, 2003). These water-well records were reviewed and compared to published regional water-elevation maps for the following years: 1958-1965 (Bloyd, 1967); 1979 (Duell, 1987); and 1996 (Carlson and others, 1998). Additionally, the shallow ground-water map prepared for Los Angeles County (Leighton, 1990, plate 3) was also taken into consideration. Staff also used the following publications to evaluate ground-water conditions in the Palmdale Quadrangle and surrounding areas: Michael Brandman Associates (1992); Durbin (1978); Templin and others (1995); Carlson and Phillips (1998); Galloway and others (1998); and Sneed and Galloway (2000). Digital orthophoto quadrangle quarters (DOQQ) for the Palmdale Quadrangle were used to define the limits of modern flooding of Little Rock Wash.
PART II
LIQUEFACTION POTENTIAL
Liquefaction may occur in water-saturated sediment during moderate to great earthquakes. Liquefied sediment loses strength and may fail, causing damage to buildings, bridges, and other structures. Many methods for mapping liquefaction hazard have been proposed. Youd (1991) highlights the principal developments and notes some of the widely used criteria. Youd and Perkins (1978) demonstrate the use of geologic criteria as a qualitative characterization of liquefaction susceptibility and introduce the mapping technique of combining a liquefaction susceptibility map and a liquefaction opportunity map to produce a liquefaction potential map. Liquefaction susceptibility is a
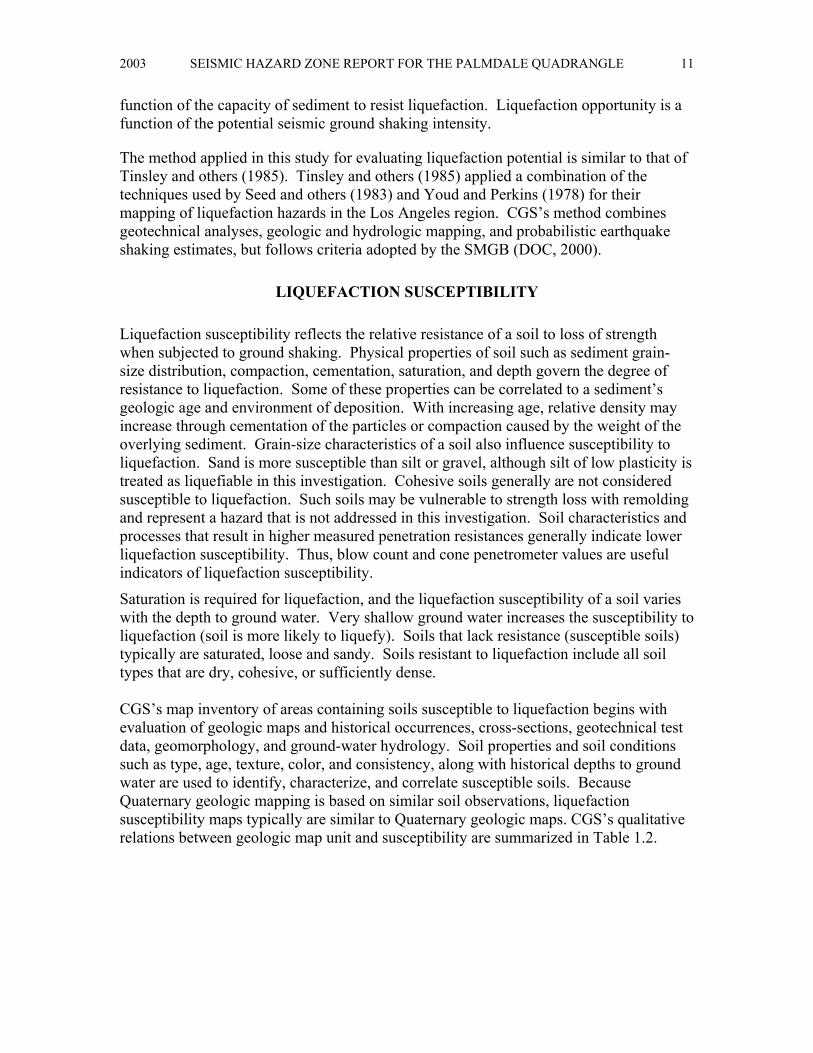
2003 SEISMIC HAZARD ZONE REPORT FOR THE PALMDALE QUADRANGLE 11
function of the capacity of sediment to resist liquefaction. Liquefaction opportunity is a function of the potential seismic ground shaking intensity.
The method applied in this study for evaluating liquefaction potential is similar to that of Tinsley and others (1985). Tinsley and others (1985) applied a combination of the techniques used by Seed and others (1983) and Youd and Perkins (1978) for their mapping of liquefaction hazards in the Los Angeles region. CGS’s method combines geotechnical analyses, geologic and hydrologic mapping, and probabilistic earthquake shaking estimates, but follows criteria adopted by the SMGB (DOC, 2000).
LIQUEFACTION SUSCEPTIBILITY
Liquefaction susceptibility reflects the relative resistance of a soil to loss of strength when subjected to ground shaking. Physical properties of soil such as sediment grain-size distribution, compaction, cementation, saturation, and depth govern the degree of resistance to liquefaction. Some of these properties can be correlated to a sediment’s geologic age and environment of deposition. With increasing age, relative density may increase through cementation of the particles or compaction caused by the weight of the overlying sediment. Grain-size characteristics of a soil also influence susceptibility to liquefaction. Sand is more susceptible than silt or gravel, although silt of low plasticity is treated as liquefiable in this investigation. Cohesive soils generally are not considered susceptible to liquefaction. Such soils may be vulnerable to strength loss with remolding and represent a hazard that is not addressed in this investigation. Soil characteristics and processes that result in higher measured penetration resistances generally indicate lower liquefaction susceptibility. Thus, blow count and cone penetrometer values are useful indicators of liquefaction susceptibility.
Saturation is required for liquefaction, and the liquefaction susceptibility of a soil varies with the depth to ground water. Very shallow ground water increases the susceptibility to liquefaction (soil is more likely to liquefy). Soils that lack resistance (susceptible soils) typically are saturated, loose and sandy. Soils resistant to liquefaction include all soil types that are dry, cohesive, or sufficiently dense. CGS’s map inventory of areas containing soils susceptible to liquefaction begins with evaluation of geologic maps and historical occurrences, cross-sections, geotechnical test data, geomorphology, and ground-water hydrology. Soil properties and soil conditions such as type, age, texture, color, and consistency, along with historical depths to ground water are used to identify, characterize, and correlate susceptible soils. Because Quaternary geologic mapping is based on similar soil observations, liquefaction susceptibility maps typically are similar to Quaternary geologic maps. CGS’s qualitative relations between geologic map unit and susceptibility are summarized in Table 1.2.
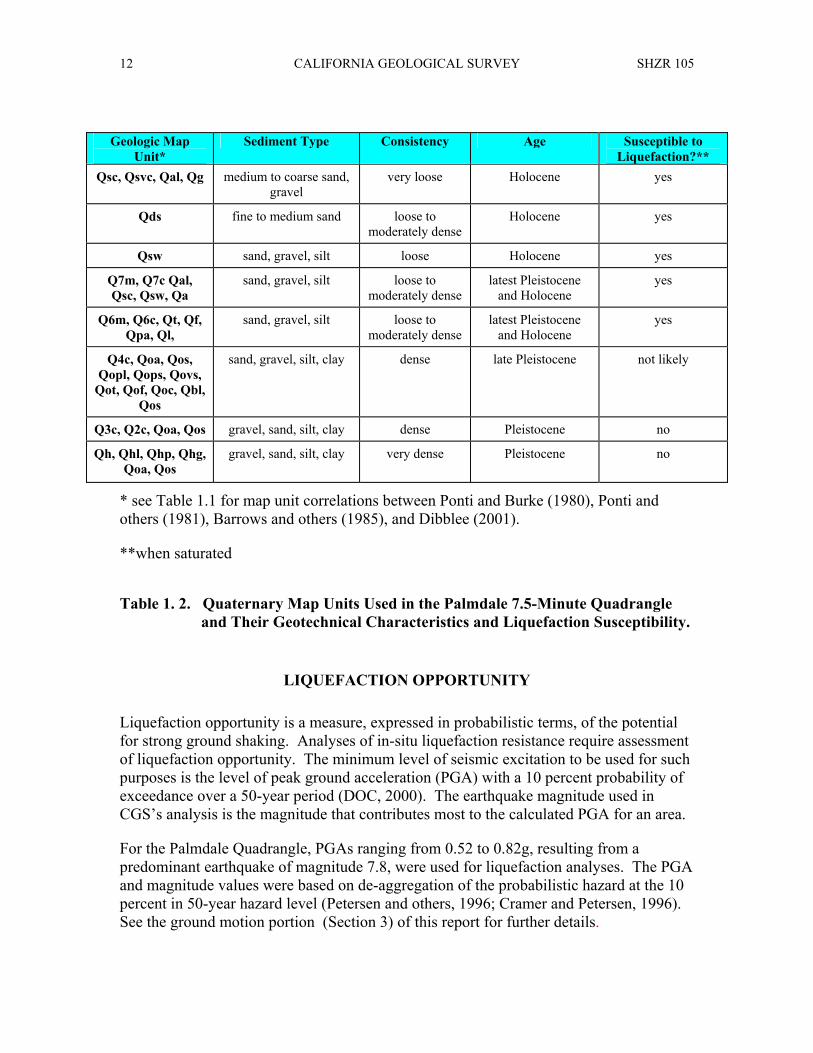
CALIFORNIA GEOLOGICAL SURVEY SHZR 105 12
Geologic Map Unit*
Sediment Type Consistency Age Susceptible to Liquefaction?**
Qsc, Qsvc, Qal, Qg medium to coarse sand, gravel
very loose Holocene yes
Qds fine to medium sand loose to moderately dense
Holocene yes
Qsw sand, gravel, silt loose Holocene yes
Q7m, Q7c Qal, Qsc, Qsw, Qa
sand, gravel, silt loose to moderately dense
latest Pleistocene and Holocene
yes
Q6m, Q6c, Qt, Qf, Qpa, Ql,
sand, gravel, silt loose to moderately dense
latest Pleistocene and Holocene
yes
Q4c, Qoa, Qos, Qopl, Qops, Qovs,
Qot, Qof, Qoc, Qbl, Qos
sand, gravel, silt, clay dense late Pleistocene not likely
Q3c, Q2c, Qoa, Qos gravel, sand, silt, clay dense Pleistocene no
Qh, Qhl, Qhp, Qhg, Qoa, Qos
gravel, sand, silt, clay very dense Pleistocene no
* see Table 1.1 for map unit correlations between Ponti and Burke (1980), Ponti and others (1981), Barrows and others (1985), and Dibblee (2001).
**when saturated
Table 1. 2. Quaternary Map Units Used in the Palmdale 7.5-Minute Quadrangle and Their Geotechnical Characteristics and Liquefaction Susceptibility.
LIQUEFACTION OPPORTUNITY
Liquefaction opportunity is a measure, expressed in probabilistic terms, of the potential for strong ground shaking. Analyses of in-situ liquefaction resistance require assessment of liquefaction opportunity. The minimum level of seismic excitation to be used for such purposes is the level of peak ground acceleration (PGA) with a 10 percent probability of exceedance over a 50-year period (DOC, 2000). The earthquake magnitude used in CGS’s analysis is the magnitude that contributes most to the calculated PGA for an area.
For the Palmdale Quadrangle, PGAs ranging from 0.52 to 0.82g, resulting from a predominant earthquake of magnitude 7.8, were used for liquefaction analyses. The PGA and magnitude values were based on de-aggregation of the probabilistic hazard at the 10 percent in 50-year hazard level (Petersen and others, 1996; Cramer and Petersen, 1996). See the ground motion portion (Section 3) of this report for further details.

2003 SEISMIC HAZARD ZONE REPORT FOR THE PALMDALE QUADRANGLE 13
Quantitative Liquefaction Analysis
CGS performs quantitative analysis of geotechnical data to evaluate liquefaction potential using the Seed-Idriss Simplified Procedure (Seed and Idriss, 1971; Seed and others, 1983; National Research Council, 1985; Seed and others, 1985; Seed and Harder, 1990; Youd and Idriss, 1997; Youd and others, 2001). Using the Seed-Idriss Simplified Procedure one can calculate soil resistance to liquefaction, expressed in terms of cyclic resistance ratio (CRR), based on SPT results, ground-water level, soil density, moisture content, soil type, and sample depth. CRR values are then compared to calculated earthquake-generated shear stresses expressed in terms of cyclic stress ratio (CSR). The Seed-Idriss Simplified Procedure requires normalizing earthquake loading relative to a M7.5 event for the liquefaction analysis. To accomplish this, CGS’s analysis uses the Idriss magnitude-scaling factor (MSF) (Youd and Idriss, 1997). It is convenient to think in terms of a factor of safety (FS) relative to liquefaction, where: FS = (CRR / CSR) * MSF. FS, therefore, is a quantitative measure of liquefaction potential. CGS uses a factor of safety of 1.0 or less, where CSR equals or exceeds CRR, to indicate the presence of potentially liquefiable soil. While an FS of 1.0 is considered the “trigger” for liquefaction, for a site specific analysis an FS of as much as 1.5 may be appropriate depending on the vulnerability of the site and related structures.
The CGS liquefaction analysis program calculates an FS for each geotechnical sample where blow counts were collected. Typically, multiple samples are collected for each borehole. The program then independently calculates an FS for each non-clay layer that includes at least one penetration test using the minimum (N1)60 value for that layer. The minimum FS value of the layers penetrated by the borehole is used to determine the liquefaction potential for each borehole location. The reliability of FS values varies according to the quality of the geotechnical data. FS, as well as other considerations such as slope, presence of free faces, and thickness and depth of potentially liquefiable soil, are evaluated in order to construct liquefaction potential maps, which are then used to make a map showing zones of required investigation.
Of the 84 geotechnical borehole logs reviewed in this study (Plate 1.2), 61 include blow-count data from SPTs or from penetration tests that allow reasonable blow count translations to SPT-equivalent values. Non-SPT values, such as those resulting from the use of 2-inch or 2½-inch inside-diameter ring samplers, were translated to SPT-equivalent values if reasonable factors could be used in conversion calculations. The reliability of the SPT-equivalent values varies. Therefore, they are weighted and used in a more qualitative manner. Few borehole logs, however, include all of the information (e.g. soil density, moisture content, sieve analysis, etc.) required for an ideal Seed-Idriss Simplified Procedure. For boreholes having acceptable penetration tests, liquefaction analysis is performed using recorded density, moisture, and sieve test values or using averaged test values of similar materials.
The Seed-Idriss Simplified Procedure for liquefaction evaluation was developed primarily for clean sand and silty sand. As described above, results depend greatly on accurate evaluation of in-situ soil density as measured by the number of soil penetration blow counts using an SPT sampler. However, many of the Holocene alluvial deposits in

CALIFORNIA GEOLOGICAL SURVEY SHZR 105 14
the study area contain a significant amount of gravel. In the past, gravelly soils were considered not to be susceptible to liquefaction because the high permeability of these soils presumably would allow the dissipation of pore pressures before liquefaction could occur. However, liquefaction in gravelly soils has been observed during earthquakes, and recent laboratory studies have shown that gravelly soils are susceptible to liquefaction (Ishihara, 1985; Harder and Seed, 1986; Budiman and Mohammadi, 1995; Evans and Zhou, 1995; and Sy and others, 1995). SPT-derived density measurements in gravelly soils are unreliable and generally too high. They are likely to lead to overestimation of the density of the soil and, therefore, result in an underestimation of the liquefaction susceptibility. To identify potentially liquefiable units where the N values appear to have been affected by gravel content, correlations were made with boreholes in the same unit where the N values do not appear to have been affected by gravel content.
LIQUEFACTION ZONES
Criteria for Zoning
Areas underlain by materials susceptible to liquefaction during an earthquake were included in liquefaction zones using criteria developed by the Seismic Hazards Mapping Act Advisory Committee and adopted by the SMGB (DOC, 2000). Under those guideline criteria, liquefaction zones are areas meeting one or more of the following:
1. Areas known to have experienced liquefaction during historical earthquakes 2. All areas of uncompacted artificial fill containing liquefaction-susceptible material
that are saturated, nearly saturated, or may be expected to become saturated 3. Areas where sufficient existing geotechnical data and analyses indicate that the soils
are potentially liquefiable 4. Areas where existing geotechnical data are insufficient
In areas of limited or no geotechnical data, susceptibility zones may be identified by geologic criteria as follows:
a) Areas containing soil deposits of late Holocene age (current river channels and their historic floodplains, marshes and estuaries), where the M7.5-weighted peak acceleration that has a 10 percent probability of being exceeded in 50 years is greater than or equal to 0.10 g and the water table is less than 40 feet below the ground surface; or
b) Areas containing soil deposits of Holocene age (less than 11,000 years), where the M7.5-weighted peak acceleration that has a 10 percent probability of being exceeded in 50 years is greater than or equal to 0.20 g and the historical high water table is less than or equal to 30 feet below the ground surface; or
c) Areas containing soil deposits of latest Pleistocene age (11,000 to 15,000 years), where the M7.5-weighted peak acceleration that has a 10 percent probability of being exceeded in 50 years is greater than or equal to 0.30 g and the historical high water table is less than or equal to 20 feet below the ground surface.
2003 SEISMIC HAZARD ZONE REPORT FOR THE PALMDALE QUADRANGLE 15
Application of SMGB criteria to liquefaction zoning in the Palmdale Quadrangle is summarized below.
Areas of Past Liquefaction
In the Palmdale Quadrangle, no areas of documented historical liquefaction are known. Areas showing evidence of paleoseismic liquefaction have not been reported.
Artificial Fills
In the Palmdale Quadrangle, areas of artificial fill large enough to show at the scale of geological mapping used in this investigation (see Barrows and others, 1985) consist of engineered fill for the California Aqueduct and areas of elevated highway. Fill used for the aqueduct and highways is considered to be properly engineered. Therefore, zoning for liquefaction in such areas depends on soil conditions in underlying strata. Non-engineered fills are commonly loose and uncompacted, and the material varies in size and type.
Areas with Sufficient Existing Geotechnical Data
Geologic mapping, geotechnical borehole data, water-well data, and liquefaction analysis using the Seed-Idriss Simplified Procedure were used to evaluate liquefaction potential in the Palmdale Quadrangle. Borehole logs encountered sediments from the following map units: Qsc, Qal, Qg, Qsc, Qa, Q6m, Q6c, Qpa, Q4c, Qoa, Qos, and Qops. Among these, Qsc, Qal, Qg, Qsc, Qa, Q6m, Q6c, and Qpa contain sediment layers that may liquefy under expected earthquake loading if saturated. Where these map units occur within the historically high ground-water limits (Plate 1.2), they are included in the zone. Within the Palmdale Quadrangle, Leighton and Associates (1990, Plate 4) previously identified the area of and nearby Lake Palmdale and Una Lake as liquefiable. These two lakes have been included within the zone; however a portion of this previously identified liquifiable area is not included in the zone based on geotechnical and surface data.
Areas with Insufficient Existing Geotechnical Data
Some areas associated with Little Rock Wash that are lacking in sufficient geotechnical data were included within the zone. Subsurface characteristics from similar deposits from adjacent quadrangles were taken into consideration. In the Draft Environmental Impact Report for the City of Palmdale (Michael Brandman Associates, 1992) Little Rock Wash is identified as an area susceptible to liquefaction.
Similarly, the young Quaternary alluvium contained in some valley and canyon areas is identified as potentially liquefiable through application of SMGB Seismic Hazard Zoning Criteria Item 4. Where the materials associated with these deposits occur within the historically highest groundwater occurrence they are included within the zone.

CALIFORNIA GEOLOGICAL SURVEY SHZR 105 16
ACKNOWLEDGMENTS
The author thanks the following people and agencies for their generous assistance: Beth Winnet at Leighton and Associates; Steve Phillips at the U.S. Geological Survey; Dan Schneidereit, Bruce Hick and their staff at Earth Systems; Charles T. Nestle at Los Angeles County Department of Public Works; Ted Bruce, Gary Gilbreath, Robert Pierotti, and Timothy Ross at California Department of Water Resources; and the California Department of Transportation. Additionally, the author acknowledges CGS staff members Florante Perez, Harold Feinberg, Terilee McGuire, Lee Wallinder and Bob Moscovitz for providing many levels of GIS and photogrammetric support; Barbara Wanish for preparing the final liquefaction hazard zone maps and graphic displays; Al Barrows for text contributions and editorial support and student assistants Osama Altashi, Ben Wright, Ian Penny, and Andrea Ignacio for data entry and digitizing support.
REFERENCES
American Society for Testing and Materials, 1999, Standard test method for penetration test and split-barrel sampling of soils, Test Method D1586-99, in Annual Book of ASTM Standards, v. 4.08.
Barrows, A.G., Kahle, J.E. and Beeby, D.J., 1985, Earthquake hazards and tectonic history of the San Andreas Fault Zone, Los Angeles County, California: California Division of Mines and Geology Open-File Report 85-10 LA, 236 p., 21 plates, map scale 1:12,000.
Bloyd, R.M., 1967, Water resources of the Antelope Valley-East Kern Water Agency area, California: U.S. Geological Survey Open-File Report, 73p.
Budiman, J.S. and Mohammadi, Jamshid, 1995, Effect of large inclusions on liquefaction of sands, in Evans, M.D. and Fragaszy, R.J., editors, Static and Dynamic properties of Gravelly Soils: American Society of Civil Engineers Geotechnical Special Publication no. 56, p. 48-63.
California Department of Conservation, Division of Mines and Geology, 1974, Official Map of Special Studies Zones, Juniper Hills, scale 1:24,000.
California Department of Conservation, Division of Mines and Geology, 1997, Guidelines for evaluating and mitigating seismic hazards in California: California Division of Mines and Geology Special Publication 117, 74 p.
California Department of Conservation, Division of Mines and Geology, 2000, Recommended criteria for delineating seismic hazard zones in California: California Division of Mines and Geology Special Publication 118, 12 p.
California Department of Water Resources, 2003, Groundwater Level Data, Water Data Library, http://wdl.water.ca.gov/gw (February, 2003).

2003 SEISMIC HAZARD ZONE REPORT FOR THE PALMDALE QUADRANGLE 17
California Department of Water Resources, 1966, Water wells in the eastern part of the Antelope Valley Area, Los Angeles County, California: California Department of Water Resources Bulletin 91-12.
Carlson, C.S. and Phillips, S.P., 1998, Water-level changes (1975-98) in the Antelope Valley, California: U. S. Geological Survey Open-File Report, 2 sheets.
Carlson, C.S., Leighton, D.A., Phillips, S.P. and Metzger, L.F., 1998, Regional water table (1996) and water-table changes in the Antelope Valley ground-water basin, California: U. S. Geological Survey Water-Resources Investigations Report 98-4022, 2 sheets.
Cramer, C.H. and Petersen, M.D., 1996, Predominant seismic source distance and magnitude maps for Los Angeles, Orange, and Ventura counties, California: Bulletin of Seismological Society of America, v. 86, no. 5, p. 1,645-1,649.
Dibblee, T.W., Jr., 2001, Geologic map of the Pacifico Mountain and Palmdale (south half) quadrangles, Los Angeles County, California: Dibblee Geological Foundation Map DF-76, map scale 1:24,000.
Duell, L.F.W., Jr., 1987, Geohydrology of the Antelope Valley area, California, and design for a ground-water-quality monitoring network: U.S. Geological Survey Water-Resources Investigations Report 84-4081, 72p.
Durbin, T. J., 1978, Calibration of a mathematical model of the Antelope Valley ground-water basin, California: U.S. Geological Survey Water-Supply Paper 2046, 51 p. (prepared in cooperation with the California Department of Water Resources).
Evans, M.D. and Zhou, Shengping, 1995, Liquefaction behaviour of sand-gravel composites: American Society of Civil Engineers, Journal of Geotechnical Engineering, v. 121, no. 3, p. 287-298.
Galloway, D.L., Phillips, S.P. and Ikehara, M.E., 1995, Land subsidence and its relation to past and future water supplies in Antelope Valley, California, in Borchers, J., editor, Land Subsidence--Case Studies and Current Research: Proceedings of the Dr. Joseph F. Poland Symposium on Land Subsidence, Association of Engineering Geologist Special Publication 8, p. 529-539.
Harder, L.F. and Seed, H.B., 1986, Determination of penetration resistance for coarse-grained soils using the Becker hammer drill: University of California at Berkeley, College of Engineering, Earthquake Engineering Research Center, report no. UCB/EERC-86/06, 126 p.
Ishihara, Kenji, 1985, Stability of natural deposits during earthquakes, in Proceedings of the Eleventh International Conference on Soil Mechanics and Foundation Engineering, San Francisco, v. 1, p. 321-376.

CALIFORNIA GEOLOGICAL SURVEY SHZR 105 18
Johnson, H.R., 1911, Water resources of Antelope Valley, California: U.S. Geological Survey Water-Supply Paper 278, 92p.
Leighton and Associates, 1990, Technical Appendix to the Safety Element of the Los Angeles County General Plan, Hazard Reduction in Los Angeles County, volumes 1 and 2, plate 4.
Michael Brandman Associates, 1992, Draft program environmental impact report for the City of Palmdale draft general plan, August 1992, prepared for the Planning and Development Department, City of Palmdale.
National Research Council, 1985, Liquefaction of soils during earthquakes: National Research Council Special Publication, Committee on Earthquake Engineering, National Academy Press, Washington, D.C., 240 p.
Ponti, D.J., and Burke, D.B., 1980, Map showing Quaternary geology of the eastern Antelope Valley and vicinity, California: United States Geological Survey Open-File Report 80-1064, scale 1:62,500.
Ponti, D.J., Burke, D.B. and Hedel, C.W., 1981, Map showing Quaternary geology of the central Antelope Valley and vicinity, California: U.S. Geological Survey Open-File Report 81-737, scale 1:62,500.
Petersen, M.D., Bryant, W.A., Cramer, C.H., Cao, Tianqing, Reichle, M.S., Frankel, A.D., Lienkaemper, J.J., McCrory, P.A. and Schwartz, D.P., 1996, Probabilistic seismic hazard assessment for the State of California: California Department of Conservation, Division of Mines and Geology, Open-File Report 96-08; also U.S. Geological Survey Open-File Report 96-706, 33 p.
Seed, H.B. and Idriss, I.M., 1971, Simplified procedure for evaluating soil liquefaction potential: Journal of the Soil Mechanics and Foundations Division of ASCE, v. 97: SM9, p. 1,249-1,273.
Seed, H.B. and Idriss, I.M., 1982, Ground motions and soil liquefaction during earthquakes: Monograph Series, Earthquake Engineering Research Institute, Berkeley, California, 134 p.
Seed, H.B., Idriss, I.M. and Arango, Ignacio, 1983, Evaluation of liquefaction potential using field performance data: Journal of Geotechnical Engineering, v. 109, no. 3, p. 458-482.
Seed, H.B., Tokimatsu, Kohji, Harder, L.F., and Chung, R.M., 1985, Influence of SPT procedures in soil liquefaction resistance evaluations: Journal of Geotechnical Engineering, ASCE, v. 111, no. 12, p. 1,425-1,445.
Seed, R.B. and Harder, L.F., 1990, SPT-based analysis of cyclic pore pressure generation and undrained residual strength: Proceedings of the H. Bolton Seed Memorial Symposium, v. 2, p. 351-376.
2003 SEISMIC HAZARD ZONE REPORT FOR THE PALMDALE QUADRANGLE 19
Smith, T.C., 1996, Preliminary maps of seismic hazard zones and draft guidelines for evaluating and mitigating seismic hazards: California Geology, v. 49, no. 6, p. 147-150.
Sneed, M., and Galloway, D.L., 2000, Aquifer-system compaction and land subsidence: measurements, analyses, and simulations--the Holly Site, Edwards Air Force Base, Antelope Valley, California: U.S. Geological Survey Water-Resources Investigations Report 00-4015, 65 p.
Southern California Earthquake Center, 1999, Recommended procedures for implementation of DMG Special Publication 117 guidelines for analyzing and mitigating liquefaction in California: Southern California Earthquake Center, University of Southern California, 63 p.
Sy, Alex, Campanella, R.G. and Stewart, R.A., 1995, BPT-SPT correlations for evaluations of liquefaction resistance in gravelly soils, in Evans, M.D. and Fragaszy, R.J., editors, Static and Dynamic Properties of Gravelly Soils: American Society of Civil Engineers Geotechnical Special Publication no. 56, p. 1-19.
Templin, W.E., Phillips, S.P., Cherry, D.E., DeBortoli, M.L., Haltom, T.C., McPherson, K.R., and Mrozek, C.A., 1995, Land use and water use in the Antelope Valley California: U. S. Geological Survey Water-Resources Investigations Report 94-4208, 97p.
Thompson, D.G., 1929, The Mohave Desert region, California: a geographic, geologic, and hydrologic reconnaissance: U.S. Geological Survey Water-Supply Paper 578, 759p.
Tinsley, J.C., Youd, T.L., Perkins, D.M. and Chen, A.T.F., 1985, Evaluating liquefaction potential, in Ziony, J.I., editor, Evaluating earthquake hazards in the Los Angeles region — An earth science perspective: U.S. Geological Survey Professional Paper 1360, p. 263-316.
Youd, T.L., 1973, Liquefaction, flow and associated ground failure: U.S. Geological Survey Circular 688, 12 p.
Youd, T.L., 1991, Mapping of earthquake-induced liquefaction for seismic zonation: Earthquake Engineering Research Institute, Proceedings, Fourth International Conference on Seismic Zonation, v. 1, p. 111-138.
Youd, T.L. and Idriss, I.M., 1997, editors, Proceedings of the NCEER workshop on evaluation of liquefaction resistance of soils: National Center for Earthquake Engineering Research Technical Report NCEER-97-0022, 276 p.
CALIFORNIA GEOLOGICAL SURVEY SHZR 105 20
Youd, T.L., Idriss, I.M., Andrus, R.D., Arango, I., Castro, G., Christian, J.T., Dobry, R., Finn, W.D.L., Harder, L.F. Jr., Hynes, M.E., Ishihara, K., Koester, J.P., Liao, S.S.C., Marcusson, W.F., Martin, G.R., Mitchell, J.K., Moriwaki, Y., Power, M.S., Robertson, P.K., Seed, R.B. and Stokoe, K.H., 2001, Liquefaction resistance of soils; Summary report from the 1996 NCEER and 1998 NCEER/NSF workshops on evaluation of liquefaction resistance of soils: Journal of Geotechnical and Geoenvironmental Engineering, October 2001, p. 817-833.
Youd, T.L. and Perkins, D.M., 1978, Mapping liquefaction-induced ground failure potential: Journal of Geotechnical Engineering, v. 104, p. 433-446.
AIR PHOTOS
Digital Orthophoto Quarter Quadrangle Photo, dated 10-4-95, northeast quarter quadrangle area, Palmdale Quadrangle. (DOQQ and information concerning them can be obtained at http://www-wmc.wr.usgs.gov/doq/ )
2003 SEISMIC HAZARD ZONE REPORT FOR THE PALMDALE QUADRANGLE 21
SECTION 2 EARTHQUAKE-INDUCED LANDSLIDE
EVALUATION REPORT
Earthquake-Induced Landslide Zones in the Palmdale 7.5-Minute Quadrangle,
Los Angeles County, California
By Michael A. Silva, Terry A. Jones, and Allan G. Barrows
California Department of Conservation
California Geological Survey
PURPOSE
The Seismic Hazards Mapping Act (the Act) of 1990 (Public Resources Code, Chapter 7.8, Division 2) directs the California Department of Conservation (DOC), Division of Mines and Geology (DMG) [now called California Geological Survey (CGS)] to delineate Seismic Hazard Zones. The purpose of the Act is to reduce the threat to public health and safety and to minimize the loss of life and property by identifying and mitigating seismic hazards. Cities, counties, and state agencies are directed to use seismic hazard zone maps prepared by CGS in their land-use planning and permitting processes. The Act requires that site-specific geotechnical investigations be performed prior to permitting most urban development projects within the hazard zones. Evaluation and mitigation of seismic hazards are to be conducted under guidelines established by the California State Mining and Geology Board (DOC, 1997). The text of this report is on the Internet at http://gmw.consrv.ca.gov/shmp/webdocs/sp117.pdf

CALIFORNIA GEOLOGICAL SURVEY SHZR 105 22
Following the release of DMG Special Publication 117 (DOC, 1997), agencies in the Los Angeles metropolitan region sought more definitive guidance in the review of geotechnical investigations addressing landslide hazards. The agencies made their request through the Geotechnical Engineering Group of the Los Angeles Section of the American Society of Civil Engineers (ASCE). This group convened an implementation committee in 1998 under the auspices of the Southern California Earthquake Center (SCEC). The committee, which consisted of practicing geotechnical engineers and engineering geologists, released an overview of the practice of landslide analysis, evaluation, and mitigation techniques (SCEC, 2002). This text is also on the Internet at: http://www.scec.org/
This section of the evaluation report summarizes seismic hazard zone mapping for earthquake-induced landslides in the Palmdale 7.5-Minute Quadrangle. Section 1 (addressing liquefaction) and Section 3 (addressing earthquake shaking) complete the report, which is one of a series that summarizes the preparation of seismic hazard zone maps within the state (Smith, 1996). Additional information on seismic hazard zone mapping in California can be accessed on the California Geological Survey's Internet page: http://www.conservation.ca.gov/CGS/index.htm
BACKGROUND
Landslides triggered by earthquakes historically have been a significant cause of earthquake damage. In California, large earthquakes such as the 1971 San Fernando, 1989 Loma Prieta, and 1994 Northridge earthquakes triggered landslides that were responsible for destroying or damaging numerous structures, blocking major transportation corridors, and damaging life-line infrastructure. Areas that are most susceptible to earthquake-induced landslides are steep slopes in poorly cemented or highly fractured rocks, areas underlain by loose, weak soils, and areas on or adjacent to existing landslide deposits. These geologic and terrain conditions exist in many parts of California, including numerous hillside areas that have already been developed or are likely to be developed in the future. The opportunity for strong earthquake ground shaking is high in many parts of California because of the presence of numerous active faults. The combination of these factors constitutes a significant seismic hazard throughout much of California, including the hillside areas of the Palmdale Quadrangle.
METHODS SUMMARY
The mapping of earthquake-induced landslide hazard zones presented in this report is based on the best available terrain, geologic, geotechnical, and seismological data. If unavailable or significantly outdated, new forms of these data were compiled or generated specifically for this project. The following were collected or generated for this evaluation:
• Digital terrain data were used to provide an up-to-date representation of slope gradient and slope aspect in the study area
2003 SEISMIC HAZARD ZONE REPORT FOR THE PALMDALE QUADRANGLE 23
• Geologic mapping was used to provide an accurate representation of the spatial distribution of geologic materials in the study area. In addition, a map of existing landslides, whether triggered by earthquakes or not, was prepared.
• Geotechnical laboratory test data were collected and statistically analyzed to quantitatively characterize the strength properties and dynamic slope stability of geologic materials in the study area.
• Seismological data in the form of CGS probabilistic shaking maps and catalogs of strong-motion records were used to characterize future earthquake shaking within the mapped area.
The data collected for this evaluation were processed into a series of GIS layers using commercially available software. A slope stability analysis was performed using the Newmark method of analysis (Newmark, 1965), resulting in a map of landslide hazard potential. The earthquake-induced landslide hazard zone was derived from the landslide hazard potential map according to criteria developed in a CGS pilot study (McCrink and Real, 1996; McCrink, 2001) and adopted by the State Mining and Geology Board (DOC, 2000).
SCOPE AND LIMITATIONS
The methodology used to make this map is based on earthquake ground-shaking estimates, geologic material-strength characteristics and slope gradient. These data are gathered from a variety of outside sources. Although the selection of data used in this evaluation was rigorous, the quality of the data is variable. The State of California and the Department of Conservation make no representations or warranties regarding the accuracy of the data gathered from outside sources.
Earthquake-induced landslide zone maps are intended to prompt more detailed, site-specific geotechnical investigations as required by the Act. As such, these zone maps identify areas where the potential for earthquake-induced landslides is relatively high. Due to limitations in methodology, it should be noted that these zone maps do not necessarily capture all potential earthquake-induced landslide hazards. Earthquake-induced ground failures that are not addressed by this map include those associated with ridge-top spreading and shattered ridges. It should also be noted that no attempt has been made to map potential run-out areas of triggered landslides. It is possible that such run-out areas may extend beyond the zone boundaries. The potential for ground failure resulting from liquefaction-induced lateral spreading of alluvial materials, considered by some to be a form of landsliding, is not specifically addressed by the earthquake-induced landslide zone or this report. See Section 1, Liquefaction Evaluation Report for the Palmdale Quadrangle, for more information on the delineation of liquefaction zones.
The remainder of this report describes in more detail the mapping data and processes used to prepare the earthquake-induced landslide zone map for the Palmdale Quadrangle. The information is presented in two parts. Part I covers physiographic, geologic and

CALIFORNIA GEOLOGICAL SURVEY SHZR 105 24
engineering geologic conditions in the study area. Part II covers the preparation of landslide hazard potential and landslide zone maps.
PART I
PHYSIOGRAPHY
Study Area Location and Physiography
The Palmdale 7.5-Minute Quadrangle covers approximately 62 square miles in the Antelope Valley in northeastern Los Angeles County. The center of the area is 37 miles north of the Los Angeles Civic Center. Typical high desert terrain of low local relief characterizes the northern two-thirds of the quadrangle. The northwest-trending San Andreas Rift Zone cuts across the mountainous southern part of the area. It is manifested as a series of trough-like valleys and linear ridges. At the western boundary of the quadrangle is Lake Palmdale, a reservoir created by increasing the capacity of a closed depression within the rift zone through construction of a dam. Soledad Pass is in the southwestern corner of the area. In the southeastern corner Little Rock Wash forms an “S-curve” where it crosses the San Andreas Fault Zone. The highest point in the quadrangle is just east of Soledad Pass at 4,183 feet. The lowest point, below 2,510 feet, is at the center of the northern boundary.
The City of Palmdale covers about two thirds of the quadrangle. Palmdale Airport (Air Force Plant 42) and the surrounding land within the site of the proposed Palmdale International Airport covers the northern third of the quadrangle. Land in Soledad Pass and south of the California Aqueduct, which crosses the entire quadrangle near the San Andreas Rift Zone, is mostly unincorporated Los Angeles County land. In the past two decades residential tract development and expansion of commercial and industrial facilities have characterized the rapid growth of the city of Palmdale. Access to the region is via State Highway 14 (Antelope Valley Freeway), State Highway 138 (Palmdale Boulevard, Fort Tejon Road, and Pearblossom Highway) and a grid of east-west avenues (lettered) and north-south streets (numbered). Railroad tracks cross the entire quadrangle from south to north and nearly the entire area from east to west.
Digital Terrain Data
The calculation of slope gradient is an essential part of the evaluation of slope stability under earthquake conditions. An accurate slope gradient calculation begins with an up-to-date map representation of the earth’s surface in the form of a digital topographic map. Within the Palmdale Quadrangle, a Level 2 digital elevation model (DEM) was obtained from the USGS (U.S. Geological Survey, 1993). This DEM, prepared from the 7.5-minute quadrangle topographic contours based on 1955 aerial photography, has a 10-meter horizontal resolution and a 7.5-meter vertical accuracy.

2003 SEISMIC HAZARD ZONE REPORT FOR THE PALMDALE QUADRANGLE 25
Recent gravel mining has created large pits with steep slopes in the southeastern part of the quadrangle. The digital terrain map was updated in this area to reflect the new topography. A DEM reflecting this recent mining was obtained from an airborne interferometric radar platform flown in 2001, with an estimated vertical accuracy of approximately 1.5 meters (Intermap Corporation, 2002). An interferometric radar DEM is prone to creating false topography where tall buildings, metal structures, or trees are present. The DEM used for the graded areas within the Palmdale Quadrangle underwent additional processing to remove these types of artifacts (Wang and others, 2001). Nevertheless, the final hazard zone map was checked for potential errors resulting from the use of the radar DEM and corrected if necessary. Graded areas where the radar DEM was applied are shown on Plate 2.1
A slope map was made from both the USGS and radar DEMs using a third-order, finite difference, center-weighted algorithm (Horn, 1981). The manner in which the slope maps were used to prepare the zone map will be described in subsequent sections of this report.
GEOLOGY
Bedrock and Surficial Geology
The geologic map used as background geology for the Palmdale Quadrangle was prepared from four sources. Ponti and Burke (1980) mapped the Quaternary geology of the eastern Antelope Valley and Ponti and others (1981) mapped the Quaternary geology of central Antelope Valley and vicinity. The boundary between these two Quaternary geologic maps bisects the Palmdale Quadrangle. Detailed geologic maps of the San Andreas Fault Zone, including the segment that traverses the Palmdale Quadrangle, were prepared by Barrows and others (1985, Plates 1E and 1F). These geologic maps were digitized by the Southern California Areal Mapping Project [SCAMP]. The pre-Quaternary sedimentary, volcanic, and crystalline rocks are generalized on the Ponti and others (1981) map. Therefore, part of a geologic map by Dibblee (2001) was digitized by CGS for the portion of the quadrangle southwest of the detailed strip map along the fault zone. During the search for landslides in the field, observations were made of exposures, aspects of weathering, and general surface expression of the geologic units.
Rock assemblages are distinct for areas that are north of, within, and south of the San Andreas Fault Zone, which crosses the entire quadrangle (Plate 1.1).
North of and within the San Andreas Fault Zone
The oldest rocks north of the San Andreas Fault Zone consist of Holcomb Quartz Monzonite (hqm) that is exposed on linear ridges north of the Little Rock Fault, which lies about 1,600 to 2,000 feet north of the main trace on the San Andreas Fault. Holcomb Quartz Monzonite is well exposed in cuts on 47th Street East and along the California Aqueduct west of Little Rock Wash.

CALIFORNIA GEOLOGICAL SURVEY SHZR 105 26
Other pre-Quaternary rocks exposed north of the Little Rock Fault belong to the non-marine Pliocene Anaverde Formation. The red arkose member with volcanic clasts (Tavr) consists of well-bedded, poorly sorted, red-stained, coarse arkose with interbeds of pebbles, fine sand, and silt. The buff arkose member with volcanic clasts (Tavb) is very similar to Tavr but is a buff-colored coarse arkose. The predominant clast types are leucocratic granitic rocks. However, up to 20 percent of the clasts are dacitic to quartz latitic volcanic rocks that do not resemble Vasquez Volcanic rocks and whose source is unknown. These two members are not found south of the Little Rock Fault.
Several additional members of the non-marine Anaverde Formation are exposed within the belt between the Little Rock Fault and the main trace of the San Andreas Fault. These include the red arkose, buff arkose, and clay shale members (Barrows and others, 1985). The red arkose member (Tar) is a pink to red, medium-to thick-bedded, locally massive, coarse pebbly arkosic sandstone. The buff arkose (Tab) is a buff to gray, medium-bedded to massive, medium- to very coarse-grained pebbly arkosic sandstone with thin silty interbeds near the top. The clay shale member (Tac) is a gray to brown, thin-bedded, sandy, silty, locally very gypsiferous clay shale with interbedded siltstone and sandstone layers. Within the Palmdale Quadrangle, red arkose (Tar) and buff arkose (Tab) are about evenly distributed. The clay shale member (Tac) crops out only near the western boundary. In fact, anomalous topography in the hills north of Avenue S and west of 5th Street East in the City of Palmdale is due to long-ago excavation of the gypsiferous clay shale for the gypsum. This area was interpreted as a landslide by Dibblee (1967, Figure 34). The bedding within the Anaverde Formation members mostly parallels the bounding faults and has steep to vertical dips.
A variety of older and younger alluvial deposits cover the pre-Quaternary rocks north of the San Andreas Fault. In the portion of the map complied from Ponti and Burke (1980 and Ponti and others (1981) the upper Quaternary alluvial and colluvial units are designated by numbers (higher numbers signify more recent deposits) and letters that signify coarseness of the materials (c being coarse- and m being medium-grained). In the Palmdale Quadrangle these units include Q2c, Q4c, Q6m, Q6c, and Q7m.
Within the detailed strip map by Barrows and others (1985) numerous Quaternary alluvial deposits are differentiated. The oldest group of deposits includes the following units. Harold Formation, Pelona Schist-Clast Member (Qhp) is a well-bedded fluvial gravel with 80 percent of the pebble- to cobble-size clasts that consist of micaceous Pelona Schist. Qhp is scattered along the northern side of the San Andreas Fault between Little Rock Creek and Lake Palmdale. A few small patches of undifferentiated Harold Formation (Qh) also occur within this stretch of the fault zone. Qh is a light-brown to dark-gray, weakly to moderately consolidated, massive to moderately well-stratified alluvial gravel. It typically contains caliche. Inferred depositional conditions indicate that Qh formed in a terrain of low relief and low stream gradient. Thus, it contrasts, texturally, with the younger Nadeau Gravel and other coarse boulder and cobble gravel deposits in the region. Nadeau Gravel (Qn) is a coarse, poorly sorted dark reddish brown, pebble to boulder gravel with abundant Pelona Schist and, locally, ferruginous syenite, leucocratic granitic, magnetite-quartz, and Vasquez Volcanic fragments. Qn is widespread between Sierra Highway and Little Rock Creek where it is commonly a
2003 SEISMIC HAZARD ZONE REPORT FOR THE PALMDALE QUADRANGLE 27
ridgetop deposit. East of Little Rock Creek boulder gravel of Little Rock Creek (Qbl) occurs almost exclusively north of the San Andreas Fault. Qbl is a very coarse, fluvial, cobble to boulder gravel with a weakly consolidated, poorly sorted dark red to brown sandy matrix. Qbl contains distinctive boulders of Lowe Granodiorite, hornblende gabbro and hornblendite that were derived from the drainage area of Little Rock Creek. Several other older alluvial units occur north of the fault. These include typically unconsolidated, poorly sorted, and moderately dissected fluvial gravel, sand, and silt deposits of older alluvium with volcanic (from Vasquez Formation) and syenite clasts (Qovs), with syenite clasts but no volcanic clasts (Qos), with Pelona Schist and syenite clasts (Qops), with Pelona Schist clasts and no syenite clasts (Qopl), and undifferentiated older alluvium (Qoa). Younger alluvial units include terrace deposits (Qt), fan deposits (Qf), slope wash (Qsw), lake deposits (Ql), stream channel deposits (Qsc), and alluvium (Qal). Artificial fill, especially that associated with the construction of the California Aqueduct, is also scattered across the quadrangle.
South of the San Andreas Fault
Several through-going faults that parallel the main San Andreas Fault dominate the geologic structure within the area south of the fault covered by the strip map of Barrows and others, (1985). The bands bound by various fault strands consist of contrasting rock assemblages. East of Little Rock Creek, south of the Punchbowl Fault, bedrock consists of Triassic medium- to coarse-grained porphyritic Lowe Granodiorite (lgd) and associated hornblende diorite (hd). Resting upon these crystalline rocks are resistant, reddish-brown-weathering aphanitic to slightly porphyritic lava flows and thick coarse volcanic breccias that comprise Vasquez Formation volcanic rocks (Tvv) of Oligocene age. A complex of faults between the crystalline basement and the Punchbowl Fault define an area west of Little Rock Creek in which volcanic rocks and fluvial and playa deposits. Rocks include Vasquez Formation volcanic rocks (Tvv) and mudflow breccia (Tvm) and undifferentiated fluvial, lacustrine, and playa deposits, primarily arkosic pebbly sandstone, of the Juniper Hills Formation (TQjh) and red-brown siltstone playa deposits (TQjhp).
North of the Punchbowl Fault, the Nadeau Fault, which crosses the entire Quadrangle, splits into the Northern Nadeau Fault and the Southern Nadeau Fault west of Little Rock Creek. A sliver of distinctive, crushed and deformed, steeply dipping Punchbowl Formation Volcanic-Clast Member (Tpv) lies between the Punchbowl Fault and the Southern Nadeau fault. Tpv consists of well-indurated, well-stratified coarse pebbly arkosic sandstone with interlayered silty beds and a variety of volcanic clasts of unknown source (not Vasquez Formation). No Juniper Hills Formation rocks are found between these two faults. Quartz diorite (qd) is the only bedrock unit exposed between the Southern Nadeau and Northern Nadeau faults.
In the southwestern part of the Palmdale Quadrangle near the junction of Pearblossom Highway and Sierra Highway are exposures of undifferentiated pebbly arkosic Juniper Hills Formation (TQjh), a clay shale member (TQjhc) and a granitic-clast-bearing arkosic
CALIFORNIA GEOLOGICAL SURVEY SHZR 105 28
member (TQjhg). West of Sierra Highway, ferruginous syenite (fs) is in fault contact with the Juniper Hills Formation. Vasquez Formation volcanic rocks (Tvv) are in fault contact with the ferruginous syenite in this area as well. Associated with the main body of undifferentiated volcanic breccias and lava-flow Vasquez Formation rocks (Tvv) are mudflow breccia (Tvm), volcanic breccia (Tvb), and sedimentary layers of pebbly to cobbly fluvial conglomerate and red clayey sandstone (Tvs) subunits (Barrows and others,1985, Plate 1F).
Several members of the Juniper Hills Formation are exposed between the Northern Nadeau Fault and Nadeau Fault (west of 47th Street East) and the San Andreas Fault. Clay shale member (TQjhc) and mixed-clast arkosic member (TQjhm) subunits are the primary components in this band of rocks. Small patches of the red arkose member (TQjhr) and the arkosic basal-breccia member (TQjhb) are also found in this area. The clay shale member (TQjhc) consists of thin-bedded, greenish-gray, light-brown to nearly black, gypsiferous clay shale with very thin flaggy, red sandstone layers. A soft brown expansive clayey soil with abundant glassy-appearing gypsum chips and sparse vegetation typically covers the clay shale member (TQjhc). Within the intensely deformed zone south of the San Andreas Fault and east of Little Rock Creek, masses of undifferentiated, primarily light-colored granitic rock (gru) and quartz diorite (qd) are in fault contact with Juniper Hills Formation rocks.
South of the San Andreas Fault is a variety of Quaternary alluvial deposits. The oldest deposits are members of the Pleistocene Harold Formation. Undifferentiated Harold Formation (Qh) consists of weakly to moderately consolidated, light-brown, dark-gray or reddish-brown, well-stratified alluvial fan and playa deposits. The Pelona Schist-clast member of the Harold Formation (Qhp) is well-bedded fluvial gravel, with 80 percent of the pebble- to cobble-size clasts that consist of micaceous Pelona Schist occurring close to the San Andreas Fault. The granitic arkose member of the Harold Formation (Qhg) consists exclusively of white, coarse arkose with angular granitic gravel and sand.
Deposits of late Pleistocene coarse, commonly cobbly to bouldery, alluvial gravels are widespread within the Palmdale Quadrangle. Nadeau Gravel (Qn), a coarse, poorly sorted dark reddish brown, pebble to boulder gravel with abundant Pelona Schist fragments is abundant east of Sierra Highway north of the California Aqueduct. Boulder gravel of Little Rock Creek (Qbl) is a very coarse, fluvial cobble to boulder gravel with a dark red to brown sandy matrix. It contains boulders of distinctive porphyritic Lowe Granodiorite and deeply weathered hornblendite and diorite boulders. It originated as an apron that spread across the terrain west of modern Little Rock Creek. West of the creek it occurs only south of the San Andreas Fault. East of the creek it occurs only north of the fault (except where it has been redeposited back across the fault near Mount Emma Road). The most widespread older alluvial unit between Little Rock Creek and Pearblossom Highway consists of older fan deposits (Qof) that largely bury Qbl and the pre-Quaternary rocks in this area. Qoc is a distinctive older colluvial deposit that rests upon Lowe Granodiorite east of Little Rock Creek. Qoc contains huge boulders (up to 4 m in diameter) of Lowe Granodiorite. Elevated above the modern channel of Little Rock Creek are older terrace deposits (Qot). Qovs is an older alluvial deposit with volcanic

2003 SEISMIC HAZARD ZONE REPORT FOR THE PALMDALE QUADRANGLE 29
and syenite clasts that was deposited both upon bedrock of the two units and to the north on the tops of hills that border Sierra Highway (Barrows and others, 1985, Plate 1F). Undifferentiated older alluvium (Qoa) is mapped near the San Andreas Fault east of 47th Street East.
Younger units in this region include fan deposits (Qf), terrace deposits (Qt), slope wash (Qsw), lake deposits [Lake Palmdale] (Ql), ponded alluvium (Qpa), stream channel deposits (Qsc), and alluvium (Qal). Artificial fill associated with the construction of the California Aqueduct and highways is also scattered across the quadrangle.
For the portion of the Palmdale Quadrangle southwest of the detailed strip map along the fault zone, a geologic map by Dibblee (2001) was utilized. Within this part of the map the oldest rock is Triassic Lowe Granodiorite (lgdb). Deposited upon the crystalline rocks are Oligocene nonmarine, predominantly volcanic, rocks of the Vasquez Formation including andesitic volcanic rocks (Tva), tuff-breccia (Tvt), and a basal conglomerate and sandstone (Tvs). Near the junction of Sierra Highway and Pearblossom Highway Dibblee (2001) mapped an area of Punchbowl Formation conglomerate (Tpcg). Barrows and others (1985) interpreted parts of these rocks as varieties of Vasquez Formation and/or older alluvium with Vasquez volcanic and syenite clasts (Qovs). Elsewhere, west of Mount Emma Road near the southern quadrangle boundary, Dibblee (2001) mapped a clay shale unit of the Punchbowl Formation (Tpc). Barrows and others (1985) mapped these rocks as Juniper Hills Formation (TQjh). Older alluvium (Qoa) and modern alluvium or surficial sediments (Qa), which includes stream channel deposits, are the only Quaternary units mapped in this area by Dibblee (2001).
Structural Geology
The dominant structural feature is the San Andreas Fault Zone that crosses the entire quadrangle and separates geologic terranes with dissimilar rock assemblages. The tectonic boundaries of the fault zone include the Little Rock Fault on the north and, on the south, the Nadeau Fault, which splits into the Northern Nadeau and Southern Nadeau faults near 47th Street East. A sliver of distinctive Punchbowl Formation rocks lies between the Southern Nadeau Fault and the Punchbowl Fault as mapped by Barrows and others (1985) in the southeastern part of the quadrangle. Additional structural complexity occurs south of the Punchbowl Fault west of Little Rock Creek and south of Lake Palmdale. Topographically, the San Andreas Fault lies generally within a linear, trough-like valley called the San Andreas Rift Zone. Lake Palmdale is a reservoir created by damming the eastern end of a depression south of the fault. Precambrian basement rocks, such as the ferruginous syenite, and the Triassic Lowe Granodiorite that are exposed within the southern part of the Palmdale Quadrangle are western extensions of the San Gabriel Mountains basement terrane. The overlying Vasquez Formation volcanic and fluvial sedimentary rocks are manifestations of the eastern part of the Soledad Basin, which widens and deepens to the west of the quadrangle.
CALIFORNIA GEOLOGICAL SURVEY SHZR 105 30
Landslide Inventory
As a part of the geologic data compilation, a search for existing landslides in the Palmdale Quadrangle was carried out by field reconnaissance, analysis of stereo-paired aerial photographs and a review of previously published maps. One small landslide, mapped by Barrows and others in 1985, was not confirmed by field investigation. No other landslides were found in the quadrangle.
ENGINEERING GEOLOGY
Geologic Material Strength
To evaluate the stability of geologic materials under earthquake conditions, the geologic map units described above were ranked and grouped on the basis of their shear strength. Generally, the primary source for shear-strength measurements is geotechnical reports prepared by consultants on file with local government permitting departments. Twenty-four shear tests were found for the Palmdale Quadrangle, collected from the Los Angeles County Public Works Department. Shear tests from the Ritter Ridge, Juniper Hills, Littlerock, and Valyermo quadrangles were used to characterize units with no test data and augment units with minimal data.
Shear strength data gathered from the above sources were compiled for each geologic map unit. Geologic units were grouped on the basis of average angle of internal friction (average phi) and lithologic character. Average (mean or median) phi values for each geologic map unit and corresponding strength group are summarized in Table 2.1. For each geologic strength group (Table 2.2) in the map area, the average shear strength value was assigned and used in our slope stability analysis. A geologic material strength map was made based on the groupings presented in Table 2.1 and Table 2.2, and this map provides a spatial representation of material strength for use in the slope stability analysis.
Due to the abundance of Quaternary units, mapped and described by three geologists, all Quaternary alluvial deposits were evaluated as one geological unit. Eighteen shear tests for Anaverde Formation sandstone, white to tan Tas member (Dibblee, 1997), from the Ritter Ridge Quadrangle were used to characterize strength group 3, even though the unit does not crop out in the Palmdale Quadrangle. This unit is considered to be equivalent to Anaverde Formation members Taw and Tab of Barrows and others (1985).

2003 SEISMIC HAZARD ZONE REPORT FOR THE PALMDALE QUADRANGLE 31
PALMDALE QUADRANGLE SHEAR STRENGTH GROUPS
Formation Name
Number Tests
Mean/Median Phi
(deg)
Mean/Median Group Phi
(deg)
Mean/Median Group C
(psf)
No Data: Similar Lithology
Phi Values Used in Stability Analyses
GROUP 1 fs hqm lgd qd
15 11 6 1
37/38 36
38/37 38
37/38 298/296 hd lgdb sy
37
GROUP 2 gru Tvv
41 3
34/35 34/31
34/35 389/286 gn,grc m
Tvb, Tvm Tvs, Tvt
34
GROUP 3 Qa* Qo** Tar Tas
48 18 2
18
31 29/30
29 30/32
30/31 212/168 af Tab, Tavb Tavr, Taw Tpc, Tpcg
Tpv TQjh, TQjhb
TQjhg, TQjhm TQjhr
TQr, Tva Q***
30
GROUP 4 Tac 9 24/26 26 477/280 TQjhc, TQjhp 26
Qa* includes Qa, Qal, Qf, Qsc, Qsw Qo** includes Q4-5c, Qoa, Qof, Qovs Q*** includes Q2c, Q3c, Q4c, Q6c, Q7c, Q7m, Qbl, Qh, Qhg, Qhl, Qhp, Ql, Qn, Qoc, Qopl, Qops, Qos, Qot, Qpa, Qsvc, Qt Formation abbreviations from Dibblee (2001), Ponti and Burke (1980), Ponti and others (1981), and Barrows and others (1985)
Table 2.1. Summary of the Shear Strength Statistics for the Palmdale Quadrangle.
SHEAR STRENGTH GROUPS FOR THE PALMDALE 7.5-MINUTE QUADRANGLE
GROUP 1 GROUP 2 GROUP 3 GROUP 4 fs gn af Tac hd grc Q TQjhc
hqm gru Tab, Tar TQjhp lgd m Tavr, Taw lgdb Tvb Tpc, Tpcg qd Tvm Tpv sy Tvs TQjh, TQjhb Tvt TQjhg, TQjhm Tvv TQjhr, TQr, Tva
Table 2.2. Summary of Shear Strength Groups for the Palmdale Quadrangle.

CALIFORNIA GEOLOGICAL SURVEY SHZR 105 32
PART II
EARTHQUAKE-INDUCED LANDSLIDE HAZARD POTENTIAL
Design Strong-Motion Record
To evaluate earthquake-induced landslide hazard potential in the study area, a method of dynamic slope stability analysis developed by Newmark (1965) was used. The Newmark method analyzes dynamic slope stability by calculating the cumulative down-slope displacement for a given earthquake strong-motion time history. As implemented for the preparation of earthquake-induced landslide zones, the Newmark method necessitates the selection of a design earthquake strong-motion record to provide the “ground shaking opportunity”. For the Palmdale Quadrangle, selection of a strong motion record was based on an estimation of probabilistic ground motion parameters for modal magnitude, modal distance, and peak ground acceleration (PGA). The parameters were estimated from maps prepared by DMG for a 10 percent probability of being exceeded in 50 years (Petersen and others, 1996). The parameters used in the record selection are:
Modal Magnitude: 7.8
Modal Distance: 2.8 to 9.8 km
PGA: 0.51g to 0.90g
The strong-motion record selected for the slope stability analysis in the Palmdale Quadrangle was the Southern California Edison (SCE) Lucerne record from the 1992 magnitude 7.3 Landers, California, earthquake. This record had a source to recording site distance of 1.1 km and a peak ground acceleration (PGA) of 0.80g. Although the magnitude and distance values of the Lucerne record do not fall within the range of the probabilistic parameters, this record was considered to be sufficiently conservative to be used in the stability analyses. The selected strong-motion record was not scaled or otherwise modified prior to its use in the analysis.
Displacement Calculation
The design strong-motion record was used to develop a relationship between landslide displacement and yield acceleration (ay), defined as the earthquake horizontal ground acceleration above which landslide displacements take place. This relationship was prepared by integrating the design strong-motion record twice for a given acceleration value to find the corresponding displacement, and the process was repeated for a range of acceleration values (Jibson, 1993). The resulting curve in Figure 2.1 represents the full spectrum of displacements that can be expected for the design strong-motion record. This curve provides the required link between anticipated earthquake shaking and
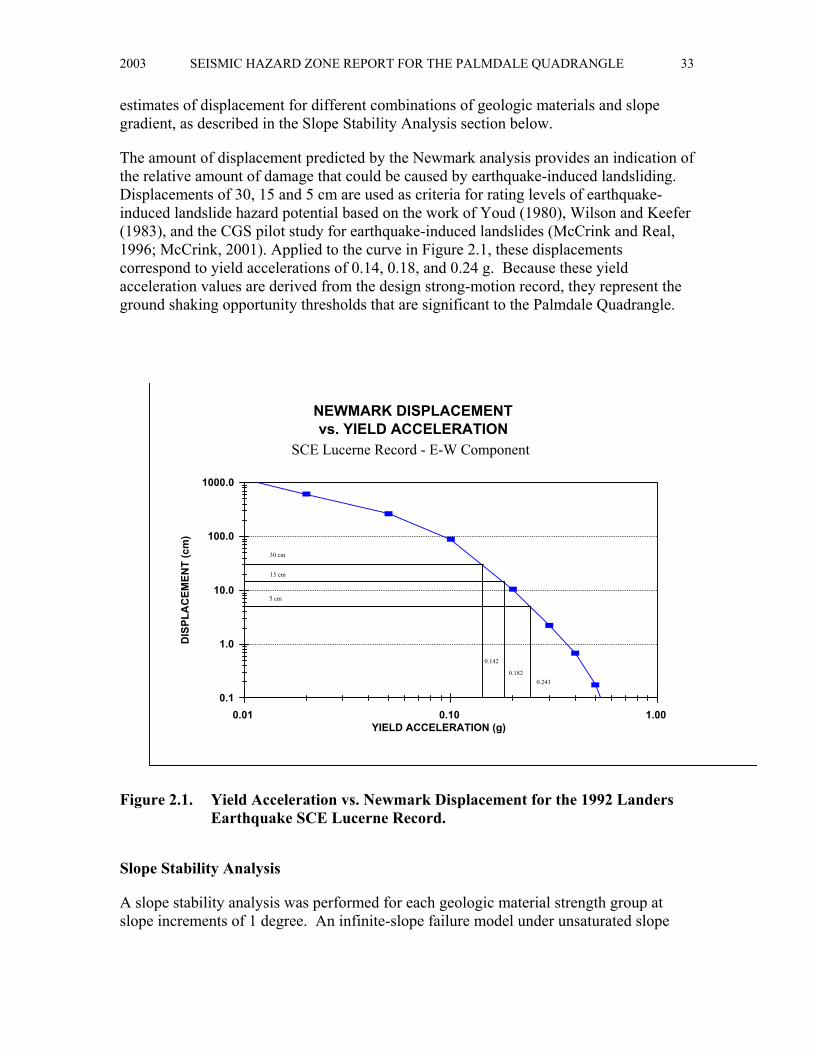
2003 SEISMIC HAZARD ZONE REPORT FOR THE PALMDALE QUADRANGLE 33
estimates of displacement for different combinations of geologic materials and slope gradient, as described in the Slope Stability Analysis section below.
The amount of displacement predicted by the Newmark analysis provides an indication of the relative amount of damage that could be caused by earthquake-induced landsliding. Displacements of 30, 15 and 5 cm are used as criteria for rating levels of earthquake-induced landslide hazard potential based on the work of Youd (1980), Wilson and Keefer (1983), and the CGS pilot study for earthquake-induced landslides (McCrink and Real, 1996; McCrink, 2001). Applied to the curve in Figure 2.1, these displacements correspond to yield accelerations of 0.14, 0.18, and 0.24 g. Because these yield acceleration values are derived from the design strong-motion record, they represent the ground shaking opportunity thresholds that are significant to the Palmdale Quadrangle.
0.1
1.0
10.0
100.0
1000.0
DIS
PLA
CEM
ENT
(cm
)
0.01 0.10 1.00 YIELD ACCELERATION (g)
NEWMARK DISPLACEMENTvs. YIELD ACCELERATION
SCE Lucerne Record - E-W Component
5 cm
15 cm
30 cm
0.142
0.1820.243
Figure 2.1. Yield Acceleration vs. Newmark Displacement for the 1992 Landers Earthquake SCE Lucerne Record.
Slope Stability Analysis
A slope stability analysis was performed for each geologic material strength group at slope increments of 1 degree. An infinite-slope failure model under unsaturated slope

CALIFORNIA GEOLOGICAL SURVEY SHZR 105 34
conditions was assumed. A factor of safety was calculated first, followed by calculation of yield acceleration from Newmark’s equation:
ay = ( FS - 1 )g sin α
where FS is the Factor of Safety, g is the acceleration due to gravity, and α is the direction of movement of the slide mass, in degrees measured from the horizontal, when displacement is initiated (Newmark, 1965). For an infinite slope failure, α is the same as the slope angle.
The yield accelerations resulting from Newmark’s equations represent the susceptibility to earthquake-induced failure of each geologic material strength group for a range of slope gradients. Based on the relationship between yield acceleration and Newmark displacement shown in Figure 2.1, hazard potentials were assigned as follows:
1. If the calculated yield acceleration was less than 0.14g, Newmark displacement greater than 30 cm is indicated, and a HIGH hazard potential was assigned.
2. Likewise, if the calculated yield acceleration fell between 0.14g and 0.18g, Newmark displacement between 15 cm and 30 cm is indicated, and a MODERATE hazard potential was assigned.
3. If the calculated yield acceleration fell between 0.18g and 0.24g, Newmark displacement between 5 cm and 15 cm is indicated, and a LOW hazard potential was assigned.
4. If the calculated yield acceleration was greater than 0.24g, Newmark displacement of less than 5 cm is indicated, and a VERY LOW potential was assigned.
Table 2.3 summarizes the results of the stability analyses. The earthquake-induced landslide hazard potential map was prepared by combining the geologic material-strength map and the slope map according to this table.
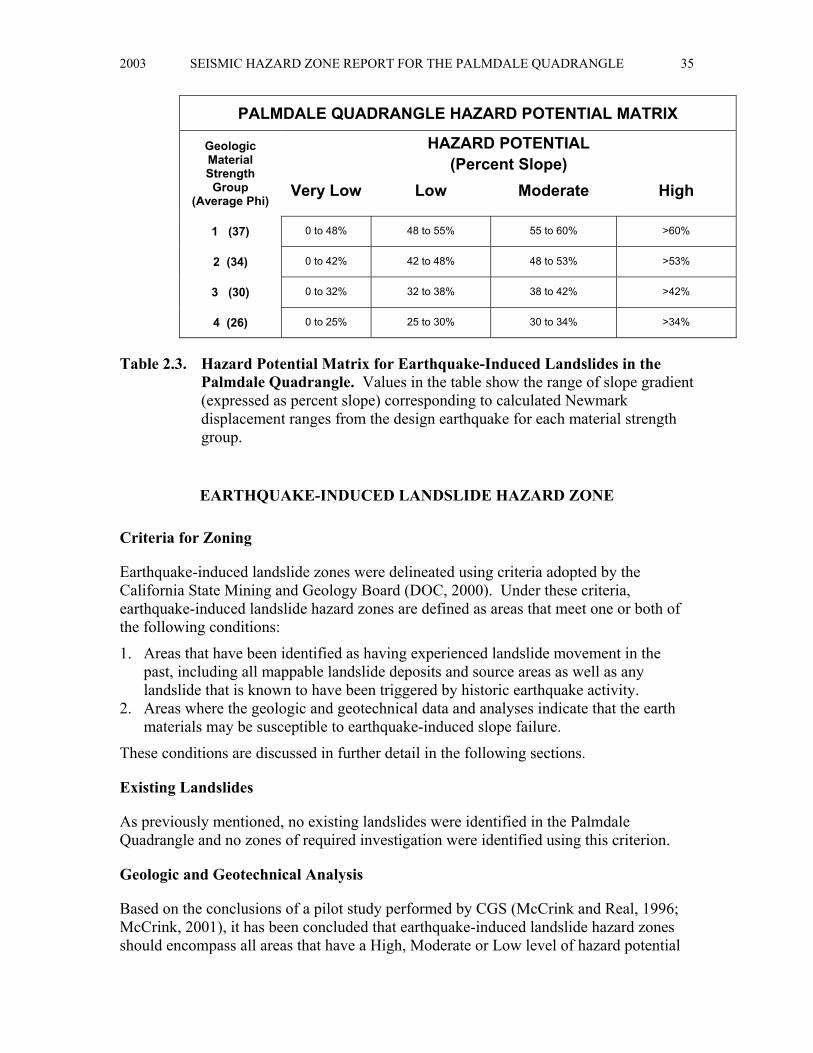
2003 SEISMIC HAZARD ZONE REPORT FOR THE PALMDALE QUADRANGLE 35
PALMDALE QUADRANGLE HAZARD POTENTIAL MATRIX
HAZARD POTENTIAL (Percent Slope)
Geologic Material Strength Group
(Average Phi) Very Low Low Moderate High
1 (37) 0 to 48% 48 to 55% 55 to 60% >60%
2 (34) 0 to 42% 42 to 48% 48 to 53% >53%
3 (30) 0 to 32% 32 to 38% 38 to 42% >42%
4 (26) 0 to 25% 25 to 30% 30 to 34% >34%
Table 2.3. Hazard Potential Matrix for Earthquake-Induced Landslides in the Palmdale Quadrangle. Values in the table show the range of slope gradient (expressed as percent slope) corresponding to calculated Newmark displacement ranges from the design earthquake for each material strength group.
EARTHQUAKE-INDUCED LANDSLIDE HAZARD ZONE
Criteria for Zoning
Earthquake-induced landslide zones were delineated using criteria adopted by the California State Mining and Geology Board (DOC, 2000). Under these criteria, earthquake-induced landslide hazard zones are defined as areas that meet one or both of the following conditions:
1. Areas that have been identified as having experienced landslide movement in the past, including all mappable landslide deposits and source areas as well as any landslide that is known to have been triggered by historic earthquake activity.
2. Areas where the geologic and geotechnical data and analyses indicate that the earth materials may be susceptible to earthquake-induced slope failure.
These conditions are discussed in further detail in the following sections.
Existing Landslides
As previously mentioned, no existing landslides were identified in the Palmdale Quadrangle and no zones of required investigation were identified using this criterion.
Geologic and Geotechnical Analysis
Based on the conclusions of a pilot study performed by CGS (McCrink and Real, 1996; McCrink, 2001), it has been concluded that earthquake-induced landslide hazard zones should encompass all areas that have a High, Moderate or Low level of hazard potential

CALIFORNIA GEOLOGICAL SURVEY SHZR 105 36
(see Table 2.3). This would include all areas where the analyses indicate earthquake displacements of 5 centimeters or greater. Areas with a Very Low hazard potential, indicating less than 5 centimeters displacement, are excluded from the zone.
As summarized in Table 2.3, all areas characterized by the following geologic strength group and slope gradient conditions are included in the earthquake-induced landslide hazard zone:
1. Geologic Strength Group 4 is included for all slopes steeper than 25 percent. 2. Geologic Strength Group 3 is included for all slopes steeper than 32 percent. 3. Geologic Strength Group 2 is included for all slopes steeper than 42 percent. 4. Geologic Strength Group 1 is included for all slopes steeper than 48 percent.
This results in approximately two percent of the quadrangle lying within the earthquake-induced landslide hazard zone for the Palmdale Quadrangle.
ACKNOWLEDGMENTS
The authors would like to thank the following individuals and organizations for their assistance in obtaining the data necessary to complete this project. Charles Nestle and Robert Larson from the Los Angeles County Materials Engineering Division, Dan Schneidereit and Bruce Hick of Earth Systems and Michael Mischel of the City of Palmdale provided assistance and access for collection of geologic material strength data, and review of geotechnical reports. At CGS Terilee McGuire, Bob Moscovitz and Lee Wallinder provided GIS support, and Barbara Wanish and Diane Vaughn prepared the final landslide hazard zone maps and the graphic displays for this report.
REFERENCES
Barrows, A.G., 1975, The San Andreas Fault Zone in the Juniper Hills Quadrangle in Crowell, J.C., editor, San Andreas Fault in southern California: California Division of Mines and Geology Special Report 118, p. 197-202.
Barrows, A.G., 1980, Geologic map of the San Andreas Fault Zone and adjoining terrane, Juniper Hills and vicinity: California Division of Mines and Geology Open-File Report 80-2 LA, map scale 1:9,600.
Barrows, A.G., 1987, Geology of the San Andreas Fault Zone and adjoining terrane, Juniper Hills and vicinity, Los Angeles County, California in Hester, R.L. and Hallinger, D.E., editors, San Andreas Fault – Cajon Pass to Palmdale: American Association of Petroleum Geologists Pacific Section Guidebook No. 59, p. 93-157, map scale 1:24,000.

2003 SEISMIC HAZARD ZONE REPORT FOR THE PALMDALE QUADRANGLE 37
Barrows, A.G., Kahle, J.E. and Beeby, D.J., 1985, Earthquake hazards and tectonic history of the San Andreas Fault Zone, Los Angeles County, California: California Division of Mines and Geology Open-File Report 85-10 LA, 236 p., 21 plates, map scale 1:12,000.
California Department of Conservation, Division of Mines and Geology, 1997, Guidelines for evaluating and mitigating seismic hazards in California: Division of Mines and Geology Special Publication 117, 74 p.
California Department of Conservation, Division of Mines and Geology, 2000, Recommended criteria for delineating seismic hazard zones: Division of Mines and Geology Special Publication 118, 12 p.
Dibblee, T.W. Jr., 1967, Areal geology of the western Mojave Desert: U.S. Geological Survey Professional Paper 522, 153 p.
Dibblee, T.W. Jr., 1997, Geologic map of the Sleepy Valley and Ritter Ridge quadrangles, Los Angeles County, California: Dibblee Geological Foundation Map #DF-66, map scale 1:24,000.
Horn, B.K.P., 1981, Hill shading and the reflectance map: Proceedings of the IEEE, v. 69, no. 1, p. 14-47.
Intermap Corporation, 2002, Global Terrain product handbook and quick start guide: http://www.intermap.com/images/handbook/producthandbook.pdf
Jibson, R.W., 1993, Predicting earthquake-induced landslide displacements using Newmark’s sliding block analysis: Transportation Research Board, National Research Council, Transportation Research Record 1411, 17 p.
Keefer, D.K., 1984, Landslides caused by earthquakes: Geological Society of America Bulletin, v. 95, no. 4, p. 406-421.
McCrink, T.P., 2001, Mapping earthquake-induced landslide hazards in Santa Cruz County in Ferriz, H. and Anderson, R., editors, Engineering geology practice in northern California: California Geological Survey Bulletin 210 / Association of Engineering Geologists Special Publication 12, p.77-94.
McCrink, T.P. and Real, C.R., 1996, Evaluation of the Newmark method for mapping earthquake-induced landslide hazards in the Laurel 7-1/2 Minute Quadrangle, Santa Cruz County, California: California Division of Mines and Geology Final Technical Report for U.S. Geological Survey Contract 143-93-G-2334, U.S. Geological Survey, Reston, Virginia, 31 p.
Newmark, N.M., 1965, Effects of earthquakes on dams and embankments: Geotechnique, v. 15, no. 2, p. 139-160.
CALIFORNIA GEOLOGICAL SURVEY SHZR 105 38
Petersen, M.D., Bryant, W.A., Cramer, C.H., Cao. T., Reichle, M.S., Frankel, A.D., Lienkaemper, J.J., McCrory, P.A. and Schwartz, D.P., 1996, Probabilistic seismic hazard assessment for the State of California: California Department of Conservation, Division of Mines and Geology, Open-File Report 96-08; also U.S. Geological Survey Open-File Report 96-706, 33 p.
Ponti, D.J. and Burke, D.B., 1980, Map showing Quaternary geology of the eastern Antelope Valley and vicinity, California: U.S. Geological Survey Open-File Report 80-1064, map scale 1:62,500.
Smith, T.C., 1996, Preliminary maps of seismic hazard zones and draft guidelines for evaluating and mitigating seismic hazards: California Geology, v. 49, no. 6, p. 147-150.
Southern California Earthquake Center, 2002, Recommended procedures for implementation of DMG Special Publication 117 guidelines for analyzing and mitigating landslide hazards in California: T.F. Blake, R.A. Hollingsworth, and J.P. Stewart, eds., Southern California Earthquake Center, University of Southern California, 108 p. http://www.scec.org/resources/catalog/
U.S. Geological Survey, 1993, Digital Elevation Models: National Mapping Program, Technical Instructions, Data Users Guide 5, 48 p.
Wang, Y., Mercer, J.B., Tao, V.C., Sharma, J., and Crawford, S., 2001, Automatic generation of bald earth digital elevation models from digital surface models created using airborne IFSAR: http://www.intermap.com/
Wilson, R.C. and Keefer, D.K., 1983, Dynamic analysis of a slope failure from the 1979 Coyote Lake, California, earthquake: Bulletin of the Seismological Society of America, v. 73, p. 863-877.
Youd, T.L., 1980, Ground failure displacement and earthquake damage to buildings: American Society of Civil Engineers Conference on Civil Engineering and Nuclear Power, 2d, Knoxville, Tennessee, 1980, v. 2, p. 7-6-2 to 7-6-26.
AIR PHOTOS
I.K. Curtis Services, Inc., Burbank, CA, 1971, black and white, low-sun, taken in morning between 6 and 7 a.m., nominal scale 1:12,000, one flight line centered over San Andreas Fault, #8171-8177.
I.K. Curtis Services, Inc., Burbank, CA, 1971, black and white, low-sun, “north line,” nominal scale 1:12,000, #2124-2131.
I.K. Curtis Services, Inc., Burbank, CA, 1971, black and white, low-sun, “south line,” nominal scale 1:12,000, #2099-2109.

2003 SEISMIC HAZARD ZONE REPORT FOR THE PALMDALE QUADRANGLE 39
I.K. Curtis Services, Inc., Burbank, CA, 3/31/74, black and white, low-sun angle, afternoon 6:00 to 6:15 p.m., scale 1:6,000, one flight line centered over San Andreas Fault, # 2197- 2216.
I.K. Curtis Services, Inc., Burbank, CA, 3/5/74, color, 1:12,000, (flight line centered over San Andreas Fault) # 824-834.
APPENDIX A SOURCE OF ROCK STRENGTH DATA
SOURCE NUMBER OF TESTS SELECTED Los Angeles County Department of
Public Works 24
Ritter Ridge Quadrangle 89 Juniper Hills Quadrangle 34
Littlerock Quadrangle 20 Valyermo Quadrangle 5
Total Number of Shear Tests 172

2003 SEISMIC HAZARD ZONE REPORT FOR THE PALMDALE QUADRANGLE 41
SECTION 3 GROUND SHAKING EVALUATION REPORT
Potential Ground Shaking in the
Palmdale 7.5-Minute Quadrangle, Los Angeles County, California
By
Mark D. Petersen*, Chris H. Cramer*, Geoffrey A. Faneros, Charles R. Real, and Michael S. Reichle
California Department of Conservation
California Geological Survey *Formerly with CGS, now with U.S. Geological Survey
PURPOSE
The Seismic Hazards Mapping Act (the Act) of 1990 (Public Resources Code, Chapter 7.8, Division 2) directs the California Department of Conservation (DOC), Division of Mines and Geology (DMG) [now called California Geological Survey (CGS)] to delineate Seismic Hazard Zones. The purpose of the Act is to reduce the threat to public health and safety and to minimize the loss of life and property by identifying and mitigating seismic hazards. Cities, counties, and state agencies are directed to use the Seismic Hazard Zone Maps in their land-use planning and permitting processes. The Act requires that site-specific geotechnical investigations be performed prior to permitting most urban development projects within the hazard zones. Evaluation and mitigation of seismic hazards are to be conducted under guidelines established by the California State Mining and Geology Board (DOC, 1997). The text of this report is on the Internet at http://gmw.consrv.ca.gov/shmp/webdocs/sp117.pdf
This section of the evaluation report summarizes the ground motions used to evaluate liquefaction and earthquake-induced landslide potential for zoning purposes. Included are ground motion and related maps, a brief overview on how these maps were prepared, precautionary notes concerning their use, and related references. The maps provided

CALIFORNIA GEOLOGICAL SURVEY SHZR 105 42
herein are presented at a scale of approximately 1:150,000 (scale bar provided on maps), and show the full 7.5-minute quadrangle and portions of the adjacent eight quadrangles. They can be used to assist in the specification of earthquake loading conditions for the analysis of ground failure according to the “Simple Prescribed Parameter Value” method (SPPV) described in the site investigation guidelines (DOC, 1997). Alternatively, they can be used as a basis for comparing levels of ground motion determined by other methods with the statewide standard.
This section and Sections 1 and 2 (addressing liquefaction and earthquake-induced landslide hazards) constitute a report series that summarizes development of seismic hazard zone maps in the state. Additional information on seismic hazard zone mapping in California can be accessed on the California Geological Survey's Internet page: http://www.conservation.ca.gov/CGS/index.htm
EARTHQUAKE HAZARD MODEL
The estimated ground shaking is derived from the statewide probabilistic seismic hazard evaluation released cooperatively by the California Department of Conservation, Division of Mines and Geology [California Geological Survey], and the U.S. Geological Survey (Petersen and others, 1996). That report documents an extensive 3-year effort to obtain consensus within the scientific community regarding fault parameters that characterize the seismic hazard in California. Fault sources included in the model were evaluated for long-term slip rate, maximum earthquake magnitude, and rupture geometry. These fault parameters, along with historical seismicity, were used to estimate return times of moderate to large earthquakes that contribute to the hazard.
The ground shaking levels are estimated for each of the sources included in the seismic source model using attenuation relations that relate earthquake shaking with magnitude, distance from the earthquake, and type of fault rupture (strike-slip, reverse, normal, or subduction). The published hazard evaluation of Petersen and others (1996) only considers uniform firm-rock site conditions. In this report, however, we extend the hazard analysis to include the hazard of exceeding peak horizontal ground acceleration (PGA) at 10 percent probability of exceedance in 50 years on spatially uniform conditions of rock, soft rock, and alluvium. These soil and rock conditions approximately correspond to site categories defined in Chapter 16 of the Uniform Building Code (ICBO, 1997), which are commonly found in California. We use the attenuation relations of Boore and others (1997), Campbell (1997), Sadigh and others (1997), and Youngs and others (1997) to calculate the ground motions.
The seismic hazard maps for ground shaking are produced by calculating the hazard at sites separated by about 5 km. Figures 3.1 through 3.3 show the hazard for PGA at 10 percent probability of exceedance in 50 years assuming the entire map area is firm rock, soft rock, or alluvial site conditions respectively. The sites where the hazard is calculated are represented as dots and ground motion contours as shaded regions. The quadrangle of interest is outlined by bold lines and centered on the map. Portions of the eight

������������������������������������������ ������������������������������������������������� ������������������������������������������������� ������������������������������������������������� ������������������������������������������������� �������������������������������������������������
������������������������������������������������� �������������������������������������������������������������������������������������������������������������������������������������������� ������������������������������������������������� �������������������������������������������������
������������������������������������������ ������������������������������������������������� ������������������������������������������������� ������������������������������������������������� ������������������������������������������������� �������������������������������������������������
������������������������������������������������������������������������������������������� ������������������������������������������������� ������������������������������������������������� ������������������������������������������������� �������������������������������������������������
�������������������������������������������������������������������������������������������������������������������������������������������� ������������������������������������������������� ������������������������������������������������� �������������������������������������������������
0.440.440.440.440.440.440.440.440.44 0.460.460.460.460.460.460.460.460.46 0.490.490.490.490.490.490.490.490.49 0.530.530.530.530.530.530.530.530.53 0.590.590.590.590.590.590.590.590.59 0.650.650.650.650.650.650.650.650.65
0.510.510.510.510.510.510.510.510.51 0.550.550.550.550.550.550.550.550.55 0.620.620.620.620.620.620.620.620.62 0.700.700.700.700.700.700.700.700.70 0.820.820.820.820.820.820.820.820.82 0.800.800.800.800.800.800.800.800.80
0.650.650.650.650.650.650.650.650.65 0.750.750.750.750.750.750.750.750.75 0.860.860.860.860.860.860.860.860.86 0.750.750.750.750.750.750.750.750.75 0.650.650.650.650.650.650.650.650.65 0.580.580.580.580.580.580.580.580.58
0.750.750.750.750.750.750.750.750.75 0.660.660.660.660.660.660.660.660.66 0.610.610.610.610.610.610.610.610.61 0.550.550.550.550.550.550.550.550.55 0.500.500.500.500.500.500.500.500.50 0.450.450.450.450.450.450.450.450.45
0.550.550.550.550.550.550.550.550.55 0.500.500.500.500.500.500.500.500.50 0.470.470.470.470.470.470.470.470.47 0.430.430.430.430.430.430.430.430.43 0.400.400.400.400.400.400.400.400.40 0.370.370.370.370.370.370.370.370.37
PALMDALE 7.5 MINUTE QUADRANGLE AND PORTIONS OFADJACENT QUADRANGLES
10% EXCEEDANCE IN 50 YEARS PEAK GROUND ACCELERATION (g)1998
FIRM ROCK CONDITIONS
Department of ConservationCalifornia Geological Survey
Figure 3.1
0 1.5
Miles
3
Base map from GDT
SEISMIC HAZARD EVALUATION OF THE PALMDALE QUADRANGLE 432003

����������������������������������� ������������������������������������������������� ������������������������������������������������� ������������������������������������������������� ������������������������������������������������� �������������������������������������������������
����������������������������������� ������������������������������������������������� ������������������������������������������������� ������������������������������������������������� ������������������������������������������������� �������������������������������������������������
����������������������������������� ������������������������������������������������� ������������������������������������������������� ������������������������������������������������� ������������������������������������������������� �������������������������������������������������
������������������������������������������������������������������������������������ ������������������������������������������������� ������������������������������������������������� ������������������������������������������������� �������������������������������������������������
����������������������������������� ������������������������������������������������� ������������������������������������������������� ������������������������������������������������� ������������������������������������������������� �������������������������������������������������
0.480.480.480.480.480.480.480.480.48 0.510.510.510.510.510.510.510.510.51 0.540.540.540.540.540.540.540.540.54 0.590.590.590.590.590.590.590.590.59 0.640.640.640.640.640.640.640.640.64 0.720.720.720.720.720.720.720.720.72
0.560.560.560.560.560.560.560.560.56 0.610.610.610.610.610.610.610.610.61 0.680.680.680.680.680.680.680.680.68 0.760.760.760.760.760.760.760.760.76 0.870.870.870.870.870.870.870.870.87 0.850.850.850.850.850.850.850.850.85
0.710.710.710.710.710.710.710.710.71 0.810.810.810.810.810.810.810.810.81 0.900.900.900.900.900.900.900.900.90 0.810.810.810.810.810.810.810.810.81 0.710.710.710.710.710.710.710.710.71 0.640.640.640.640.640.640.640.640.64
0.810.810.810.810.810.810.810.810.81 0.720.720.720.720.720.720.720.720.72 0.670.670.670.670.670.670.670.670.67 0.610.610.610.610.610.610.610.610.61 0.550.550.550.550.550.550.550.550.55 0.500.500.500.500.500.500.500.500.50
0.610.610.610.610.610.610.610.610.61 0.550.550.550.550.550.550.550.550.55 0.530.530.530.530.530.530.530.530.53 0.480.480.480.480.480.480.480.480.48 0.440.440.440.440.440.440.440.440.44 0.410.410.410.410.410.410.410.410.41
PALMDALE 7.5 MINUTE QUADRANGLE AND PORTIONS OFADJACENT QUADRANGLES
10% EXCEEDANCE IN 50 YEARS PEAK GROUND ACCELERATION (g)
1998SOFT ROCK CONDITIONS
Department of ConservationCalifornia Geological Survey
Figure 3.2
0 1.5
Miles
3
Base map from GDT
SEISMIC HAZARD EVALUATION OF THE PALMDALE QUADRANGLE44 SHZR105

������������������������������������������������� ������������������������������������������������� ������������������������������������������������� ������������������������������������������������� �������������������������������������������������
�������������������������������������������������������������������������������������������������� ������������������������������������������������� ������������������������������������������������� �������������������������������������������������
������������������������������������������������� ������������������������������������������������� ������������������������������������������������� ������������������������������������������������� �������������������������������������������������
0.520.520.520.520.520.520.520.520.52 0.540.540.540.540.540.540.540.540.54 0.560.560.560.560.560.560.560.560.56 0.600.600.600.600.600.600.600.600.60 0.640.640.640.640.640.640.640.640.64 0.690.690.690.690.690.690.690.690.69
0.580.580.580.580.580.580.580.580.58 0.610.610.610.610.610.610.610.610.61 0.660.660.660.660.660.660.660.660.66 0.710.710.710.710.710.710.710.710.71 0.750.750.750.750.750.750.750.750.75 0.750.750.750.750.750.750.750.750.75
0.680.680.680.680.680.680.680.680.68 0.730.730.730.730.730.730.730.730.73 0.820.820.820.820.820.820.820.820.82 0.730.730.730.730.730.730.730.730.73 0.680.680.680.680.680.680.680.680.68 0.630.630.630.630.630.630.630.630.63
0.730.730.730.730.730.730.730.730.73 0.690.690.690.690.690.690.690.690.69 0.650.650.650.650.650.650.650.650.65 0.600.600.600.600.600.600.600.600.60 0.560.560.560.560.560.560.560.560.56 0.520.520.520.520.520.520.520.520.52
0.600.600.600.600.600.600.600.600.60 0.560.560.560.560.560.560.560.560.56 0.540.540.540.540.540.540.540.540.54 0.500.500.500.500.500.500.500.500.50 0.470.470.470.470.470.470.470.470.47 0.440.440.440.440.440.440.440.440.44
PALMDALE 7.5 MINUTE QUADRANGLE AND PORTIONS OFADJACENT QUADRANGLES
10% EXCEEDANCE IN 50 YEARS PEAK GROUND ACCELERATION (g)1998
ALLUVIUM CONDITIONS
Department of ConservationCalifornia Geological Survey
Figure 3.3
0 1.5
Miles
3
Base map from GDT
SEISMIC HAZARD EVALUATION OF THE PALMDALE QUADRANGLE2003 45

CALIFORNIA GEOLOGICAL SURVEY SHZR 105 46
adjacent quadrangles are also shown so that the trends in the ground motion may be more apparent. We recommend estimating ground motion values by selecting the map that matches the actual site conditions, and interpolating from the calculated values of PGA rather than the contours, since the points are more accurate.
APPLICATIONS FOR LIQUEFACTION AND LANDSLIDE HAZARD ASSESSMENTS
Deaggregation of the seismic hazard identifies the contribution of each of the earthquakes (various magnitudes and distances) in the model to the ground motion hazard for a particular exposure period (see Cramer and Petersen, 1996). The map in Figure 3.4 identifies the magnitude and the distance (value in parentheses) of the earthquake that contributes most to the hazard at 10 percent probability of exceedance in 50 years on alluvial site conditions (predominant earthquake). This information gives a rationale for selecting a seismic record or ground motion level in evaluating ground failure. However, it is important to keep in mind that more than one earthquake may contribute significantly to the hazard at a site, and those events can have markedly different magnitudes and distances. For liquefaction hazard the predominant earthquake magnitude from Figure 3.4 and PGA from Figure 3.3 (alluvium conditions) can be used with the Youd and Idriss (1997) approach to estimate cyclic stress ratio demand. For landslide hazard the predominant earthquake magnitude and distance can be used to select a seismic record that is consistent with the hazard for calculating the Newmark displacement (Wilson and Keefer, 1983). When selecting the predominant earthquake magnitude and distance, it is advisable to consider the range of values in the vicinity of the site and perform the ground failure analysis accordingly. This would yield a range in ground failure hazard from which recommendations appropriate to the specific project can be made. Grid values for predominant earthquake magnitude and distance should not be interpolated at the site location, because these parameters are not continuous functions.
A preferred method of using the probabilistic seismic hazard model and the “simplified Seed-Idriss method” of assessing liquefaction hazard is to apply magnitude scaling probabilistically while calculating peak ground acceleration for alluvium. The result is a “magnitude-weighted” ground motion (liquefaction opportunity) map that can be used directly in the calculation of the cyclic stress ratio threshold for liquefaction and for estimating the factor of safety against liquefaction (Youd and Idriss, 1997). This can provide a better estimate of liquefaction hazard than use of predominate magnitude described above, because all magnitudes contributing to the estimate are used to weight the probabilistic calculation of peak ground acceleration (Real and others, 2000). Thus, large distant earthquakes that occur less frequently but contribute more to the liquefaction hazard are appropriately accounted for.
Figure 3.5 shows the magnitude-weighted alluvial PGA based on Idriss’ weighting function (Youd and Idriss, 1997). It is important to note that the values obtained from this map are pseudo-accelerations and should be used in the formula for factor of safety without any magnitude-scaling (a factor of 1) applied.

������������������������������������������������� ������������������������������������������������� ������������������������������������������������� ������������������������������������������������� ������������������������������������������������� �������������������������������������������������
������������������������������������������������� ������������������������������������������������� ������������������������������������������������� ������������������������������������������������� ������������������������������������������������� �������������������������������������������������
������������������������������������������������� ������������������������������������������������� ������������������������������������������������� ������������������������������������������������� ������������������������������������������������� �������������������������������������������������
������������������������������������������������� ������������������������������������������������� ������������������������������������������������� �������������������������������������������������������������������������������������������������� �������������������������������������������������
������������������������������������������������� ������������������������������������������������� ������������������������������������������������� ������������������������������������������������� ������������������������������������������������� �������������������������������������������������
7.87.87.87.87.87.87.87.87.8 7.87.87.87.87.87.87.87.87.8 7.87.87.87.87.87.87.87.87.8 7.87.87.87.87.87.87.87.87.8 7.87.87.87.87.87.87.87.87.8 7.87.87.87.87.87.87.87.87.8
7.87.87.87.87.87.87.87.87.8 7.87.87.87.87.87.87.87.87.8 7.87.87.87.87.87.87.87.87.8 7.87.87.87.87.87.87.87.87.8 7.87.87.87.87.87.87.87.87.8 7.87.87.87.87.87.87.87.87.8
7.87.87.87.87.87.87.87.87.8 7.87.87.87.87.87.87.87.87.8 7.87.87.87.87.87.87.87.87.8 7.87.87.87.87.87.87.87.87.8 7.87.87.87.87.87.87.87.87.8 7.87.87.87.87.87.87.87.87.8
7.87.87.87.87.87.87.87.87.8 7.87.87.87.87.87.87.87.87.8 7.87.87.87.87.87.87.87.87.8 7.87.87.87.87.87.87.87.87.8 7.87.87.87.87.87.87.87.87.8 7.87.87.87.87.87.87.87.87.8
7.87.87.87.87.87.87.87.87.8 7.87.87.87.87.87.87.87.87.8 7.87.87.87.87.87.87.87.87.8 7.87.87.87.87.87.87.87.87.8 7.87.87.87.87.87.87.87.87.8 7.87.87.87.87.87.87.87.87.8
(12)(12)(12)(12)(12)(12)(12)(12)(12) (12)(12)(12)(12)(12)(12)(12)(12)(12) (12)(12)(12)(12)(12)(12)(12)(12)(12) (7)(7)(7)(7)(7)(7)(7)(7)(7) (7)(7)(7)(7)(7)(7)(7)(7)(7) (2)(2)(2)(2)(2)(2)(2)(2)(2)
(7)(7)(7)(7)(7)(7)(7)(7)(7) (7)(7)(7)(7)(7)(7)(7)(7)(7) (7)(7)(7)(7)(7)(7)(7)(7)(7) (2)(2)(2)(2)(2)(2)(2)(2)(2) (2)(2)(2)(2)(2)(2)(2)(2)(2) (2)(2)(2)(2)(2)(2)(2)(2)(2)
(2)(2)(2)(2)(2)(2)(2)(2)(2) (2)(2)(2)(2)(2)(2)(2)(2)(2) (2)(2)(2)(2)(2)(2)(2)(2)(2) (2)(2)(2)(2)(2)(2)(2)(2)(2) (2)(2)(2)(2)(2)(2)(2)(2)(2) (7)(7)(7)(7)(7)(7)(7)(7)(7)
(2)(2)(2)(2)(2)(2)(2)(2)(2) (2)(2)(2)(2)(2)(2)(2)(2)(2) (7)(7)(7)(7)(7)(7)(7)(7)(7) (7)(7)(7)(7)(7)(7)(7)(7)(7) (7)(7)(7)(7)(7)(7)(7)(7)(7) (12)(12)(12)(12)(12)(12)(12)(12)(12)
(7)(7)(7)(7)(7)(7)(7)(7)(7) (7)(7)(7)(7)(7)(7)(7)(7)(7) (12)(12)(12)(12)(12)(12)(12)(12)(12) (12)(12)(12)(12)(12)(12)(12)(12)(12) (12)(12)(12)(12)(12)(12)(12)(12)(12) (17)(17)(17)(17)(17)(17)(17)(17)(17)
PALMDALE 7.5 MINUTE QUADRANGLE AND PORTIONS OFADJACENT QUADRANGLES
10% EXCEEDANCE IN 50 YEARS PEAK GROUND ACCELERATION1998
PREDOMINANT EARTHQUAKE Magnitude (Mw) (Distance (km))
Department of ConservationCalifornia Geological Survey0 1.5
Miles
3
Figure 3.4
Base map from GDT
SEISMIC HAZARD EVALUATION OF THE PALMDALE QUADRANGLE2003 47

���������������������
���������������������
������������������������������������������������� ������������������������������������������������� ������������������������������������������������� ������������������������������������������������� �������������������������������������������������
������������������������������������������������� ������������������������������������������������� ������������������������������������������������� ������������������������������������������������� �������������������������������������������������
���������������������
���������������������
���������������������
������������������������������������������������� ������������������������������������������������� ������������������������������������������������� ������������������������������������������������� �������������������������������������������������
������������������������������������������������� ������������������������������������������������� ������������������������������������������������� ������������������������������������������������� �������������������������������������������������
������������������������������������������������� ������������������������������������������������� ������������������������������������������������� ������������������������������������������������� �������������������������������������������������
0.510.510.510.510.510.510.510.510.51 0.540.540.540.540.540.540.540.540.54 0.570.570.570.570.570.570.570.570.57 0.610.610.610.610.610.610.610.610.61 0.660.660.660.660.660.660.660.660.66 0.710.710.710.710.710.710.710.710.71
0.590.590.590.590.590.590.590.590.59 0.640.640.640.640.640.640.640.640.64 0.680.680.680.680.680.680.680.680.68 0.740.740.740.740.740.740.740.740.74 0.780.780.780.780.780.780.780.780.78 0.780.780.780.780.780.780.780.780.78
0.710.710.710.710.710.710.710.710.71 0.760.760.760.760.760.760.760.760.76 0.790.790.790.790.790.790.790.790.79 0.760.760.760.760.760.760.760.760.76 0.710.710.710.710.710.710.710.710.71 0.650.650.650.650.650.650.650.650.65
0.760.760.760.760.760.760.760.760.76 0.710.710.710.710.710.710.710.710.71 0.680.680.680.680.680.680.680.680.68 0.630.630.630.630.630.630.630.630.63 0.580.580.580.580.580.580.580.580.58 0.540.540.540.540.540.540.540.540.54
0.630.630.630.630.630.630.630.630.63 0.580.580.580.580.580.580.580.580.58 0.560.560.560.560.560.560.560.560.56 0.520.520.520.520.520.520.520.520.52 0.480.480.480.480.480.480.480.480.48 0.460.460.460.460.460.460.460.460.46
PALMDALE 7.5 MINUTE QUADRANGLE AND PORTIONS OFADJACENT QUADRANGLES
10% EXCEEDANCE IN 50 YEARS MAGNITUDE-WEIGHTED PSEUDO-PEAK ACCELERATION (g) FOR ALLUVIUM
1998LIQUEFACTION OPPORTUNITY
Department of ConservationCalifornia Geological Survey
Figure 3.5
0 1.5
Miles
3
Base map from GDT
SEISMIC HAZARD EVALUATION OF THE PALMDALE QUADRANGLE 482003

2003 SEISMIC HAZARD ZONE REPORT FOR THE PALMDALE QUADRANGLE 49
USE AND LIMITATIONS
The statewide map of seismic hazard has been developed using regional information and is not appropriate for site specific structural design applications. Use of the ground motion maps prepared at larger scale is limited to estimating earthquake loading conditions for preliminary assessment of ground failure at a specific location. We recommend consideration of site-specific analyses before deciding on the sole use of these maps for several reasons.
1. The seismogenic sources used to generate the peak ground accelerations were digitized from the 1:750,000-scale fault activity map of Jennings (1994). Uncertainties in fault location are estimated to be about 1 to 2 kilometers (Petersen and others, 1996). Therefore, differences in the location of calculated hazard values may also differ by a similar amount. At a specific location, however, the log-linear attenuation of ground motion with distance renders hazard estimates less sensitive to uncertainties in source location.
2. The hazard was calculated on a grid at sites separated by about 5 km (0.05 degrees). Therefore, the calculated hazard may be located a couple kilometers away from the site. We have provided shaded contours on the maps to indicate regional trends of the hazard model. However, the contours only show regional trends that may not be apparent from points on a single map. Differences of up to 2 km have been observed between contours and individual ground acceleration values. We recommend that the user interpolate PGA between the grid point values rather than simply using the shaded contours.
3. Uncertainties in the hazard values have been estimated to be about +/- 50 percent of the ground motion value at two standard deviations (Cramer and others, 1996).
4. Not all active faults in California are included in this model. For example, faults that do not have documented slip rates are not included in the source model. Scientific research may identify active faults that have not been previously recognized. Therefore, future versions of the hazard model may include other faults and omit faults that are currently considered.
5. A map of the predominant earthquake magnitude and distance is provided from the deaggregation of the probabilistic seismic hazard model. However, it is important to recognize that a site may have more than one earthquake that contributes significantly to the hazard. Therefore, in some cases earthquakes other than the predominant earthquake should also be considered.
Because of its simplicity, it is likely that the SPPV method (DOC, 1997) will be widely used to estimate earthquake shaking loading conditions for the evaluation of ground failure hazards. It should be kept in mind that ground motions at a given distance from an earthquake will vary depending on site-specific characteristics such as geology, soil properties, and topography, which may not have been adequately accounted for in the regional hazard analysis. Although this variance is represented to some degree by the recorded ground motions that form the basis of the hazard model used to produce Figures 3.1, 3.2, and 3.3, extreme deviations can occur. More sophisticated methods that take into account other factors that may be present at the site (site amplification, basin effects, near source effects, etc.) should be employed as warranted. The decision to use the SPPV
CALIFORNIA GEOLOGICAL SURVEY SHZR 105 50
method with ground motions derived from Figures 3.1, 3.2, or 3.3 should be based on careful consideration of the above limitations, the geotechnical and seismological aspects of the project setting, and the “importance” or sensitivity of the proposed building with regard to occupant safety.
REFERENCES
Boore, D.M., Joyner, W.B. and Fumal, T.E., 1997, Empirical near-source attenuation relationships for horizontal and vertical components of peak ground acceleration, peak ground velocity, and pseudo-absolute acceleration response spectra: Seismological Research Letters, v. 68, p. 154-179.
California Department of Conservation, Division of Mines and Geology, 1997, Guidelines for evaluating and mitigating seismic hazards in California: Special Publication 117, 74 p.
Campbell, K.W., 1997, Attenuation relationships for shallow crustal earthquakes based on California strong motion data: Seismological Research Letters, v. 68, p. 180-189.
Cramer, C.H. and Petersen, M.D., 1996, Predominant seismic source distance and magnitude maps for Los Angeles, Orange and Ventura counties, California: Bulletin of the Seismological Society of America, v. 85, no. 5, p. 1645-1649.
Cramer, C.H., Petersen, M.D. and Reichle, M.S., 1996, A Monte Carlo approach in estimating uncertainty for a seismic hazard assessment of Los Angeles, Ventura, and Orange counties, California: Bulletin of the Seismological Society of America, v. 86, p. 1681-1691.
International Conference of Building Officials (ICBO), 1997, Uniform Building Code: v. 2, Structural engineering and installation standards, 492 p.
Jennings, C.W., compiler, 1994, Fault activity map of California and adjacent areas: California Department of Conservation, Division of Mines and Geology, California Geologic Data Map Series, map no. 8.
Petersen, M.D., Bryant, W.A., Cramer, C.H., Cao, T., Reichle, M.S., Frankel, A.D., Lienkaemper, J.J., McCrory, P.A. and Schwartz, D.P., 1996, Probabilistic seismic hazard assessment for the State of California: California Department of Conservation, Division of Mines and Geology Open-File Report 96-08; also U.S. Geological Survey Open-File Report 96-706, 33 p.
Real, C.R., Petersen, M.D., McCrink, T.P. and Cramer, C.H., 2000, Seismic Hazard Deaggregation in zoning earthquake-induced ground failures in southern California: Proceedings of the Sixth International Conference on Seismic Zonation, November 12-15, Palm Springs, California, EERI, Oakland, CA.

2003 SEISMIC HAZARD ZONE REPORT FOR THE PALMDALE QUADRANGLE 51
Sadigh, K., Chang, C.-Y., Egan, J.A., Makdisi, F. and Youngs, R.R., 1997, SEA96- A new predictive relation for earthquake ground motions in extensional tectonic regimes: Seismological Research Letters, v. 68, p. 190-198.
Wilson, R.C. and Keefer, D.K., 1983, Dynamic analysis of a slope failure from the 1979 Coyote Lake, California, Earthquake: Bulletin of the Seismological Society of America, v. 73, p. 863-877.
Youd, T.L. and Idriss I.M., 1997, Proceedings of the NCEER workshop on evaluation of liquefaction resistance of soils: Technical Report NCEER-97-0022, 40 p.
Youngs, R.R., Chiou, S.-J., Silva, W.J. and Humphrey, J.R., 1997, Stochastic point-source modeling of ground motions in the Cascadia Region: Seismological Research Letters, v. 68, p. 74-85.