Seismic Design and Behavior Outline of Presentation of ... · PDF fileSeismic Design and...
14
June 4, 2003 1 Seismic Design and Behavior Seismic Design and Behavior of Composite (RCS) Frames of Composite (RCS) Frames Gregory G. Deierlein Stanford University with contributions by Paul Cordova (SGH), Sameh Mehanny (Univ. of Cairo), Sherif El-Tawil (Univ. of Michigan), Ryoichi Kanno (Nippon Steel), & others Gregory G. Gregory G. Deierlein Deierlein Stanford University Stanford University with contributions by Paul Cordova (SGH), with contributions by Paul Cordova (SGH), Sameh Sameh Mehanny Mehanny (Univ. of Cairo), (Univ. of Cairo), Sherif Sherif El El-Tawil Tawil (Univ. of Michigan), Ryoichi (Univ. of Michigan), Ryoichi Kanno Kanno (Nippon Steel), & others (Nippon Steel), & others Acknowledgments: National Science Foundation (USA), National Science Council (TW) Pacific Earthquake Engineering Research (PEER) Center National Center for Research in Earthquake Engineering (TW) Earthquake Engineering Research Institute Nippon Steel Corporation, American Institute of Steel Construction Acknowledgments: National Science Foundation (USA), National Science Council (TW) Pacific Earthquake Engineering Research (PEER) Center National Center for Research in Earthquake Engineering (TW) Earthquake Engineering Research Institute Nippon Steel Corporation, American Institute of Steel Construction Outline of Presentation • Background & Applications • Composite RCS Beam-Column Joints • Large Scale Composite RCS Frame Test – Design/Construction/Testing – Analysis and Interpretation • The New Frontier Early “Mixed” System Texas Commerce Plaza • 75-story, RC perimeter frame • 1982, Houston, TX • CBM Engineers, Houston Three Houston Center • 52-story RCS perimeter frame • 1983, Houston TX • Walter P. Moore Associates Norwest Center Building • Composite “Mega-Frame” • Minneapolis, MN, 1987 • CBM Engrs., Houston, TX
Transcript of Seismic Design and Behavior Outline of Presentation of ... · PDF fileSeismic Design and...
June 4, 2003
1
Seismic Design and BehaviorSeismic Design and Behaviorof Composite (RCS) Framesof Composite (RCS) Frames
Gregory G. DeierleinStanford University
with contributions by Paul Cordova (SGH), Sameh Mehanny(Univ. of Cairo), Sherif El-Tawil (Univ. of Michigan), Ryoichi
Kanno (Nippon Steel), & others
Gregory G. Gregory G. DeierleinDeierleinStanford UniversityStanford University
with contributions by Paul Cordova (SGH), with contributions by Paul Cordova (SGH), SamehSameh MehannyMehanny(Univ. of Cairo), (Univ. of Cairo), SherifSherif ElEl--TawilTawil (Univ. of Michigan), Ryoichi (Univ. of Michigan), Ryoichi
KannoKanno (Nippon Steel), & others(Nippon Steel), & others
Acknowledgments:National Science Foundation (USA), National Science Council (TW)
Pacific Earthquake Engineering Research (PEER) CenterNational Center for Research in Earthquake Engineering (TW)
Earthquake Engineering Research InstituteNippon Steel Corporation, American Institute of Steel Construction
Outline of Presentation
• Background & Applications
• Composite RCS Beam-Column Joints
• Large Scale Composite RCS Frame Test– Design/Construction/Testing– Analysis and Interpretation
• The New Frontier
Early “Mixed” System
Texas Commerce Plaza• 75-story, RC perimeter frame
• 1982, Houston, TX
• CBM Engineers, Houston
Three Houston Center• 52-story RCS perimeter frame
• 1983, Houston TX
• Walter P. Moore Associates
Norwest Center Building• Composite “Mega-Frame”
• Minneapolis, MN, 1987
• CBM Engrs., Houston, TX

June 4, 2003
2
Composite Column
Beam-Column Joint
Face Bearing Plate
Vertical Joint Reinforcement
Mellon Bank Tower• 55 Story (1991)• Composite Moment
Perimeter Frame & Composite Core
• WSP Cantor Steinuk
U.S. Design/Construction Practice
• Composite construction evolved as a variation of steel construction with most applications for mid-to high-rise building structures.
• Advantages of Composite– Economy of concrete in vertical members – Speed of construction– Versatility in design and construction
• Disadvantages of Composite– Mixing of construction trades– Lack of design standards, guidelines, etc.
Japanese RCS Systems
• Low-rise construction (3-5 stories)– Shopping centers and offices– About 100 RCS buildings in Japan
• Construction Methods– Precast columns– Cast-in-place with rebar erection columns
• High-Seismic Regions
CastCast--inin--Place RCS ConstructionPlace RCS Construction
steel beam
steel erectioncolumn
reinforcingbar cage
formwork
RC column
Steel Erection FrameCast-in-Place
Reinforcing Bar CageReplaces Steel
Erection Column(Japanese Construction Co.)
PrePre--Cast RCS ConstructionCast RCS Construction
Precast Beam-ColumnModules
RC Column
Steel BandPlate
Steel BeamReinforce Bars
Grouted Splices
> 2(beam depth)
Bolted BeamSplices
Shimizu Corporation, Japan

June 4, 2003
3
Advantages for Seismic DesignAdvantages for Seismic Design““postpost--NorthridgeNorthridge””
steel beam continuous through joint
avoids welding at location of maximum forces
stable hysteretic behavior““ThroughThrough--BeamBeam”” DetailDetail
Steel Beam
Reinforced Concrete Column
Steel Band Plate
Face BearingPlate
Longitudinal Reinforcement
Tie Reinforcement
Stiffener
US Seismic Design Standards
• ASCE/SEI 7 (2005) & IBC (2006)– based on 1994 & 1997 NEHRP– general criteria for systems, members and connections
• AISC Seismic Provisions - Part II Composite (2005)– based on 1994 NEHRP chapter on composite structures– criteria for composite systems, members, connections
• AISC (2005) and ACI-318 (2005)– steel and RC members and connections– composite beams and columns (limited)
• ASCE RCS Connection Design Guidelines (1994, 2007)
20 Story Design Example
6 @ 20ft
5 @ 20ft
Structural Layout
Specifications– 20-story “SAC” frame– Perimeter frame system– IBC 2006
Ss = 1.5gS1 = 0.72g
– R = 8, Cd = 5.5
Mid-Rise:Competitive with Steel Frame
Controlling Design Criteria– Strength– SCWB– Drift
Steel vs. RCS DesignRCS Frame Design
• Beams: W24 – W30– Steel quantity: 3.0psf
• Columns– 30” x 35”, 30” x 30”– Concrete quantity:
0.16ft3/ft2; rebar 1.4psf
• Gravity Framing– Steel quantity: 7.6psf
Steel Frame Design
• Beams: W24 – W30– Steel quantity: 3.0psf
• Columns– W24x335,W24x279– Steel quantity: 4.8psf
• Gravity Framing– Steel quantity: 7.6psf
Beam-Column Joint Design
• Joint size is dictated by member designs• Strength based on ASCE guidelines• Simple joint detail develops Mp,beams
Steel bandSteel Band Plate
Face Bearing Plate
Steel BeamRC Column
Outline of Presentation
• Background & Applications
• Composite RCS Beam-Column Joints
• Large Scale Composite RCS Frame Test– Design/Construction/Testing– Analysis and Interpretation
• The Future Frontier

June 4, 2003
4
Steel Beam
Reinforced Concrete Column
Steel Band Plate
Face BearingPlate
Longitudinal Reinforcement
Tie Reinforcement
Stiffener
RCS BeamRCS Beam--Column Connection Column Connection Tests & Design GuidelinesTests & Design Guidelines
Research 1985 - 2004*:
• Transfer Mechanisms
• Details (band plates, etc.)
• Cyclic Behavior
• Exterior & 2-way joints
• Concrete Slab
• High Strength Concrete
• Fiber Concrete …““throughthrough--beambeam”” detaildetail
* total database of 400+ tests (world wide)
Connection Tests & Design Models• US Research & Guidelines
Deierlein & Sheikh, UT Austin, 1989Kanno & Deierlein, Cornell Univ., 1994Parra-Montesinos and Wight, Univ. of Michigan, 2000Bracci et al., Texas A&M, 2000
• Japanese Research & GuidelinesAIJ-SRC method (1987)Modified AIJ-SRC (Izaki et al., Sakaguchi, etc.; 1988-97)Kim and Noguchi (1998) Nishimura-Minami model (1989)
• ASCE Guidelines (1994, 2007 update)
Deierlein et al., UT Austin, 1989
Composite Beam-Column Joint Tests
TypicalTypicalJoint DetailJoint Detail
TJD = 0.01 TJD = 0.01 radrad(after 2 cycles)(after 2 cycles)
TJD > 0.05 TJD > 0.05 radradExposed CoreExposed Core
(Deierlein, 1989; Kanno, 1993)
COLUMN
BEAM
PLASTIC HINGE
Modes of Subassembly FailureModes of Subassembly Failure
BeamBeamJointJoint MixedMixed Beam-HingingJoint Panel Shear
Modes of Subassembly FailureModes of Subassembly Failure

June 4, 2003
5
Modes of Subassembly Failure
Beam Hinging Joint Shear
-100 -50 0 50 100
Displacement (mm)
-200
-100
0
100
200
Bea
m S
hear
(kN
)
µ = 1 2 3 4
-100 -50 0 50 100Displacement (mm)
-200
-100
0
100
200
Bea
m S
hear
(kN
)
µ = 1 2 3 4Connection Behavior & Design Model
Outer Panel Inner Panel Outer Panel
Inner Panel Failure Modes
Bearing failure Panel shear failure
Vtv
Concrete crushing
Gap
Concrete crushing
Kinking Panel shear yielding
Vth
Mbi
Vbi
Inner Panel Failure Modes
Panel shear failure Bearing failure
Typical Through-Beam DetailsE-FBP
FBP / W-FBP
Face bearing plate (FBP) E-FBP
Small column
Small columnVJR
Vertical joint reinf. (VJR)
Steel band
Transverse beam
Steel band Transverse beam
Basic Equations for Model (Kanno)
• Each element strength is calculated by the smaller of two modes:
• Strengths are added:
• Important aspect:– Simultaneous failure of
inner and outer elements for entire joint failure
V b = V bi + V bo
V bi = min Vbe , V swc{ }
V bo = min Vbo , V scf{ }
Vbe
VscfVbo
Vswc
Outer element
Bearing Panel shear
ShearBond
Inner element

June 4, 2003
6
Vertical Bearing failure
Panel shear failure
Gap
Concrete crushing
Kinking Panel shear yielding
Vtv
Concrete crushing
Gap
Concre crus
KVth
Mbi
Vbi
Joint Failure Models
• 1994 ASCE Joint design model– Deierlein & Sheikh, UT Austin, 1989
• Follow-on studies– Kanno et al. 1994
– Parra-Montesinos et al. 2000, 2003
– Bracci et al. 2000
• 2007 Updated Guidelines
– Synthesized past work
– NCREE testing program results
– Updated models and incorporated new details 0
0.2
0.4
0.6
0.8
1
1.2
1.4
Vbc
/Vbe
KA
NN
O O
JB1-
0
KA
NN
O O
JB4-
0
KA
NN
O O
JB5-
0
KA
NN
O O
JB6-
1
SH
EIK
H 2
SH
EIK
H 6
Joint Bearing Failure
Mean = 0.94COV = 0.076
ASCEUpdated
Vertical bearing failurePr
edic
ted/
Mea
sure
d St
reng
th
0
0.2
0.4
0.6
0.8
1
1.2
1.4
Vbc
/Vbe
KA
NN
O O
JS1-
1K
ANN
O 0
JS2-
0K
AN
NO
OJS
3-0
KA
NN
O O
JS4-
1K
AN
NO
OJS
5-0
KA
NN
O O
JS6-
0K
ANN
O 0
JS7-
0K
ANN
O H
JS1-
0K
ANN
O H
JS2-
0D
EIER
LEIN
10
DEI
ERLE
IN 1
1D
EIER
LEIN
13
DEI
ERLE
IN 1
5D
EIER
LEIN
17
SH
EIK
H 4
SH
EIK
H 5
SH
EIK
H 7
SH
EIK
H 8
PAR
RA
1P
ARR
A 6
PAR
RA
9
Joint Panel Shear Failure
Mean = 0.97COV = 0.135
ASCEUpdated
Panel shear failure
Pred
icte
d/M
easu
red
Stre
ngth
Outline of Presentation
• Background & Applications
• Composite RCS Beam-Column Joints
• Large Scale Composite RCS Frame Test– Design/Construction/Testing– Analysis and Interpretation
• The Future Frontier
FullFull--Scale 3Scale 3--Story, 3Story, 3--Bay Bay Composite Moment FrameComposite Moment FrameNCREE, Taipei, TaiwanNCREE, Taipei, Taiwan
Rationale for Full-Scale Test
1. PROOF OF CONCEPT for innovative systems: construction, design, and performance
2. BEHAVIORAL EFFECTS: complete system study, precast & bolted splices, composite beam/slab, load introduction, etc.
3. CALIBRATION & VALIDATION of analysis models
4. DATA for performance-based earthquake engineering: (large deformations, immediate occupancy through near-collapse)
5. CAPSTONE project for past 20 years of research
6. DEMONSTRATE RELIABILITY for high seismic zones
Full Scale 3Full Scale 3--Story TestStory TestCollaborators: Dr. K.C. Tsai, C.H. Chen, W.C. LaiCollaborators: Dr. K.C. Tsai, C.H. Chen, W.C. Lai
Designed per IBC Designed per IBC 20032003
NCREE lab in NCREE lab in Taipei, TaiwanTaipei, Taiwan
4 Pseudo4 Pseudo--dynamic dynamic EQEQ’’s and final s and final static pushoverstatic pushover
Complementary Complementary subassembly testssubassembly tests
Columns Columns -- 650x650650x650mm, mm, ρρgg = 0.03= 0.03Beams Beams –– 11--600x200600x200mmmm, 2, 2--500x200500x200mmmm, 3, 3--400x200400x200mmmm
1.2m
1m
Seismic Design CriteriaSeismic Design Criteria
IBC 2003IBC 2003Design Hazard (SDesign Hazard (SDSDS = 1 g; 10% in 50 year)= 1 g; 10% in 50 year)R = 8 (Composite Special Moment Frame)R = 8 (Composite Special Moment Frame)
Drift: Drift: ∆∆dd**CCdd < 0.02h< 0.02hPeriod: 1.2TPeriod: 1.2Taa = 0.6 sec= 0.6 secAccidental torsion (7.5% increase in V/W)Accidental torsion (7.5% increase in V/W)
Design Base ShearDesign Base ShearV/W = (SV/W = (SDSDS/R)*1.075 = 0.134/R)*1.075 = 0.134V = 261 kips = 1161kNV = 261 kips = 1161kN

June 4, 2003
7
Governing CriteriaGoverning Criteria
BeamsBeams
Sized for strength (1.42D+0.5L+E) Sized for strength (1.42D+0.5L+E)
ColumnsColumns
Controlled by SCWB Controlled by SCWB
Composite JointsComposite Joints
Standard details (fulfills SJWB criterion)Standard details (fulfills SJWB criterion)
Drift Criteria is automatically satisfiedDrift Criteria is automatically satisfied
Precast Plant
1 2
34
1st Floor Beam-Column Modules
Piece TogetherBeam-Column
Modules Temporary Bracing
1st Floor Steel Beams
Lift steel beaminto place
Fasten the beam splice connection
1st Floor Steel Beams 1st Floor Loading Beam
LoadingBeam

June 4, 2003
8
Grouting 1st Floor Splice2nd & 3rd Floors
+ 2 Days
FullFull--Scale 3Scale 3--Story, 3Story, 3--Bay Bay Composite Moment FrameComposite Moment FrameNCREE, Taipei, TaiwanNCREE, Taipei, Taiwan
3 Actuators per floor3 Actuators per floor1000kN, 1000kN, ±±500mm stroke500mm stroke PseudoPseudo--Dynamic Testing MethodDynamic Testing Method
M a + C v + K d = fR
These can all be modeled analytically in the computer
Compute by step-by-stepintegration procedure(Newmark Explicit)
Impose di+1 &recover forces
Test Frame
=d3
d2
d1m1
m2
m3
36 DOF
Static Condensation - 3DOFGround Acc.
Input Ground MotionsInput Ground Motions
EQ#1 EQ#1 –– 50%in50yr50%in50yr ChiChi--Chi RecordChi Record
EQ#2 EQ#2 –– 10%in50yr10%in50yr Loma Prieta RecordLoma Prieta Record
EQ#3 EQ#3 –– 2%in50yr2%in50yr ChiChi--Chi RecordChi Record
EQ#4 EQ#4 –– 10%in50yr 10%in50yr Loma Prieta RecordLoma Prieta Record
Final Static Pushover Final Static Pushover (RDR ~ 8%)(RDR ~ 8%) (IBC 2003)(IBC 2003)
0 5 10 15 20 25 30 35 40-0.3
-0.2
-0.1
0
0.1
0.2
0.3
Acc
eler
atio
n (g
)
Time (sec)
1989 Loma Prieta Earthquake
Acc
eler
atio
n (g
)
Time (s)
0 5 10 15 20 25 30 35 40 45-0.3
-0.2
-0.1
0
0.1
0.2
0.3
Time (sec)
Acc
eler
atio
n (g
) 1999 Chi–Chi Earthquake
Acc
eler
atio
n (g
)
Time (s)
0 0.5 1 1.5 2 2.5 30
0.2
0.4
0.6
0.8
1
1.2
Sa (g
)
Period (sec)
Chi Chi Eq.Loma Prieta Eq.
Response SpectrumUnscaled Records
Tn=1secSa (g
)
Period (s)
Scaled to 0.4g (1.27x)Scaled to 0.4g (1.27x)
Scaled to 0.7g (2.01x)Scaled to 0.7g (2.01x)
Scaled to 1.0g (2.87x)Scaled to 1.0g (2.87x)
Overview of Measured ResponseOverview of Measured Response
0 20 40 60 80 100 120 140 160-500
-400
-300
-200
-100
0
100
200
300
400
Time (sec)
Roo
f Dis
plac
emen
t (m
m)
EQ1: 50/50 TCU082
EQ2: 10/50 LP89G04 EQ3: 2/50 TCU082
EQ4: 10/50 LP89G04
2a 2b
-0.06 -0.04 -0.02 0 0.02 0.040
0.5
1
1.5
2
2.5
3
IDR
Floo
r
EQ 1: 50/50EQ 2a: 10/50EQ 2b: 10/50EQ 3: 2/50EQ 4: 10/50
-4000 -3000 -2000 -1000 0 1000 2000 3000 40000
0.5
1
1.5
2
2.5
3
Story Force (kN)
Floo
r
50/50 Event 10/50 Event 2/50 Event 10/50 Event
2.0%
3000kN3800kN3.0%5.3% 3800kN
3.0%
2200kN
Interstory Drift Ratio Story Force (kN)
Floo
r
Floo
r
Roo
f Dis
plac
emen
t (m
m)
Time(sec)

June 4, 2003
9
Frame DamageFrame DamageAfter Design Level EventAfter Design Level Event
0 20 40 60 80 100 120 140 160-500
-400
-300
-200
-100
0
100
200
300
400
Time (sec)
Roo
f Dis
plac
emen
t (m
m)
EQ1: 50/50 TCU082
EQ2: 10/50 LP89G04 EQ3: 2/50 TCU082
EQ4: 10/50 LP89G04
2a 2b
-0.06 -0.04 -0.02 0 0.02 0.040
0.5
1
1.5
2
2.5
3
IDR
Floo
r
EQ 1: 50/50EQ 2a: 10/50EQ 2b: 10/50EQ 3: 2/50EQ 4: 10/50
-4000 -3000 -2000 -1000 0 1000 2000 3000 40000
0.5
1
1.5
2
2.5
3
Story Force (kN)
Floo
r
10/50 Event
3800kN3.0%
Story Force (kN)
Floo
r
Floo
r
Roo
f Dis
plac
emen
t (m
m)
Time(sec)
Interstory Drift Ratio
EQ#2: 10%in50yr Loma PrietaEQ#2: 10%in50yr Loma PrietaTypical Damage in First FloorTypical Damage in First Floor
θp ≈ 1.2%
θp ≈ 2.1%
Frame DamageFrame DamageAfter Maximum Credible EventAfter Maximum Credible Event
0 20 40 60 80 100 120 140 160-500
-400
-300
-200
-100
0
100
200
300
400
Time (sec)
Roo
f Dis
plac
emen
t (m
m)
EQ1: 50/50 TCU082
EQ2: 10/50 LP89G04 EQ3: 2/50 TCU082
EQ4: 10/50 LP89G04
2a 2b
-0.06 -0.04 -0.02 0 0.02 0.040
0.5
1
1.5
2
2.5
3
IDR
Floo
r
EQ 1: 50/50EQ 2a: 10/50EQ 2b: 10/50EQ 3: 2/50EQ 4: 10/50
-4000 -3000 -2000 -1000 0 1000 2000 3000 40000
0.5
1
1.5
2
2.5
3
Story Force (kN)
Floo
r
5.3% 3800kN
Story Force (kN)
Floo
r
Floo
r
Roo
f Dis
plac
emen
t (m
m)
Time(sec)
Interstory Drift Ratio
2/50 Event
EQ#3: 2%in50yr ChiEQ#3: 2%in50yr Chi--ChiChiTypical Damage in First FloorTypical Damage in First Floor
θp ≈ 5.5%
θp ≈ 6.0%
up to 75mm
b / t < 52 / √Fy
Final PushoverFinal Pushover
RC Column Base
10% Drift
8% Drift
3% Drift
Max Drift Final PushoverFinal Pushover
0 2 4 6 80
500
1000
1500
2000
2500
3000
3500
Relative Roof Drift
Base
She
ar (k
N)
Maximum Drift 1st Floor = 10.1%2nd Floor = 8.0%3rd Floor = 3.0%
Maximum Strength
Design
x2.8
Roof Drift
Bas
e Sh
ear (
kN)
Beam–Column Joint
June 4, 2003
10
Final PushoverFinal Pushover
1.63 1.54 1.54 1.63
1.28 1.76 1.76 1.28
1.31 1.42 1.42 1.31
ACI/AISC SCWB RatiosPer Joint: ΣMc/ΣMb > 1.2
Steel Strength
2-Story Mechanism
1.09 1.24 1.24 1.63
0.86 1.42 1.42 1.28
0.84 1.03 1.03 1.46
ACI/AISC SCWB RatiosPer Joint: ΣMc/ΣMb > 1.2
Composite Strength
1.3
1.2
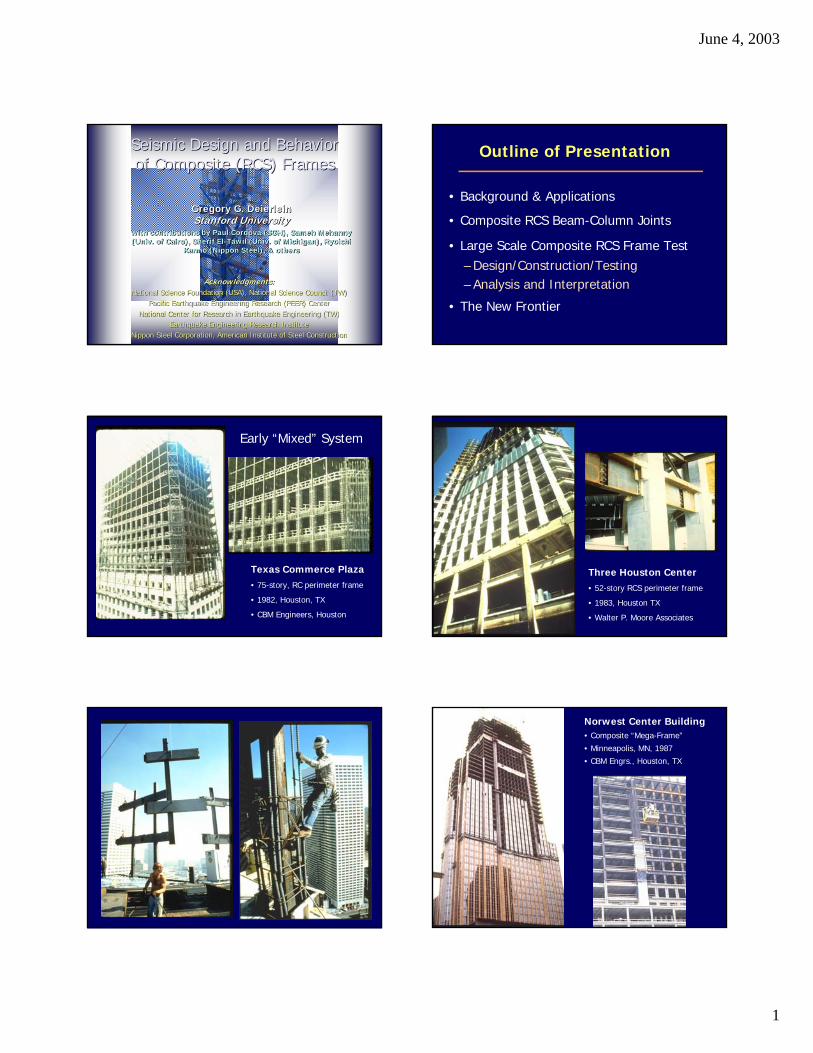
Local BucklingLocal Buckling
FullFull--ScaleScaleContinuity provided Continuity provided restraint against severe restraint against severe bucklingbucklingLarge buckles Large buckles straightened out on straightened out on opposite cycles (esp. opposite cycles (esp. along side interior along side interior joints)joints)
SubassemblySubassemblyBoundary conditions Boundary conditions allow beam shortening allow beam shortening Buckles build up over Buckles build up over each of the cycles. each of the cycles. Overestimates amount of Overestimates amount of damagedamage
Actuator Force
Local BucklingLocal Buckling
FullFull--ScaleScale SubassemblySubassembly
Actuator Force
Slab PerformanceSlab Performance
FullFull--ScaleScaleExceeded expectations Exceeded expectations and remained intactand remained intactNo shear stud fracturesNo shear stud fracturesRealistic load transfer Realistic load transfer alleviates stresses on alleviates stresses on slabslab
SubassemblySubassemblyTypically fails by local Typically fails by local slab crushing and slab crushing and shear stud fractures.shear stud fractures.Slab failure initiates Slab failure initiates more buckling in top more buckling in top flangeflange
Actuator Force
+ Mb + Mb + Mb
- Mb- Mb- Mb
+ Mb
- Mb
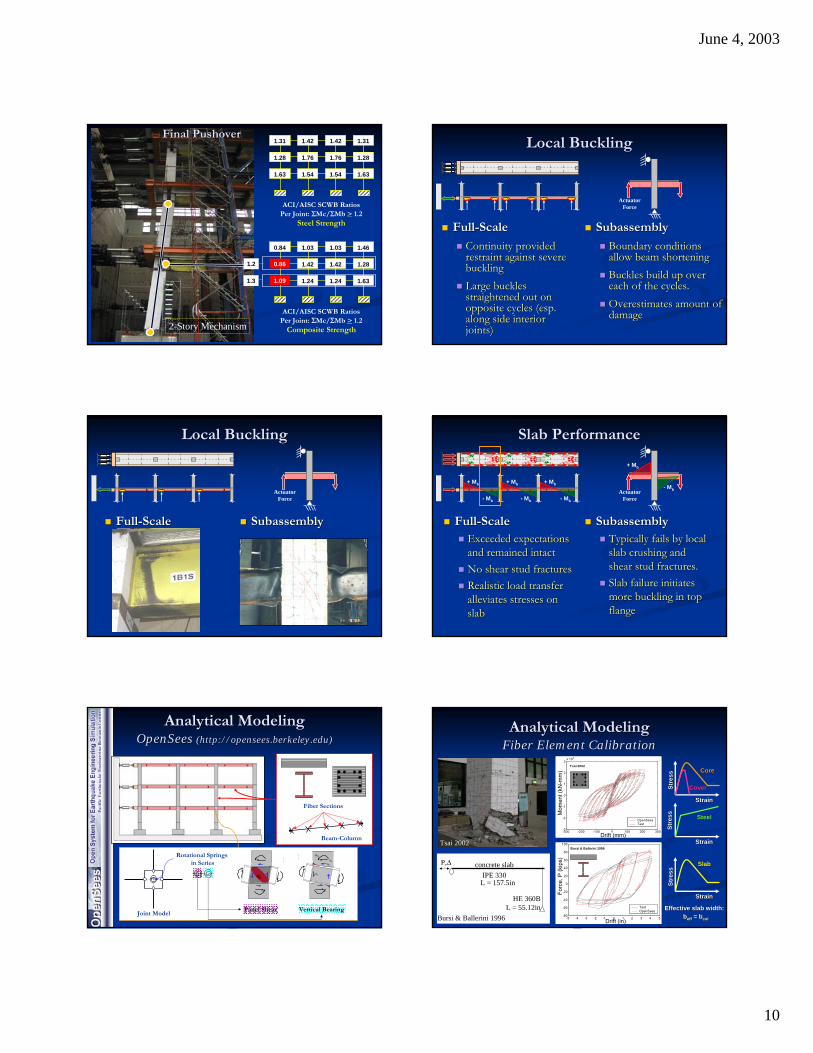
Rotational Springsin Series
Joint Model
Analytical ModelingAnalytical ModelingOpenSees OpenSees (http://(http://opensees.berkeley.eduopensees.berkeley.edu))
Fiber Sections
Beam-Column
creteushing
Kinking Panel s yieldi
Panel Shear
Vtv
oncretecrushing
Gap
Con cru
Vth
Mbi
Vbi
Vertical Bearing
Tsai 2002
Analytical ModelingAnalytical ModelingFiber Element CalibrationFiber Element Calibration
concrete slabIPE 330
P,∆
L = 157.5in
HE 360BL = 55.12in
Bursi & Ballerini 1996 -5 -4 -3 -2 -1 0 1 2 3 4 5-80
-60
-40
-20
0
20
40
60
80
100
Displacement (in)
Hor
izon
tal L
oad
(kip
s)
TestOpenSees
Bursi & Ballerini 1996
Drift (in)
Forc
e, P
(kip
s)
-300 -200 -100 0 100 200 300-3
-2
-1
0
1
2
3x 10⁶
Mom
ent(k
N-m
m)
Drift (mm)
OpenSeesTest
Tsai 2002
Drift (mm)
Mom
ent (
kN-m
m)
Stre
ssSt
ress
StrainStrain
StrainStrain
Stre
ssSt
ress
CoreCore
CoverCover
SteelSteel
StrainStrain
Stre
ssSt
ress
SlabSlab
Effective slab width:Effective slab width:bbeffeff = = bbcolcol

June 4, 2003
11
-0.15 -0.1 -0.05 0 0.05 0.1 0.15
-400
-300
-200
-100
0
100
200
300
400B
eam
She
ar (k
N)
Rotation (rad)
Total Joint RotationOJB1-0Mps = 10106 kN-mmMvb = 7327 kN-mm
TestOpenSees
Analytical ModelingAnalytical ModelingComposite Joint CalibrationComposite Joint Calibration
Joint Bearing
Ref: El-Tawil, Deierlein, Kanno
Vtv
reteshing
G
C
Vth
Mbi
Vbi GapConcreteCrushing
Bearing Failure
teing
nking Pan yie
ConcreteCrushing
Panel ShearYielding
Kinking
Panel Shear Failure -0.15 -0.1 -0.05 0 0.05 0.1 0.15
-400
-300
-200
-100
0
100
200
300
400
Bea
m S
hear
(kN
)
Rotation (rad)
Total Joint RotationOJS3-0M
ps = 6789 kN-mm
Mvb
= 9453 kN-mm
TestOpenSees
Joint Shear
0 5 10 15 20 25 30 35 40 45-200
-150
-100
-50
0
50
100
150
200
Time (sec)
Roo
f Dis
p. (m
m)
TCU082 50/50TestOpenSees
Analytical ModelingAnalytical Modeling50%in50 year Event50%in50 year Event
EQ#1 – 50/50 TCU082
Good Agreement Phase Shift
Time (s)
Roo
f Dis
plac
emen
t (m
m)
-6 -4 -2 0 2 4 60
1
2
3
IDR
Floo
rFl
oor
IDRmax-4 -3 -2 -1 0 1 2 3 4
0
1
2
3
S tory Shear (1000kN)
Floo
rFl
oor
Story Shear (1000kN)
Maximum ResponseMaximum ResponseDispDisp. Error < 20%. Error < 20%Shear Error < 10%Shear Error < 10%
Difference in period Difference in period shift noticeable near shift noticeable near latter half of event.latter half of event.
T = 1.0s T = 1.3s
-6 -4 -2 0 2 4 60
1
2
3
IDR
Floo
r
0 5 10 15 20 25 30-600
-500
-400
-300
-200
-100
0
100
200
300
400
Time (sec)
Roo
f Dis
p. (m
m)
TCU082 2/50
TestOpenS eesGood Agreement
Large local bucklesin beam flangesR
oof D
ispl
acem
ent (
mm
)
Time (s)
PeakResponse
-4 -3 -2 -1 0 1 2 3 40
1
2
3
S tory Shear (1000kN)
Floo
r
Floo
r
IDRmax
Floo
r
Story Shear (1000kN)
65%
Maximum ResponseMaximum ResponseDispDisp. Error < 65%. Error < 65%Shear Error < 20%Shear Error < 20%
Large differences in Large differences in latter half of event.latter half of event.
Local buckles not modeled
Analytical ModelingAnalytical Modeling2%in50 year Event2%in50 year Event
T = 1.5s T = 1.7s
0 0.5 1 1.5 2 2.50
0.5
1
1.5
2
2.5
Sa (g
)
Period (sec)0 0.5 1 1.5 2 2.5
0
0.5
1
1.5
2
2.5
Sa (g
)
Period (sec)
0 10 20 30 40 500
0.5
1
1.5
2
2.5
Sd (cm)
Sa (g
)
T=1.5s0 10 20 30 40 50
0
0.5
1
1.5
2
2.5
Sd (cm)
Sa (g
)Period ElongationPeriod Elongation
Spe
ctra
l Acc
eler
atio
n (c
m)
Loma Prieta, Scaled to 10/50
T=1.0s T=1.3s
114% in Sd
26% in Sa
Period (s)
Loma Prieta, Scaled to 10/50
IBC2003 2%in50
IBC2003 10%in50
Spectral Displacement (cm)
All records scaled to the spectral All records scaled to the spectral hazard (Shazard (Saa) at the first natural ) at the first natural period of frame (Tperiod of frame (T11=1.0s).=1.0s).
The first event (50%in50yr) cause The first event (50%in50yr) cause period elongation to 1.3 seconds.period elongation to 1.3 seconds.
The following design level event The following design level event (10%in50yr) actually represented a (10%in50yr) actually represented a higher hazard level (~2%in50)higher hazard level (~2%in50)
Emphasizes importance of Emphasizes importance of appropriate EQ intensity measures appropriate EQ intensity measures that captures spectral shapethat captures spectral shape
Shift during 10%in50
Spe
ctra
l Acc
eler
atio
n (c
m)
Relating Analysis to Physical DamageRelating Analysis to Physical Damage
0.0 ≤ Dθ ≤ 1.0
Significant, questionable repair0.7 – 0.95
Moderate, repairable damage0.5 – 0.7
Loss of capacity≥0.95
Negligible damage0 – 0.5
Local Response from OpenSees
( )
( )( )
|
||
1FHC,
1FHC,PHCcurrent
βα
βα
θ
θθθ
θθ
⎟⎟⎠
⎞⎜⎜⎝
⎛+−
⎟⎟⎠
⎞⎜⎜⎝
⎛+
=
∑
∑+
+
=
++
=
++
+
n
iipyf
n
iipp
D
Mehanny & Deierlein 2001
Damage IndicesDamage Indices
0 20 40 60 80 100 120 140 160 1800
0.2
0.4
0.6
0.8
1
Time (sec)
Dam
age
Inde
x
TCU08250/50
LP89G04 10/50 1b
TCU0822/50
LP89G0410/50 2
1B1S
1C3
Dθ
DMax
DMaxExc
1B1S
1C3
(d)
(e)
I II
(b)
(c)
1st Floor Beam
Base Column
Moderate Loss of CapacitySignificant Significant

June 4, 2003
12
Damage Index(EDP)
0.5-0.7
0.7-0.9
>0.9
Condition & Consequence(DM)
Minor cracking & spalling
Repair: nothing
Moderate cracking & spalling
Repair: chipping away concrete and repair, grout
Severe cracking & spalling
Repair: not feasible?
Implications(DV)
Moderate cost and shutdown time
Minor cost,No shutdown time
Is repair economically feasible?
EQ #
2EQ
#3
EQ #
4
DamageDamageMeasureMeasure
DecisionDecisionVariableVariable
Engineering Engineering Demand Demand
ParameterParameter
PEER MethodologyPEER Methodology
0.01 0.02 0.03 0.04 0.05 0.06 0.070
0.2
0.4
0.6
0.8
1
1.2
IDRMAX
Sa (g
)
3-Story RCSPerimeter Frame
TCU082-50/50
LP89G04-10/50 1a
LP89G04-10/50 1b
TCU082-2/50
0.01 0.02 0.03 0.04 0.05 0.06 0.070
0.2
0.4
0.6
0.8
1
1.2
IDRMAX
Sa (g
)
3-Story RCSPerimeter Frame
TCU082-50/50
LP89G04-10/50 1a
LP89G04-10/50 1b
TCU082-2/50
OS: Test ConditionsTest Results
Performance & Modeling ImplicationsPerformance & Modeling Implications
Modeling Limitations
OpenSees Model Test Frame
Strength Degrading Hinge ModelsStrength Degrading Hinge Models
Column Spring
Joint Panel SpringBeam Spring
-1.5
-1
-0.5
0
0.5
1
1.5
-8 -6 -4 -2 0 2 4 6 8
Chord Rotation (radians)
Nor
mal
ized
Mom
ent (
M/M
y)
Non-Deteriorated Backbone
My
Cap,pl
Ke
y
Ke
0 0.02 0.04 0.06 0.08 0.1 0.120
0.5
1
1.5
2
2.5
3
3.5
Sa g.
m.(T
=1.0
s) [g
]
Maximum Interstory Drift Ratio
Fiber versus NL Hinge ModelsFiber versus NL Hinge ModelsCode Conforming 4-Story RC FrameFiber Beam-Column Models
Courtesy of C. Haselton
0 0.02 0.04 0.06 0.08 0.1 0.120
0.5
1
1.5
2
2.5
3
3.5
Sag.
m.(T
=1.0
s) [g
]
Maximum Interstory Drift Ratio
Nonlinear Hinge Models
IDRcollapse = 7-12%10/50, Design
2/50, MCE
10% Drift
0 0.005 0.01 0.015 0.02 0.0250
0.1
0.2
0.3
0.4
0.5
0.6
0.7
0.8
0.9
1
Sa g.
m. (g
)
Peak Story Drift Ratio
Lumped Plasticity ModelFiber Model with Uncracked Concrete
70%
Case Study BuildingsCase Study Buildings
3, 6, and 203, 6, and 20--story buildingsstory buildingsComposite beams controlled by strength Composite beams controlled by strength RC columns controlled by SCWBRC columns controlled by SCWBJoints satisfy strength requirements with standard detailsJoints satisfy strength requirements with standard details
Steel BandPlate
Face Bearing
Plate
Joint Ties
6 @ 6.10m = 35.60m
5 @
6.1
m =
30.
5m
2-1/2” Normal Weight Concrete over 3” Metal Deck
A
B
C
D
E
F
1 2 3 4 5 6 7
Design DetailsDesign DetailsColumn SizesColumn Sizes
600x600mm 600x600mm –– 1000x750mm1000x750mm((ρρ = 1.5= 1.5--3%)3%)
Steel BeamsSteel BeamsW450W450--750 (W18750 (W18--W30)W30)
0 0.005 0.01 0.015 0.02 0.025 0.03 0.035 0.04 0.0450
0.1
0.2
0.3
0.4
0.5
0.6
0.7
0.8
0.9
IDRMAX
Sa (g
)
6-Story RCS Perimeter Frame
0 0.005 0.01 0.015 0.02 0.025 0.03 0.035 0.04 0.0450
0.1
0.2
0.3
0.4
0.5
0.6
0.7
0.8
0.9
IDRMAX
Sa (g
)
6-Story RCS Perimeter Frame
Incremental Dynamic AnalysisIncremental Dynamic Analysis66--Story FrameStory Frame
10/50: Design
2/50: MCE
∆/h ≤2%
<4% at the 2/50 level
Very well behaved at 10/50 level
Similar behavior observed for 3 and 20 story buildings

June 4, 2003
13
Summary ObservationsSummary Observations
Even when designed to test the Even when designed to test the minimum limitsminimum limitsof current building code, the RCS frame showed of current building code, the RCS frame showed excellent behavior under various seismic demands.excellent behavior under various seismic demands.
Composite joints performed wellComposite joints performed wellComposite beam action was maintainedComposite beam action was maintainedPrecastPrecast column splices and beam splices performed wellcolumn splices and beam splices performed well
StrongStrong--Column WeakColumn Weak--BeamBeam
Significance of composite beam actionSignificance of composite beam action
Strength ratio criteria of 1.2 (6/5) is not necessarily a Strength ratio criteria of 1.2 (6/5) is not necessarily a good measure to prevent story mechanisms.good measure to prevent story mechanisms.
Summary Observations, contSummary Observations, cont’’dd
NL Fiber Analysis accurate up to 3% drift ratioNL Fiber Analysis accurate up to 3% drift ratio
Accuracy degrades above 4% due to degradation effects Accuracy degrades above 4% due to degradation effects that are not captured in modelthat are not captured in model
Motivates use of degrading spring type models for >3%Motivates use of degrading spring type models for >3%
Importance of appropriate ground motion selection Importance of appropriate ground motion selection and scalingand scaling
Full system versus subassembly testingFull system versus subassembly testingDamage in the slab and studsDamage in the slab and studs
Severity of local bucklingSeverity of local bucklingOverestimated by typical Overestimated by typical
subassembly testssubassembly tests
Future Research & DevelopmentFuture Research & Development
Develop more costDevelop more cost--effective effective erection/construction methods (especially for erection/construction methods (especially for lowlow--rise)rise)
Improved models to simulate large deformations Improved models to simulate large deformations (including strength/stiffness degradation)(including strength/stiffness degradation)
Comprehensive performanceComprehensive performance--based assessmentbased assessment
Continue to innovate new systemsContinue to innovate new systems
Outline of PresentationOutline of Presentation
Background & ApplicationsBackground & Applications
Composite RCS BeamComposite RCS Beam--Column JointsColumn Joints
Large Scale Composite RCS Frame TestLarge Scale Composite RCS Frame Test
Design/Construction/TestingDesign/Construction/TestingAnalysis and InterpretationAnalysis and Interpretation
The New FrontierThe New Frontier
Nanjing Financial Center
67 Story (339/450M) - 2007
Composite/Hybrid System
SOM
Belt Truss
Perimeter Moment Frame
Steel Braced Frame and Shear Wall
Belt Truss
Belt Truss
Perimeter Moment Frame
• Concrete-Encased Steel Composite Column
• Concrete Core with Encased Steel Columns
• Composite Metal Deck Concrete Floor Slab with Structural Steel Framing
• Concrete Beam and Slab within the Core

June 4, 2003
14
Composite/Hybrid Framing LG Beijing (2005)SOM + local partners
Zhengzhou Tower55 stories (280m) - 2009
Dual system: RC Core & Composite Perimeter Frame
SOM
Concrete Core
Perimeter Moment Frame
32 Perimeter sloping columns per story
Column Diameter 750 – 1150 mm
Encased Steel Section: As = 6.5 % - 8%
Steel Reinforcement: Ar = 2.8% - 3.5%
High Density = Viable Community transportation – services – construction economics
e.g., New San Francisco SkylineInnovations Closer to Home?
Thank you!
Questions ??