Seismic Assessment of an Old Reinforced Concrete … Assessment of an Old Reinforced Concrete...
13
1 Seismic Assessment of an Old Reinforced Concrete Building in the City of Lisbon Duarte Ferreira dos Santos [email protected] Instituto Superior Técnico, Lisbon, Portugal, 2016 ABSTRACT: The design of new buildings for seismic resistance wa s not fully implemented until the 1980’s in many countries, including Portugal. Therefore, most reinforced concrete (RC) buildings built in the 1960´s were designed with less amount of reinforcing steel than the ones designed according to the most recent seismic codes. Thus, the adequate seismic assessment of old RC structures is essential to determine the eventual need to retrofit and the targets of the intervention. Recently, there has been an increasing interest in new methodologies based on the three-dimensional computational modelling and nonlinear analysis of these structures. In order to evaluate the applicability of current modelling techniques for the assessment of existing substandard RC buildings, a structure considered as representative of the stock built in the 1960’s in Lisbon is modelled as a whole with SAP2000 (CSI, 2009). To validate the model, field ambient vibration tests are performed. The EC8-3 (CEN, 2005a) methodology is then applied through the seismic assessment of the structure with a nonlinear static analysis following the N2 method. The progressive collapse of the different structural elements is also monitored. The methodology followed in this dissertation provides initial guidelines to assess a RC building and select the retrofitting strategies that would be indicated to strengthen the structure. However, the nonlinear static procedure which was used also presents some limitations, such as the influence of nonlinear parameters for solution control, the inclusion of higher mode and torsional effects and the lack of consideration of some structural effects (e.g. the nonlinear behaviour of masonry infill walls and the concrete-steel bond-slip mechanism). Keywords: earthquake engineering, reinforced concrete building, seismic assessment, nonlinear static analysis, structural modelling, SAP2000 software 1. INTRODUCTION The relevance of design for seismic resistance in reinforced concrete (RC) buildings has been demonstrated by recent events. For example, in the 2015 Gorkha, Nepal earthquake - which killed over 9,000 people – RC moment-resisting frame buildings performed poorly. The design of new buildings for seismic resistance was not fully implemented until the 1980’s in many countries, including Portugal. Provisions for seismic design and detailing of members and structures resembling those found in modern codes were not introduced until this decade in most European countries. The first Portuguese standard to explicitly consider seismic resistance was introduced in 1958 while the importance of ductility in structural design was only introduced in 1983 by the RSA (Regulamento de Segurança e Acções para Estruturas de Edifícios e Pontes) and the REBAP (Regulamento de Estruturas de Betão Armado e Pré-Esforçado). The resistance of buildings to lateral forces resulted in the past only from wind considerations. Therefore, the Portuguese building inventory, which is composed of a large number of RC structures built between 1950 and 1980, was not designed according to the current rules defined in the most recent seismic codes. Although actually the major earthquake threat to human life comes from existing substandard buildings, the emphasis of earthquake engineering research and practice has been on new construction. Seismic resistance adds very little to the construction cost of a new building, whereas the seismic retrofitting cost of old existing buildings is normally a large fraction of the building refurbishment cost. In addition to the direct intervention in structural members, seismic upgrading also includes disruption of use, relocation of tenants and replacement of non-structural members. Therefore, its cost may be prohibitive for private owners or difficult for the local economy to bear. However, in some regions characterized by high rates of seismic activity, it is utterly essential to mitigate the seismic risk posed by a substandard building stock. The determination of the need to retrofit or not a specific building and the definition of the level of the retrofitting intervention normally come out of a detailed seismic assessment of the building. A technically sound seismic assessment is a challenge, since there are different possible approaches and types of analysis (linear or nonlinear), and different software packages (each one with its advantages and disadvantages). However, even when the need to retrofit is obvious, a detailed seismic
Transcript of Seismic Assessment of an Old Reinforced Concrete … Assessment of an Old Reinforced Concrete...

1
Seismic Assessment of an Old Reinforced Concrete
Building in the City of Lisbon
Duarte Ferreira dos Santos
Instituto Superior Técnico, Lisbon, Portugal, 2016
ABSTRACT: The design of new buildings for seismic resistance was not fully implemented until the 1980’s in many
countries, including Portugal. Therefore, most reinforced concrete (RC) buildings built in the 1960´s were designed with
less amount of reinforcing steel than the ones designed according to the most recent seismic codes. Thus, the adequate
seismic assessment of old RC structures is essential to determine the eventual need to retrofit and the targets of the
intervention. Recently, there has been an increasing interest in new methodologies based on the three-dimensional
computational modelling and nonlinear analysis of these structures. In order to evaluate the applicability of current
modelling techniques for the assessment of existing substandard RC buildings, a structure considered as representative of
the stock built in the 1960’s in Lisbon is modelled as a whole with SAP2000 (CSI, 2009). To validate the model, field
ambient vibration tests are performed. The EC8-3 (CEN, 2005a) methodology is then applied through the seismic
assessment of the structure with a nonlinear static analysis following the N2 method. The progressive collapse of the
different structural elements is also monitored. The methodology followed in this dissertation provides initial guidelines
to assess a RC building and select the retrofitting strategies that would be indicated to strengthen the structure. However,
the nonlinear static procedure which was used also presents some limitations, such as the influence of nonlinear
parameters for solution control, the inclusion of higher mode and torsional effects and the lack of consideration of some
structural effects (e.g. the nonlinear behaviour of masonry infill walls and the concrete-steel bond-slip mechanism).
Keywords: earthquake engineering, reinforced concrete building, seismic assessment, nonlinear static analysis,
structural modelling, SAP2000 software
1. INTRODUCTION
The relevance of design for seismic resistance in
reinforced concrete (RC) buildings has been demonstrated
by recent events. For example, in the 2015 Gorkha, Nepal
earthquake - which killed over 9,000 people – RC
moment-resisting frame buildings performed poorly.
The design of new buildings for seismic resistance was not
fully implemented until the 1980’s in many countries,
including Portugal. Provisions for seismic design and
detailing of members and structures resembling those
found in modern codes were not introduced until this
decade in most European countries. The first Portuguese
standard to explicitly consider seismic resistance was
introduced in 1958 while the importance of ductility in
structural design was only introduced in 1983 by the RSA
(Regulamento de Segurança e Acções para Estruturas de
Edifícios e Pontes) and the REBAP (Regulamento de
Estruturas de Betão Armado e Pré-Esforçado). The
resistance of buildings to lateral forces resulted in the past
only from wind considerations. Therefore, the Portuguese
building inventory, which is composed of a large number
of RC structures built between 1950 and 1980, was not
designed according to the current rules defined in the most
recent seismic codes.
Although actually the major earthquake threat to human
life comes from existing substandard buildings, the
emphasis of earthquake engineering research and practice
has been on new construction. Seismic resistance adds
very little to the construction cost of a new building,
whereas the seismic retrofitting cost of old existing
buildings is normally a large fraction of the building
refurbishment cost. In addition to the direct intervention in
structural members, seismic upgrading also includes
disruption of use, relocation of tenants and replacement of
non-structural members. Therefore, its cost may be
prohibitive for private owners or difficult for the local
economy to bear. However, in some regions characterized
by high rates of seismic activity, it is utterly essential to
mitigate the seismic risk posed by a substandard building
stock.
The determination of the need to retrofit or not a specific
building and the definition of the level of the retrofitting
intervention normally come out of a detailed seismic
assessment of the building. A technically sound seismic
assessment is a challenge, since there are different
possible approaches and types of analysis (linear or
nonlinear), and different software packages (each one with
its advantages and disadvantages). However, even when
the need to retrofit is obvious, a detailed seismic

2
assessment is worth carrying out: once a structural model
of the building as-is is set up and analysed, it can be used
at little extra cost as the basis for studying various
retrofitting options and for detailed retrofit design.
Besides, a detailed assessment in principle provides an
objective picture of the building’s seismic vulnerability
and resistance, independent of the perceptions of the
engineer responsible for the evaluation. Consequently,
there has been a recent shift from the use of empirical
rapid methods of analysis, used in the past to identify
whether seismic retrofitting was indeed necessary, to the
adoption of new methodologies based on three-
dimensional (3D) computational modelling and nonlinear
analysis of RC structures.
The main goal of this work was to model and analyse a
RC building considered representative of the building
stock designed and built between 1960 and 1970 in
Portugal, using the structural analysis software SAP2000
(CSI, 2009), in order to study the applicability and
accuracy of current nonlinear modelling techniques and
methodologies for the seismic assessment of existing
substandard RC structures. For this purpose, this work
aimed at: (i) identifying the main weaknesses and
deficiencies with impact on the seismic performance of
the RC structures designed and built during the
abovementioned period, and compare them with the
current capacity design detailing principles; (ii) analysing
the procedures adopted in the Part 3 of Eurocode 8, EC8-
3 (CEN, 2005a) for the seismic assessment and
retrofitting of existing RC structures; (iii) validating the
modelling options by comparing the fundamental modes
and frequencies of the model with the results obtained
from in-situ ambient vibration tests; (iv) analysing the
sensitivity of pushover analysis to different modelling
approaches and the calibration of the model; (v) assessing
the seismic performance of the structure with a nonlinear
static (pushover) analysis following the N2 method
proposed by the Part 1 of Eurocode 8, EC8-1, Annex B
(CEN, 2004a); and (vi) analysing and interpreting the
progressive collapse of structural members.
2. OVERVIEW OF THE CASE STUDY
The building concerned in this study is an eight-storey
(ground floor plus seven storeys above ground) RC
building located in Lisbon (Portugal) between Av. do
Brasil and Rua Aprígio Mafra that was designed and built
in the 1960’s. Its plan dimensions are 36.80m in the X-
direction and 10.85m in the Y-direction. Total building
height is 27m.
Figure 1 – Model building: (A) cross-section (Montepio-
Geral, 1960); and (B) perspective.
The building (Figure 1) features three main RC frames in
the X-direction carrying vertical gravity loads and beams
framing eccentrically to the columns in the Y-direction.
It also includes two stairs and lift cores and interior
masonry walls. One of the peculiarities of this project lies
in the distribution of the columns, all positioned in the
same direction (Figure 2). However, the two rigid RC
cores guarantee an acceptable rigidity in the transverse
direction.
Figure 2 – Structural design plan, adapted from
(Montepio-Geral, 1960).
The seismic response of the building was not directly
considered in the structural design. The design team
assumed that the response to earthquakes would be
similar to a wind load response (the lateral force method
of analysis), which was the common design procedure to
take into account the seismic action.
3. CONCEPTUAL ANALYSIS OF THE
EXISTING RC STRUCTURE
The studied building belongs to the category of RC
frame-wall buildings. The structure is composed of
columns, beams, slabs and walls. In a first conceptual
analysis, it can be noticed that: (1) the ground floor has
substantially fewer masonry walls than the upper storeys;
(2) in raised floors, the outer masonry walls are supported
by beams that are positioned in the end of the cantilevers;
(3) the columns have a reduced reinforcement area,
particularly in the upper storeys.
3.1. Conceptual design considerations
A number of general building characteristics have been
identified in the last decades as being responsible for
localized component deficiencies, including lack of
redundancy in the shear resisting system or a
discontinuous seismic load path. Typically, most RC
buildings built in the 1960´s contain an array of non-
ductile detailing of the reinforcing steel. Nowadays, Part
1 of Eurocode 8, EC8-1 (CEN, 2004a) adopts the
principle of “Capacity Design”, taking advantage of the
ductility and energy dissipation capacity of the structure.
Consequently, EC8-1 introduces a series of guidelines
and rules in order to ensure a proper inelastic deformation
capacity of the structural elements without loss of
strength capacity. Some inadequate reinforcement
detailing conditions that were easily noticed in a
preliminary assessment of the studied building are:
(1) The spacing and number of column transverse
reinforcement ties is generally insufficient, originating
the premature failure of the section due to shear and
buckling of the compressed bars. Furthermore, the
distance between consecutive longitudinal bars
restrained by ties exceeds the EC8-1 limit (200 mm).
A B
Y
X
3
(2) The bottom beam longitudinal reinforcement near
column/beam joints is in general reduced, since its design
typically does not consider the effect of the seismic
actions that can lead to significant positive bending
moments in the support region, creating potential for bar
pullout under moment reversals.
(3) The transverse reinforcement in the beams is clearly
insufficient and the use of bent longitudinal beam bars
around the joints (instead of stirrups) originates an
undesirable behaviour of the system in case of stress
reversal, since the number of stirrups is not enough to
guarantee the formation of plastic hinges with the
necessary ductility (Appleton, 2013).
(4) The longitudinal column reinforcement bars were
designed to resist moments generated by code-specified
forces rather than the moments associated with the
capacities of the connecting beams. As opposed to
current ductile detailing design, based on the capacity
design principles, the columns are weaker than the
beams, leading to early column hinging and an
undesirable column side-sway mechanism.
(5) The size of the columns varies in each floor, since
only the vertical loads were considered in the design.
Consequently, there is a strong reduction in the stiffness
of the columns in the upper storeys, creating a relevant
vertical discontinuity.
(6) The column bars are spliced and anchored inside the
beam-column joint, which is a critical region for the
behaviour of the frame. Lap splices in columns generally
occur just above the floor level where the internal forces/
stress levels are the highest. In addition, the column lap
splices are generally very short and are not confined with
closely spaced column ties.
(7) In old RC buildings (pre-1970), it is common for
beams to frame eccentrically to the columns, as happens
in the design of the studied building. To increase the
seismic performance of the building, beams should be
supported on columns instead of indirectly supported on
other beams.
(8) According to EC8-1, in order to ensure a ductile
behaviour of the RC walls, the longitudinal
reinforcement required for flexural resistance should be
placed inside confined boundary elements whose length
𝑙𝑐 should not be taken as being smaller than 0.15𝑙𝑤 or
1.5𝑏𝑤. In the original detailing the longitudinal
reinforcement is distributed along the entire section.
3.2. Foundations detailing and design
The length of embedment used in the studied building for
the anchorage of the vertical reinforcement into the
foundations is not sufficient to develop the yield capacity
of the bars. The resulting slippage of the reinforcement
can lead to the same kind of performance as inadequate
lap splices. The footings were typically designed only for
gravity loads. The large concentration of stresses at the
end of the vertical elements resisting seismic loads can
exceed both the dead load and the compressive bearing
strength of the soils. Such conditions can give rise to
foundation rocking (ATC-40, 1996).
3.3. “Soft-storey” irregularity
The building in study belongs to a period of modern
architectural design that was strongly encouraged around
the world since the first half of the 20th century and is
characterized by the common application of “open
floors” or “pilotis”. The soft-storey irregularity refers to
the existence of a floor that presents a significantly lower
stiffness than the others. This irregularity is present, for
example, when the first storey of a framed structure is
free of walls (while non-structural walls are present in the
upper ones), when shear walls (located in the upper
storeys) do not follow down to the foundations or when
the height varies between storeys.
The soft first floor (ground floor) is the most common
feature of this kind of irregularity. It is usually present in
frame buildings when a large number of non-structural
components, such as masonry walls, are attached to the
columns of the upper storeys of a RC framed structure
while the first storey is left empty of walls or with a
reduced number of walls (Guevara-Perez, 2012). The
non-structural components, especially when they have a
significant rigidity, limit the ability of the columns to
deform, modifying the structural performance of the
building to horizontal forces.
Figure 3 - Examples of the "soft-storey" irregularity: (A)
Olive View Hospital, 1972 and (B) Imperial County
Service Building, 1985. Adapted from (Moehle, 1991).
If the soft-storey effect is not foreseen in the structural
design, irreversible damage will generally be present on
both the structural and non-structural components of that
floor. The lowest more flexible portion at the ground
floor may create a critical situation in the load path during
an earthquake: the stiffness discontinuity between the
first and the second storeys might cause significant
structural damage, or even the total collapse of the
building. This irregularity can be observed in the
residential buildings located in Av. do Brasil. The
structural elements are distributed throughout the
building, but the apartments are located on the upper
storeys with many masonry walls, while the lowest floor
is left partially free of partitions.
3.4. Weak column-strong beam mechanism
Current seismic codes recommend that in order to obtain
a ductile behaviour of the frames, the deformation
requirements in a nonlinear system should focus on
beams. In every joint, columns should have a greater
resistance than the beams. However, many existing
structures are not designed taking into account this
mechanism (Varum et al., 2005), including the studied
structure. In older RC frame buildings, where the beams
are often stronger than the columns, column hinging can
A B

4
lead to a storey mechanism, creating large p-delta effects
and inelastic rotations in the columns. Column hinging is
undesirable since this may lead to loss of the column's
gravity load carrying ability after only a very few cycles.
Furthermore, although isolated column hinging may be
tolerable in some circumstances (i.e. in dual systems),
hinging of most or all of the columns on a single level in
frame buildings will result in the loss of lateral stability.
3.5. Concrete-steel bond-slip mechanism
The seismic performance of RC structures depends
largely on the behaviour of the stress transfer mechanism
between concrete and reinforcement bars. The steel-
concrete bond is developed by friction and the wedging
action of small-dislodged sand particles between the bar
and the surrounding concrete, which ensures the transfer
of concrete stresses to the reinforcement surface
(Fernandes et al., 2007).
The analysis of RC structures generally assumes a perfect
bond between steel and concrete, implying full
compatibility between concrete and reinforcement
strains. This assumption is only valid in early loading
stages and small stress levels (e.g. Varum et al., 2005).
As the load increases, cracking and breaking of bond
occurs and relative slip between the concrete and the
reinforcement bars takes place in the structural elements
(bond-slip mechanism). Consequently, different strains
are observed in the steel bars and in the surrounding
concrete, affecting the stress distribution in both
materials. Bond-slip effects are particularly significant in
elements built with smooth plain reinforcing bars
(Fernandes et al., 2007), as was the case in the studied
building.
4. COMPUTATIONAL MODELLING OF THE
BUILDING
The 3D model of the studied building, presented in
Figure 4, was developed using SAP2000 (CSI, 2009),
which has different types of analysis available. The ones
used in this study were modal analysis (for the dynamic
characterization of the structure), linear static analysis
and nonlinear static (“pushover”) analysis.
Figure 4 – 3D model of the studied building in Av. do
Brasil, using SAP2000 (CSI, 2009).
4.1. Materials
The materials adopted for the RC structure (beams,
columns, slabs, shear walls and footings) - in accordance
with the original drawings - are the S235 steel with
smooth plain rebars and the B25 (C20/25) concrete.
4.1.1. Steel
S235 is a mild steel which properties were specified in
the old national standards (e.g. REBAP and RSA) in
terms of the main parameters: yield strength, ultimate
strength and strain at breaking. When compared to the
current properties of reinforcing steel (typically S400 or
S500), the difference lies mainly in the required ductility.
The main properties assumed were as follows in Table 1.
Table 1 - Properties of S235 mild steel.
Modulus of Elasticity (GPa) 210.0
Poisson’s Ratio 0.30
Yield strength (MPa) 235.0
Minimum ultimate strength (MPa) 360.0
Hardening strain, 𝜀𝑠ℎ 0.015
Minimum strain at breaking, 𝜀𝑠𝑢 0.240
The model proposed by Park and Paulay (1975) was
adopted as the constitutive relation for steel in this work,
defined in Figure 5, since the S235 steel is characterized
by a high hardening rate in the plastic stage.
Figure 5 – Stress-strain diagram for S235 steel.
4.1.2. Concrete
The stress-strain relationship for confined concrete was
established in this work using the theory proposed by
Mander et al. (1988), which means that constant
confining pressure was assumed in the concrete core. The
main properties of the adopted C20/25 (old B25) concrete
are as follows in Table 2. Unconfined concrete was
applied in beams and shear walls.
Table 2 - Properties of C20/25 (old B25) concrete.
𝑬𝒄𝒎 (GPa) 30.0
𝑬𝒄 (GPa) 31.5
Poisson’s Ratio 0.20
𝒇𝒄𝒎 (MPa) 28.0
𝒇𝒄𝒕𝒎 (MPa) 2.2
𝜺𝒄𝟏 (%) 0.20
𝜺𝒄𝒖𝟏 (%) 0.35
Most seismic design codes do not precise the effective
stiffness to be used in seismic analysis for RC structures.
Therefore, uncracked section properties are usually
considered in computing structural stiffness. However,
using modal analysis with uncracked sections stiffness
for different elements makes it impossible to obtain

5
adequate seismic internal forces, even within elastic
range (Pique et al., 2008). Some design codes recognize
the influence of cracking. They consider stiffness of the
cracked section 𝐸𝐼𝑒 proportional to the stiffness of the
gross uncracked section 𝐸𝐼𝑔, specifying reduction factors
to be applied to the stiffness of the uncracked cross-
section. For this case study, the reduction factors
proposed by Paulay and Priestley (1992) were adopted
[0.40EIg for rectangular beams and 0.60EIg for columns]
which seem to be more realistic than the ones proposed
in EC8-1.
Given that different column elements have different
section dimensions and confinement detailing, a Mander
stress-strain relation was calculated for each different set
of properties. The properties of the stress-strain relations
for different structural elements are presented in Fig. 6.
Figure 6 – Stress-strain relations for different structural
elements with confined and unconfined C20/25 concrete.
4.2. Modelling of structural and non-structural
elements for linear analysis
The columns and beams of the case study building were
modelled as linear, horizontal and vertical, frame
elements. The cross-sections were modelled with
SAP2000 Section Designer (CSI, 2009). The central RC
core was modelled through linear vertical frame elements
that are connected with rigid horizontal frame elements
to the beams and slabs, at the floors level, considering a
material with a very high modulus of elasticity. These
rigid sections ensure the monolithic connection between
the vertical walls and the adjacent elements in each floor.
For the original model of the structure, given that the
building does not extend below grade, the foundations
were considered as flexible. To simulate this behaviour,
in this model the joints were restrained for translations in
all directions (X, Y and Z) and two springs were added
to allow limited rotations. The stiffness of the springs was
computed according to Castro (1970).
The building was designed with lightened slabs
completed with distribution reinforcement. These slabs
were modelled with thick shell elements of C20/25
concrete with 0.10m thickness (determined to ensure that
the mass per unit volume and the rigidity of the material
are similar to the properties of the original slab).
Considering that the slabs have a much higher
stiffness in-plane than out-plane and that there is not
significant stiffness discontinuity in the structural
wall system, in the original model these elements
were modelled as rigid diaphragms (rigid behaviour
in-plane), applying a diaphragm constraint.
To perform the seismic assessment of existing RC
infilled frame structures, the behaviour of these non-
structural systems should be properly taken into account
in the analyses, mainly if, for a certain seismic intensity
level, the structure behaves essentially in the linear range.
There are many techniques proposed in the literature for
the simulation of infilled frames, which can be divided in
two groups (Rodrigues et al., 2010): the micromodels and
the simplified macro-models. In micro-models, infill
panels are modelled in detail at the components level:
mortar, bricks and interface elements. With the micro-
models, a more accurate representation of infill panel
behaviour can be obtained. However, a huge calculation
effort is required and a large number of parameters has to
be calibrated. Macro-models allow for the representation
of the panel behaviour and its influence on a building’s
structural response in a simplified way. The most
commonly used macro-model is the bi-diagonal
equivalent-strut model (Rodrigues et al., 2010).
A solid infill panel can be modelled as a strut along its
compressed diagonal. A widely known strut model,
which was adopted in this work, is based on the beam-
on-elastic-foundation analogy for the estimation of the
strut width (Mainstone, 1971). For a better
characterization of this phenomenon, a double equivalent
connecting rod was adopted, in which the model
parameter shall correspond to half the calculated width of
the strut (𝑤𝑖𝑛𝑓/2). The equivalent connecting strut only
transmits forces directly to the node, which is a limitation
of this simplified model. Furthermore, it does not take
into account the panel failure mode, which significantly
affects the distribution of stresses in the frame.
After defining the type of model to be used, it is also
important to obtain the mechanical parameters of the
walls to be modelled. The exterior masonry walls in the
case study building are composed of two panels with
30x20x15cm + 30x20x7cm bricks, while the interior
ones are composed of a single panel with 30x20x15cm
bricks. The properties of bricks for masonry walls are
illustrated in Table 3.
Table 3 - Mechanical properties of bricks for masonry
walls according to NP 834 (1971).
To model the equivalent diagonal struts, each strut was
considered as a linear frame element. In order to ensure
that the struts are only subject to axial stresses
(tension/compression), the bending and torsional
moments were released in the end joints.
For the dynamic characterization of the building and its
seismic assessment, it is essential to define the mass of
the structure and the corresponding vertical loads.
Therefore, the definition of the dead and live loads that
were included in the model was carried out carefully
(Table 4). The dead load comprises the self-weight of the
RC structure while the super-imposed dead load includes
Brick Type Self-weight
(kN/m3)
Compressive
Strength (MPa) E (GPa)
30x20x15cm 10.0 – 13.0
2.5 - 4.9 2.775
30x20x7cm 3.7 – 7.0 4.013

6
other permanent loads, such as coatings (wood or
ceramic tiles) and partition masonry walls. The live loads
are variable loads which depend on the main use of the
building (in this case, residential). Given the lack of
information in the original drawings, the live loads were
defined according to EC1-1 (CEN, 2002).
Table 4 – Actions considered on the structure.
4.3. Nonlinear modelling strategy
There are several ways of distributing the plasticity of an
inelastic structural component through the member cross-
sections and along its length. It is commonly accepted
that two major modelling strategies are possible to
simulate nonlinearity: either a fibre-based model or
nonlinearity concentrated on plastic hinges located at
elements’ extremities (Deierlein et al., 2010).
4.3.1. Definition and modelling of plastic hinges
In SAP2000 v16.0.0 (CSI, 2009), nonlinear modelling of
structural elements is limited to concentrated plasticity,
through the implementation of plastic hinges. However,
the software provides several alternatives regarding the
hinges definition through hysteretic relationships:
automatically based on the FEMA 356 rules (FEMA-356,
2000) or on CALTRANS Flexural Hinges (Caltrans,
2009); or manually through hinges with decoupled
bending (P-M2 and P-M3) or P-M2-M3 (“PMM”)
interaction. The first step for the definition of the plastic
hinges consists in depicting the moment-curvature
relationships that will represent the corresponding
nonlinear behaviour of the end sections of the structural
element.
The major limitation of concentrated plasticity models is
the definition, a priori, of the plastic hinge length, which
is conditioned by the curvature distribution assumed
along the element. To estimate the equivalent plastic
hinge length (𝐿𝑝), many expressions based on
experimental results have been suggested. One of the
most commonly used expressions, recommended for
beams and columns, was proposed by Paulay and
Priestley (1992):
𝐿𝑝 = 0.08𝑙 + 0.022𝑓𝑠𝑦𝑑𝑏𝑙 (1)
Where 𝑙 is the length of the RC element, 𝑑𝑏𝑙 is the
diameter of the main longitudinal reinforcing bars, and
𝑓𝑠𝑦 is the yielding strength of the reinforcement (in MPa).
Some more recent proposals of plastic hinge lengths have
been employed, such as those included in Eurocode 8. In
Annex E of Part 2 of Eurocode 8, EC8-2 (CEN, 2005b)
the plastic hinge length is defined as:
𝐿𝑝 = 0.10𝑙 + 0.015𝑓𝑠𝑦𝑑𝑏𝑙 (2)
However, according to Varum (2003), the empirical
expressions do not properly evaluate the plastic hinge
length for existing RC structures with smooth plain
rebars (such as the one in this case study). This type of
reinforcement, with poor bond conditions, concentrates
the deformation at the elements’ extremities, resulting in
lower plastic hinge lengths.
Fernandes et al. (2010) carried out cyclic load tests on
two beam-column joints: one joint (A) with smooth plain
rebars and joint (B) with ribbed rebars. A plastic hinge
length corresponding to 25% of the section height was
observed in joint (A) while joint (B) showed a plastic
hinge length corresponding to 90% of the section height.
These tests showed the influence of the concrete-steel
bond-slip mechanism, described in section 3.5. Being this
case study about an old RC building with smooth plain
reinforcement bars, the plastic hinges for beams were
modelled with a plastic hinge length equivalent to 25%
of the section height. For columns, the plastic hinge
length was assumed as half the length estimated
according to Equation 1.
According to Filiatrault et al. (2013), ductile shear walls
are intended to form a single plastic hinge at their base.
Several authors have addressed the plastic hinge length
estimation in shear walls, not only in RC buildings but
also in bridge engineering (e.g. Hannewald et al., 2012).
The Canadian and American concrete codes also have
requirements for the detailing of shear walls. The
Canadian code, CSA A23.3-04 (CSA, 2010), provides a
definition of the plastic hinge length, 𝐿𝑝, which was
adopted in the original model of the structure (Eq. 3).
𝐿𝑝 = 0.5𝑙𝑤 + 0.1ℎ𝑤 (3)
Where 𝑙𝑤 is the length of the wall in plan and ℎ𝑤 is the
height of the wall above the plastic hinge location.
Given the complexity of the examined three-dimensional
model, the definition of plastic hinges was tested
comparing the three alternatives: manually using
interacting M3 and P-M2-M3 hinges and automatically
using CALTRANS (Caltrans, 2009) and FEMA-356
(FEMA-356, 2000) – with M3 hinges in beams and P-
M2-M3 in columns.
4.3.2. Generalised force-deformation curve and
acceptance criteria
Acceptance criteria are indicators of whether the
predicted performance is adequate. All structural and
non-structural components should be capable of resisting
internal forces and deformation within the applicable
acceptance criteria of the selected performance level in a
structure. In this work, the generalized force-deformation
curves used in common standards (e.g. FEMA-356, 2000
and ASCE 41-13, 2013) were adopted. In these curves
(Figure 7) , five points labelled A, B, C, D and E are used
to define the force-deformation behaviour of the hinge
and three points labelled IO, LS and CP are used to define
the acceptance criteria.
Linear response is depicted between point A (unloaded
component) and an effective yield point B. Point C has
an ordinate that represents the strength of the component,
Dead Load C20/25 (kN/m3) 25.00
Super Dead
Load
Masonry walls (kN/m2) 2.00
Floor coatings (kN/m2) 1.50
Exterior masonry infills (kN/m) 6.75
Live Load Residential activities (kN/m2) 2.00

7
and an abscissa value equal to the deformation at which
significant strength degradation begins (line CD).
Beyond point D, the component responds with
substantially reduced strength to point E.
Figure 7 – Generalized force-deformation relations for
depicting: (A) plastic hinge modelling; and (B)
acceptance criteria (FEMA-356, 2000).
The acceptance criteria IO (Immediate Occupancy), LS
(Life Safety) and CP (Collapse Prevention) values are
deformations (displacements, strains, or rotations) that
have been normalized by the same deformation scale
factors used to specify the load deformation curve, and are
typically located between points B and C on the curve
(Figure 7-B). They indicate the state of the hinges.
The plastic moment capacity for the definition of plasticity
curves was calculated by moment-curvature (Μ−φ)
analysis of each structural element. The Μ−φ curves were
determined automatically in SAP2000 Section Designer
(CSI, 2009) and verified manually, according to the
geometry and detailing of each section and based on
expected material properties. The yield point was defined
as the moment at which the strain in the longitudinal
reinforcement reaches the yield strain. The ultimate
moment occurs when one of the fibres reaches its ultimate
strain, which can be conditioned by the failure of
reinforcement or concrete.
5. SEISMIC ASSESSMENT OF THE EXISTING
RC STRUCTURE
Following the computational modelling of the existing
structure, this section describes the results obtained by
means of different types of analysis: experimental dynamic
characterisation (ambient vibration tests), modal dynamic
analysis and nonlinear static (“pushover”) analysis.
5.1. Experimental dynamic characterisation
The suitability of the 3D computational model is essential
for the adequate seismic assessment of the structure. To
validate the computational model, field ambient vibration
tests were performed and experimental and analytical
dynamic characteristics of the building were defined and
compared. Despite the information obtained in the original
drawings and the local visits, it was necessary to consider
several modelling hypotheses to simulate as close as
possible the current behaviour of the structure.
The dynamic characterization tests consist on the analysis
of data on the response of the structure to the dynamic
vibration of the environment. The microtremors are
vibrations in the order of several micrometers, caused by
natural phenomena and/or artificial sources. The response
is registered in terms of acceleration and it is possible to
identify the frequencies through the Fourier transform of
these signals, which correspond to the peaks of the
obtained Fourier spectrum (Oliveira et al., 2010). The
Fourier amplitude spectrum will show a pronounced peak,
centred at the fundamental frequency of the building. It is
also possible to identify the fundamental frequencies
overlaying the plots obtained for each direction in each
measurement location.
From the systematic analysis of the records illustrated in
Figure 8 it is possible to conclude that the fundamental
mode of translation along the X-direction occurs for a
frequency of approximately 0.95 Hz and the fundamental
mode of translation along the Y-direction occurs for a
frequency of approximately 1.00 Hz.
Figure 8 –Power spectral density functions, in different
locations, for: (A) X-direction; and (B) Y-direction.
5.2. Modal dynamic analysis
The numerical analysis for the computation of natural
frequencies and vibration modes was performed using
SAP2000 (CSI, 2009). In this analysis, two distinct
computational models were studied: considering the
presence of masonry infill walls or neglecting their
influence. All modes that provide together a total effective
modal mass along each direction of at least 90% of the total
mass of the structure were considered.
Analysing the results presented in Table 5, one can easily
notice that the frequency obtained in the computational
model, considering the presence of infills, is very close to
the frequency obtained in the ambient vibration tests
(approximately 1 Hz). The first mode of vibration is the
mode associated with the lowest frequency (0.799 Hz,
model with infills), representing the fundamental mode.
For the studied building, it can be noted that this mode is
associated with torsion about the central axis of the
structure. This is related to the fact that the RC cores are
eccentric. Furthermore, the length of the structure in plan
is approximately 3.5 times larger than its width, which
favours existence of torsional modes. The second mode of
vibration is the first translational mode along the Y-
direction, with a frequency of 0.942 Hz and an effective
modal mass representing approximately 70% of the total
mass of the structure applied in this translation. The third
mode of vibration is the first translational mode along the
X-direction, with an effective modal mass representing
approximately 75% of the total mass of the structure.
A B
A
B

8
Table 5 – Modal identification analysis of the case study
building in Av. do Brasil.
Frequency (Hz) Modal mass ratios
Mode Without
Infills
With
Infills In-situ UX UY
1 0.704 0.799 ----------- 0.25% 0.00%
2 0.795 0.942 1.00 0.00% 70.39%
3 0.860 0.967 0.95 74.79% 0.00%
4 2.794 3.002 ----------- 13.18% 0.00%
5 3.084 3.289 ----------- 2.55% 0.00%
6 3.557 3.731 ----------- 0.00% 19.45%
5.3. Nonlinear static (“pushover”) analysis
Pushover analysis is the extension of the “lateral force”
procedure of static analysis into the nonlinear regime. This
analysis is carried out under constant gravity loads and
monotonically increasing lateral (horizontal) loading
applied on the masses of the structural model
(displacement control analysis). This loading simulates
inertia forces due to a horizontal component of the seismic
action (Fardis, 2009). While the lateral forces increase in
the course of the analysis, it is possible to follow the
development of plastic hinges across the structural
elements and the formation of plastic mechanisms.
Buildings not conforming to the regularity criteria defined
in section 4.2.3.2 (Regularity in Plan) and in section
4.3.3.1(8) of EC8-1 (CEN, 2004a) shall be analysed using
a spatial model (3D model) and two independent analyses
with lateral loads applied in each direction. According to
EC8-1, pushover analyses should be applied to buildings
using both of the following lateral load patterns: (1) a
“uniform” pattern corresponding to uniform unidirectional
lateral accelerations; (2) a “modal” pattern simulating the
inertia forces of the translational mode in the horizontal
direction in which the analysis is carried out. Nowadays,
more sophisticated versions of the pushover analysis do not
use a fixed pattern of applied lateral loads, “adapting” it to
the evolution of nonlinearity (e.g. Fardis, 2009 and Bhatt,
2012). However, the increase in accuracy contrasts with a
decrease in the simplicity of the procedure. In this work,
the N2 procedure (Fajfar, 2000), was used, as suggested in
Annex B of EC8-1 (CEN, 2004a).
Unless the structure is symmetric about an axis
perpendicular to the considered seismic action component,
the lateral forces should be applied in both the positive and
negative directions (Figure 9). The most unfavourable
result of the analyses with the two patterns should then be
used. For this analysis the presence of masonry infills was
neglected, due to the high magnitude of the earthquake and
the reduced strength of these elements.
Figure 9 – Identification of the RC frames and directions/
signs of the lateral acceleration patterns.
5.3.1. Sensitivity analysis on the influence of
modelling alternatives
Before assessing the seismic performance of the RC
structure, an attempt has been made in order to study the
sensitivity of the pushover analysis to different modelling
options assumed in the 3D model. Nonlinear static analyses
were carried out using SAP2000 to investigate the
behaviour of the alternative models described below.
A. Impact of the foundations modelling
In the first model, the foundations were considered as
flexible. However, after analysing the original drawings,
there is no evidence that the foundations were designed to
withstand bending moments and restrain any type of
rotation, since an isolation material might have been
applied at the interface between the supports and the
columns (which will work as a hinge). Consequently, a
new model was created assuming pinned foundations for
the columns: the joints were only restrained for translations
in all directions. In the case of RC shear walls, the rotations
were also restrained in the direction of the highest moment
of inertia (i.e. it was assumed that the foundations only
provide flexural resistance in this direction, to avoid the
concentration of high bending moments and the subsequent
premature failure of the section). The new model originates
a decrease in stiffness as the ultimate capacity is
approached, when compared to the original model.
B. Impact of the hinge modelling for shear walls
As mentioned above, ductile shear walls are intended to
form a single plastic hinge at their base. Therefore, in the
original model only one hinge was defined for each wall.
However, after the analysis of the structural design, it was
possible to notice the strong reduction of reinforcement
area between the base floor and the first floor, and between
the first and the second floors, which must be taken into
account. Consequently, new PMM hinges were introduced
in the sections characterized by a variation of the
reinforcement area, which creates a relevant vertical
discontinuity that might cause significant structural
damage and originate the failure of the element. The new
hinges introduced in RC shear walls originate a decrease in
both the ultimate displacement and the stiffness, as the
ultimate capacity is approached, when compared to the
original model.
C. Impact of the diaphragm constraint for slabs
As described above, in the original model the slabs were
modelled as rigid diaphragms, assuming that they have a
much higher stiffness in-plane than out-plane and that
there is not a significant stiffness discontinuity in the
structural wall system. However, since the studied building
was designed with lightened slabs of masonry blocks,
oriented in the Y-direction, it is not clear that the storeys
would have a rigid diaphragm behaviour. In fact, an
anisotropic flexible behaviour might be expected, given
that all the infill masonry blocks and concrete beams are
oriented in the same direction. Therefore, a new model was
studied assuming a stiffness modifier of 0.75 in the X-
direction (to simulate the anisotropic effect of the masonry
blocks) and no diaphragm constraint.

9
The model without diaphragm constraint originates, for the
Y- direction and the modal load pattern, a decrease in
stiffness. For the X direction, the new model originates a
very similar result when compared to the original model.
D. Impact of the moment-curvature relationships
assumed for the PMM hinges definition
As mentioned above, for the definition of plasticity curves,
the yield point was originally defined as the moment at
which the strain in the longitudinal reinforcement reaches
the yield strain. The ultimate moment occurs when one of
the fibres reaches its ultimate strain, which can be
conditioned by the failure of reinforcement or concrete.
However, in some sections the moment-curvature
relationship is conditioned by the high normalized axial
load applied in the column. When comparing the M-φ
relationship of the same section when subject to a high
normalized axial load or without axial load, one can notice
a strong reduction of the ultimate curvature (Figure 10-A).
Figure 10 – M-φ relationships for a column: (A)
influence of axial load; and (B) PMM hinge modelling.
The M-φ data for the interacting PMM hinges was obtained
as described in Figure 10-B (solid line). As soon as a
degradation of capacity is noticeable after yielding, it was
firstly assumed that the ultimate point (C) coincides with
the yielding point. However, after performing a pushover
analysis, it was possible to notice that the local collapse of
secondary columns (which was originating the end of the
analyses) was caused by the lack of rotation capacity of the
plastic hinges to contain the imposed displacement and
balance the gravity load. In order to avoid the premature
local collapse of the structure, a new hinge modelling
approach was studied. Instead of considering a brittle
failure, the M-φ relationships were idealised and the
collapse was considered to take place only when one of the
fibres reaches its ultimate strain, even if the moment
capacity decreases substantially. With the new approach
for the definition of PMM hinges the structure reaches a
significantly higher ultimate displacement, which is caused
by the higher rotation capacity of the structural members.
5.3.2. Comparison between plastic hinge
modelling approaches
Comparing the conclusions published by Belejo et al.
(2012) with the results obtained in this work, it is possible
to conclude that the definition of plastic hinges with
hysteretic relationships automatically based on FEMA-356
does not lead to good results for RC 3D structures in
SAP2000. It was possible to notice that in the Y- analysis
the capacity curve stops in a clearly early stage.
The results obtained using the CALTRANS method are
almost coincident with the results obtained using the
original model with PMM hinges. Therefore, one can
conclude that the CALTRANS automatic idealization of
the moment-curvature relationship is similar to the one
assumed for the original model. This approach limits the
rotation capacity of the plastic hinges, assuming that the
structural members would not be capable of containing the
imposed displacement and balance the gravity load. For old
RC structures, the capacity degradation of many sections
after yielding is common. Since this capacity degradation
is very rare in structures designed according to modern
seismic codes, many automatic tools are not prepared to
deal with substandard structural members. Thus, when
using the CALTRANS automatic hinge modelling, the
engineer must be aware of the idealized M-φ relationship
assumed by the model and analyse thoroughly the results,
as the pushover analysis might stop prematurely. It is also
important to mention that, as suggested by Belejo et al.
(2012), none of the tested SAP2000 modelling approaches
was able to reproduce the softening effect of the curve in
the post-peak range, since the analysis stops at the
maximum base shear force.
As described above, in the original model the plastic hinge
length for the RC shear walls was determined according to
the Canadian code (CSA, 2010). However, one can easily
notice that the Canadian formulation is merely dependent
on the member geometry. Annex A of EC8-3 (CEN,
2005a) recommends a plastic hinge length in which the
member geometry, shear span and material properties are
included:
𝐿𝑝 = 𝐿𝑠
30+ 0.2𝑙𝑤 + 0.11
𝑑𝑙𝑓𝑦
√𝑓𝑐
(4)
Where 𝐿𝑠 is the shear span, 𝑙𝑤 is the wall length and 𝑑𝑙 is
the reinforcing bars diameter.
The plastic hinge length estimated according to EC8-3 is
lower that the results obtained according to the Canadian
formulation. In fact, one can easily notice that the EC8-3
formulation is sensitive to the yield strength and
reinforcing bars diameter, which, for the studied building,
are clearly lower than the current practice in modern
seismic design. Therefore, the capacity curves obtained
with the Canadian code approach represent a higher base
shear and ultimate displacement than the curves defined by
the EC8-3 approach. Considering the concrete-steel bond-
slip mechanism caused by the use of smooth plain
reinforcing bars, the low yield strength of reinforcing steel
and the lack of confinement, a conservative option may be
assumed. Therefore, for the application of the N2 method
only the EC8-3 modelling approach was considered.
5.3.3. N2 method for the final model
STEP 1: Definition of the seismic action
According to section 4.4.1. of EC8-3 (CEN, 2005a), the
seismic action to be used for the assessment of existing RC
structures shall be the one corresponding to the elastic (i.e.
unreduced by the behaviour factor q) response spectrum.
In the N2 method, the response spectrum is defined in the
Acceleration-Displacement Format (ADRS), for an elastic
single-degree-of-freedom (SDOF).
A B

10
STEP 2: Pushover analysis – capacity curve
Based on the interpretation of the sensitivity analysis
performed in section 5.3.1. and considering the EC8-3
(CEN, 2005a) formulation for the plastic hinge length, a
final model of the building was created. The capacity
curves obtained by conventional pushover analysis for P-
M2-M3 manual hinges for the original and final models are
presented in Figure 11.
As expected, the curves obtained with a uniform load
pattern represent higher base shear for the same roof
displacements than the curves defined by means of a modal
load pattern. Therefore, adopting a conservative option, the
application of N2 method relates only to the curves
obtained under the action of a modal load pattern.
Figure 11 – Capacity curves for interaction PMM
hinges, for uniform and modal loads.
Analysing the capacity curves of both models, one can
notice that the structure reaches a higher ultimate
displacement for the final model. This difference is caused
by the higher rotation capacity of the structural members,
as a consequence of the new approach for the idealized M-
φ relationship. When analysing the results for the final
model, one can also notice a stiffness reduction and a
shorter elastic stage when compared to the original model,
which are caused by the new M-φ relationships and the new
modelling options (foundations, hinges in shear walls, no
diaphragm constraint and EC8-3 hinge length).
It is possible to observe that the structure presents more
strength along the X-direction due to the orientation of the
main RC frames. Analysing the capacity curves presented
in Figure 11, it turns out that the structure has a similar
initial stiffness in both directions. This conclusion is
consistent with the analytical and experimental natural
frequencies obtained from the modal identification
analysis presented in section 5.2., which were very similar
for both translational modes. The maximum base shear and
the ultimate displacement are presented in Table 6.
Table 6 – Ultimate capacity of the structure for the modal
load pattern.
STEP 3: Equivalent SDOF system
In the N2 method, the structure is modelled as a single-
degree-of-freedom (SDOF) system. The transformation
from the MDOF system to the SDOF system is controlled
by the modal participation factor 𝛤 (Equation 5).
𝛤 = ∑ 𝑚𝑖Φ𝑖𝑖
∑ 𝑚𝑖Φ𝑖2
𝑖
= 𝑚∗
∑ 𝑚𝑖Φ𝑖2
𝑖
(5)
𝛤𝑋 = 1960.1
1415.5= 1.39 𝛤𝑌 =
1774.0
1245.1= 1.42
After obtaining the modal participation factors, the
capacity curves of a SDOF system were computed
following Equations 6.
𝑑∗ = 𝑑𝑛
𝛤=
∆𝑛 𝑅𝑜𝑜𝑓
𝛤 𝐹∗ =
𝑉𝐵
𝛤 (6)
The yield displacement of the SDOF system, dy*, and its
period T* may be computed from Equations 7.
𝑑𝑦∗ = 2 (𝑑𝑚
∗ − 𝐸𝑚
∗
𝐹𝑦∗ ) 𝑇∗ = 2𝜋√
𝑚∗𝑑𝑦∗
𝐹𝑦∗ (7)
Table 7 – Definition of the SDOF capacity curves.
STEP 4: Seismic performance of the structure
For a structure with period T* and unlimited elastic
behaviour the target displacement is given by:
𝑑𝑒𝑡∗ = 𝑆𝑒(𝑇∗) [
𝑇∗
2𝜋]
2
(8)
Where 𝑆𝑒(𝑇∗) is the elastic acceleration response spectrum
at the period T*. For the determination of the target
displacement dt* for structures in the short-period range and
for structures in the medium and long-period ranges
different expressions should be used. According to the
results presented in Table 8, 𝑇∗ ≥ 𝑇𝐶 for both directions
(X and Y), which means that 𝑑𝑡∗ = 𝑑𝑒𝑡
∗ . The last step of the
N2 procedure consists in the transformation of the SDOF
system in a MDOF system, using the transformation factor
previously determined.
Direction 𝑽𝑴𝒂𝒙 (kN) 𝜟𝑹𝒐𝒐𝒇𝑴𝒂𝒙. (m)
X+ and X- 5583 0.173
Y+ 3570 0.115
Y- 2494 0.098
Y+ Analysis Y- Analysis X+ / X- Analysis
Fy* (kN) 2505.8 1750.7 4028.8
dm* (m) 0.081 0.069 0.125
Em* (kJ) 131.62 77.26 308.79
dy* (m) 0.056 0.049 0.097
T* (s) 1.25 1.40 1.36
11
Table 8 – Definition of the target displacement of the
SDOF and MDOF systems.
Analysing the results presented in Table 8 for the reduced
spectrum, the ultimate displacement du* in the Y- direction
is lower than the target displacement dtarget* determined for
the seismic action, which means that the building does not
verify the no-collapse requirement and needs to be
retrofitted. For the analyses in the X and Y+ directions, the
ultimate displacement du* is higher than the target
displacement dtarget*. Furthermore, one can also notice that
if the original elastic spectrum was considered, the ultimate
displacement du* would be lower than the target
displacement dtarget* for both the Y- and Y+ analyses.
5.3.4. Progressive collapse of the RC structure
Progressive collapse occurs when a structure has its
loading path or boundary conditions changed such that
other structural elements within the structure are loaded
beyond their capacity and fail. The spread of local failure,
from element to element, results eventually in the collapse
of the entire structure or a large part of it. The prediction of
possible progressive collapse under specific conditions
may provide very important information that could be used
to assess the performance of the structure and investigate
possible retrofitting strategies to be applied in the most
critical structural members. The structural elements
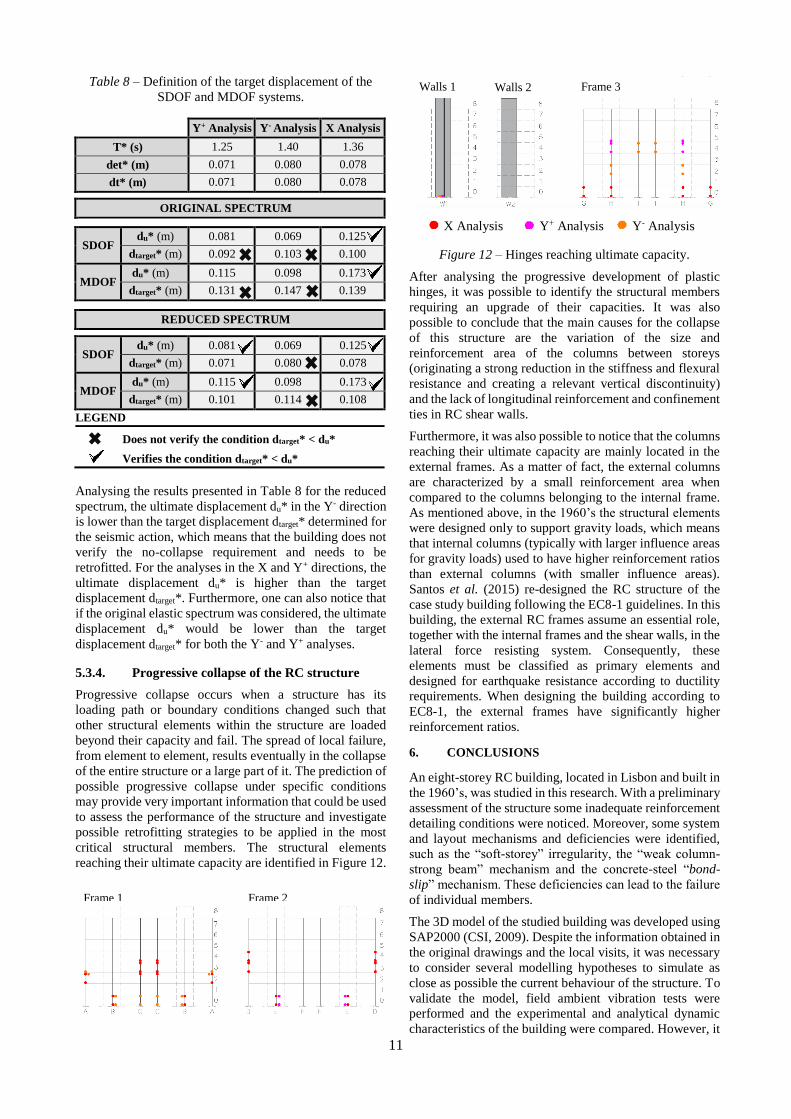
reaching their ultimate capacity are identified in Figure 12.
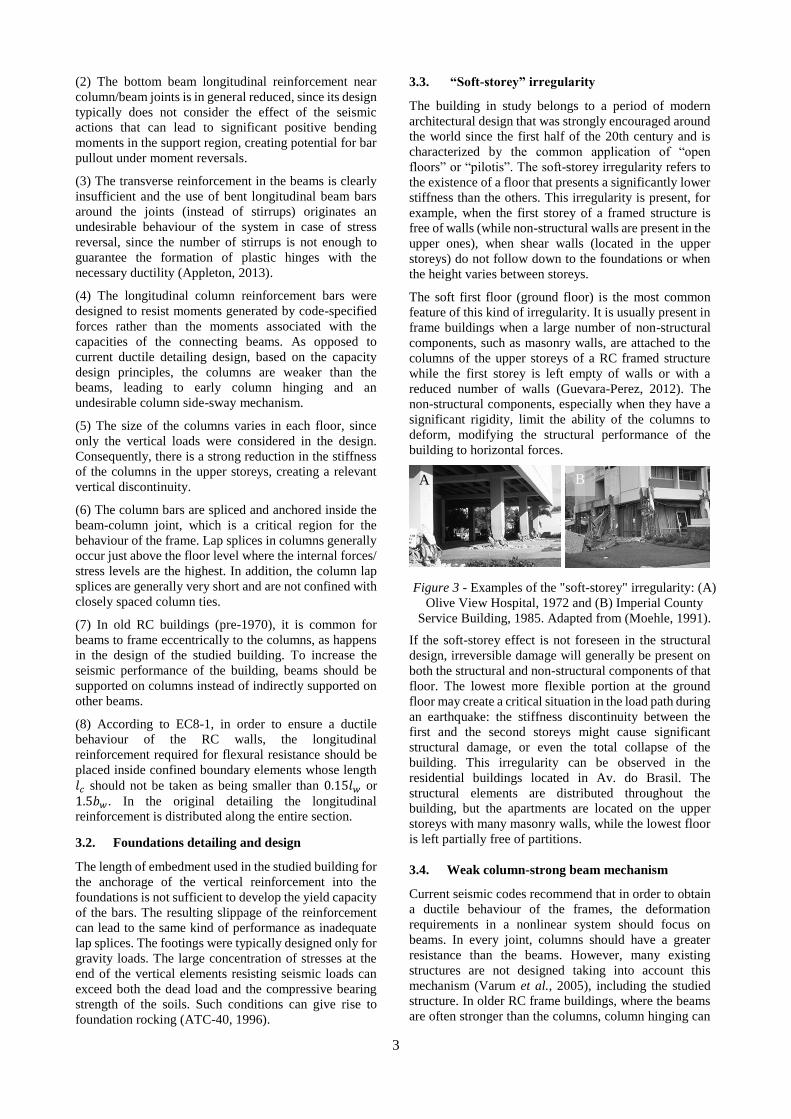
Figure 12 – Hinges reaching ultimate capacity.
After analysing the progressive development of plastic
hinges, it was possible to identify the structural members
requiring an upgrade of their capacities. It was also
possible to conclude that the main causes for the collapse
of this structure are the variation of the size and
reinforcement area of the columns between storeys
(originating a strong reduction in the stiffness and flexural
resistance and creating a relevant vertical discontinuity)
and the lack of longitudinal reinforcement and confinement
ties in RC shear walls.
Furthermore, it was also possible to notice that the columns
reaching their ultimate capacity are mainly located in the
external frames. As a matter of fact, the external columns
are characterized by a small reinforcement area when
compared to the columns belonging to the internal frame.
As mentioned above, in the 1960’s the structural elements
were designed only to support gravity loads, which means
that internal columns (typically with larger influence areas
for gravity loads) used to have higher reinforcement ratios
than external columns (with smaller influence areas).
Santos et al. (2015) re-designed the RC structure of the
case study building following the EC8-1 guidelines. In this
building, the external RC frames assume an essential role,
together with the internal frames and the shear walls, in the
lateral force resisting system. Consequently, these
elements must be classified as primary elements and
designed for earthquake resistance according to ductility
requirements. When designing the building according to
EC8-1, the external frames have significantly higher
reinforcement ratios.
6. CONCLUSIONS
An eight-storey RC building, located in Lisbon and built in
the 1960’s, was studied in this research. With a preliminary
assessment of the structure some inadequate reinforcement
detailing conditions were noticed. Moreover, some system
and layout mechanisms and deficiencies were identified,
such as the “soft-storey” irregularity, the “weak column-
strong beam” mechanism and the concrete-steel “bond-
slip” mechanism. These deficiencies can lead to the failure
of individual members.
The 3D model of the studied building was developed using
SAP2000 (CSI, 2009). Despite the information obtained in
the original drawings and the local visits, it was necessary
to consider several modelling hypotheses to simulate as
close as possible the current behaviour of the structure. To
validate the model, field ambient vibration tests were
performed and the experimental and analytical dynamic
characteristics of the building were compared. However, it
Y+ Analysis Y- Analysis X Analysis
T* (s) 1.25 1.40 1.36
det* (m) 0.071 0.080 0.078
dt* (m) 0.071 0.080 0.078
ORIGINAL SPECTRUM
SDOF du* (m) 0.081 0.069 0.125
dtarget* (m) 0.092 0.103 0.100
MDOF du* (m) 0.115 0.098 0.173
dtarget* (m) 0.131 0.147 0.139
REDUCED SPECTRUM
SDOF du* (m) 0.081 0.069 0.125
dtarget* (m) 0.071 0.080 0.078
MDOF du* (m) 0.115 0.098 0.173
dtarget* (m) 0.101 0.114 0.108
LEGEND
Does not verify the condition dtarget* < du*
Verifies the condition dtarget* < du*
Frame 1 Frame 2
Y- Analysis X Analysis Y+ Analysis
Frame 3 Walls 1 Walls 2

12
should be noted that the identification of frequencies with
in-situ vibration tests was difficult, mainly due to the low
recorded ambient vibration around the building.
The influence of the masonry infill walls on the modal
identification analysis was easily noticed when comparing
the frequencies considering the presence of infills with the
result when their effect was neglected. It is also important
to mention that the frequencies obtained in the SAP2000
computational model after calibration of the input
parameters were very close to the results of the ambient
vibration tests mentioned above.
Comparing the conclusions published by Belejo et al.
(2012) with the results obtained in this research, it is
possible to conclude that the definition of plastic hinges
automatically based on FEMA-356 does not lead to good
results for RC 3D structures in SAP2000.
For old RC structures, the capacity degradation of many
sections after yielding is common, due to the high
normalized axial loads, reduced cross-sections and low
reinforcement ratios. It was possible to conclude that the
CALTRANS automatic hinge modelling limits the rotation
capacity of the plastic hinges, assuming that the structural
members would not be capable of containing the imposed
displacement and balance the gravity load. This
assumption originates the premature failure of some
elements and the end of the analysis due to numerical
instability. In order to avoid the premature local collapse of
the structure, instead of considering a brittle failure of the
sections, the M-φ relationships for the PMM hinges were
idealised and the collapse was considered to take place
only when one of the fibres reaches its ultimate strain, even
if the moment capacity decreases substantially. With this
approach for the manual definition of plastic hinges, the
structure reached a higher ultimate displacement, which is
caused by the higher rotation capacity of the elements.
Once a reasonably accurate model was obtained, new
pushover analyses were run. These analyses showed that
the ultimate displacement in the Y- direction is lower than
the target displacement determined for the reduced
spectrum, which means that the building does not verify
the no-collapse requirement and needs to be retrofitted. If
the original elastic spectrum were considered, the ultimate
displacement would be lower than the target displacement
for both the Y- and Y+ analyses.
After analysing the progressive development of plastic
hinges, it was possible to identify the structural members
requiring an upgrade of their capacities. It is clear that the
main causes for the collapse of this structure are the
variation of the size and reinforcement area of the columns
between storeys, the lack of longitudinal reinforcement and
confinement ties in shear walls and the lack of longitudinal
reinforcement in columns located in the external frames.
Nonlinear static procedures (NSP) were developed with the
aim of overcoming the insufficiency and limitations of
linear methods, whilst at the same time maintaining a
relatively simple application. The methodology followed
in this research provides initial guidelines to assess a RC
building and select the retrofitting strategies and
techniques that would be indicated to strengthen the lateral
force resisting system of the building. However, it must be
emphasized that the N2 method also presents some
limitations. For instance, this procedure does not take into
account higher mode effects and the inclusion of three-
dimensional and torsional effects is very difficult.
The software package used in this work, SAP2000 (CSI,
2009), also presents some limitations. Firstly, and as
suggested by Belejo et al. (2012), none of the tested
SAP2000 modelling approaches was able to reproduce the
softening effect of the curve in the post-peak range, since
the analysis stops at the maximum base shear force.
Secondly, when running pushover analyses in SAP2000,
one must be aware of the influence of nonlinear parameters
for solution control on the capacity curves. Before drawing
conclusions from the results, it is recommended to test
different solution control parameters in order to assess the
sensitivity of the model to these analysis options. In the
future, different software packages, such as PERFORM-
3D (CSI, 2009a) and SeismoStruct (Seismosoft, 2011),
should be tested in order to validate the results obtained
with SAP2000 (CSI, 2009).
REFERENCES
Appleton J. (2013). Estruturas de Betão – Volumes 1 e 2.
Edições Orion, Portugal.
ASCE 41-13 (2013). ASCE/SEI Standard 41-13 - Seismic
Rehabilitation of Existing Buildings. American Society of
Civil Engineers, Reston, VA, USA.
ATC-40 (1996). Seismic Evaluation and Retrofit of
Concrete Buildings. Applied Technology Council, 1, 334,
California, USA.
Belejo A., Bento R., Bhatt C. (2012). Comparison of
different computer programs to predict the seismic
performance of the SPEAR building by means of Pushover
Analysis. In Proceedings of the 15th World Conference on
Earthquake Engineering – WCEE 2012.
Bhatt C. (2012). Seismic Assessment of Existing Buildings
Using Nonlinear Static Procedures (NSPs) – A New 3D
Pushover Procedure. European PhD, Instituto Superior
Técnico – Universidade de Lisboa, Portugal.
Caltrans (2009). Caltrans Seismic Design Criteria –
Version 1.5. Department of Engineering Services,
California Department of Transportation, California, USA.
Castro G. (1970). Deformabilidade das fundações e sua
consideração no cálculo das estruturas. Memória 353,
Laboratório Nacional de Engenharia Civil, Lisboa.
CEN (2002). European Standard EN1991-1-1:2002
Eurocode 1: Actions on structures – Part 1-1: General
actions – Densities, self-weight, imposed loads for
buildings. Comité Européen de Normalisation, Brussels.
CEN (2004a). European Standard EN1998-1:2004
Eurocode 8: Design of structures for earthquake resistance,
Part 1: General rules, seismic actions and rules for
buildings. Comité Européen de Normalisation, Brussels.
CEN (2005a) European Standard EN1998-3:2005
Eurocode 8: Design of structures for earthquake resistance,
Part 3: Assessment and retrofitting of buildings. Comité
Européen de Normalisation, Brussels.

13
CEN (2005b) European Standard EN1998-2:2005
Eurocode 8: Design of structures for earthquake resistance,
Part 2: Bridges. Comité Européen de Normalisation,
Brussels.
CSA (2010). CAN/CSA-A23.3-04 - Design of Concrete
Structures. CSA, Canada.
CSI (2009). SAP2000, Version 16. Software for Structural
Analysis and Design. Computers and Structures Inc. (CSI).
Berkeley, California, USA.
CSI (2009a). PERFORM-3D. Computers and Structures
Inc. (CSI). Berkeley, California, USA.
Deierlein G. G., Reinhorn A. M., Willford M. R. (2010).
Nonlinear Structural Analysis for Seismic Design – A
Guide for Practicing Engineers. NEHRP Seismic Design
Technical Brief No. 4. National Institute of Standards and
Technology, Gaithersburg, MD, USA.
Fajfar P. (2000). A Nonlinear Analysis Method for
Performance Based Seismic Design. Earthquake Spectra,
16(3), 573-592.
Fardis M. N. (2009). Seismic Design, Assessment and
Retrofitting of Concrete Buildings: based on EN- Eurocode
8. Springer, Dordrecht.
FEMA-356 (2000). FEMA 356 - Prestandard and
Commentary for the Seismic Rehabilitation of Buildings.
Federal Emergency Management Agency, USA.
Fernandes C., Varum H., Costa A. (2007). Concrete-steel
bond characterization of RC structural elements built with
smooth plain reinforcement bars. 2nd Symposium
“Connections between Steel and Concrete”, 1-10.
Fernandes C., Melo J., Varum H., Costa A. (2010).
Comportamento cíclico de nós viga-pilar com armadura
lisa. VI Congreso Internacional sobre Patología y
Recuperación de Estructuras, Córdoba (Argentina).
Filiatrault A., Tremblay R., Christopoulos C., Folz B.,
Pettinga D. (2013). Elements of Earthquake Engineering
and Structural Dynamics. Cursus, Presses Internationales
Polytechnique. 3rd Edition. Montreal, Québec, Canada.
Guevara-Perez L. T. (2012). “Soft Story” and “Weak
Story” in Earthquake Resistant Design: A
Multidisciplinary Approach. In Proceedings of the 15th
World Conference on Earthquake Engineering – WCEE
2012, 518-519.
Hannewald P., Beyer K. (2012). Plastic hinge models for
the seismic assessment of reinforced concrete wall-type
piers with detailing deficiencies. In Proceedings of the 15th
World Conference on Earthquake Engineering – WCEE
2012, 518-519.
Mainstone R.J. (1971). On the stiffnesses and strengths of
infilled frames. Proceedings of Institution of Civil
Engineers v 7360s.
Mander J. B., Priestley M. J. N., Park R. (1988).
Theoretical stress-strain model for confined concrete.
Journal of Structural Engineering 114(8): 1804–1826.
McKenna F., Fenves G. L., Scott M. H. and Jeremic B.
(2000). Open System for Earthquake Engineering
Simulation (OpenSees). Pacific Earthquake Engineering
Research Center, University of California, Berkeley, CA.
Moehle J. P., Mahin S. A. (1991). Observations on the
Behaviour of Reinforced Concrete Buildings during
Earthquakes. American Concrete Institute, SP-127,
Earthquake-Resistant Concrete Structures – Inelastic
Response and Design, USA.
Montepio-Geral (1960). Peças Desenhadas do Projeto de
Edifício sito na Avenida do Brasil, Lote 6, Blocos A e B.
Lisboa, Portugal.
NP 834 (1971). Tijolos de barro vermelho para alvenaria.
Formatos. IPQ, Lisbon, Portugal.
Oliveira C. S., Navarro M. (2010). Fundamental periods of
vibration of RC buildings in Portugal from in-situ
experimental and numerical techniques. Bulletin of
Earthquake Engineering, 8(3), 609-642.
Park R., Paulay T. (1975). Reinforced concrete structures.
J. Wiley, New York, USA.
Paulay T., Priestley M. J. N. (1992). Seismic Design of
Reinforced Concrete and Masonry Buildings. Wiley
Interscience.
Pique J. R., Burgos M. (2008). Effective Rigidity of
Reinforced Concrete Elements in Seismic Analysis and
Design. In Proceedings of the 14th World Conference on
Earthquake Engineering, WCEE 2008.
REBAP (1983). Regulamento de Estruturas de Betão
Armado e Pré-Esforçado. Decreto-Lei nº349-C/83, de 30
de Julho. Lisboa, Portugal.
Rodrigues H., Varum H., Costa A. (2010). Simplified
Macro-Model for Infill Masonry Panels. Journal of
Earthquake Engineering, 14(3), 390-416.
RSA (1983). Regulamento de Segurança e Acções para
Estruturas de Edifícios e Pontes. Decreto-Lei nº235/83, de
31 de Maio. Lisboa, Portugal.
Santos D., Costa M., Amorim M., Marques, G. (2015).
Projeto Base de um Edifício de Betão Armado na Avenida
do Brasil, Lisboa. Project for the course “Estruturas de
Edifícios”, Instituto Superior Técnico - Universidade de
Lisboa, Portugal.
Seismosoft (2011). SeismoStruct - A computer program for
static and dynamic nonlinear analysis of framed
structures. Available from http://www.seismosoft.com.
Varum H. (2003). Seismic Assessment, Strengthening and
Repair of Existing Buildings. Thesis to obtain the PhD in
Civil Engineering, Universidade de Aveiro, Portugal.
Varum H., Costa A. G., Pinto A. (2005). Reforço Sísmico
do Património Edificado em Betão Armado. Atas do
2ºSeminário – A Intervenção No Património. Práticas de
Conservação e Reabilitação, 1-22.