Seismic Assessment and Retrofit of Existing Multi … · TECHNICAL REPORT STANDARD TITLE ......
70
Seismic Assessment and Retrofit of Existing Multi-Column Bent Bridges By Cole C. McDaniel, Assistant Professor Department of Civil and Environmental Engineering Washington State University Pullman, WA 99164-2910 Submitted to: The Washington State Department of Transportation
Transcript of Seismic Assessment and Retrofit of Existing Multi … · TECHNICAL REPORT STANDARD TITLE ......

Seismic Assessment and Retrofit of Existing Multi-Column Bent Bridges
By Cole C. McDaniel, Assistant Professor Department of Civil and Environmental Engineering
Washington State University Pullman, WA 99164-2910
Submitted to:
The Washington State Department of Transportation

ii
TECHNICAL REPORT STANDARD TITLE PAGE
1. REPORT NO. 2. GOVERNMENT ACCESSION NO. 3. RECIPIENTS CATALOG NO. WA-RD 639.1
4. TITLE AND SUBTITLE 5. REPORT DATE February 2006
6. PERFORMING ORGANIZATION CODE Seismic Assessment and Retrofit of Existing Multi-Column Bent Bridges
7. AUTHOR(S) 8. PERFORMING ORGANIZATION REPORT NO. Cole C. McDaniel 9. PERFORMING ORGANIZATION NAME AND ADDRESS 10. WORK UNIT NO.
11. CONTRACT OR GRANT NO.
Washington State University Civil and Environmental Engineering Department PO Box 642910 Pullman, WA 99164-2910 Agreement T2696, Task 10
12. SPONSORING AGENCY NAME AND ADDRESS 13. TYPE OF REPORT AND PERIOD COVERED Final Research Report
14. SPONSORING AGENCY CODE Research Office Washington State Department of Transportation Transportation Building, MS 47372 Olympia, WA 98504-7372 Kim Willoughby, Project Manager, 360-705-7978
15. SUPPLEMENTARY NOTES This study was conducted in cooperation with the U.S. Department of Transportation, Federal Highway Administration. 16. ABSTRACT The main objective of this research was to assess the seismic vulnerability of typical pre-1975 WSDOT prestressed concrete multi-column bent bridges. Additional objectives included determining the influence of soil-structure-interaction on the bridge assessment and evaluating the effects of non-traditional retrofit schemes on the global response of the bridges. Overall this research highlighted the vulnerability of non-monolithic bridge decks and shear-dominated bridge columns in pre-1975 WSDOT prestressed concrete multi-column bent bridges as well as the importance of including soil-structure-interaction, calibrating the force/displacement characterization of the columns to experimental test data and detailed modeling of the bridges such as expansion joint/girder interaction. In the end, the seismic assessment of bridges is a cost/efficiency issue. Each bridge is different, therefore, investing in improved analyses up front will enable an efficient use of the limited funds for bridge improvement, resulting in a significant savings overall. 17. KEY WORDS 18. DISTRIBUTION STATEMENT WSDOT, prestressed concrete, multi-column bent, bridges, seismic assessment, retrofit
No restrictions. This document is available to the public through the National Technical Information Service, Springfield, VA 22616
19. SECURITY CLASSIF. (of this report) 20. SECURITY CLASSIF. (of this page) 21. NO. OF PAGES 22. PRICE None None 63

iii
DISCLAIMER
The contents of this report reflect the view of the author, who is responsible for the facts and the accuracy of the data presented herein. The contents do not necessarily reflect the official views or policies of the Washington State Transportation Commission, Department of Transportation, or the Federal Highway Administration. This report does not constitute a standard, specification, or regulation.
iv
TABLE OF CONTENTS Page Table of Tables…..…………………………………………………………………..……..….v Table of Figures……………………………………………………………….….…...............vi Executive Summary ...............................................................................1 Introduction............................................................................................5
Background................................................................................................................................. 5 Objectives ................................................................................................................................... 6 Seismic Activity in Western Washington State .......................................................................... 6 Bridge Modeling ......................................................................................................................... 7
Review of Previous Work ......................................................................8 Research Approach - Hysteresis Model ...............................................9
Calibrating Bridge 5/518 to Stapleton (2004)........................................................................... 10 Research Approach – Bridge Modeling .............................................11
Seismic Excitations................................................................................................................... 11 WSDOT Bridges 5/518, 5/227, and 5/826................................................................................ 17
Introduction........................................................................................................................... 17 Description of Bridges .......................................................................................................... 18 Structural Models.................................................................................................................. 21
Abutment and Column Footing Soil Springs............................................................................ 23 Bridge Soil Spring Stiffness Values ..................................................................................... 25
Earthquake Ground Motion Response Spectra ......................................................................... 28 Bridge Seismic Assessment..................................................................30
Bridge 5/518 Model .............................................................................................................. 31 Bridge 5/826 Model .............................................................................................................. 36 Bridge 5/227 Model .............................................................................................................. 42
WSU-NEABS/RUAUMOKO Comparison .............................................................................. 48 Bridge Retrofit Analytical Findings ...................................................48
Comparison of Retrofitting Schemes........................................................................................ 51 Bridge 5/518 Comparison ..................................................................................................... 51 Bridge 5/826 Comparison ..................................................................................................... 53 Bridge 5/227 Comparison ..................................................................................................... 54
Recommendations ................................................................................59 Acknowledgements...............................................................................60 Resources ..............................................................................................61

v
TABLE OF TABLES Table 1 Bridge 5/518 Soil Spring Stiffnesses ............................................................................... 25 Table 2 Bridge 5/826 Soil Spring Stiffnesses ............................................................................... 26 Table 3 Bridge 5/227 Soil Spring Stiffnesses ............................................................................... 27 Table 4 Bridge Periods and Controlling Modes ........................................................................... 30 Table 5 Bridge 5/518 Column Displacement (Δ), Shear (V), Moment (M), and Curvature (φ)
Demands; Moquegua, Peru EQ......................................................................................... 35 Table 6 Bridge 5/518 Displacement (Δ), Shear (V), Moment (M), and Curvature (φ) Demands;
Olympia, WA EQ.............................................................................................................. 36 Table 7 Bridge 5/826 Displacement (Δ), Shear (V), Moment (M), and Curvature (φ) Demands;
Moquegua, Peru EQ.......................................................................................................... 40 Table 8 Bridge 5/826 Displacement (Δ), Shear (V), Moment (M), and Curvature (φ) Demands;
Mexico City, Mexico EQ.................................................................................................. 41 Table 9 Bridge 5/227 Displacement (Δ), Shear (V), Moment (M), and Curvature (φ) Demands;
Moquegua, Peru EQ.......................................................................................................... 46 Table 10 Bridge 5/227 Displacement (Δ), Shear (V), Moment (M), and Curvature (φ) Demands;
Olympia, WA EQ.............................................................................................................. 47 Table 11 Bridge 5/518 Maximum Reduction in Displacement, Shear and Moment Demands.... 52 Table 12 Bridge 5/826 Maximum Reduction in Displacement, Shear and Moment Demands.... 53 Table 13 Bridge 5/227 Maximum Reduction in Displacement, Shear and Moment Demands.... 55

vi
TABLE OF FIGURES Figure 1 Cascadia Subduction Zone (from Ludwin, 2002) ............................................................ 7 Figure 2 Stapleton Prototype Force-Displacement ....................................................................... 11 Figure 3 Peru Earthquake E-W Spectral Acceleration ................................................................ 14 Figure 4 Modified and Original Peru Earthquake E-W Time History.......................................... 14 Figure 5 Time Histories for Olympia 475..................................................................................... 15 Figure 6 Time Histories for Kobe 475.......................................................................................... 15 Figure 7 Time Histories for Mexico City 475 .............................................................................. 15 Figure 8 Time Histories for Kobe 975.......................................................................................... 16 Figure 9 Time Histories for Olympia 975..................................................................................... 16 Figure 10 Time Histories for Mexico City 975 ............................................................................ 16 Figure 11 Time Histories for Peru 2475 ....................................................................................... 17 Figure 12 Time Histories for Chile 2475...................................................................................... 17 Figure 13 Elevation View for Bridge 5/518 ................................................................................. 18 Figure 14 Plan View of Bridge 5/518 ........................................................................................... 18 Figure 15 Elevation View of Bridge 5/227................................................................................... 18 Figure 16 Plan View of Bridge 5/227 ........................................................................................... 19 Figure 17 Elevation View of Bridge 5/826................................................................................... 19 Figure 18 Plan View of Bridge 5/826 ........................................................................................... 19 Figure 19 (a) Bridge 5/518 Model, (b) Bridge 5/227 Model ........................................................ 21 Figure 20 Bridge 5/826 Spine Model............................................................................................ 22 Figure 21 Abutment Soil Spring Diagram.................................................................................... 24 Figure 22 ARS and DRS of Olympia, WA, Kobe, Japan and Mexico City, Mexico Earthquake
Ground Motions ................................................................................................................ 28 Figure 23 ARS and DRS of Olympia, WA, Kobe, Japan, Mexico City, Mexico, Moquegua,
Peru, and Llolleo, Chile Earthquake Ground Motions ..................................................... 29 Figure 24 Center Bent, Northern Column: Hysteresis Curves for Bridge 5/518; Moquegua, Peru
EQ; Es = 1,000 Ksf; 6,000 Ksf; and 18,000 Ksf ............................................................... 33 Figure 25 Center Bent, Northern Column: Hysteresis Curves for Bridge 5/518; Olympia, WA
EQ; Es = 1,000 Ksf; 6,000 Ksf; and 18,000 Ksf ............................................................... 34 Figure 26 Center Bent, Center Column: Hysteresis Curves for Bridge 5/518; Moquegua, Peru
EQ; Fixed Condition at Column Footings, Roller in Y and Constrained in X and Z Conditions at the Abutment .............................................................................................. 35
Figure 27 Center Bent, Center Column: Hysteresis Curves for Bridge 5/826; Mexico City, Mexico EQ; Es = 100 Ksf; 1,000 Ksf; and 18,000 Ksf..................................................... 38
Figure 28 Center Bent, Center Column: Hysteresis Curves for Bridge 5/826; Moquegua, Peru EQ; Es = 100 Ksf; 1,000 Ksf; and 18,000 Ksf .................................................................. 39
Figure 29 Center Bent, Southern Column: Hysteresis Curves for Bridge 5/826; Moquegua, Peru EQ; Fixed Condition at Column Footings, Roller in Y and Constrained in X and Z Conditions at the Abutment .............................................................................................. 40
Figure 30 Center Bent, Center Column: Hysteresis Curves for Bridge 5/227; Moquegua, Peru EQ; Es = 5 Ksf; 1,000 Ksf; and 18,000 Ksf ...................................................................... 43
Figure 31 Center Bent, Southern Column: Hysteresis Curves for Bridge 5/227; Olympia, WA EQ; Es = 5 Ksf; 1,000 Ksf; and 18,000 Ksf ...................................................................... 44

vii
Figure 32 Center Bent, Northern Column: Hysteresis Curves for Bridge 5/227; Moquegua, Peru EQ; Fixed Condition at Column Footings, Roller in Y and Constrained in X and Z Conditions at the Abutment .............................................................................................. 45
Figure 33 (a) Friction Damper and (b) Viscous Damper Layouts for Bridge 5/518 and 5/227 ... 50 Figure 34 (a) Friction and Viscous Damper Layout for Bridge 5/826 (b) Link Beam Layout for
Bridge 5/227...................................................................................................................... 51

1
Executive Summary The Washington State Department of Transportation (WSDOT) has implemented retrofit
schemes to improve the seismic performance of single column bent bridges throughout western
Washington State. However, numerous multi-column bent bridges are also in need of seismic
upgrade. Multi-column bent bridges targeted for retrofit include 2 to 5 column bents with simple
precast prestressed concrete spans as well as continuous reinforced and prestressed concrete
spans. The majority of these bridges were constructed in the 1950’s and 1960’s. The main
objective of this research was to assess the seismic vulnerability of typical pre-1975 WSDOT
prestressed concrete multi-column bent bridges. Additional objectives included determining the
influence of soil-structure-interaction on the bridge assessment and evaluating the effects of non-
traditional retrofit schemes on the global response of the bridges. WSDOT bridges 5/518, 5/826,
and 5/227 were chosen in collaboration with WSDOT Bridge engineers for these studies. The
bridges varied in span length, column aspect ratio, bridge deck design, and abutment and column
foundation configurations.
Eight earthquake ground motions were used in this research: three 475-year return period
ground motions (Mexico City, Mexico, 1985; Kobe , Japan, 1995; and Olympia, Washington,
1949) with peak ground accelerations (PGA’s) of approximately 0.3g and spectral accelerations
of approximately 0.7g for a structural period of 0.5 seconds (SA(T=0.5s) ; the three bridge
fundamental periods ranged from 0.4-0.6 seconds); three 975-year return period ground motions
(Mexico City, Mexico, 1985; Kobe , Japan, 1995; and Olympia, Washington, 1949) with PGA’s
of approximately 0.5g and SA(T=0.5s) of approximately 1.0g; and two predicted Cascadia
Subduction-Zone (CSZ) earthquake ground motions (Moquegua, Peru, 2001; Llolleo, Chile,
1985) with PGA’s of approximately 0.6g and SA(T=0.5s) of approximately 1.2g. These CSZ ground
2
motion spectral accelerations are similar to the 2003 United States Geological Survey (USGS)
2475-year return period spectral acceleration values for Seattle, WA, for structural periods equal
to 0.5 seconds. All ground motions were modified appropriately to fit target acceleration
response spectra for the Seattle area. As a point of comparison, the 2005 Earthquake
Engineering Research Institute “Scenario for a Magnitude 6.7 Earthquake on the Seattle Fault”
(EERI, 2005) predicted PGA’s in Seattle exceeding 0.7g. In addition, the 2001 Nisqually, WA
earthquake generated PGA’s of approximately 0.3g (EERI, 2005).
The three pre-1975 WSDOT bridges were modeled as spine models with nonlinear
column elements as well as expansion joints and soil-structure-interaction. The hysteretic
behavior of the columns was calibrated to experimental test data for both the flexure-dominated
(Stapleton, 2004) and shear-dominated pre-1975 WSDOT bridge columns (Jaradat, 1996). All
three bridge models were subject to the eight ground motions to assess the bridge seismic
vulnerability. The bridge deck design and the column aspect ratios greatly influenced the bridge
response. For bridges 5/518 and 5/227, with non-monolithic decks and aspect ratios of 3.8 and 3
respectively, the column shear force/displacement demands approached the column shear force
capacity envelope when subjected to the large CSZ ground motions; therefore, column failure is
likely for these bridges in this case. For bridge 5/826, with a monolithic deck, a column aspect
ratio of 4.2, and more column transverse reinforcement than the other two bridges, the column
shear force/displacement demand did not approach the shear capacity envelope when subjected
to the CSZ ground motions. Damage to the expansion joints was predicted for all three bridges
under all the ground motions. Although moderate damage to the bridge columns (including
extensive cracking and spalling of the cover concrete in the plastic hinge region) is likely,

3
column failure was not predicted in any of the bridge analyses using the 975-year return period
ground motions.
The column footings were also assessed in each analysis; significant damage was not
predicted. If the columns were retrofitted, for example by steel jacketing, resulting in an increase
in the column shear force and displacement capacities and potentially an increase in the demands
as well, the demands on the column footings may exceed the capacity of the footings. Therefore,
further investigation of the foundations is necessary if column retrofit is implemented. Due to
failure of prestressed concrete girders in one bridge during the 2001 Nisqually, WA earthquake,
the girder demand/capacity ratios were also monitored closely, however, the demands did not
exceed the capacities in any of the analyses. It is likely that significant dynamic amplification
(which was not assessed in this research) occurred due to pounding of the girders against the
girder stops, resulting in a torsional response of the girders, leading to large girder demands for
that particular bridge. The girder damage in only one bridge during the 2001 Nisqually
earthquake highlights the need for individual bridge assessment beyond simply identifying poor
design details. This requires additional upfront costs for bridge analysis, but the result of
logically prioritizing the bridges for retrofit will lead to significant savings overall.
The soil-structure-interaction study revealed that each bridge responded differently to
variations in soil spring stiffnesses. When soil spring stiffnesses were changed, the maximum
column displacements were noticeably different for all three bridges. Modeling the column
footings with fixed boundary conditions and the abutments with rollers in the longitudinal
direction resulted in inaccurate and often unconservative bridge seismic assessment, particularly
the transverse response of the bridge, illustrating the need for including soil-structure-interaction
to accurately model bridge seismic response.

4
Wrapping bridge columns with steel or composite jackets has already been proven
effective for increasing bridge column force/displacement capacities. Therefore, non-traditional
retrofitting methods were evaluated in this research, including friction dampers, viscous
dampers, and transverse link beams. The goal of the retrofit schemes was to reduce the
displacement demands on the bridges since the column force/displacement demand approached
or exceeded the column shear capacity envelope in the pre-retrofit analyses. Retrofitting with
friction and viscous dampers reduced the column displacement demand in all cases for the three
bridges. Conversely, the transverse link beam retrofits increased column shear
force/displacement demand beyond the column shear capacity envelope. Analytically, the
optimum retrofit method for all three bridges was the viscous damper retrofit. The retrofits with
viscous dampers were effective at reducing displacement and shear force demands in the
columns. However, a cost analysis should be performed in order to choose which retrofit
scheme to use for a given bridge.
Overall this research highlighted the vulnerability of non-monolithic bridge decks and
shear-dominated bridge columns in pre-1975 WSDOT prestressed concrete multi-column bent
bridges as well as the importance of including soil-structure-interaction, calibrating the
force/displacement characterization of the columns to experimental test data and detailed
modeling of the bridges such as expansion joint/girder interaction. In the end, the seismic
assessment of bridges is a cost/efficiency issue. Each bridge is different, therefore, investing in
improved analyses up front will enable an efficient use of the limited funds for bridge
improvement, resulting in a significant savings overall.

5
Introduction
Background
Concrete bridge design inadequacies were revealed in the 1971 San Fernando Earthquake
as well as the more recent 1989 Loma Prieta and 1994 Northridge earthquakes. Even though
these earthquakes occurred in California, similar design issues are present in Washington State
concrete bridges designed prior to 1975. The two main column inadequacies are light
confinement reinforcement and short lap splices. Concrete columns were specified with No. 3 or
No. 4 transverse reinforcing hoops spaced at 30.5 cm (12 in.) on center. To increase the capacity
of the columns at large displacements, current standards require minimum transverse
reinforcement of No. 3 spirals spaced at 10.2 cm (4 in.) on center (AASHTO, 2005). Inadequate
lap splice lengths varying from 20db to 45db located in the plastic hinging regions of the bridge
columns are not sufficient to resist lap splice failure. Current design methodology requires the
lap splice to be a length of 60db and located at the mid-height of the column (AASHTO, 2005).
Other pre-1975 bridge design inadequacies may include inadequate girder seat lengths at the
abutments and bents, inadequately designed column and abutment foundation footings,
inadequate number of girder stops, and poor joint detailing.
Bridges are lifeline structures in the transportation system. While new bridges are
designed with improved seismic details, many existing bridges pose a threat of failure in a large
earthquake. Currently, many pre-1975 single-column bent WSDOT bridges have been
retrofitted, and many multi-column bent bridges have been slated for seismic retrofit. However,
funds for bridge upgrades are limited. This research was funded to assess the need for retrofit of
typical multi-column bent pre-stressed concrete bridges.

6
Objectives
The objectives of this study included:
• Determine the response of three typical WSDOT prestressed concrete multi-column bent
bridges subject to eight earthquake ground motions
• Determine the capacity of the three bridges
• Determine the effects of soil-structure-interaction on the response of the bridges
• Assess seismic retrofit schemes
Seismic Activity in Western Washington State
Large magnitude earthquakes in the Pacific Northwest have occurred along the Cascadia
Subduction Zone (CSZ) where the Juan de Fuca Plate, made of oceanic crust, subducts under the
North American Plate, made of continental crust (see Figure 1). Recent geological evidence
indicates that the potential exists for additional large earthquakes in the Pacific Northwest as a
result of rupturing of the locked interface between the Juan de Fuca and the North American
Plate. This rupture scenario would cause the longest earthquakes experienced in the Pacific
Northwest in modern times (Gregor et al. 2002). Deep subduction zone earthquakes are a
function of the size of the fault. Since the CSZ fault area is large, an earthquake larger than a
moment magnitude of 9 could take place if the rupture occurs along the entire fault (PNSN,
2005).
The duration of strong ground motion at a site is related to the duration of rupture along a
fault. Since the rupture velocity is generally a constant, the duration of rupture is then
proportional to the size of the fault and hence proportional to earthquake magnitude. This
correlation between duration and magnitude has been demonstrated by empirical studies (e.g.

7
Chang and Krinitzsky 1977, Dobry et al. 1978) and is supported by seismological models (e.g.
Hanks and McGuire 1981). It is important to note that events with bilateral rupture (e.g. the
1989 Loma Prieta earthquake) will have significantly lower rupture times and hence will produce
ground motions with shorter durations.
Another type of earthquake that could occur in the Puget Lowland results from crustal
faults. Earthquakes of this mode can reach moment magnitudes of greater than 7 (PNSN, 2005).
Active crustal faults exist under key cities including: Seattle, Tacoma, and Olympia, WA
(PNSN, 2005). Currently, geologic mapping and surveying is being performed to determine how
many additional crustal faults may be active in the Puget Lowlands.
Figure 1 Cascadia Subduction Zone (from Ludwin, 2002)
Bridge Modeling
Three WSDOT bridges, 5/518, 5/826, and 5/227 were selected in collaboration with
WSDOT engineers from a list of bridges slated for retrofit for study in this research.
Constructed between the 1950’s to 1970’s, each bridge is characteristic of pre-1975 design

8
specifications. Ruaumoko3D (Carr, 2004) was used to model and analyze each bridge.
Ruaumoko3D is a nonlinear time-history analysis package. The three bridges were analyzed as
spine models including soil-structure-interaction.
Review of Previous Work
Concrete column failure is generally a result of deficiencies in flexure or shear strength.
Insufficient lateral confinement as well as poor lap splice detailing can result in failure of a
column in flexure. Insufficient transverse reinforcement can lead to shear failure, characterized
by a steep degradation in strength once large enough post-yield displacements are reached.
Short, lightly confined columns are especially susceptible to shear failure. The current seismic
retrofit strategy for bridge substructures in the Pacific Northwest is to encase columns in steel
jackets, thereby, improving the lateral confinement and ensuring a ductile flexural response
rather than limited flexural ductility or a brittle shear mechanism. In the past, conventional
retrofit strategies for single and multi-column bridge bents have been investigated, including
work at Washington State University experimentally by Mealy (1997) and analytically by Zhang
(1997). Professor M. J. Nigel Priestley and Frieder Seible (Priestley et.al. 1996) also have
performed experimental and analytical studies on the retrofit of existing multi-column bridge
bents including the development of the steel jacket concept. Conventional retrofit strategies aim
to increase the bridge capacity.
Another approach is to reduce the bridge demands through passive protective systems
such as friction and viscous dampers. Friction dampers have the distinction of being
independent of excitation velocity and are limited by internal forces. Viscous dampers are
dependant upon velocity and are not limited by forces (Filiatrault, 2002). Friction dampers are
usually designed to only slip during large event earthquakes. Energy is dissipated when the
9
friction surfaces move along the slip plane. Viscous dampers respond out-of-phase with a
structure’s maximum seismic response. As a result, the damper experiences higher forces at
lower structural demand, and lower forces at higher structural demand (Filiatrault, 2002). Large
displacements are required in order for the dampers to be most effective. A thorough literature
review on friction and viscous dampers was presented by Vader (2004). In this work, the
history, the results of research performed, as well as the advantages and disadvantages of
dampers were presented. The reader is referred to this work for more information on friction and
viscous dampers.
An additional method for retrofitting columns is adding a transverse link beam. The
location of the link beam is determined by whether the force or displacement capacity needs to
be increased (Priestly et al., 1996). Placing the link beam at the column mid-height reduces
column displacements most effectively. Placing the link at a higher location reduces the shear
demand in the cap beam most effectively. However, shear demand in the columns will increase
as the stiffness of the bent increases. Thus, adequate column shear capacity should be checked.
If plastic hinging is forced to occur in the columns near the location of the link beam, then large
plastic rotations can be expected.
Research Approach - Hysteresis Model
Determining the appropriate force-displacement characterization for the columns in the
modeled bridges was a key aspect in obtaining accurate results. Failure in lightly confined
concrete bridge columns with inadequate lap splice length can be a function of flexure, shear,
and/or lap splice slippage. Experimental work performed by Jaradat (1996) and Stapleton (2004)
was used to calibrate the force-displacement response for the columns in bridges 5/227, 5/518,
and 5/826. Both experimental programs focused on pre-1975 WSDOT bridge columns; Jaradat

10
(1996) tested shear-dominated columns and Stapleton (2004) tested flexure-dominated columns.
Calibrating the bridge 5/518 column force-displacement response is presented here.
Calibrating Bridge 5/518 to Stapleton (2004)
In this research, pushover analyses were performed for Stapleton’s experimentally tested
column to determine if the force-displacement characterization could properly modeled
analytically. Because the tested columns were scaled to a factor of 1:2, a pushover analyses were
also performed on full scale prototype columns of Stapleton’s research to calibrate the columns
for bridge 5/518. Figure 2 shows the results from one of Stapleton’s full-scale prototype column.
The analytical prediction of the elastic portion of the force-displacement curve matched the
experimental data closely. The solid curve with strength degradation starting at about 3.5 in. (9
cm) was based on curvature ductility values determined from a flexural moment-curvature
analysis (Priestley et al., 1996). The scaled experimental results showed that strength
degradation occurred at curvature ductility larger than the analytical flexural capacity model
predicted. This is expected since the moment curvature analysis prediction is considered
conservative (Priestley et al., 1996). The bold solid curve with strength degradation beginning at
about 1.8 in. (4.6 cm) was based on curvature ductility values determined from lap splice
moment-curvature relationships (Priestley et al., 1996). This prediction was very conservative
and significantly under-predicted the column capacity since the prediction was based on a lap
splice length of 20db while the lap splice length in Stapleton’s column was 35db. This supports
the view that strength degradation in the experimental force-displacement curve did not result
from lap splice failure. The shear capacity envelope proposed by Kowalsky and Priestley (2000)
is represented by the dashed line in the corners of the plot. The shear capacity envelope was not
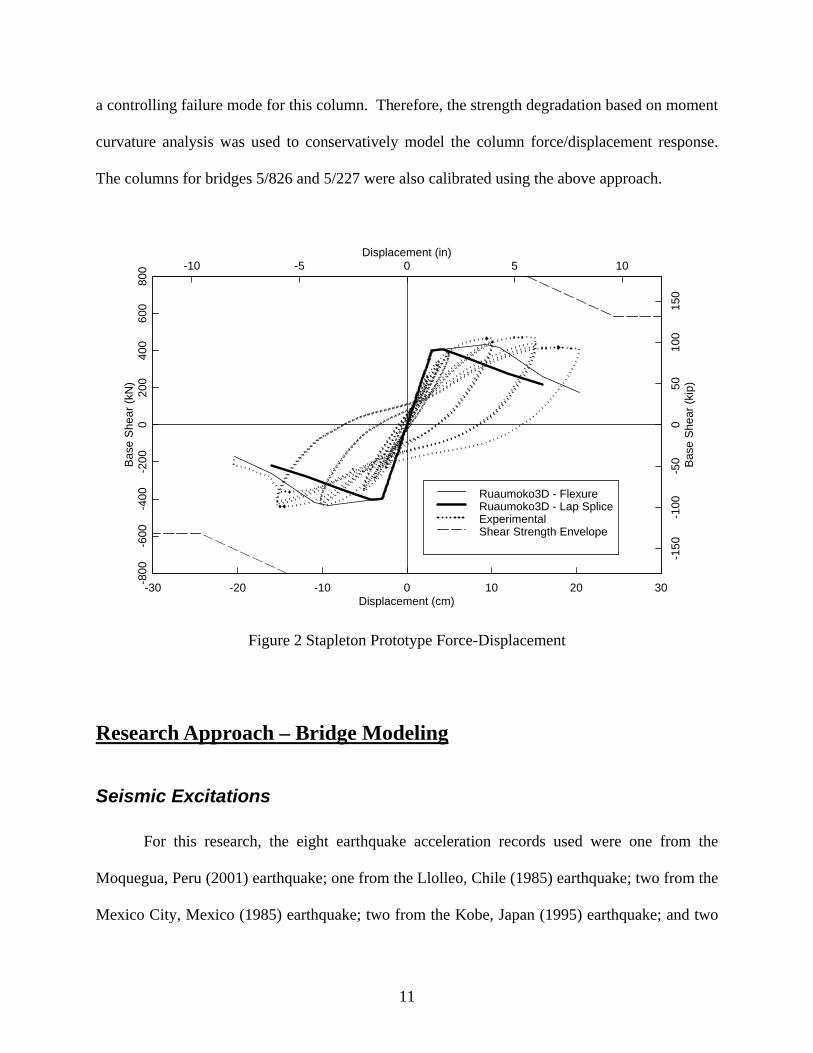
11
a controlling failure mode for this column. Therefore, the strength degradation based on moment
curvature analysis was used to conservatively model the column force/displacement response.
The columns for bridges 5/826 and 5/227 were also calibrated using the above approach.
Displacement (cm)
Bas
e S
hear
(kN
)
-30 -20 -10 0 10 20 30-800
-600
-400
-200
020
040
060
080
0 -10 -5 0 5 10
-150
-100
-50
050
100
150
Displacement (in)
Bas
e S
hear
(kip
)
Ruaumoko3D - FlexureRuaumoko3D - Lap SpliceExperimentalShear Strength Envelope
Figure 2 Stapleton Prototype Force-Displacement
Research Approach – Bridge Modeling
Seismic Excitations
For this research, the eight earthquake acceleration records used were one from the
Moquegua, Peru (2001) earthquake; one from the Llolleo, Chile (1985) earthquake; two from the
Mexico City, Mexico (1985) earthquake; two from the Kobe, Japan (1995) earthquake; and two

12
from the Olympia, Washington (1949) earthquake. Depending upon location in the Puget Sound,
the Moquegua, Peru and Llolleo, Chile earthquakes had a 2475 to 4975-year return period, while
the other six earthquakes had a 475 year and a 975-year return period. The Moquegua, Peru,
Llolleo, Chile, and Mexico City, Mexico ground motions are from long-duration earthquakes,
while the other ground motions are short-duration events. Additionally, the Moquegua, Peru and
Llolleo, Chile ground motions are from subduction-zone earthquakes. The Moquegua, Peru and
Llolleo, Chile ground motions were modified at Washington State University under the direction
of Dr. Adrian Rodriguez-Marek (Stapleton, 2004). The other six ground motions were provided
by WSDOT, which were specifically created by PanGEO Inc. for the Aurora Avenue bridge
retrofit. Background on the provided design ground motions can be found at
http://pangeoinc.com:
“PanGEO provided design ground motions using both probabilistic and deterministic
approaches. The current WSDOT (500-year return interval), CalTrans (1000 year) and
UBC (1000 year) criteria, as well as the 2000 IBC (2,500 year) design requirements were
utilized in the probabilistic approach to develop design ground motions. Geotechnical
and topographical factors that could impact the design ground motions were considered
in our evaluation, including the depth to the bedrock, Seattle Fault, existing fill adjacent
to columns, soil liquefaction, and non-linear dynamic soil properties.” (PanGEO Inc.,
2005).
The vertical component of each ground motion was the N-S component scaled by 2/3.
The N-S and E-W components correspond to the transverse and longitudinal axes of the bridges,
respectively. Three attenuation relationships were reviewed for this study. The Atkinson and
Boore (2003) relationship was chosen as the basis for creating the target spectrum for this
13
research since it includes a near-source saturation term, more precise soil classification than the
other attenuation relationships, and is based on a larger database of ground motions than the
other attenuation relationships, including ground motions with moment magnitudes of 8.0 and
greater.
The attenuation relationship was generated for a soil site (NEHRP Soil type “D”) based
on a moment magnitude 8.5 event. The depth of the rupture is approximately 60km and the
nearest distance to the fault is approximately 65km. The earthquake is the result of interface
slipping. Depth of the rupture and distance to the fault were estimated for the Seattle,
Washington. Ground motions were modified to fit the target 5% damped acceleration spectrum
using the program RSPMATCH (Abrahamson 1998). This program alters the frequency content
of a ground motion by adding pulses of motion in the form of tapered cosine waves. The end
result is a ground motion of the desired frequency content and PGA.
Figure 3 shows the target acceleration spectrum produced by using the attenuation
relationship from Atkinson and Boore (2003), the acceleration spectra of the original East-West
ground motions of the Moquegua, Peru Earthquake, and the acceleration spectra of the modified
Moquegua, Peru Earthquake ground motions after being modified in RSPMATCH (Abrahamson
1998) to match the target acceleration spectrum defined by Atkinson and Boore (2003). Figure 4
shows that the main characteristics of the ground motion were preserved after manipulation.
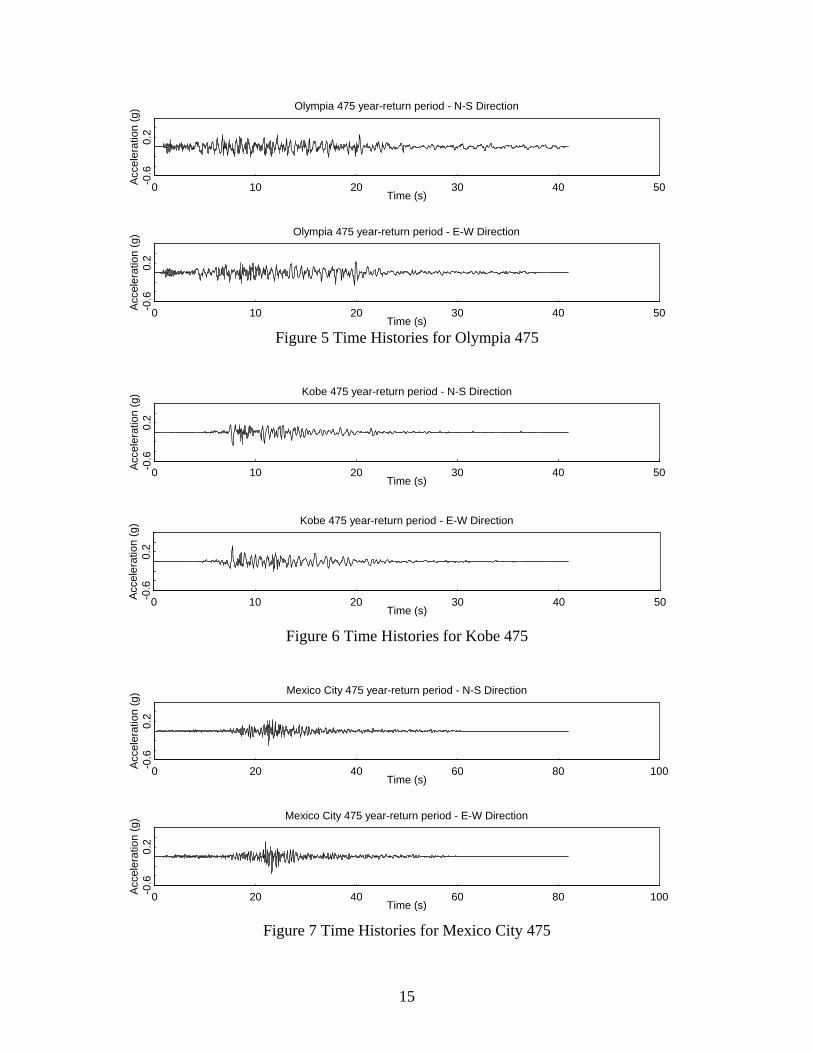
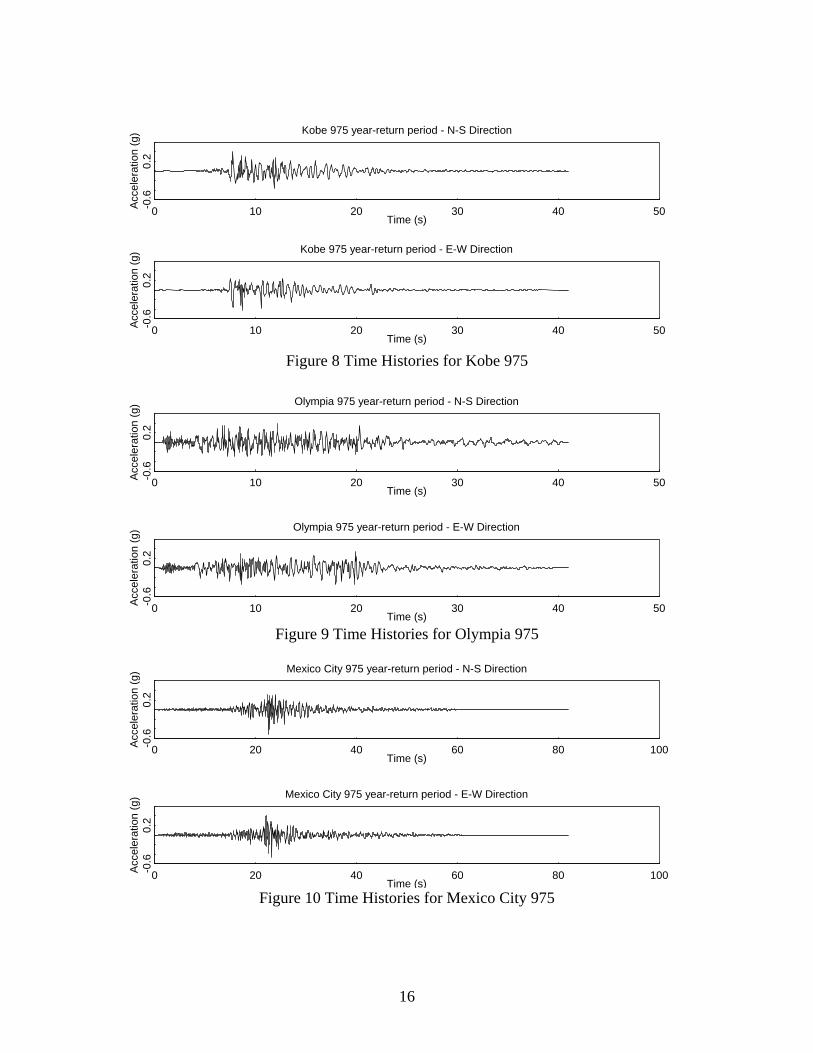
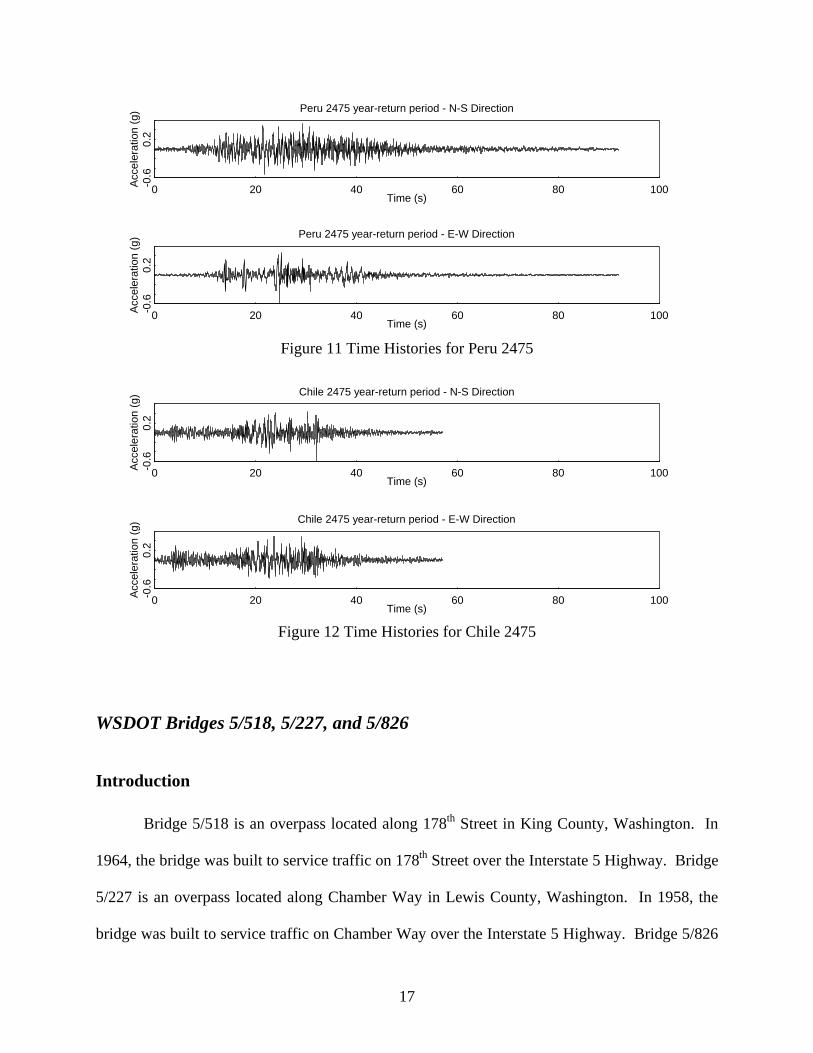
Figures 5 through 12 show the N-S and E-W time-history excitations.

14
0
0.2
0.4
0.6
0.8
1
1.2
1.4
0 0.5 1 1.5 2 2.5 3
Period (sec)
Acc
eler
atio
n (g
)
Target Spectrum Modified Original
Figure 3 Moquegua, Peru Ground Motion (E-W) Spectral Acceleration
-0.4
-0.3
-0.2
-0.1
0
0.1
0.2
0.3
0.4
40 40.5 41 41.5 42 42.5 43 43.5 44 44.5 45
Time (sec)
Original Modified
Figure 4 Modified and Original Moquegua, Peru Ground Motion (E-W) Time History
15
Time (s)0 10 20 30 40 50-0
.60.
2
Olympia 475 year-return period - N-S Direction
Acc
eler
atio
n (g
)
Time (s)0 10 20 30 40 50-0
.60.
2
Olympia 475 year-return period - E-W Direction
Acc
eler
atio
n (g
)
Figure 5 Time Histories for Olympia 475
Time (s)0 10 20 30 40 50-0
.60.
2
Kobe 475 year-return period - N-S Direction
Acc
eler
atio
n (g
)
Time (s)0 10 20 30 40 50-0
.60.
2
Kobe 475 year-return period - E-W Direction
Acce
lera
tion
(g)
Figure 6 Time Histories for Kobe 475
Time (s)0 20 40 60 80 100-0
.60.
2
Mexico City 475 year-return period - N-S Direction
Acc
eler
atio
n (g
)
Time (s)0 20 40 60 80 100-0
.60.
2
Mexico City 475 year-return period - E-W Direction
Acc
eler
atio
n (g
)
Figure 7 Time Histories for Mexico City 475
16
Time (s)0 10 20 30 40 50-0
.60.
2Kobe 975 year-return period - N-S Direction
Acc
eler
atio
n (g
)
Time (s)0 10 20 30 40 50-0
.60.
2
Kobe 975 year-return period - E-W Direction
Acc
eler
atio
n (g
)
Figure 8 Time Histories for Kobe 975
Time (s)0 10 20 30 40 50-0
.60.
2
Olympia 975 year-return period - N-S Direction
Acc
eler
atio
n (g
)
Time (s)0 10 20 30 40 50-0
.60.
2
Olympia 975 year-return period - E-W Direction
Acc
eler
atio
n (g
)
Figure 9 Time Histories for Olympia 975
Time (s)0 20 40 60 80 100-0
.60.
2
Mexico City 975 year-return period - N-S Direction
Acc
eler
atio
n (g
)
Time (s)0 20 40 60 80 100-0
.60.
2
Mexico City 975 year-return period - E-W Direction
Acc
eler
atio
n (g
)
Figure 10 Time Histories for Mexico City 975
17
Time (s)0 20 40 60 80 100-0
.60.
2
Peru 2475 year-return period - N-S Direction
Acc
eler
atio
n (g
)
Time (s)0 20 40 60 80 100-0
.60.
2
Peru 2475 year-return period - E-W Direction
Acc
eler
atio
n (g
)
Figure 11 Time Histories for Peru 2475
Time (s)0 20 40 60 80 100-0
.60.
2
Chile 2475 year-return period - N-S Direction
Acc
eler
atio
n (g
)
Time (s)0 20 40 60 80 100-0
.60.
2
Chile 2475 year-return period - E-W Direction
Acc
eler
atio
n (g
)
Figure 12 Time Histories for Chile 2475
WSDOT Bridges 5/518, 5/227, and 5/826
Introduction
Bridge 5/518 is an overpass located along 178th Street in King County, Washington. In
1964, the bridge was built to service traffic on 178th Street over the Interstate 5 Highway. Bridge
5/227 is an overpass located along Chamber Way in Lewis County, Washington. In 1958, the
bridge was built to service traffic on Chamber Way over the Interstate 5 Highway. Bridge 5/826
18
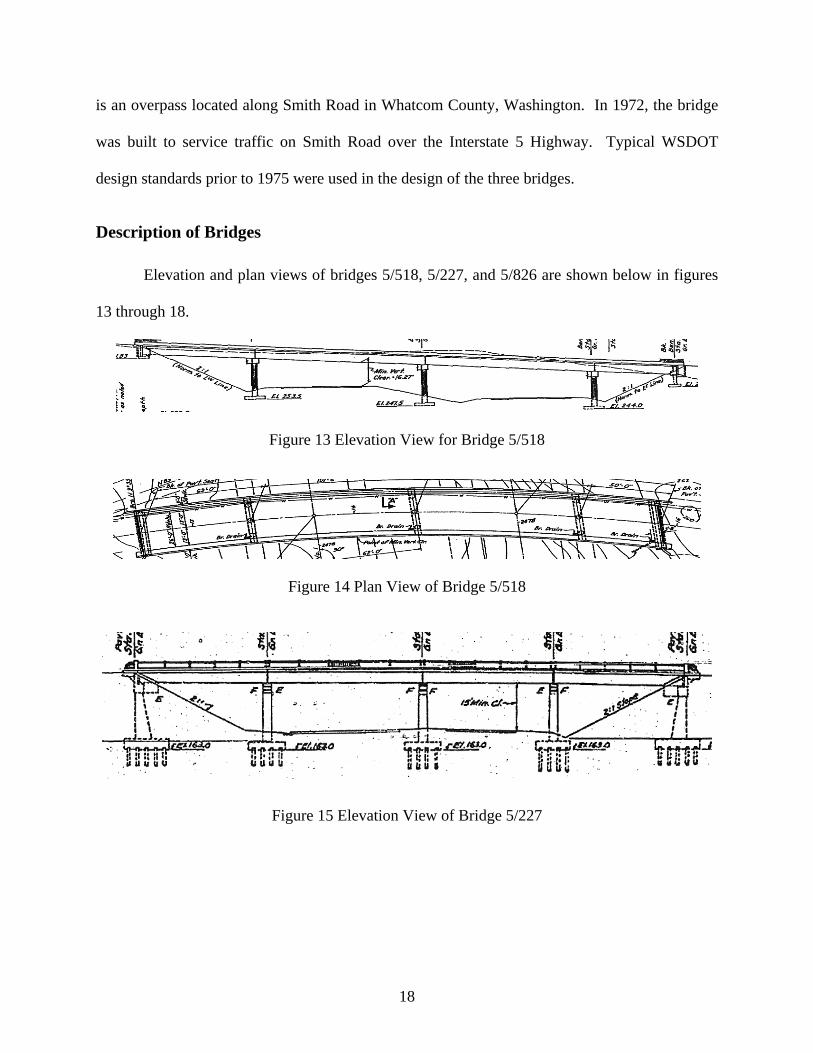
is an overpass located along Smith Road in Whatcom County, Washington. In 1972, the bridge
was built to service traffic on Smith Road over the Interstate 5 Highway. Typical WSDOT
design standards prior to 1975 were used in the design of the three bridges.
Description of Bridges
Elevation and plan views of bridges 5/518, 5/227, and 5/826 are shown below in figures
13 through 18.
Figure 13 Elevation View for Bridge 5/518
Figure 14 Plan View of Bridge 5/518
Figure 15 Elevation View of Bridge 5/227

19
Figure 16 Plan View of Bridge 5/227
Figure 17 Elevation View of Bridge 5/826
Figure 18 Plan View of Bridge 5/826
The bridged decks are composed of pre-cast, pre- and post-tensioned standard WSDOT I-
girders. For bridges 5/518 and 5/227, the I-girders rest upon elastomeric bearing pads located on
top of the column crossbeams and bridge deck abutment seats. For bridge 5/826, these bearing
pads were only located at the abutment seats. The elastomeric bearing pad lies between asphaltic
girder stops located between each neighboring girder at the crossbeam that provides transverse
translational restraint for the bridge deck. The deck for bridges 5/518 and 5/227 was non-
monolithically constructed. Between each span is a 1 in. (2.5 cm) expansion joint. The deck for
bridge 5/826 was monolithically constructed.
20
For bridge 5/518, the height of the columns at the west bent and center bent are
approximately 24 ft (7.3 m). The column heights at the east bent are approximately 21.5 ft (6.6
m). Each column has a cross-sectional diameter of 36 in. (0.91 m). Eleven evenly spaced No.
11 bars provide the longitudinal reinforcement within each column, ρL= 1.68%. Each column
has a lap splice length of 35db. Transverse reinforcement is provided by No. 3 bars spaced at 12
in. (30.5 cm) on center, ρt= 0.118%. Supporting each column is a spread footing.
For bridge 5/227, the height of the columns at the west bent outer columns are 19.4 ft
(5.91 m) while the inner west bent column is about 19 ft (5.79 m). The center bent outer
columns are 19.6 ft (5.97 m) and the inner center bent column is approximately 19 ft (5.79 m).
The column heights at the east bent for the outer columns are 17.6 ft (5.36 m) and the inner
column height is about 18 ft (5.49 m). Each column has a cross-sectional diameter of 36 in.
(0.91 m). Eight evenly spaced No. 10 bars provide the longitudinal reinforcement within each
column, ρL= 0.998%. Each column has a lap splice length of 20db. Transverse reinforcement is
provided by No. 3 bars spaced at 12 in. (30.5 cm) on center, ρt= 0.118%. Supporting each
column is a spread footing with concrete piles.
For bridge 5/826, the height of the columns at the west bent are 25 ft (7.6 m), the center
bent column heights are approximately 28 ft (8.5 m), and the column heights at the east bent are
approximately 26.5 ft (8.1 m). Each column has a cross-sectional diameter of 36 in. (0.91 m).
Seventeen evenly spaced No. 11 bars provide the longitudinal reinforcement within each column,
ρL= 2.61%. Each column has a lap splice length of 45db,. Transverse reinforcement is provided
by No. 4 bars spaced at 6 inches on center, ρt= 0.43%. This is significantly more transverse
confinement than in bridges 5/518 and 5/227. Supporting each column is a spread footing with
treated timber piles.

21
For bridge 5/518, the east abutment is similar to the west abutment, except for two sub-
ground columns with spread footings. For bridge 5/227, two sub-ground columns with spread
footings and concrete piles are located under the west and east abutments. Each sub-ground
footing has 20 concrete piles. For bridge 5/826, the western abutment has two rows of ten treated
timber piles running in the transverse direction. The eastern abutment consists of two rows of
eleven treated timber piles.
The footings and abutment walls were constructed with WSDOT Class B mix concrete
providing a compressive strength of f’c = 3 ksi (20.7 kPa). The rest of the cast-in-place concrete
in the bridges is WSDOT Class A concrete mix with a compressive strength of f’c = 4 ksi (27.6
MPa). The reinforcing steel is Grade 40 with a theoretical yield strength of fy = 40 ksi (276
MPa).
Structural Models
The bridge 5/518, 5/227, and 5/826 models are shown in figures 19 and 20. For bridges
5/518 and 5/227, the internal moments about the local z and x axes were released at the girder
ends to model a simply supported boundary condition at the abutments and bents. The internal
moments at the girder ends were released at only the abutments for bridge 5/826.
(a) (b)
Figure 19 (a) Bridge 5/518 Model, (b) Bridge 5/227 Model
22
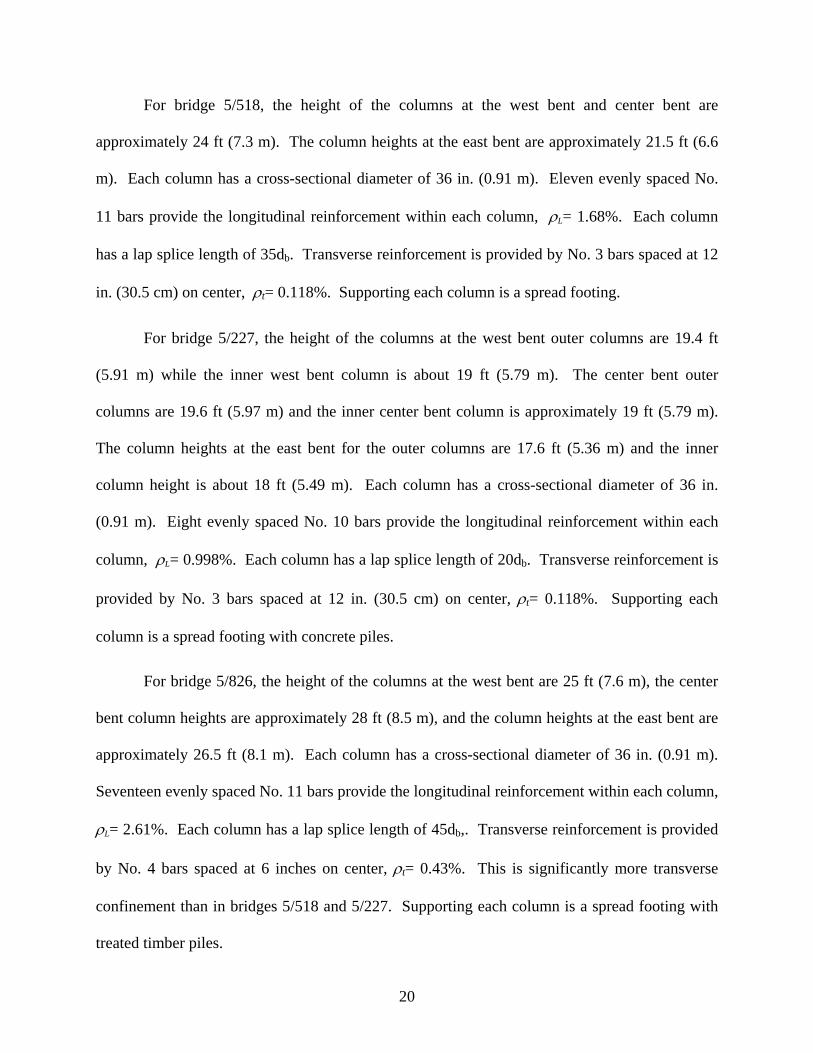
Figure 20 Bridge 5/826 Spine Model
For bridges 5/518 and 5/227, linear springs representing bearing pads connected each
girder to the abutments and bents. For bridge 5/826, these springs existed at only the abutments.
Expansion joints existed at all bents and abutments for bridges 5/518 and 5/227. For bridge
5/826, expansion joints existed only at the abutments. The expansion joints were modeled with
nonlinear multi-spring members. The multi-spring member worked by offsetting nonlinear
springs at discrete distances along the transverse direction of the bridge model. A total height
(h), which was the transverse width of the bridge deck, was specified. Each of these offset
springs had assigned stiffnesses for the translational and rotational degrees of freedom.
Each bridge column was modeled as a nonlinear beam-column element. The moment of
inertia of the column was reduced to account for cracking. The reduction is a function of the
axial load on a column and the longitudinal reinforcing ratio and was calibrated to experimental
data. At the bottom and top of the columns, short rigid frame members existed to replicate the
stiff foundation and crossbeam, respectively. Plastic hinges were modeled at the top and bottom
of the columns in both directions. The Modified Takeda Hysteresis rule was implemented to
describe the post-yield behavior of the columns.
23
Abutment and Column Footing Soil Springs
Abutment and footing soil stiffness springs were varied to study the effects on the
response of the bridges. To determine the abutment and column footing soil spring stiffness
values, the methods proposed by Lam et al. (1986) and CALTRANS (2004) were used. For
bridges 5/826 and 5/227 with stiffness contributions from piles, the computer program LPILE4.0
(2000) was used. Pile group effects have been considered based on pile spacing for each footing.
Reduction was based on recommendations given by WSDOT (2005).
The demand on the bridge footings did not exceed the design capacity, so yielding was
not considered in the modeling of the column footings or abutment footings. The soil modulus
of elasticity (Es) was modified to vary the soil spring stiffness values. The soil modulus of
elasticity was only varied for the spread footing contribution of the bridge models. This was due
to limited information regarding the soil type along the length of the piles and the high variability
of soil conditions along the length of the piles. For all analyses, Poisson’s ratio was set at 0.45, a
common value for saturated soils (Bowles, 1995). Nonlinear behavior of soil was simplified into
a secant stiffness relationship.
A secant spring stiffness was implemented to account for the longitudinal abutment
backwall stiffness also. The secant stiffness was based upon the procedure presented in chapter
7 of the CALTRANS seismic design criteria (CALTRANS, 2004). Because all abutments in this
research are non-monolithic, only the stiffness from the abutment structure was enacted until the
gap between the bridge deck and abutment back wall was closed. The longitudinal stiffness at
each abutment was divided in half to address the passive resistance of the mobilized soil. Due to
lack of or very short wingwalls, the contribution to the transverse resistance was ignored.
Figure 21 is a diagram of the three stiffness components of the abutments. The contribution
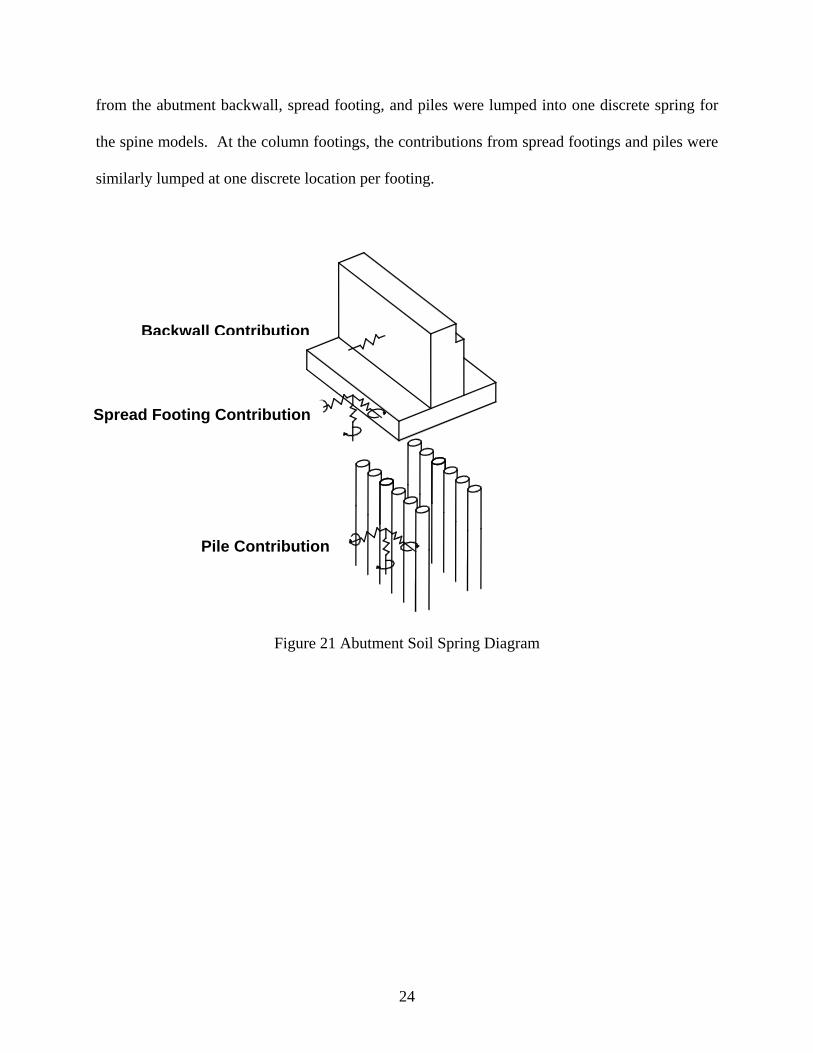
24
from the abutment backwall, spread footing, and piles were lumped into one discrete spring for
the spine models. At the column footings, the contributions from spread footings and piles were
similarly lumped at one discrete location per footing.
Figure 21 Abutment Soil Spring Diagram
Backwall Contribution
Spread Footing Contribution
Pile Contribution
25
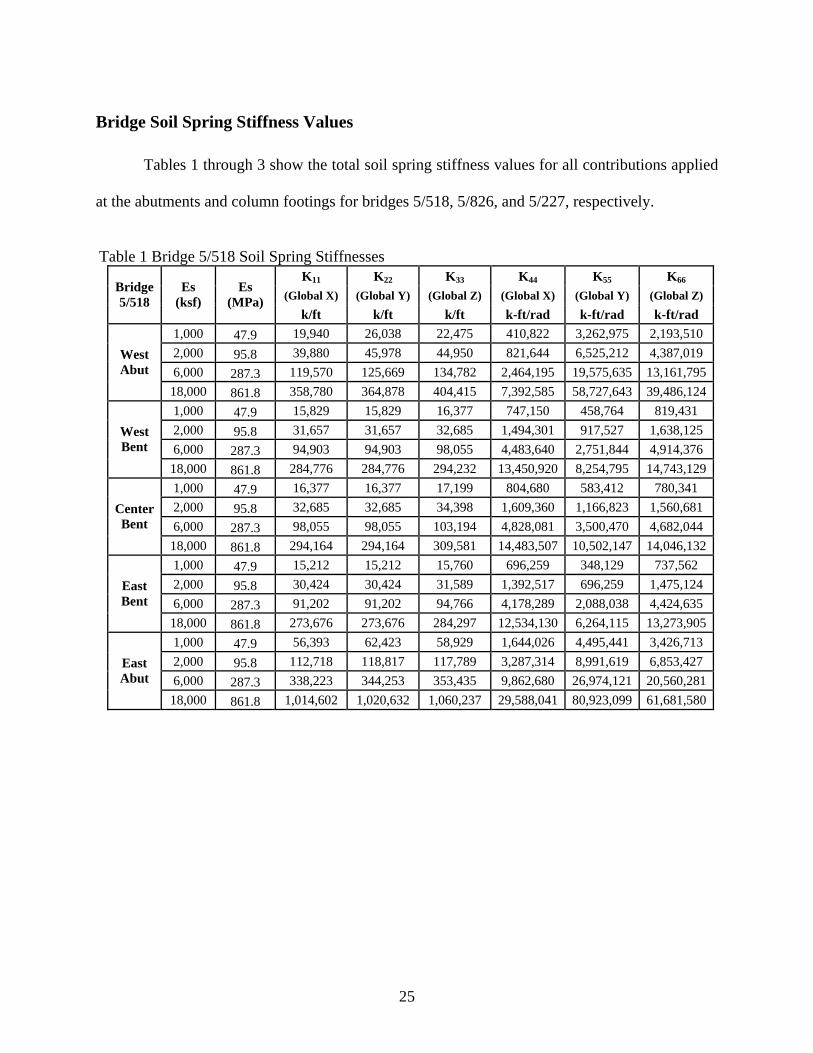
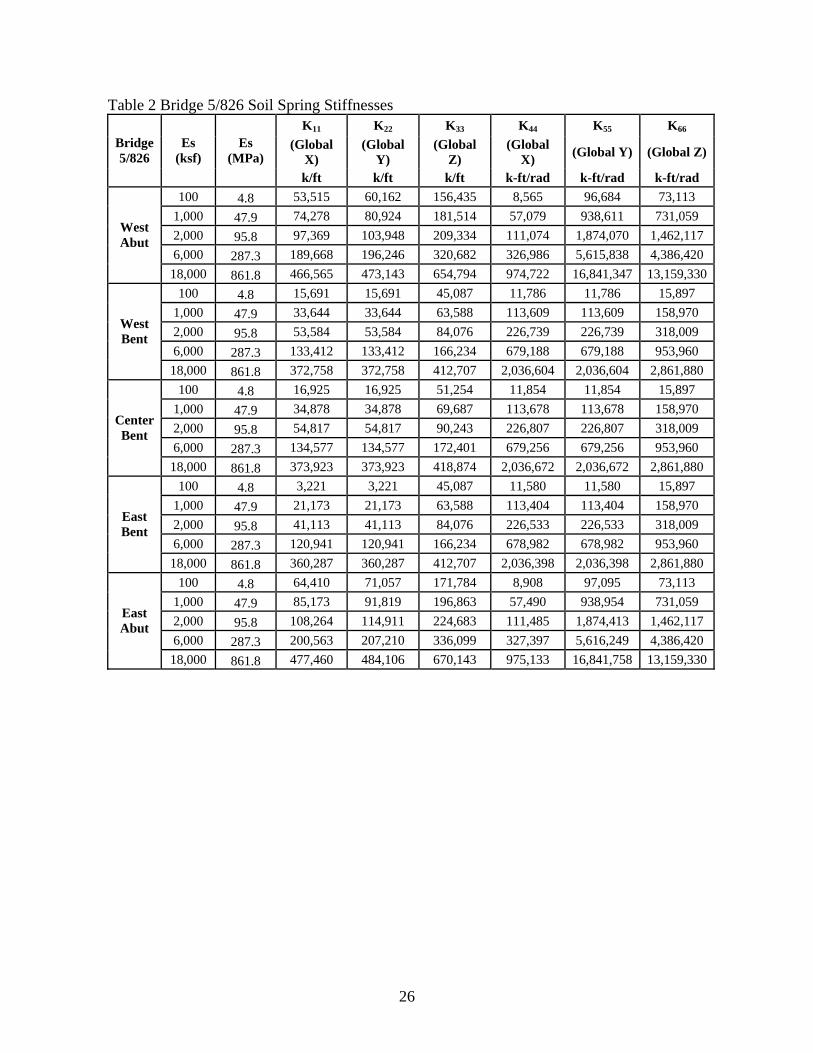
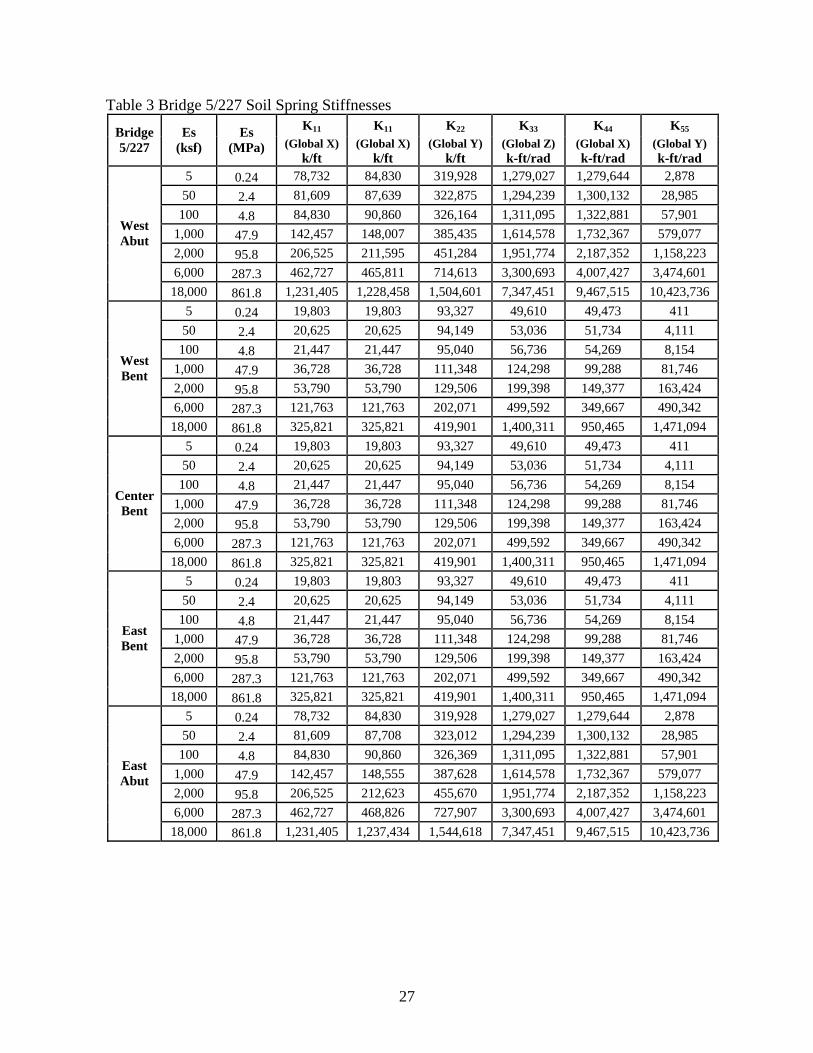
Bridge Soil Spring Stiffness Values
Tables 1 through 3 show the total soil spring stiffness values for all contributions applied
at the abutments and column footings for bridges 5/518, 5/826, and 5/227, respectively.
Table 1 Bridge 5/518 Soil Spring Stiffnesses
K11 K22 K33 K44 K55 K66 (Global X) (Global Y) (Global Z) (Global X) (Global Y) (Global Z)
Bridge 5/518
Es (ksf)
Es (MPa)
k/ft k/ft k/ft k-ft/rad k-ft/rad k-ft/rad 1,000 47.9 19,940 26,038 22,475 410,822 3,262,975 2,193,510 2,000 95.8 39,880 45,978 44,950 821,644 6,525,212 4,387,019 6,000 287.3 119,570 125,669 134,782 2,464,195 19,575,635 13,161,795
West Abut
18,000 861.8 358,780 364,878 404,415 7,392,585 58,727,643 39,486,1241,000 47.9 15,829 15,829 16,377 747,150 458,764 819,431 2,000 95.8 31,657 31,657 32,685 1,494,301 917,527 1,638,125 6,000 287.3 94,903 94,903 98,055 4,483,640 2,751,844 4,914,376
West Bent
18,000 861.8 284,776 284,776 294,232 13,450,920 8,254,795 14,743,1291,000 47.9 16,377 16,377 17,199 804,680 583,412 780,341 2,000 95.8 32,685 32,685 34,398 1,609,360 1,166,823 1,560,681 6,000 287.3 98,055 98,055 103,194 4,828,081 3,500,470 4,682,044
Center Bent
18,000 861.8 294,164 294,164 309,581 14,483,507 10,502,147 14,046,1321,000 47.9 15,212 15,212 15,760 696,259 348,129 737,562 2,000 95.8 30,424 30,424 31,589 1,392,517 696,259 1,475,124 6,000 287.3 91,202 91,202 94,766 4,178,289 2,088,038 4,424,635
East Bent
18,000 861.8 273,676 273,676 284,297 12,534,130 6,264,115 13,273,9051,000 47.9 56,393 62,423 58,929 1,644,026 4,495,441 3,426,713 2,000 95.8 112,718 118,817 117,789 3,287,314 8,991,619 6,853,427 6,000 287.3 338,223 344,253 353,435 9,862,680 26,974,121 20,560,281
East Abut
18,000 861.8 1,014,602 1,020,632 1,060,237 29,588,041 80,923,099 61,681,580
26
Table 2 Bridge 5/826 Soil Spring Stiffnesses K11 K22 K33 K44 K55 K66
(Global X)
(Global Y)
(Global Z)
(Global X) (Global Y) (Global Z)
Bridge 5/826
Es (ksf)
Es (MPa)
k/ft k/ft k/ft k-ft/rad k-ft/rad k-ft/rad 100 4.8 53,515 60,162 156,435 8,565 96,684 73,113
1,000 47.9 74,278 80,924 181,514 57,079 938,611 731,059 2,000 95.8 97,369 103,948 209,334 111,074 1,874,070 1,462,117 6,000 287.3 189,668 196,246 320,682 326,986 5,615,838 4,386,420
West Abut
18,000 861.8 466,565 473,143 654,794 974,722 16,841,347 13,159,330100 4.8 15,691 15,691 45,087 11,786 11,786 15,897
1,000 47.9 33,644 33,644 63,588 113,609 113,609 158,970 2,000 95.8 53,584 53,584 84,076 226,739 226,739 318,009 6,000 287.3 133,412 133,412 166,234 679,188 679,188 953,960
West Bent
18,000 861.8 372,758 372,758 412,707 2,036,604 2,036,604 2,861,880 100 4.8 16,925 16,925 51,254 11,854 11,854 15,897
1,000 47.9 34,878 34,878 69,687 113,678 113,678 158,970 2,000 95.8 54,817 54,817 90,243 226,807 226,807 318,009 6,000 287.3 134,577 134,577 172,401 679,256 679,256 953,960
Center Bent
18,000 861.8 373,923 373,923 418,874 2,036,672 2,036,672 2,861,880 100 4.8 3,221 3,221 45,087 11,580 11,580 15,897
1,000 47.9 21,173 21,173 63,588 113,404 113,404 158,970 2,000 95.8 41,113 41,113 84,076 226,533 226,533 318,009 6,000 287.3 120,941 120,941 166,234 678,982 678,982 953,960
East Bent
18,000 861.8 360,287 360,287 412,707 2,036,398 2,036,398 2,861,880 100 4.8 64,410 71,057 171,784 8,908 97,095 73,113
1,000 47.9 85,173 91,819 196,863 57,490 938,954 731,059 2,000 95.8 108,264 114,911 224,683 111,485 1,874,413 1,462,117 6,000 287.3 200,563 207,210 336,099 327,397 5,616,249 4,386,420
East Abut
18,000 861.8 477,460 484,106 670,143 975,133 16,841,758 13,159,330
27
Table 3 Bridge 5/227 Soil Spring Stiffnesses K11 K11 K22 K33 K44 K55 Bridge
5/227 Es
(ksf) Es
(MPa) (Global X) k/ft
(Global X) k/ft
(Global Y) k/ft
(Global Z) k-ft/rad
(Global X) k-ft/rad
(Global Y) k-ft/rad
5 0.24 78,732 84,830 319,928 1,279,027 1,279,644 2,878 50 2.4 81,609 87,639 322,875 1,294,239 1,300,132 28,985
100 4.8 84,830 90,860 326,164 1,311,095 1,322,881 57,901 1,000 47.9 142,457 148,007 385,435 1,614,578 1,732,367 579,077 2,000 95.8 206,525 211,595 451,284 1,951,774 2,187,352 1,158,223 6,000 287.3 462,727 465,811 714,613 3,300,693 4,007,427 3,474,601
West Abut
18,000 861.8 1,231,405 1,228,458 1,504,601 7,347,451 9,467,515 10,423,736 5 0.24 19,803 19,803 93,327 49,610 49,473 411
50 2.4 20,625 20,625 94,149 53,036 51,734 4,111 100 4.8 21,447 21,447 95,040 56,736 54,269 8,154
1,000 47.9 36,728 36,728 111,348 124,298 99,288 81,746 2,000 95.8 53,790 53,790 129,506 199,398 149,377 163,424 6,000 287.3 121,763 121,763 202,071 499,592 349,667 490,342
West Bent
18,000 861.8 325,821 325,821 419,901 1,400,311 950,465 1,471,094 5 0.24 19,803 19,803 93,327 49,610 49,473 411
50 2.4 20,625 20,625 94,149 53,036 51,734 4,111 100 4.8 21,447 21,447 95,040 56,736 54,269 8,154
1,000 47.9 36,728 36,728 111,348 124,298 99,288 81,746 2,000 95.8 53,790 53,790 129,506 199,398 149,377 163,424 6,000 287.3 121,763 121,763 202,071 499,592 349,667 490,342
Center Bent
18,000 861.8 325,821 325,821 419,901 1,400,311 950,465 1,471,094 5 0.24 19,803 19,803 93,327 49,610 49,473 411
50 2.4 20,625 20,625 94,149 53,036 51,734 4,111 100 4.8 21,447 21,447 95,040 56,736 54,269 8,154
1,000 47.9 36,728 36,728 111,348 124,298 99,288 81,746 2,000 95.8 53,790 53,790 129,506 199,398 149,377 163,424 6,000 287.3 121,763 121,763 202,071 499,592 349,667 490,342
East Bent
18,000 861.8 325,821 325,821 419,901 1,400,311 950,465 1,471,094 5 0.24 78,732 84,830 319,928 1,279,027 1,279,644 2,878
50 2.4 81,609 87,708 323,012 1,294,239 1,300,132 28,985 100 4.8 84,830 90,860 326,369 1,311,095 1,322,881 57,901
1,000 47.9 142,457 148,555 387,628 1,614,578 1,732,367 579,077 2,000 95.8 206,525 212,623 455,670 1,951,774 2,187,352 1,158,223 6,000 287.3 462,727 468,826 727,907 3,300,693 4,007,427 3,474,601
East Abut
18,000 861.8 1,231,405 1,237,434 1,544,618 7,347,451 9,467,515 10,423,736

28
Earthquake Ground Motion Response Spectra In an effort to characterize the response of the bridges with respect to the four
earthquakes, an acceleration response spectrum (ARS) and displacement response spectrum
(DRS) were created in the program SPECTRA (Carr, 2004) for each earthquake. The equivalent
viscous damping was set at 5% of critical; the same value used in the bridge models. Figures 23
and 23 show the ARS and DRS for the transverse and longitudinal directions of the; Olympia,
WA, Mexico City, Mexico, Kobe, Japan, Moquegua, Peru and Llolleo, Chile earthquake ground
motions, respectively.
0.0 0.5 1.0 1.5 2.0
0.0
0.4
0.8 Transverse
Longitudinal
Olympia 475 EQ
Spe
c. A
cc. (
g)
Period (s)
0
0.0 0.5 1.0 1.5 2.0
05
1015
20
TransverseLongitudinal
02
46
Spe
c. D
isp.
(cm
)
Period (s)
Spec
. Dis
p. (i
n)
0.0 0.5 1.0 1.5 2.0
0.0
0.4
0.8 Transverse
Longitudinal
Kobe 475 EQ
Spec
. Acc
. (g)
Period (s)
0
0.0 0.5 1.0 1.5 2.0
05
1015
20
TransverseLongitudinal
02
46
Spec
. Dis
p. (c
m)
Period (s)
Spec
. Dis
p. (i
n)
0.0 0.5 1.0 1.5 2.0
0.0
0.4
0.8 Transverse
Longitudinal
Mexico City 475 EQ
Spec
. Acc
. (g)
Period (s)
0
0.0 0.5 1.0 1.5 2.0
05
1015
20
TransverseLongitudinal
02
46
Spec
. Dis
p. (c
m)
Period (s)
Spec
. Dis
p. (i
n)
Figure 22 ARS and DRS of Olympia, WA, Kobe, Japan and Mexico City, Mexico Earthquake Ground Motions

29
0.0 0.5 1.0 1.5 2.0
0.0
1.0
2.0
TransverseLongitudinal
Olympia 975 EQS
pec.
Acc
. (g)
Period (s)
0
0.0 0.5 1.0 1.5 2.0
010
2030
40
TransverseLongitudinal
04
812
Spe
c. D
isp.
(cm
)
Period (s)
Spe
c. D
isp.
(in)
0.0 0.5 1.0 1.5 2.0
0.0
1.0
2.0
TransverseLongitudinal
Kobe 975 EQ
Spe
c. A
cc. (
g)
Period (s)0
0.0 0.5 1.0 1.5 2.0
010
2030
40
TransverseLongitudinal
04
812
Spe
c. D
isp.
(cm
)
Period (s)
Spe
c. D
isp.
(in)
0.0 0.5 1.0 1.5 2.0
0.0
1.0
2.0
TransverseLongitudinal
Mexico City 975 EQ
Spe
c. A
cc. (
g)
Period (s)
0
0.0 0.5 1.0 1.5 2.0
010
2030
40TransverseLongitudinal
04
812
Spe
c. D
isp.
(cm
)
Period (s)
Spe
c. D
isp.
(in)
0.0 0.5 1.0 1.5 2.0
0.0
1.0
2.0 Peru 2475 EQ
Spec
Acc
(g)
Period (s)
TransverseLongitudinal
0
0.0 0.5 1.0 1.5 2.0
010
2030
40
TransverseLongitudinal
04
812
Spec
Dis
p (c
m)
Period (s)
Spec
Dis
p (in
)
0.0 0.5 1.0 1.5 2.0
0.0
1.0
2.0 Chile 2475 EQ
Spec
Acc
(g)
Period (s)
TransverseLongitudinal
0
0.0 0.5 1.0 1.5 2.0
010
2030
40
TransverseLongitudinal
04
812
Spec
. Dis
p. (c
m)
Period (s)
Spec
. Dis
p. (i
n)
Figure 23 ARS and DRS of Olympia, WA, Kobe, Japan, Mexico City, Mexico, Moquegua, Peru, and Llolleo, Chile Earthquake Ground Motions
30
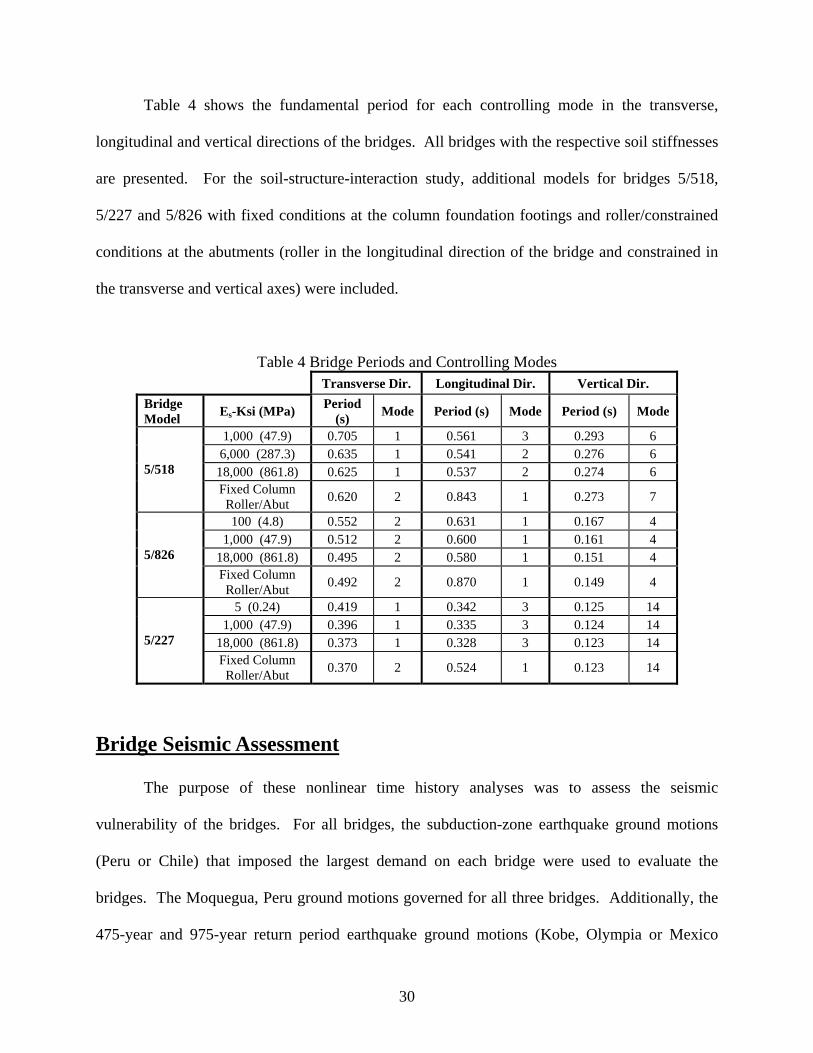
Table 4 shows the fundamental period for each controlling mode in the transverse,
longitudinal and vertical directions of the bridges. All bridges with the respective soil stiffnesses
are presented. For the soil-structure-interaction study, additional models for bridges 5/518,
5/227 and 5/826 with fixed conditions at the column foundation footings and roller/constrained
conditions at the abutments (roller in the longitudinal direction of the bridge and constrained in
the transverse and vertical axes) were included.
Table 4 Bridge Periods and Controlling Modes Transverse Dir. Longitudinal Dir. Vertical Dir. Bridge Model Es-Ksi (MPa) Period
(s) Mode Period (s) Mode Period (s) Mode
1,000 (47.9) 0.705 1 0.561 3 0.293 6 6,000 (287.3) 0.635 1 0.541 2 0.276 6
18,000 (861.8) 0.625 1 0.537 2 0.274 6 5/518 Fixed Column Roller/Abut 0.620 2 0.843 1 0.273 7
100 (4.8) 0.552 2 0.631 1 0.167 4 1,000 (47.9) 0.512 2 0.600 1 0.161 4
18,000 (861.8) 0.495 2 0.580 1 0.151 4 5/826 Fixed Column Roller/Abut 0.492 2 0.870 1 0.149 4
5 (0.24) 0.419 1 0.342 3 0.125 14 1,000 (47.9) 0.396 1 0.335 3 0.124 14
18,000 (861.8) 0.373 1 0.328 3 0.123 14 5/227 Fixed Column Roller/Abut 0.370 2 0.524 1 0.123 14
Bridge Seismic Assessment The purpose of these nonlinear time history analyses was to assess the seismic
vulnerability of the bridges. For all bridges, the subduction-zone earthquake ground motions
(Peru or Chile) that imposed the largest demand on each bridge were used to evaluate the
bridges. The Moquegua, Peru ground motions governed for all three bridges. Additionally, the
475-year and 975-year return period earthquake ground motions (Kobe, Olympia or Mexico
31
City) that imposed the largest demand on each bridge was used. For bridge 5/518 and 5/227, this
was the Olympia, WA ground motions. The controlling earthquake ground motions for bridge
5/826 was Mexico City, Mexico.
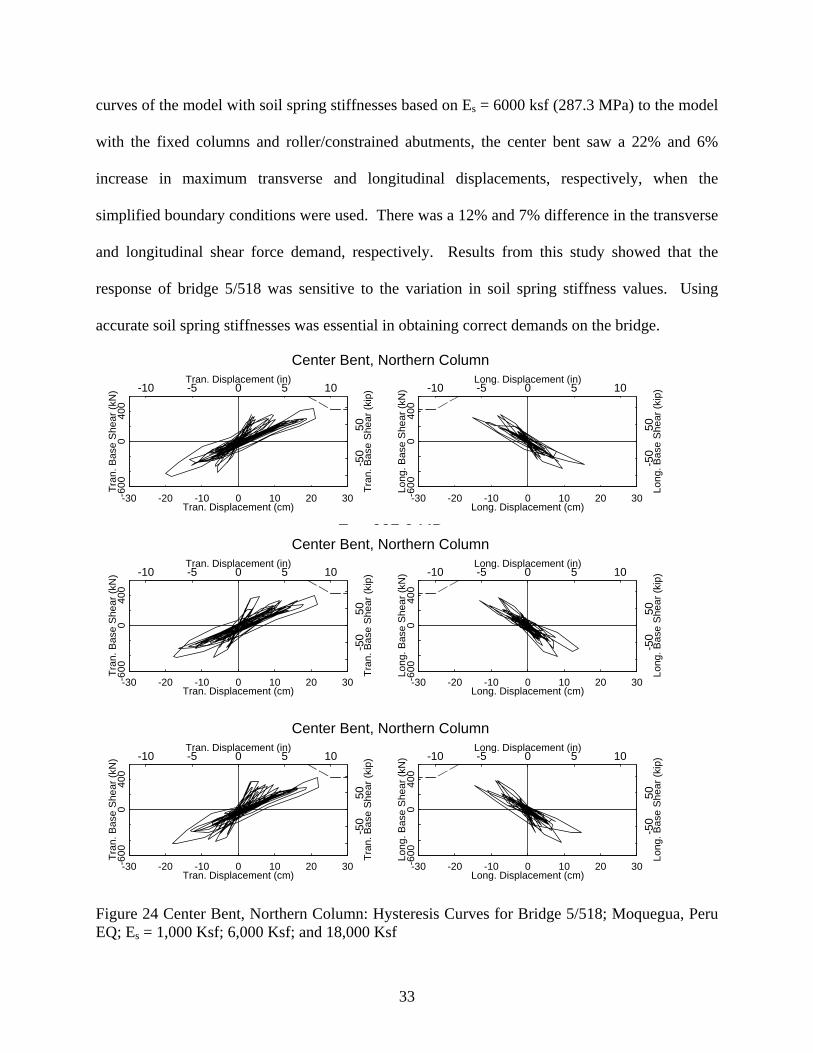
Bridge 5/518 Model
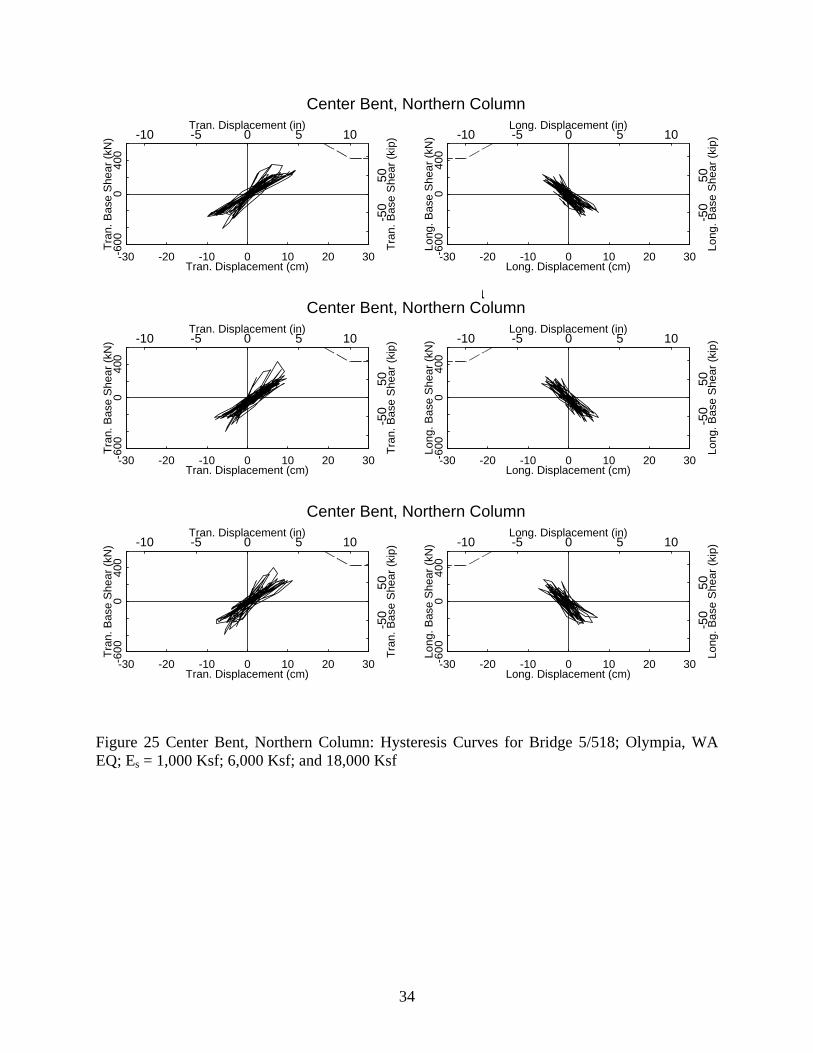
Hysteresis curves are shown for the center bent, northern columns subjected to the
Moquegua, Peru and Olympia, WA earthquake ground motions in Figures 24 and 25,
respectively. Maximum column displacement, shear force, moment, and curvature demands are
listed in Tables 5 and 6. For all the soil types studied, the displacement and shear force demand
was higher in the transverse direction than in the longitudinal direction. As the soil spring
stiffnesses were increased, the overall shape of the hysteresis curves did not change significantly.
The column shear capacity was almost exceeded for the transverse direction of the center bent
columns; shear failure of the columns is probable under the Moquegua, Peru earthquake ground
motions. For the Olympia, WA earthquake ground motions, the column shear force demand did
not approach the column shear capacity envelope.
For the Moquegua, Peru earthquake ground motions, the displacements varied as the soil
spring stiffnesses increased. The maximum transverse displacement at the west bent decreased
6% from Es = 1000 ksf (47.9 MPa) to Es = 6000 ksf (287.3 MPa). This change was 19% when
Es was increased to 18000 ksf (862.8 MPa). Because the east bent columns are 2.5 ft (0.76 m)
shorter than the west and center bent columns, the east bent had smaller maximum displacements
in the transverse and longitudinal directions than those of the center or west bent. For all soil
spring stiffnesses, the maximum transverse displacements were larger than the longitudinal
displacements. Similar trends were seen in the Olympia, WA earthquake ground motions
analysis results. All the bridge 5/518 bearing pads failed under the Moquegua, Peru earthquake
32
ground motions for all soil spring stiffness values. The abutment bearing pads experienced
larger displacements than the bridge bent bearing pads for all soil spring stiffnesses. As the soil
spring stiffnesses increased, the bearing pad displacement demand became more equalized
between the abutments and bents. Failure in the bearing pads was defined by a bearing pad
displacement greater than 1.44 in. (3.66 cm). The Olympia, WA earthquake resulted in similar
bearing pad trends. The abutment bearing pads experienced higher demand than the bents.
However, as the spring stiffnesses increased, the displacement demand did not shift as
dramatically from the abutments to the bents as in the Moquegua, Peru earthquake. The largest
difference in bearing pad displacement was 14% when comparing soil stiffness values of Es =
100 ksf (47.9 MPa) to Es = 18000 ksf (861.8 MPa). For all Es values, failure occurred in the
abutment bearing pads and sometimes in the outer bent bearing pads.
Column shear forces did not change significantly as the soil spring stiffnesses increased.
For all Es values, the maximum longitudinal and transverse shear force in the east and center bent
was larger than the west bent. This was due to the higher displacement demand at the center
bent and shorter column heights at the east bent. For the Moquegua, Peru earthquake, the largest
difference in total column shear force as soil spring stiffnesses changed was 4%. For the
Olympia, WA earthquake, the largest difference was 8%. For each soil spring stiffness, the
center bent experienced the largest column moments.
For further study, an analysis of bridge 5/518 was performed with the column footings
fixed and the abutments modeled with rollers in the longitudinal direction and constrained
conditions in the transverse and vertical directions. For this study, the Moquegua, Peru
earthquake ground motions were used. Figure 26 shows the center bent, center column
hysteresis curves with the boundary conditions described above. When comparing the hysteresis
33
curves of the model with soil spring stiffnesses based on Es = 6000 ksf (287.3 MPa) to the model
with the fixed columns and roller/constrained abutments, the center bent saw a 22% and 6%
increase in maximum transverse and longitudinal displacements, respectively, when the
simplified boundary conditions were used. There was a 12% and 7% difference in the transverse
and longitudinal shear force demand, respectively. Results from this study showed that the
response of bridge 5/518 was sensitive to the variation in soil spring stiffness values. Using
accurate soil spring stiffnesses was essential in obtaining correct demands on the bridge.
Tran. Displacement (cm)
Tran
. Bas
e S
hear
(kN
)
-30 -20 -10 0 10 20 30-600
040
0
-10 -5 0 5 10
-50
50
Tran. Displacement (in)Tr
an. B
ase
She
ar (k
ip)
Long. Displacement (cm)
Long
. Bas
e S
hear
(kN
)
-30 -20 -10 0 10 20 30-600
040
0
Center Bent, Northern Column
-10 -5 0 5 10
-50
50
Long. Displacement (in)
Long
. Bas
e S
hear
(kip
)
Tran. Displacement (cm)
Tran
. Bas
e S
hear
(kN
)
-30 -20 -10 0 10 20 30-600
040
0
Es - 287.3 MPa
-10 -5 0 5 10
-50
50
Tran. Displacement (in)
Tran
. Bas
e S
hear
(kip
)
Long. Displacement (cm)
Long
. Bas
e S
hear
(kN
)
-30 -20 -10 0 10 20 30-600
040
0
Center Bent, Northern Column
-10 -5 0 5 10
-50
50
Long. Displacement (in)
Long
. Bas
e S
hear
(kip
)
Tran. Displacement (cm)
Tran
. Bas
e S
hear
(kN
)
-30 -20 -10 0 10 20 30-600
040
0
Es - 861.8 MPa
-10 -5 0 5 10
-50
50
Tran. Displacement (in)
Tran
. Bas
e S
hear
(kip
)
Long. Displacement (cm)
Long
. Bas
e S
hear
(kN
)
-30 -20 -10 0 10 20 30-600
040
0
Center Bent, Northern Column
-10 -5 0 5 10
-50
50
Long. Displacement (in)
Long
. Bas
e S
hear
(kip
)
Figure 24 Center Bent, Northern Column: Hysteresis Curves for Bridge 5/518; Moquegua, Peru EQ; Es = 1,000 Ksf; 6,000 Ksf; and 18,000 Ksf
34
Tran. Displacement (cm)
Tran
. Bas
e S
hear
(kN
)
-30 -20 -10 0 10 20 30-600
040
0-10 -5 0 5 10
-50
50
Tran. Displacement (in)
Tran
. Bas
e S
hear
(kip
)
Long. Displacement (cm)
Long
. Bas
e S
hear
(kN
)
-30 -20 -10 0 10 20 30-600
040
0
Center Bent, Northern Column
-10 -5 0 5 10
-50
50
Long. Displacement (in)
Long
. Bas
e S
hear
(kip
)
Tran. Displacement (cm)
Tran
. Bas
e S
hear
(kN
)
-30 -20 -10 0 10 20 30-600
040
0
Es - 287.3 MPa
-10 -5 0 5 10
-50
50
Tran. Displacement (in)
Tran
. Bas
e S
hear
(kip
)
Long. Displacement (cm)
Long
. Bas
e S
hear
(kN
)
-30 -20 -10 0 10 20 30-600
040
0
Center Bent, Northern Column
-10 -5 0 5 10
-50
50
Long. Displacement (in)
Long
. Bas
e S
hear
(kip
)
Tran. Displacement (cm)
Tran
. Bas
e S
hear
(kN
)
-30 -20 -10 0 10 20 30-600
040
0
Es - 861.8 MPa
-10 -5 0 5 10
-50
50
Tran. Displacement (in)
Tran
. Bas
e S
hear
(kip
)
Long. Displacement (cm)
Long
. Bas
e S
hear
(kN
)
-30 -20 -10 0 10 20 30-600
040
0
Center Bent, Northern Column
-10 -5 0 5 10
-50
50
Long. Displacement (in)
Long
. Bas
e S
hear
(kip
)
Figure 25 Center Bent, Northern Column: Hysteresis Curves for Bridge 5/518; Olympia, WA EQ; Es = 1,000 Ksf; 6,000 Ksf; and 18,000 Ksf

35
Tran. Displacement (cm)
Tran
. Bas
e S
hear
(kN
)
-30 -20 -10 0 10 20 30-600
040
0-10 -5 0 5 10
-50
50
Tran. Displacement (in)
Tran
. Bas
e S
hear
(kip
)
Long. Displacement (cm)
Long
. Bas
e S
hear
(kN
)
-30 -20 -10 0 10 20 30-600
040
0
-10 -5 0 5 10
-50
50
Long. Displacement (in)
Long
. Bas
e S
hear
(kip
)
Figure 26 Center Bent, Center Column: Hysteresis Curves for Bridge 5/518; Moquegua, Peru EQ; Fixed
Condition at Column Footings, Roller in Y and Constrained in X and Z Conditions at the Abutment Table 5 Bridge 5/518 Column Displacement (Δ), Shear (V), Moment (M), and Curvature (φ) Demands; Moquegua, Peru EQ
Bent Es = 47.9 MPa Es = 287.3 MPa Es = 861.8 MPa Max Δ (cm) Tran Δ Long Δ Total Δ Tran Δ Long Δ Total Δ Tran Δ Long Δ Total Δ
West 18.4-n 13.6-n 18.5-n 17.3-c 13.5-n 17.4-s 15.5-c 13.0-n 16.7-n Center 21.2-n 15.6-n 23.4-s 20.4-s 15.4-s 22.9-n 21.9-n 15.6-s 24.3-s East 12.3-s 11.2-s 12.6-n 14.0-n 10.8-n 14.1-s 11.2-s 10.4-n 12.2-n
Exp Joint/ Bearing Pad
Gap Closing
Max Δ (cm) Failure Gap
Closing Max
Δ (cm) Failure Gap Closing
Max Δ (cm) Failure
West Abut Y 9.7 Y Y 9.5 Y Y 8.9 Y West Bent Y 5.7 Y Y 5.6 Y Y 5.6 Y
Center Bent Y 3.5 Y Y 3.8 Y Y 4.1 Y East Bent Y 5.6 Y Y 6.3 Y Y 6.4 Y East Abut Y 7.6 Y Y 7.2 Y Y 6.9 Y
Max V (kN) Tran V Long V Total V Tran V Long V Total V Tran V Long V Total V West 422-n 366-n 444-n 426-s 378-c 426-s 411-n 352-n 438-n
Center 472-s 401-c 487-s 486-c 427-c 493-c 489-c 433-n 496-c East 477-n 452-c 479-n 463-s 423-s 477-s 497-c 433-c 498-c
Total V (kN) 2799 2754 3718 2881 2532 3728 2801 2708 3725
Max Bot M (kN-m)
Tran M
Long M
Total M
Tran M
Long M
Total M
Tran M
Long M
Total M
West 1513-s 1710-c 1730-c 1398-c 1593-s 1676-n 1548-s 1706-c 1855-s Center 1670-n 1950-n 1961-n 1763-c 2034-s 2034-s 1651-n 1936-c 1962-c East 1510-c 1563-s 1653-s 1430-c 1763-c 1802-s 1486-n 1777-n 1811-n
Max Top M (kN-m)
Tran M
Long M
Total M
Tran M
Long M
Total M
Tran M
Long M
Total M
West 1566-c 1811-n 1815-n 1494-s 1719-c 1851-c 1734-n 1655-c 1990-c Center 1875-n 1979-n 2042-n 1661-s 1852-c 1982-s 1741-n 1982-n 2030-n East 1565-c 1741-c 1829-c 1462-n 1779-c 1779-c 1382-n 1764-s 1829-s
Max Top φ (1/m) Tran φ Long φ Total φ Tran φ Long φ Total φ Tran φ Long φ Total φ
West 0.062 0.085 0.098 0.059 0.089 0.102 0.056 0.079 0.092 Center 0.082 0.121 0.135 0.075 0.115 0.121 0.085 0.121 0.131 East 0.072 0.085 0.102 0.072 0.095 0.115 0.075 0.095 0.115

36
Table 6 Bridge 5/518 Displacement (Δ), Shear (V), Moment (M), and Curvature (φ) Demands; Olympia, WA EQ
Bent Es = 47.9 MPa Es = 287.3 MPa Es = 861.8 MPa Max Δ (cm) Tran Δ Long Δ Total Δ Tran Δ Long Δ Total Δ Tran Δ Long Δ Total Δ
West 8.2-n 6.3-s 8.6-s 9.2-c 6.2-n 9.4-s 7.1-c 5.9-n 7.1-s Center 11.8-c 7.4-s 12.0-c 9.6-c 7.7-s 10.8-s 11.1-s 7.6-s 11.2-s East 9.9-c 5.2-n 10.0-n 10.5-n 6.7-s 10.5-n 7.6-s 5.3-n 7.6-s
Exp Joint/ Bearing Pad
Gap Closing
Max Δ (cm) Failure Gap
Closing Max
Δ (cm) Failure Gap Closing
Max Δ (cm) Failure
West Abut Y 4.9 Y Y 4.6 Y Y 4.3 Y West Bent Y 3.9 Y Y 4.4 N Y 3.4 N
Center Bent Y 2.3 N Y 2.7 N Y 2.7 N East Bent Y 3.5 N Y 4.5 Y Y 3.6 N East Abut Y 4.4 Y Y 4.6 Y Y 3.9 Y
Max V (kN) Tran V Long V Total V Tran V Long V Total V Tran V Long V Total V West 307-c 256-s 342-c 392-c 245-c 395-c 365-c 268s,n 367-c
Center 418-c 271-c 422-c 427s,n 290-c 427s,n 429-c 322-c 431-c East 430-c 286-s 431-c 421s,n 373-n 423-n 423-n 351-n 422-n
Total V (kN) 2245 2039 3090 2934 2331 3636 3005 1903 3741
Max Bot M (kN-m)
Tran M
Long M
Total M
Tran M
Long M
Total M
Tran M
Long M
Total M
West 1340-n 1531-n 1650-s 1434-c 1502-c 1509-c 1460-c 1552-s 1617-c Center 1566-s 1723-n 1856-c 1594-c 1703-n 1760-c 1574-c 1666-s 1887-n East 1382-c 1436-n 1547-n 1401-n 1525-c 1607-c 1411-s 1491-s 1672-s
Max Top M (kN-m)
Tran M
Long M
Total M
Tran M
Long M
Total M
Tran M
Long M
Total M
West 1540-c 1475-s 1695-c 1489-c 1580-n 1585-s 1471-c 1512-s 1554-n Center 1665-c 1763-s 1920-n 1617-c 1749-c 1787-c 1532-n 1679-s 1746-n East 1402-s 1481-s 1491-s 1394-c 1449-c 1529-n 1456-c 1504-n 1504-n
Max Top φ (1/m) Tran φ Long φ Total φ Tran φ Long φ Total φ Tran φ Long φ Total φ
West 0.043 0.046 0.059 0.046 0.056 0.062 0.059 0.059 0.069 Center 0.062 0.089 0.102 0.059 0.075 0.089 0.056 0.072 0.082 East 0.043 0.052 0.062 0.049 0.059 0.072 0.043 0.059 0.062
Bridge 5/826 Model
Bridge 5/826 has the largest column aspect ratios and largest transverse confinement ratio
of the three bridges. In addition, Bridge 5/826 has a monolithic deck while the other two bridges
have non-monolithic decks. Therefore, the displacement capacity of Bridge 5/826 exceeds that
of the other two bridges. Hysteresis curves for the center bent, center columns subject to the
37
Moquegua, Peru and Mexico City, Mexico ground motions are shown in Figures 27 and 28,
respectively. Maximum column displacement, shear force, moment, and curvature demands are
listed in Tables 7 and 8. Looking first at the Moquegua, Peru results, when comparing the
maximum total displacements for soil spring stiffnesses based on Es = 100 ksf (4.8 MPa) and Es
= 18000 ksf (861.8 MPa), there was a total displacements reduction of 10% at the center bent as
the soil spring stiffnesses increased. The trends in bridge maximum displacements were similar
for the Mexico City, Mexico ground motions. For all Es values, the maximum transverse
displacement at the center bent was larger than the east and west bents. The maximum
longitudinal displacements were larger than the maximum transverse displacements for all soil
stiffness values. Bridge 5/826 was the only bridge that experienced larger demand in the
longitudinal axis of the bridge than the transverse axis of the bridge. Because the bridge deck
was monolithically constructed, the stiffness in the transverse axis of the bridge was larger than
the bridges with non-monolithic bridge decks. As a result the first mode response occurred along
the longitudinal axis of the bridge compared with the transverse first mode response of the other
bridges (see Table 4).
For the Mexico City, Mexico and Moquegua, Peru ground motions, failure was predicted
for both abutment bearing pads. The maximum bearing pad displacements were similar for all
soil spring stiffness values. For both earthquakes, column shear forces and moments did not
show trends as the soil spring stiffnesses increased. The shear force/displacement demands for
the columns in bridge 5/826 did not approach the shear capacity envelope in any of the ground
motions used in this study. This was largely due to the column aspect ratio of 4.2, the monolithic
bridge deck and the transverse steel ratio of 0.43% compared with non-monolithic bridge decks
for the other two bridges and lower column aspect ratios and transverse reinforcement ratios.
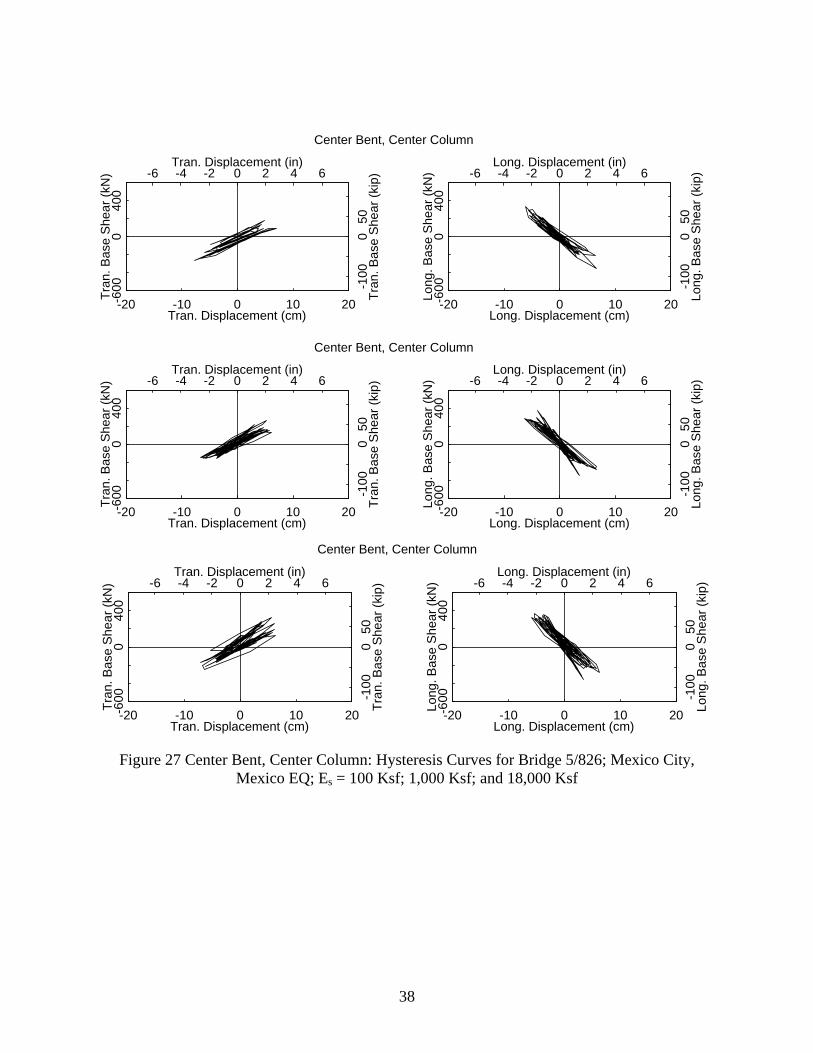
38
Tran. Displacement (cm)
Tran
. Bas
e S
hear
(kN
)
-20 -10 0 10 20-600
040
0
Center Bent, Center Column
-6 -4 -2 0 2 4 6
-100
050
Tran. Displacement (in)
Tran
. Bas
e S
hear
(kip
)
Long. Displacement (cm)
Long
. Bas
e S
hear
(kN
)
-20 -10 0 10 20-600
040
0
-6 -4 -2 0 2 4 6
-100
050
Long. Displacement (in)
Long
. Bas
e S
hear
(kip
)
Tran. Displacement (cm)
Tran
. Bas
e S
hear
(kN
)
-20 -10 0 10 20-600
040
0
Es - 47.9 MPaCenter Bent, Center Column
-6 -4 -2 0 2 4 6-1
000
50Tran. Displacement (in)
Tran
. Bas
e S
hear
(kip
)
Long. Displacement (cm)
Long
. Bas
e S
hear
(kN
)
-20 -10 0 10 20-600
040
0
-6 -4 -2 0 2 4 6
-100
050
Long. Displacement (in)
Long
. Bas
e S
hear
(kip
)
Tran. Displacement (cm)
Tran
. Bas
e S
hear
(kN
)
-20 -10 0 10 20-600
040
0
Center Bent, Center Column
-6 -4 -2 0 2 4 6
-100
050
Tran. Displacement (in)
Tran
. Bas
e S
hear
(kip
)
Long. Displacement (cm)
Long
. Bas
e S
hear
(kN
)
-20 -10 0 10 20-600
040
0
-6 -4 -2 0 2 4 6
-100
050
Long. Displacement (in)
Long
. Bas
e S
hear
(kip
)
Figure 27 Center Bent, Center Column: Hysteresis Curves for Bridge 5/826; Mexico City,
Mexico EQ; Es = 100 Ksf; 1,000 Ksf; and 18,000 Ksf
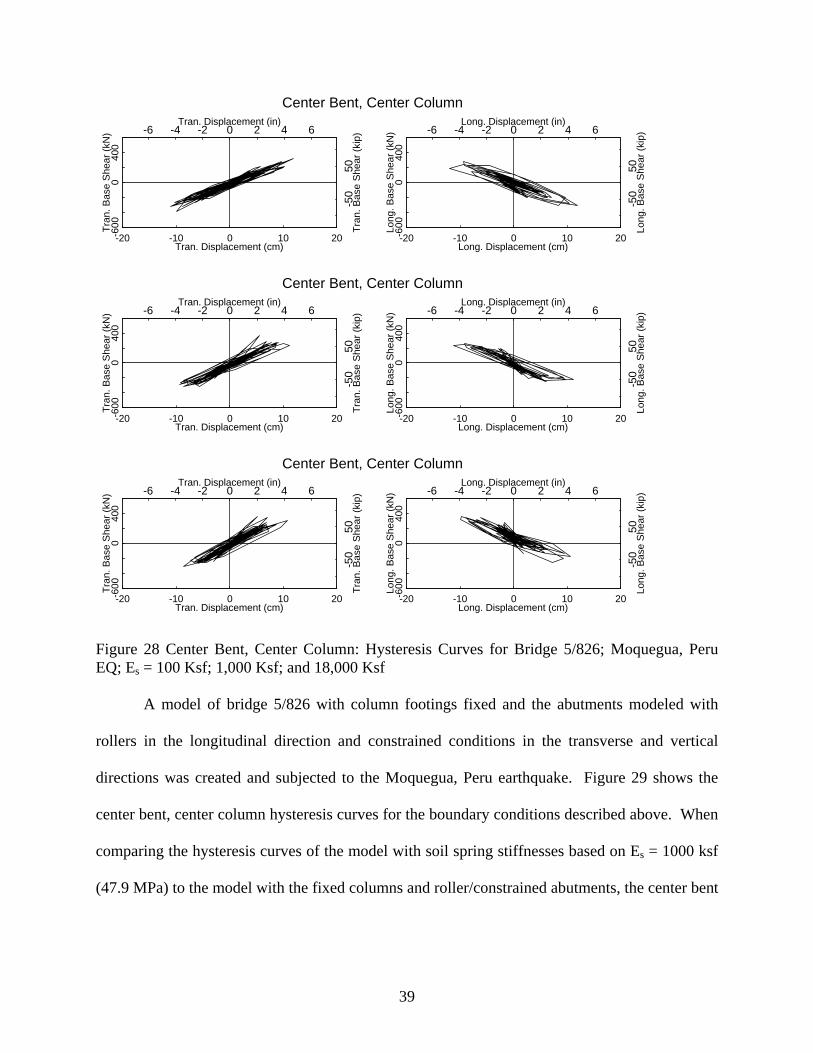
39
Tran. Displacement (cm)
Tran
. Bas
e S
hear
(kN
)
-20 -10 0 10 20-600
040
0-6 -4 -2 0 2 4 6
-50
50
Tran. Displacement (in)
Tran
. Bas
e S
hear
(kip
)
Long. Displacement (cm)
Long
. Bas
e S
hear
(kN
)
-20 -10 0 10 20-600
040
0
Center Bent, Center Column
-6 -4 -2 0 2 4 6
-50
50
Long. Displacement (in)
Long
. Bas
e S
hear
(kip
)
Tran. Displacement (cm)
Tran
. Bas
e S
hear
(kN
)
-20 -10 0 10 20-600
040
0
Es - 47.9 MPa
-6 -4 -2 0 2 4 6
-50
50
Tran. Displacement (in)
Tran
. Bas
e S
hear
(kip
)
Long. Displacement (cm)
Long
. Bas
e S
hear
(kN
)
-20 -10 0 10 20-600
040
0
Center Bent, Center Column
-6 -4 -2 0 2 4 6
-50
50
Long. Displacement (in)
Long
. Bas
e S
hear
(kip
)
Tran. Displacement (cm)
Tran
. Bas
e S
hear
(kN
)
-20 -10 0 10 20-600
040
0
Es - 861.8 MPa
-6 -4 -2 0 2 4 6
-50
50
Tran. Displacement (in)
Tran
. Bas
e S
hear
(kip
)
Long. Displacement (cm)
Long
. Bas
e S
hear
(kN
)
-20 -10 0 10 20-600
040
0
Center Bent, Center Column
-6 -4 -2 0 2 4 6
-50
50
Long. Displacement (in)
Long
. Bas
e S
hear
(kip
)
Figure 28 Center Bent, Center Column: Hysteresis Curves for Bridge 5/826; Moquegua, Peru EQ; Es = 100 Ksf; 1,000 Ksf; and 18,000 Ksf
A model of bridge 5/826 with column footings fixed and the abutments modeled with
rollers in the longitudinal direction and constrained conditions in the transverse and vertical
directions was created and subjected to the Moquegua, Peru earthquake. Figure 29 shows the
center bent, center column hysteresis curves for the boundary conditions described above. When
comparing the hysteresis curves of the model with soil spring stiffnesses based on Es = 1000 ksf
(47.9 MPa) to the model with the fixed columns and roller/constrained abutments, the center bent
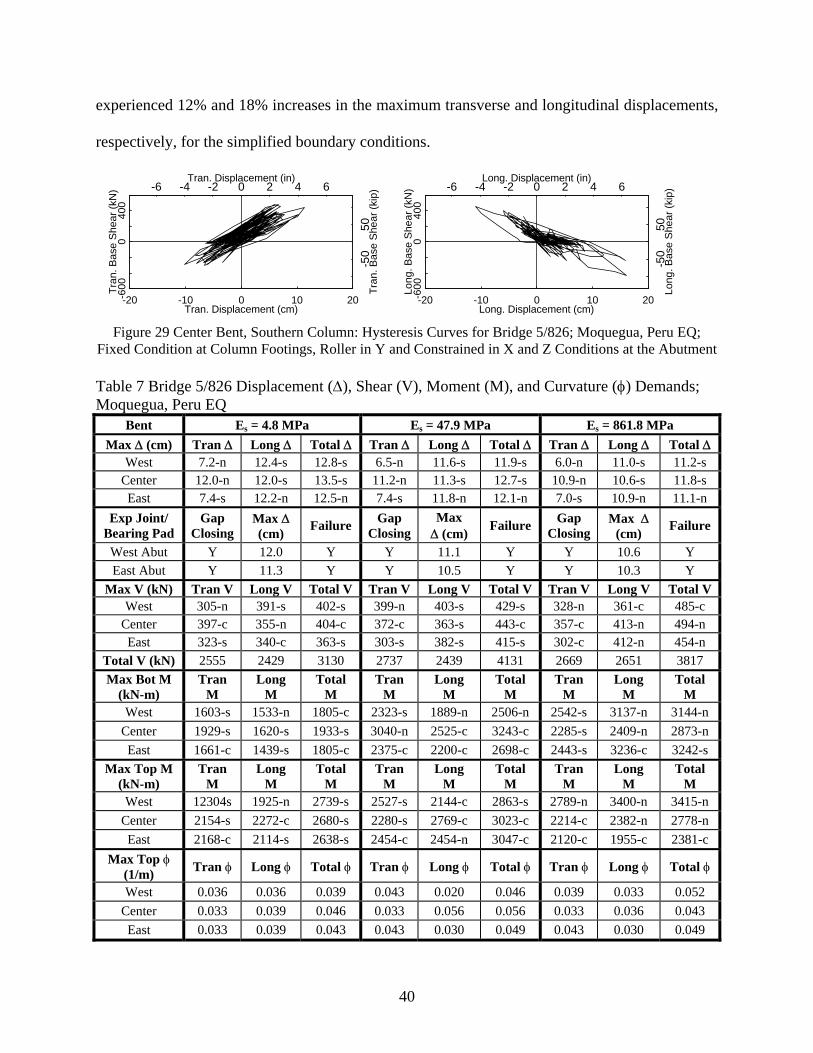
40
experienced 12% and 18% increases in the maximum transverse and longitudinal displacements,
respectively, for the simplified boundary conditions.
Tran. Displacement (cm)
Tran
. Bas
e S
hear
(kN
)
-20 -10 0 10 20-600
040
0
-6 -4 -2 0 2 4 6
-50
50
Tran. Displacement (in)
Tran
. Bas
e S
hear
(kip
)
Long. Displacement (cm)
Long
. Bas
e S
hear
(kN
)
-20 -10 0 10 20-600
040
0
-6 -4 -2 0 2 4 6
-50
50
Long. Displacement (in)
Long
. Bas
e S
hear
(kip
)
Figure 29 Center Bent, Southern Column: Hysteresis Curves for Bridge 5/826; Moquegua, Peru EQ;
Fixed Condition at Column Footings, Roller in Y and Constrained in X and Z Conditions at the Abutment Table 7 Bridge 5/826 Displacement (Δ), Shear (V), Moment (M), and Curvature (φ) Demands; Moquegua, Peru EQ
Bent Es = 4.8 MPa Es = 47.9 MPa Es = 861.8 MPa Max Δ (cm) Tran Δ Long Δ Total Δ Tran Δ Long Δ Total Δ Tran Δ Long Δ Total Δ
West 7.2-n 12.4-s 12.8-s 6.5-n 11.6-s 11.9-s 6.0-n 11.0-s 11.2-s Center 12.0-n 12.0-s 13.5-s 11.2-n 11.3-s 12.7-s 10.9-n 10.6-s 11.8-s East 7.4-s 12.2-n 12.5-n 7.4-s 11.8-n 12.1-n 7.0-s 10.9-n 11.1-n
Exp Joint/ Bearing Pad
Gap Closing
Max Δ (cm) Failure Gap
Closing Max
Δ (cm) Failure Gap Closing
Max Δ (cm) Failure
West Abut Y 12.0 Y Y 11.1 Y Y 10.6 Y East Abut Y 11.3 Y Y 10.5 Y Y 10.3 Y
Max V (kN) Tran V Long V Total V Tran V Long V Total V Tran V Long V Total V West 305-n 391-s 402-s 399-n 403-s 429-s 328-n 361-c 485-c
Center 397-c 355-n 404-c 372-c 363-s 443-c 357-c 413-n 494-n East 323-s 340-c 363-s 303-s 382-s 415-s 302-c 412-n 454-n
Total V (kN) 2555 2429 3130 2737 2439 4131 2669 2651 3817 Max Bot M
(kN-m) Tran
M Long
M Total
M Tran
M Long
M Total
M Tran
M Long
M Total
M West 1603-s 1533-n 1805-c 2323-s 1889-n 2506-n 2542-s 3137-n 3144-n
Center 1929-s 1620-s 1933-s 3040-n 2525-c 3243-c 2285-s 2409-n 2873-n East 1661-c 1439-s 1805-c 2375-c 2200-c 2698-c 2443-s 3236-c 3242-s
Max Top M (kN-m)
Tran M
Long M
Total M
Tran M
Long M
Total M
Tran M
Long M
Total M
West 12304s 1925-n 2739-s 2527-s 2144-c 2863-s 2789-n 3400-n 3415-n Center 2154-s 2272-c 2680-s 2280-s 2769-c 3023-c 2214-c 2382-n 2778-n East 2168-c 2114-s 2638-s 2454-c 2454-n 3047-c 2120-c 1955-c 2381-c
Max Top φ (1/m) Tran φ Long φ Total φ Tran φ Long φ Total φ Tran φ Long φ Total φ
West 0.036 0.036 0.039 0.043 0.020 0.046 0.039 0.033 0.052 Center 0.033 0.039 0.046 0.033 0.056 0.056 0.033 0.036 0.043 East 0.033 0.039 0.043 0.043 0.030 0.049 0.043 0.030 0.049

41
Table 8 Bridge 5/826 Displacement (Δ), Shear (V), Moment (M), and Curvature (φ) Demands; Mexico City, Mexico EQ
Bent Es = 4.8 MPa Es = 47.9 MPa Es = 861.8 MPa Max Δ (cm) Tran Δ Long Δ Total Δ Tran Δ Long Δ Total Δ Tran Δ Long Δ Total Δ
West 4.4-n 6.8-s 7.4-n 3.8-n 7.1-n 7.5-n 4.0-n 6.8-n 7.2-n Center 7.8-n 6.7-s 9.4-n 6.7-n 6.7-s 7.9-n 7.2-n 6.4-n 8.1-n East 4.5-s 6.6-n 7.3-s 4.4-s 6.9-s 7.4-s 4.6-s 6.7-s 7.4-s
Exp Joint/ Bearing
Pad
Gap Closing
Max Δ (cm) Failure Gap
Closing Max
Δ (cm) Failure Gap Closing
Max Δ (cm) Failure
West Abut Y 7.1 Y Y 6.6 Y Y 6.3 Y East Abut Y 6.6 Y Y 6.2 Y Y 6.1 Y
Max V (kN) Tran V Long V Total V Tran V Long V Total V Tran V Long V Total V West 268-n 368-c 368-c 304-c 374-c 374-n 386-s 412-s 421-s
Center 278-s 463-c 465-c 307-n 427-c 428-s 337-s 286-c 345-c East 262-s 334-n 334-n 274-c 343-s 360-s 230-n 346-n 346-n
Total V (kN) 1315 2278 3131 2084 2980 3368 2217 2949 3720
Max Bot M (kN-m)
Tran M
Long M
Total M
Tran M
Long M
Total M
Tran M
Long M
Total M
West 1562-s 1089-c 1601-s 2045-s 1472-n 2209-c 1784-n 1615-c 1905-n Center 1574-s 1369-n 1712-n 1924-s 2407-n 2455-c 1992-n 2027-c 2275-n East 1062-c 941-s 1098-c 1978-n 1636-s 2062-n 2019-c 1593-s 2061-c
Max Top M (kN-m)
Tran M
Long M
Total M
Tran M
Long M
Total M
Tran M
Long M
Total M
West 1782-s 1719-c 1989-s 2022-c 1574-n 2213-c 1798-n 1590-c 1853-n Center 3068-s 1948-n 3071-n 2609-c 2076-c 2670-c 2005-c 2070-s 2320-s East 1824-s 1695-s 1829-s 1904-n 1623-c 2003-c 2019-s 1650-n 2061-c
Max Top φ (1/m) Tran φ Long φ Total φ Tran φ Long φ Total φ Tran φ Long φ Total φ
West 0.030 0.026 0.033 0.036 0.023 0.039 0.033 0.013 0.036 Center 0.020 0.026 0.030 0.036 0.033 0.043 0.026 0.020 0.030 East 0.016 0.020 0.023 0.033 0.023 0.036 0.033 0.020 0.036
As soil spring stiffnesses increased, the maximum displacements did not show trends in
values for all bents. When the bridge was modeled with fixed column bases and with rollers
(along the longitudinal bridge axis) and constrained axes (along the vertical and transverse
bridge axes) at the abutment, larger transverse and longitudinal displacements were noted at the
east and west bents. Thus, modeling soil-structure-interaction with secant stiffness springs did

42
have an effect on the global response of bridge 5/826, but the specific soil spring stiffnesses used
were not as influential.
Bridge 5/227 Model
Hysteresis curves for the center bent, center column for the Moquegua, Peru and
Olympia, WA earthquake ground motions are shown in Figure 30 and Figure 31, respectively.
Maximum column displacement, shear force, moment, and curvature demands are listed in
Tables 9 and 10. Looking first at the Moquegua, Peru ground motion results, the transverse and
longitudinal column displacements were reduced as the soil spring stiffnesses increased. The
east bent experienced the largest decrease in maximum transverse displacement (31%). Similar
results were seen in the Olympia, WA earthquake analysis. The west and east abutments saw the
largest bearing pad displacement demands. For the Moquegua, Peru ground motions, the
abutment bearing pads only failed in the model with soil spring stiffnesses based on Es = 5 ksf
(0.24 MPa). No bearing pads failed for the Mexico City, Mexico earthquake ground motions.
For the Moquegua, Peru earthquake ground motions, maximum transverse
column shear forces remained similar. The Olympia, WA earthquake ground motions resulted in
similar trends in maximum column shear forces. Under the Moquegua, Peru and Olympia, WA
earthquake ground motions, the maximum moments were similar for each soil value as well.
Based on the column force/displacement curves in Figure 28, it is likely that column shear failure
would occur in bridge 5/227 under the Moquegua, Peru earthquake ground motions. The column
shear forces did not approach the shear capacity envelope for the Olympia, WA earthquake
ground motions.

43
Tran. Displacement (cm)
Tran
. Bas
e Sh
ear (
kN)
-20 -10 0 10 20-600
040
0
,
-6 -4 -2 0 2 4 6
-50
50
Tran. Displacement (in)
Tran
. Bas
e Sh
ear (
kip)
Long. Displacement (cm)
Long
. Bas
e Sh
ear (
kN)
-20 -10 0 10 20-600
040
0
Center Bent, Center Column
-6 -4 -2 0 2 4 6
-50
50
Long. Displacement (in)
Long
. Bas
e Sh
ear (
kip)
Tran. Displacement (cm)
Tran
. Bas
e Sh
ear (
kN)
-20 -10 0 10 20-600
040
0
Es - 47.9 MPa
-6 -4 -2 0 2 4 6
-50
50
Tran. Displacement (in)
Tran
. Bas
e Sh
ear (
kip)
Long. Displacement (cm)
Long
. Bas
e Sh
ear (
kN)
-20 -10 0 10 20-600
040
0
Center Bent, Center Column
-6 -4 -2 0 2 4 6
-50
50
Long. Displacement (in)
Long
. Bas
e Sh
ear (
kip)
Tran. Displacement (cm)
Tran
. Bas
e Sh
ear (
kN)
-20 -10 0 10 20-600
040
0
Es - 861.8 MPa
-6 -4 -2 0 2 4 6
-50
50
Tran. Displacement (in)
Tran
. Bas
e Sh
ear (
kip)
Long. Displacement (cm)
Long
. Bas
e Sh
ear (
kN)
-20 -10 0 10 20-600
040
0
Center Bent, Center Column
-6 -4 -2 0 2 4 6
-50
50
Long. Displacement (in)
Long
. Bas
e Sh
ear (
kip)
Figure 30 Center Bent, Center Column: Hysteresis Curves for Bridge 5/227; Moquegua, Peru EQ; Es = 5 Ksf; 1,000 Ksf; and 18,000 Ksf
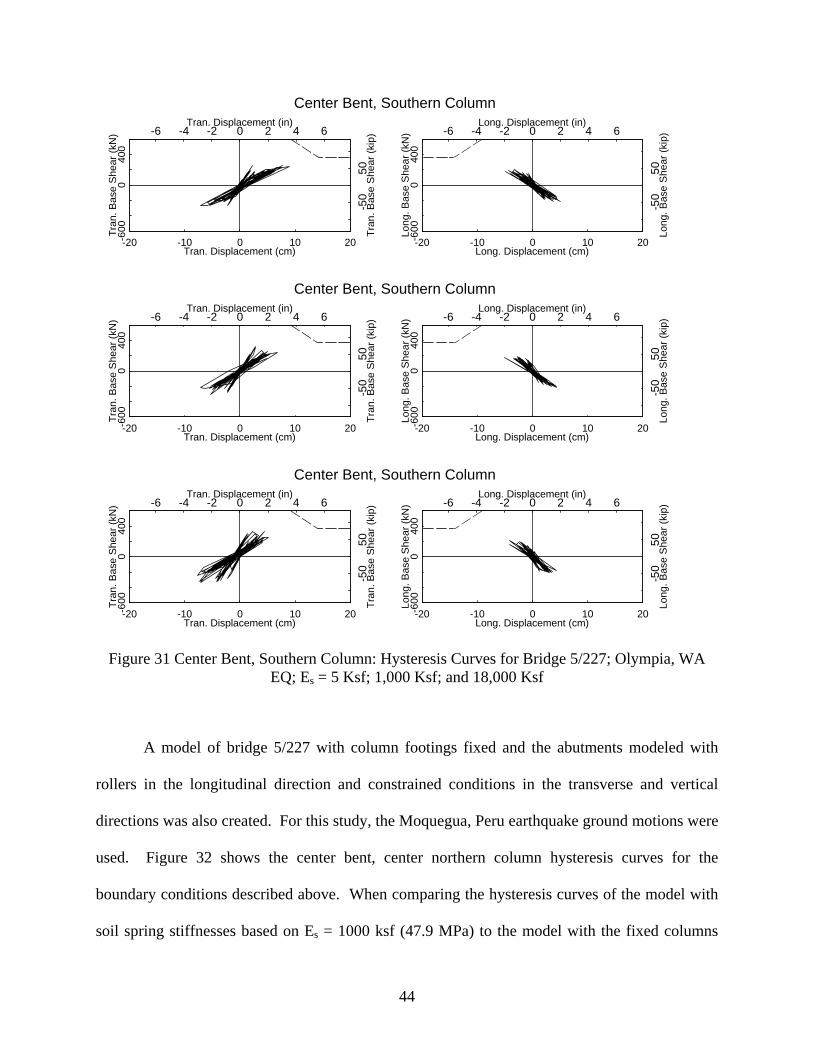
44
Tran. Displacement (cm)
Tran
. Bas
e S
hear
(kN
)
-20 -10 0 10 20-600
040
0-6 -4 -2 0 2 4 6
-50
50
Tran. Displacement (in)
Tran
. Bas
e S
hear
(kip
)
Long. Displacement (cm)
Long
. Bas
e S
hear
(kN
)
-20 -10 0 10 20-600
040
0
Center Bent, Southern Column
-6 -4 -2 0 2 4 6
-50
50
Long. Displacement (in)
Long
. Bas
e S
hear
(kip
)
Tran. Displacement (cm)
Tran
. Bas
e S
hear
(kN
)
-20 -10 0 10 20-600
040
0
Es - 47.9 MPa
-6 -4 -2 0 2 4 6
-50
50
Tran. Displacement (in)
Tran
. Bas
e S
hear
(kip
)
Long. Displacement (cm)
Long
. Bas
e S
hear
(kN
)
-20 -10 0 10 20-600
040
0
Center Bent, Southern Column
-6 -4 -2 0 2 4 6
-50
50
Long. Displacement (in)
Long
. Bas
e S
hear
(kip
)
Tran. Displacement (cm)
Tran
. Bas
e S
hear
(kN
)
-20 -10 0 10 20-600
040
0
Es - 861.8 MPa
-6 -4 -2 0 2 4 6
-50
50
Tran. Displacement (in)
Tran
. Bas
e S
hear
(kip
)
Long. Displacement (cm)
Long
. Bas
e S
hear
(kN
)
-20 -10 0 10 20-600
040
0
Center Bent, Southern Column
-6 -4 -2 0 2 4 6
-50
50
Long. Displacement (in)
Long
. Bas
e S
hear
(kip
)
Figure 31 Center Bent, Southern Column: Hysteresis Curves for Bridge 5/227; Olympia, WA EQ; Es = 5 Ksf; 1,000 Ksf; and 18,000 Ksf
A model of bridge 5/227 with column footings fixed and the abutments modeled with
rollers in the longitudinal direction and constrained conditions in the transverse and vertical
directions was also created. For this study, the Moquegua, Peru earthquake ground motions were
used. Figure 32 shows the center bent, center northern column hysteresis curves for the
boundary conditions described above. When comparing the hysteresis curves of the model with
soil spring stiffnesses based on Es = 1000 ksf (47.9 MPa) to the model with the fixed columns

45
and roller/constrained abutments, the center bent experienced a 27% decrease and a 60%
increase in maximum negative transverse and longitudinal displacements, respectively. The
hysteretic response of the center bent columns showed that the transverse and longitudinal shear
capacity envelopes were nearly reached for the model with roller/constrained abutment boundary
conditions. Conversely, only the transverse direction force/displacement response was
governing in the models with soil-structure interaction included.
Tran. Displacement (cm)
Tran
. Bas
e S
hear
(kN
)
-20 -10 0 10 20-600
040
0
-6 -4 -2 0 2 4 6-5
050
Tran. Displacement (in)
Tran
. Bas
e S
hear
(kip
)
Long. Displacement (cm)
Long
. Bas
e S
hear
(kN
)
-20 -10 0 10 20-600
040
0
,
-6 -4 -2 0 2 4 6
-50
50
Long. Displacement (in)
Long
. Bas
e S
hear
(kip
)
Figure 32 Center Bent, Northern Column: Hysteresis Curves for Bridge 5/227; Moquegua, Peru EQ; Fixed Condition at Column Footings, Roller in Y and Constrained in X and Z Conditions at the Abutment
The results for bridge 5/227 showed that the response of the bridge was sensitive to soil-
structure-interaction. There was a trend in reduction of transverse displacement demand as soil
spring stiffnesses increased. The foundations for bridge 5/227 were much different than those
of bridges 5/518 and 5/826. For bridge 5/518, only the east abutment has two sub-ground spread
footings. For bridge 5/227, both abutments have two sub-ground pile footings. Bridge 5/826 has
piles underneath the abutment spread footing. The soil spring stiffnesses were significantly
larger for bridge 5/227 because of the concrete piles. Also, bridge 5/227 is much shorter in
length and has shorter columns than bridges 5/518 and 5/826. Thus, comparing the sensitivity of
soil-structure-interaction of bridge 5/227 to bridges 5/518 or 5/826 cannot directly be done.
However, it can be stated that soil-structure-interaction had a significant effect on each bridge

46
and must be accounted for to accurately assess the bridge response to seismic excitations. The
thesis “Seismic Assessment and Retrofit of Existing Multi-Column Bent Bridges” (Cox, 2005)
can be referenced for more detailed information on the modeling and analysis of the three
bridges.
Table 9 Bridge 5/227 Displacement (Δ), Shear (V), Moment (M), and Curvature (φ) Demands; Moquegua, Peru EQ
Bent Es = 0.24 MPa Es = 47.9 MPa Es = 861.8 MPa Max Δ (cm) Tran Δ Long Δ Total Δ Tran Δ Long Δ Total Δ Tran Δ Long Δ Total Δ
West 9.7-c 5.1-s,n 9.9-c 9.7-s,n 4.1-s,n 9.9-s,n 8.6-c 4.6-n 8.6-s Center 13.7-s 7.1-s 14.0-n 11.2-s,n 5.6-s,n 11.2-s,n 11.4-c 5.0-c 11.5-c East 7.9-s 4.8-s 7.9-s,n 7.1-n 4.3-s,n 7.1-n 7.1-c 3.1-c 5.5-s,n
Exp Joint/ Bearing Pad
Gap Closing
Max Δ (cm) Failure Gap
Closing Max Δ (cm) Failure Gap
Closing Max Δ (cm) Failure
West Abut Y 3.9 Y Y 3.5 N Y 3.1 N West Bent Y 3.3 N Y 3.2 N Y 2.7 N
Center Bent Y 1.6 N Y 1.5 N Y 1.7 N East Bent Y 2.7 N Y 2.5 N Y 3.2 N East Abut Y 3.9 Y Y 3.5 N Y 2.6 N
Max V (kN) Tran V Long V Total V Tran V Long V Total V Tran V Long V Total V West 312-c 285-s,n 332-c 316-c 315-c 347-c 335-c 312-s,n 360-c
Center 381-c 322-c 403-c 389-c 301-c 399-c 387-c 300-s,n 417-c East 394-c 292-c 399-c 396-c 386-c 401-c 372-c 351-s,n 377-c
Total V (kN) 2721 2163 3422 2717 2257 2805 2427 2260 2776 Max Bot M
(kN-m) Tran M
Long M
Total M
Tran M
Long M
Total M
Tran M
Long M
Total M
West 1207-c 1649-c 1832-c 1219-c 1723-c 1891-c 1166-n 1657-c 1645-n Center 1276-c 1893-n 2011-s 1254-c 1927-c 2028-c 1279-c 1982-c 2030-c East 1104-n 1415-c 1542-c 1075-c 1262-s 1422-c 1070-n 1220-c 1402-c
Max Top M (kN-m)
Tran M
Long M
Total M
Tran M
Long M
Total M
Tran M
Long M
Total M
West 1357-c 1787-c 1897-c 1260-c 1742-c 1791-c 1169-c 1711-c 1798-c Center 1331-c 2011-c 2138-c 1291-c 2065-c 2225-c 1255-c 2047-c 2118-c East 1197-n 1517-n 1636-n 1129s,n 1456s,n 1552-n 1049-c 1291-c 1481-c
Max Top φ (1/m) Tran φ Long φ Total φ Tran φ Long φ Total φ Tran φ Long φ Total φ
West 0.043 0.092 0.095 0.039 0.085 0.089 0.036 0.082 0.085 Center 0.062 0.115 0.121 0.039 0.121 0.125 0.043 0.108 0.112 East 0.039 0.079 0.085 0.036 0.072 0.075 0.020 0.046 0.049

47
Table 10 Bridge 5/227 Displacement (Δ), Shear (V), Moment (M), and Curvature (φ) Demands; Olympia, WA EQ
Bent Es = 0.24 MPa Es = 47.9 MPa Es = 861.8 MPa Max Δ (cm) Tran Δ Long Δ Total Δ Tran Δ Long Δ Total Δ Tran Δ Long Δ Total Δ
West 4.8-s,n 3.8-s,n 5.1-c 5.3-s,n 3.6-c 5.6-s,n 4.1-s,n 3.3-s,n 4.5-c Center 8.9-s 5.1-s 9.0-s 7.1-c 5.0-c 7.1-c 7.6-s 4.4-s 7.8-n East 5.3-c 3.4-c 6.0-c 5.1-c 3.2-n 6.0-n 4.6-s,n 2.9-s,n 5.3-s,n
Exp Joint/ Bearing Pad
Gap Closing
Max Δ (cm) Failure Gap
Closing Max
Δ (cm) Failure Gap Closing
Max Δ (cm) Failure
West Abut Y 3.1 N Y 3.0 N Y 2.7 N West Bent Y 2.0 N Y 2.2 N Y 2.2 N
Center Bent Y 1.6 N Y 1.5 N Y 1.5 N East Bent Y 2.4 N Y 2.6 N Y 3.0 N East Abut Y 2.7 N Y 2.9 N Y 2.9 N
Max V (kN) Tran V Long V Total V Tran V Long V Total V Tran V Long V Total V West 293-c 223-c 318-c 311-s,n 282-c 316-c 307-s,n 308-c 312-c
Center 335-c 231-c 335-c 361-c 260-c 377-c 338-n 277-n 351-n East 314-c 236-c 321-c 324-c 226-n 325-c 298-s,n 270-c 360-c
Total V (kN) 2057 1718 3243 2507 1830 3179 1990 1764 2971 Max Bot M
(kN-m) Tran M
Long M
Total M
Tran M
Long M
Total M
Tran M
Long M
Total M
West 1205s,n 1171s,n 1433s,n 1142-c 1272-c 1510-c 1161-c 1171s,n 1406-c Center 1288-c 1597-c 1702-s 1331-c 1281s,n 1428s,n 1212-n 1609-c 1627-c East 1070s,n 1298s,n 1319s,n 1136-c 1321-n 1531-c 1148-c 1269-c 1265-c
Max Top M (kN-m)
Tran M
Long M
Total M
Tran M
Long M
Total M
Tran M
Long M
Total M
West 1152-c 1390-c 1505-c 1230-c 1356-c 1525s,n 1215-c 1227-c 1363-c Center 1292-c 1558-n 1654-c 1315-c 1237s,n 1467s,n 1270-s 2214-c 1536-s East 1193-c 1257-c 1449-c 1174-n 1310-s 1453-c 1081-c 1253-c 1367-c
Max Top φ (1/m) Tran φ Long φ Total φ Tran φ Long φ Total φ Tran φ Long φ Total φ
West 0.036 0.049 0.056 0.036 0.046 0.056 0.033 0.036 0.049 Center 0.056 0.079 0.082 0.046 0.052 0.062 0.043 0.069 0.079 East 0.036 0.052 0.062 0.033 0.049 0.066 0.030 0.046 0.046
48
WSU-NEABS/RUAUMOKO Comparison
In recent research performed by Thompson (2004), bridges 5/518 and 5/826 were also
analyzed using the program WSU-NEABS (Zhang et.al., 1999)and the Moquegua, Peru, ground
motions. Thompson’s soil spring stiffnesses for bridge 5/518 were similar to the model in this
research based on Es = 287.3 MPa (6000 ksf). Thompson’s soil spring stiffnesses for bridge
5/826 were similar to the values used in this research based on Es = 47.9 MPa (100 ksf). Results
from WSU- NEABS using the Moquegua, Peru ground motions showed some differences with
the results in this study using RUAUMOKO, however, the overall bridge assessments were
similar. When comparing the analyses of bridge 5/518, the maximum total column displacement
at the center bent varied by less than 20%. The maximum total column shear force at the center
bent varied by less than 10%. When comparing analyses of bridge 5/826, for WSU-NEABS, the
maximum total column displacement at the center bent varied by less than 15%. The maximum
total column shear force at the center bent varied by 10%. Considering that the bridge analyses
were carried out by separate users with different computer analysis programs, using different soil
spring models, the results are similar, helping to validate both bridge analyses.
Bridge Retrofit Analytical Findings
Based upon the observed bridge analytical responses to eight earthquake ground motions,
several retrofit methods were implemented. The object of any retrofit scheme is to increase the
capacity of the bridge and/or decrease the demand on the bridge. Reducing the displacement
demands was the goal of the retrofit schemes in this research, to reduce the column and
expansion joint damage that was predicted to occur under the large earthquake ground motions.
For the retrofit study, friction dampers, viscous dampers and transverse link beams were used to
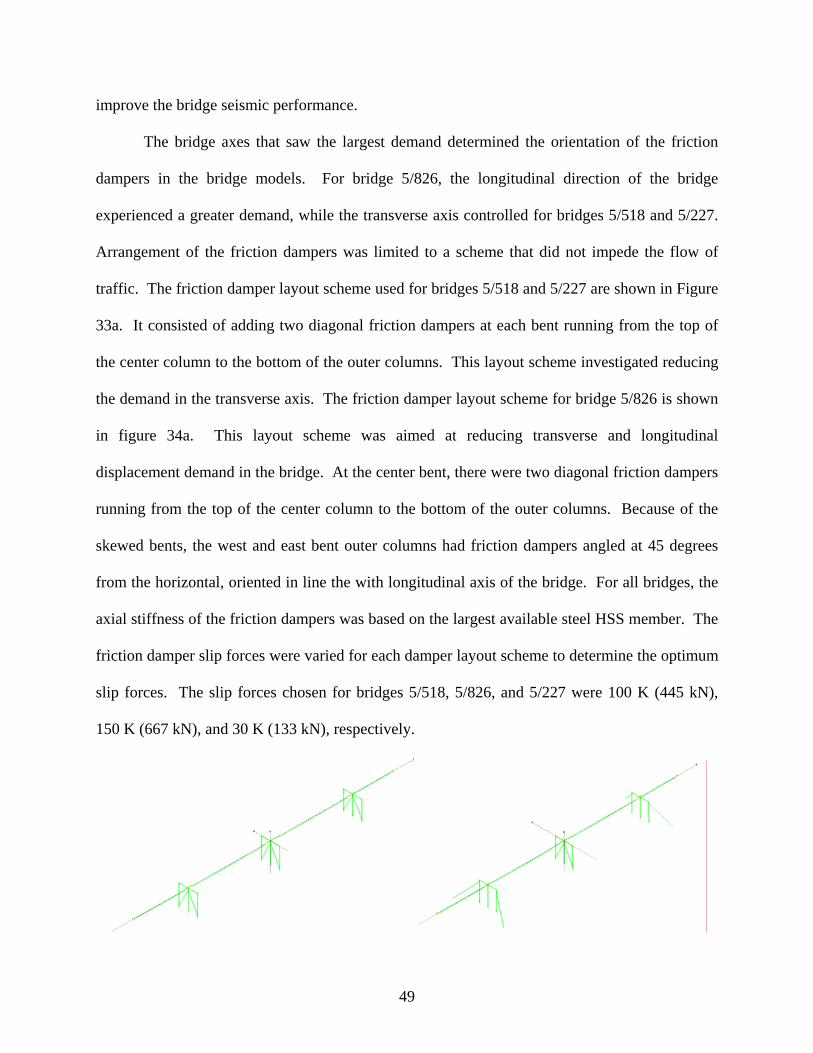
49
improve the bridge seismic performance.
The bridge axes that saw the largest demand determined the orientation of the friction
dampers in the bridge models. For bridge 5/826, the longitudinal direction of the bridge
experienced a greater demand, while the transverse axis controlled for bridges 5/518 and 5/227.
Arrangement of the friction dampers was limited to a scheme that did not impede the flow of
traffic. The friction damper layout scheme used for bridges 5/518 and 5/227 are shown in Figure
33a. It consisted of adding two diagonal friction dampers at each bent running from the top of
the center column to the bottom of the outer columns. This layout scheme investigated reducing
the demand in the transverse axis. The friction damper layout scheme for bridge 5/826 is shown
in figure 34a. This layout scheme was aimed at reducing transverse and longitudinal
displacement demand in the bridge. At the center bent, there were two diagonal friction dampers
running from the top of the center column to the bottom of the outer columns. Because of the
skewed bents, the west and east bent outer columns had friction dampers angled at 45 degrees
from the horizontal, oriented in line the with longitudinal axis of the bridge. For all bridges, the
axial stiffness of the friction dampers was based on the largest available steel HSS member. The
friction damper slip forces were varied for each damper layout scheme to determine the optimum
slip forces. The slip forces chosen for bridges 5/518, 5/826, and 5/227 were 100 K (445 kN),
150 K (667 kN), and 30 K (133 kN), respectively.

50
(a) (b)
Figure 33 (a) Friction Damper and (b) Viscous Damper Layouts for Bridge 5/518 and 5/227
The viscous damper layout scheme for bridges 5/518 and 5/227 are shown in Figure 31b.
With this orientation of viscous dampers, the demands in the transverse and longitudinal axes of
the bridges were reduced. The viscous dampers for this layout scheme were oriented so that a
45-degree angle from the vertical axis of the bridge was formed at the damper to column
connection. The angle from the transverse axis of the bridge to the damper was 30 degrees. For
bridge 5/826, the viscous damper layout scheme was the same as the friction damper retrofit. In
all bridge models, damping ratios were kept below 35 percent. The damping constant for the
final layout schemes for bridges 5/518, 5/826, and 5/227 were 500 K-s/ft (7297 kN-s/m), 600 K-
s/ft (8756 kN-s/m) and 200 K-s/ft (2919 kN-s/m), respectively.
Transverse link beams were implemented in bridges 5/518 and 5/227. Transverse link
beams would not benefit bridge 5/826 as significantly as the other bridges because the
longitudinal axis of bridge 5/826 experienced the largest displacement demand. Frame members
located at the mid-height of the columns were used to model the link beams (see Figure 32b).
The cross-sectional height and width of the link beams were 3 ft (0.91 m). The link beams were
modeled as linear elastic members. Plastic hinging was forced to occur in the columns at the top,
bottom, and just underneath the link beams. Because link beams add considerable stiffness to
each bent, the shear demand on each column is critical to monitor.
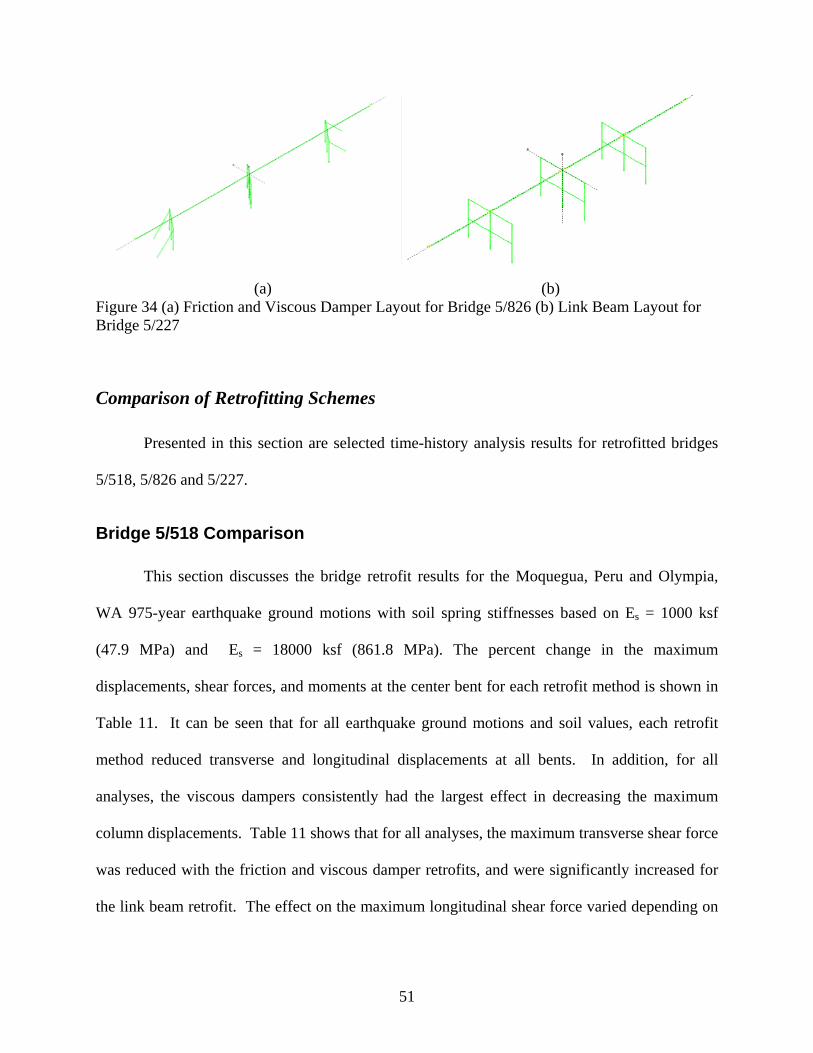
51
(a) (b) Figure 34 (a) Friction and Viscous Damper Layout for Bridge 5/826 (b) Link Beam Layout for Bridge 5/227
Comparison of Retrofitting Schemes
Presented in this section are selected time-history analysis results for retrofitted bridges
5/518, 5/826 and 5/227.
Bridge 5/518 Comparison
This section discusses the bridge retrofit results for the Moquegua, Peru and Olympia,
WA 975-year earthquake ground motions with soil spring stiffnesses based on Es = 1000 ksf
(47.9 MPa) and Es = 18000 ksf (861.8 MPa). The percent change in the maximum
displacements, shear forces, and moments at the center bent for each retrofit method is shown in
Table 11. It can be seen that for all earthquake ground motions and soil values, each retrofit
method reduced transverse and longitudinal displacements at all bents. In addition, for all
analyses, the viscous dampers consistently had the largest effect in decreasing the maximum
column displacements. Table 11 shows that for all analyses, the maximum transverse shear force
was reduced with the friction and viscous damper retrofits, and were significantly increased for
the link beam retrofit. The effect on the maximum longitudinal shear force varied depending on

52
the earthquake and soil spring stiffness used. For the link beam models, the maximum transverse
and longitudinal column bottom moments were considerably smaller than the pre-retrofit values.
The bearing pad displacements showed several trends. For the friction dampers, viscous
dampers and link beams, the abutment bearing pad displacements were reduced and the bent
bearing pad displacements were increased for both earthquake ground motions and soil spring
stiffness values. For the bridge models with soil spring stiffnesses based on Es = 1000 ksf (47.9
MPa) and Es = 18000 ksf (861.8 MPa) subjected to the Moquegua, Peru earthquake ground
motions, bearing pad failure occurred at all bents for the friction dampers and link beams. For
the viscous dampers, the center bent was the only bearing pad that did not fail. For the Olympia,
WA earthquake ground motions (975-year return period), the only bearing pad to fail with the
link beam retrofit was the west bent for soil spring stiffnesses based on Es = 1000 ksf (47.9
MPa).
Table 11 Bridge 5/518 Maximum Reduction in Displacement, Shear and Moment Demands
Bridge 5/518 % Reduction (-) / Increase (+) for Center Bent Max.
Displacement Max. Shear Base Moment Top Moment Ground Motions & Soil Values
Retrofit Method Tran. Long. Tran. Long. Tran. Long. Tran. Long. Friction -39 -17 -10 -1 +5 -11 -6 -7 Viscous -62 -28 -21 -4 +1 -22 -5 -19
Peru – Es = 1,000 Ksi
(47.9 MPa) Link Beam -34 -7 +62 -4 -64 -34 +4 -1 Friction -42 -17 -11 -6 +9 -14 -7 -9 Viscous -62 -39 -16 -7 +9 -15 -1 -12
Peru – Es = 18,000 Ksi
(861.8 MPa) Link Beam -38 -9 +76 +16 -55 -25 +4 -16 Friction -62 -8 -10 +53 +1 -15 -6 -13 Viscous -62 -14 -28 -4 -6 -29 -10 -26
Olympia – Es = 1,000 Ksi
(47.9 MPa) Link Beam -35 -7 +48 +64 -39 -39 -12 -18 Friction -26 -8 -10 -12 +5 -8 +8 +11 Viscous -50 -21 -13 -29 -4 -14 -4 -14
Olympia – Es = 18,000 Ksi
(861.8 MPa) Link Beam -32 -11 +64 -17 -31 -31 +13 -24

53
Bridge 5/826 Comparison
This section discusses the bridge retrofit results for the Moquegua, Peru and Mexico City,
Mexico earthquake ground motions with soil spring stiffnesses based on Es = 1000 ksf (47.9
MPa) and Es = 18000 ksf (861.8 MPa), respectively. The link beam retrofit scheme was not
studied due to the governing response in the longitudinal direction of the bridge. The percent
change in the maximum displacements, shear forces, and moments at the center bent for each
retrofit method is shown in Table 12. For all earthquakes and soil values, each retrofit method
reduced transverse and longitudinal displacements at all bents. For all analyses, the viscous
dampers consistently had the largest effect in decreasing the maximum longitudinal and
transverse column displacements. For three of the four analyses the maximum shear force was
increased with the friction damper retrofit. For all analyses the viscous damper retrofits reduced
the maximum shear force. For all soil spring stiffness values, maximum transverse moments at
the center bent were reduced with the friction and viscous damper retrofits.
Table 12 Bridge 5/826 Maximum Reduction in Displacement, Shear and Moment Demands
Bridge 5/826 % Reduction (-) / Increase (+) for Center Bent Max.
Displacement Max. Shear Base Moment Top Moment Ground Motions & Soil Values
Retrofit Method Tran. Long. Tran. Long. Tran. Long. Tran. Long. Friction -30 -47 +9 -8 -45 -25 -29 -29 Peru –
Es = 1,000 Ksi (47.9 MPa) Viscous -46 -65 -1 -14 -55 -30 -18 -28
Friction -34 -46 -5 -11 -30 -16 -4 -19 Peru – Es = 18,000 Ksi
(861.8 MPa) Viscous -45 -65 -7 -12 -30 -11 -31 -17
Friction -16 -60 +6 -41 -27 -29 -39 -5 Mexico – Es = 1,000 Ksi
(47.9 MPa) Viscous -44 -65 -22 -65 -65 -54 -65 -43
Friction -21 -60 +9 -21 -14 -19 -29 -16 Mexico – Es = 18,000 Ksi
(861.8 MPa) Viscous -49 -65 -14 -51 -65 -38 -65 -36

54
Bridge 5/227 Comparison This section shows the results for the Moquegua, Peru and Olympia, WA earthquake
ground motions with soil spring stiffnesses based on Es = 0.24 MPa (5 ksf) and Es = 861.8 MPa
(18000 ksf). The percent change for the maximum displacements, shear forces, and moments at
the center bent is shown in Table 13. For all earthquakes and soil spring stiffness values, each
retrofit method reduced displacements at all bents. The viscous dampers had the largest effect in
decreasing the maximum column displacement demand. The maximum transverse shear force
was reduced with the friction and viscous damper retrofits, but was significantly increased for
the link beam retrofit. The maximum longitudinal shear force increased in a few cases for the
friction damper retrofits. The link beam retrofit also significantly increased the maximum
longitudinal shear force for all analyses. For all soil spring stiffness values, maximum transverse
and longitudinal moments at the column bottom for all retrofit methods were reduced from the
pre-retrofitted moments. The column top maximum transverse and longitudinal moment was
reduced for the friction and viscous damper retrofits. For the link beam, the maximum
transverse and longitudinal column top moments were larger than the pre-retrofit values.
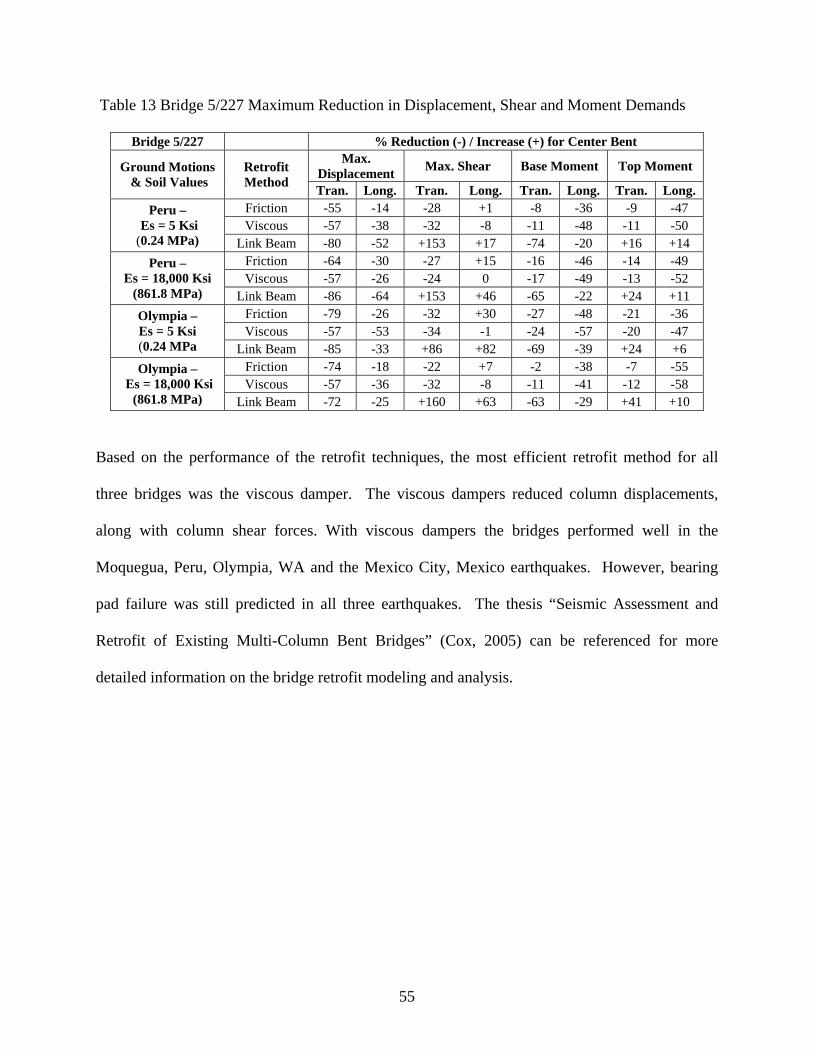
55
Table 13 Bridge 5/227 Maximum Reduction in Displacement, Shear and Moment Demands
Bridge 5/227 % Reduction (-) / Increase (+) for Center Bent Max.
Displacement Max. Shear Base Moment Top Moment Ground Motions & Soil Values
Retrofit Method Tran. Long. Tran. Long. Tran. Long. Tran. Long. Friction -55 -14 -28 +1 -8 -36 -9 -47 Viscous -57 -38 -32 -8 -11 -48 -11 -50
Peru – Es = 5 Ksi (0.24 MPa) Link Beam -80 -52 +153 +17 -74 -20 +16 +14
Friction -64 -30 -27 +15 -16 -46 -14 -49 Viscous -57 -26 -24 0 -17 -49 -13 -52
Peru – Es = 18,000 Ksi
(861.8 MPa) Link Beam -86 -64 +153 +46 -65 -22 +24 +11 Friction -79 -26 -32 +30 -27 -48 -21 -36 Viscous -57 -53 -34 -1 -24 -57 -20 -47
Olympia – Es = 5 Ksi (0.24 MPa Link Beam -85 -33 +86 +82 -69 -39 +24 +6
Friction -74 -18 -22 +7 -2 -38 -7 -55 Viscous -57 -36 -32 -8 -11 -41 -12 -58
Olympia – Es = 18,000 Ksi
(861.8 MPa) Link Beam -72 -25 +160 +63 -63 -29 +41 +10
Based on the performance of the retrofit techniques, the most efficient retrofit method for all
three bridges was the viscous damper. The viscous dampers reduced column displacements,
along with column shear forces. With viscous dampers the bridges performed well in the
Moquegua, Peru, Olympia, WA and the Mexico City, Mexico earthquakes. However, bearing
pad failure was still predicted in all three earthquakes. The thesis “Seismic Assessment and
Retrofit of Existing Multi-Column Bent Bridges” (Cox, 2005) can be referenced for more
detailed information on the bridge retrofit modeling and analysis.
56
Conclusions
Three typical pre-1975 WSDOT pre-stressed concrete multi-column bent bridges were
chosen for seismic evaluation and retrofit assessment. Most of the seismically deficient single
column bent bridges in western Washington have been upgraded seismically. However, with
limited funding to improve thousands of multi-column bent bridges, a prioritization of these
bridges is necessary. Eight earthquake ground motions were used for nonlinear time history
analysis of the bridges: three 475-year return period ground motions (Mexico City, Mexico,
1985; Kobe , Japan, 1995; and Olympia, Washington, 1949) with peak ground accelerations
(PGA’s) of approximately 0.3g and spectral accelerations of approximately 0.7g for a structural
period of 0.5 seconds (SA(T=0.5s) ; the three bridge fundamental periods ranged from 0.4-0.6
seconds); three 975-year return period ground motions (Mexico City, Mexico, 1985; Kobe ,
Japan, 1995; and Olympia, Washington, 1949) with PGA’s of approximately 0.5g and SA(T=0.5s) of
approximately 1.0g; and two large Cascadia Subduction-Zone (CSZ) earthquake ground motions
(Moquegua, Peru, 2001; Llolleo, Chile, 1985) with PGA’s of approximately 0.6g and SA(T=0.5s) of
approximately 1.2g. These CSZ ground motion spectral accelerations are similar to the 2003
United States Geological Survey (USGS) 2475-year return period spectral acceleration values for
Seattle, WA, for structural periods equal to 0.5 seconds. The 2005 Earthquake Engineering
Research Institute “Scenario for a Magnitude 6.7 Earthquake on the Seattle Fault” (EERI, 2005)
predicted PGA’s exceeding 0.7g, larger than the CSZ ground motion PGA’s used in this
research. It should also be noted that the 2001 Nisqually, WA earthquake generated PGA’s of
approximately 0.3g (EERI, 2005). All ground motions were modified appropriately to fit target
acceleration response spectra for the Seattle area.

57
For the three ground motion records with 475-year return periods, predicted bridge
damage was limited to light cracking in the columns and minor damage to the expansion joints of
all three bridges. For the four ground motion records with 975-year return periods, moderate
cracking, including spalling of the cover concrete in the plastic hinge region, was predicted in the
columns of all the bridges. The column force/displacement demands still did not approach the
column shear capacity envelopes, however, some of the bridge deck expansion joints were
severely damaged under the 975-year return period earthquakes for bridges 5/518 and 5/826, but
not for bridge 5/227. The 2475-year return period ground motions resulted in a wide range of
bridge damage, from moderate cracking in the column plastic hinge regions in bridge 5/826, to
likely shear/lap splice failure of columns in bridges 5/518 and 5/227. Significant column
damage in bridge 5/518 and 5/227 was due to light transverse confinement, small column aspect
ratios, and the non-monolithic bridge decks, which contributed to large displacements in the
transverse direction. The bridge deck expansion joints were also predicted to suffer damage
under the 2475-year return period ground motions for bridges 5/518 and 5/826.
Column footing demand/capacity ratios were also checked for each analysis; significant
damage was not predicted. If the columns were retrofitted, resulting in an increase in the column
demands, the demand on the footings could exceed the capacity of the footings. Therefore,
further investigation of the foundations is necessary if column retrofit is implemented. Due to
failure of prestressed concrete girders in one bridge during the 2001 Nisqually, WA earthquake,
the girder demand/capacity ratios were also monitored closely, however, the demands did not
exceed the capacities in any of the analyses. It is likely that significant dynamic amplification
(which was not assessed in this research) occurred due to pounding of the girders against the

58
girder stops, resulting in a torsional response of the girders, leading to large girder demands for
that particular bridge.
The effects of soil-structure-interaction were investigated and found to be influential for
all the bridge analyses. The soil-structure-interaction study revealed that each bridge responded
uniquely to variations in soil spring stiffnesses. When soil spring stiffnesses were changed, the
maximum column displacements varied for all three bridges. In addition, modeling the column
footings with fixed boundary conditions and the abutments with rollers in the longitudinal
direction resulted in inaccurate and often unconservative bridge seismic assessment, illustrating
the need for including soil-structure-interaction to accurately model the bridge response.
The purpose of any retrofit procedure is to increase the capacity and/or reduce the
demand on a structure. Bridge columns wrapped with steel or composite jackets has been proven
effective for improving column displacement capacity. Reducing displacement demands without
significantly increasing the shear force demands was the goal of the retrofit schemes in this
research. The three retrofit techniques implemented in this research were: friction dampers,
viscous dampers, and transverse link beams. The link beams proved effective in reducing
column displacements, but the column shear force/displacement demand was increased past the
shear capacity of the columns. A possible retrofit scheme could include constructing transverse
link beams and wrapping columns with steel jackets to increase the shear capacity of the
columns.
Friction dampers proved effective for all bridges. Several layout schemes were
investigated. The trends in displacement reduction for the varied soil spring stiffnesses and
different earthquake ground motions were similar for the three bridges. Trends in shear force
demand varied for each ground motion, but the shear force/displacement demand with the
59
friction dampers did not exceed the column shear capacity envelopes. Analytically, the optimum
retrofit method for all three bridges was the viscous damper retrofit. Viscous dampers were
chosen with the criteria that less than 35% critical damping could be obtained. The retrofits with
viscous dampers were effective at reducing displacement demand in the columns, and reducing
the column shear force demands. However, using friction dampers for retrofit might be a more
cost effective solution. A cost analysis should be performed in order to choose which retrofit
scheme to use for a given bridge.
Overall, this research on the seismic response of typical pre-1975 pre-stressed concrete
multi-column bent bridges in western Washington State highlighted the vulnerability of non-
monolithic bridge decks and shear-dominated bridge columns in pre-1975 WSDOT prestressed
concrete multi-column bent bridges as well as the need for the inclusion of soil-structure-
interaction, calibrated force-displacement characterization of columns and detailed modeling of
the interaction between bridge components (e.g. proper modeling of nonlinear impacting of non-
monolithic decks) for accurate bridge seismic assessment. In the end, the seismic assessment of
bridges is a cost/efficiency issue. Because each bridge is different, investing in improved
analyses up front will enable an efficient use of the limited funds for bridge improvement.
Recommendations
Based on the results of this research, the following recommendations are made:
Due to variation in bridge deck type, column aspect ratios, column and abutment
foundation design, bridge width and span, etc…seismic assessment of prestressed
concrete multi-column bent bridges requires analyzing each bridge as a multiple-
degree-of-freedom system

60
Inclusion of soil-structure-interaction in bridge seismic assessment is necessary, fixed
column bases and abutments with roller boundary conditions lead to inaccurate results
that are often unconservative; minimum foundation modeling should incorporate
linear secant stiffness springs
In order to assess bridge columns, column force/displacement hysteresis behavior
should be calibrated to experimental test data and plotted versus the degrading column
shear force capacity envelope
Bridges with non-monolithic decks warrant additional analyses due to increased
transverse displacement demands and multiple expansion joint interaction
To decrease the bridge seismic displacement demand, investigation of the use of both
friction and viscous dampers is warranted.
Acknowledgements
This research was conducted through the Washington State Transportation Center
(TRAC) and under contract to the Washington State Department of Transportation (WSDOT).
The financial support provided by WSDOT is greatly appreciated. In addition, WSDOT project
coordinator Dr. Chyuan Shen Lee was very helpful with providing information on the bridges
throughout the project and discussing the bridge analyses.

61
Resources
AASHTO. (2005). LRFD Bridge Design Specifications, 3rd Edition. American Association of State Highway and Transportation Officials.
Abrahamson, N. A. (1998). “Non-Stationary Spectral Matching Program RSPMATCH.” PG&E Internal Report, University of California, Los Angeles.
Atkinson, G. M. and Boore, D. M. (2003). “Empirical Ground-Motion Relations for Subduction-Zone Earthquakes and Their Application to Cascadia and Other Regions.” Bulletin of the Seismological Society of America, Vol. 93 No. 4, 1703-1729.
Bowles, J.E. (1995). “Foundation Analysis and Design.” New York; McGraw Hill Co. 5th Ed.
Caltrans (2004). “Seismic Design Criteria” Section 1.1 and Section 7-Design. Version 1.3.
Carr, A.J. (2004). Volume 3: User Manual For the 3-Dimensional Version, Ruaumoko3D. University of Canterbury.
Carr, A.J. (2004). Volume 3: User Manual For the 3-Dimensional Version, SPECTRA. University of Canterbury.
Chai, Y.H., Priestley, M.J.N., Seible, F. (1991). “Seismic Retrofit of Circular Bridge Columns for Enhanced Flexural Performance.” ACI Structural Journal, 88(5) 572-584.
Chang, F. K. and Krinitzsky, E. L. (1997). “Duration, spectral content, and predominant period of strong motion earthquake records from western United States,” Miscellaneous Paper 5-73-1, U.S.A.C.E. Waterways Experiment Station, Vicksburg, Mississippi.
Cox, C. (2005). " Seismic Assessment and Retrofit of Existing Multi-Column Bent Bridges.” M.S. Thesis, Department of Civil and Environmental Engineering, Washington State University.
Dobry, R., Idriss, I.M., and Ng, E. (1978). "Duration characteristics of horizontal components of strong motion earthquake records," Bulletin of the Seismological Society of America, 68(5), 1487 – 1520.

62
EERI. (2005). "Scenario for a Magnitude 6.7 Earthquake on the Seattle Fault,” Earthquake Engineering Research Institute and the Washington Military Department Emergency Management Division, 2005.
Filiatrault, A. (2002). Elements of Earthquake Engineering and Structural Dynamics, Polytechnic International Press, Montreal Canada.
Gregor, N. J., Silva, W. J., Wong, I. G., and Youngs, R. R. (2002). “Ground-Motion Attenuation Relationships for Cascadia Subduction Zone Megathrust Earthquakes Based on a Stochastic Finite-Fault Model.” Bulletin of the Seismological Society of America, Vol. 92 No. 5, 1923-1932.
Hanks, T. C., and McGuire, R. K. (1981). “The character of high-frequency strong ground motion,” BSSA, 71, 2071-2095.
Jaradat, O.A. (1996). “Seismic Evaluation of Existing Bridge Columns.” Ph.D. Dissertation, Department of Civil and Environmental Engineering, Washington State University.
Kuebler, S.E. (1997). “Evaluation of Seismic Retrofit Strategies for Multi-Column Bridge Bents”, M.S. Thesis, Department of Civil and Environmental Engineering, Washington State University.
Lam, I., Martin, G. (1986). “Seismic Design of Highway Bridge Foundations.” Applied Technology Council, Report No. FHWA/RD-86/102.
LPile4.0. (2000). Reese, L.C., Wang, S.T, Isenhower, W.M, Arrellaga, J.A. “LPILE PLUS” Version 4.0.
Ludwin, R. (2002). “Deep Quakes in Washington and Oregon”, Pacific Northwest Seismograph Network (PNSN), University of Washington. Accessed online at: http://www.pnsn.org/INFO_GENERAL/plates.gif.
Mealy, T.E. (1997). “Seismic Performance and Retrofit of Multi-Column Bridge Bents”, M.S. Thesis, Department of Civil and Environmental Engineering, Washington State University.
PanGEO Inc., (2005). “Aurora Avenue Bridge.” Accessed online at: http://pangeoinc.com.

63
PNSN (2005). “Deep Quakes in Washington and Oregon.” Pacific Northwest Seismograph Network, University of Washington. Accessed online at: <http://www.pnsn.org/INFO_GENERAL/platecontours.html>
Priestley, M.J.N., Seible, F., Calvi, G.M. (1996). Seismic Design and Retrofit of Bridges. New York. John Wiley & Sons.
Priestley, M.J.N. (2003). “Myths and Fallacies in Earthquake Engineering, Revisited.” The Mallet Milne Lecture, Rose School; Pavia, Italy.
Priestley, M.J.N., Seible, F., Chai, Y.H., Sun, Z.L. (1991). “Flexural Retrofit of Bridge Columns by Steel Jacketing.” Proceedings of the First Annual Seismic Workshop, California Department of Transportation, Division of Structures, 203-208.
Stapleton, S.E. (2004). “Performance of Poorly Confined Reinforced Concrete Columns in Long-Duration Earthquakes.” M.S. Thesis, Department of Civil and Environmental Engineering, Washington State University.
Thompson, T. (2004). “The Effects of Long-Duration Earthquakes on Lightly Reinforced Concrete Bridges.” M.S. Thesis, Department of Civil and Environmental Engineering, Washington State University.
USGS. (2003). “National Seismic Hazard Mapping Project.” United States Geologic Survey.
Accessed online at: http://eqhazmaps.usgs.gov/. Vader, A.S. (2004). “The Influence of Signature Tower Passive Energy Dissipating Devices on
the Seismic Response of Long-Span Cable-Supported Bridges.” M.S. Thesis, Department of Civil and Environmental Engineering, Washington State University.
Washington State Department of Transportation (WSDOT). (2005). “Bridge Design Manual.” Chapter 4.4.
Zhang, Y., Cofer, W. F., and McLean, D. I. (1999). “Analytical Evaluation of Retrofit Strategies for Multi-Column Bridges,” Journal of Bridge Engineering, Vol. 4, No. 2, pp. 143-150.