Seep Tents Masters Project Fall Presentation Bren School of Environmental Science & Management.
date post
20-Dec-2015Category
view
215download
1
Seep Tents Seep Tents Masters ProjectMasters Project
Presentation to Presentation to StakeholdersStakeholders
April 12April 12thth, 2002 , 2002
Donald Bren School of Environmental Science & Management
2
AgendaAgenda IntroductionsIntroductions BackgroundBackground Research approachResearch approach Water quality & marine ecologyWater quality & marine ecology Air qualityAir quality Regulatory obstacles & requirementsRegulatory obstacles & requirements Economic costs & benefits of seep Economic costs & benefits of seep
tentstents Results & RecommendationsResults & Recommendations
3
Group Project MembersGroup Project Members
Ali GerAli Ger Water quality, marine ecology, cost-benefit Water quality, marine ecology, cost-benefit
analysisanalysis Misty GonzalesMisty Gonzales
Air quality, ozone production modelingAir quality, ozone production modeling Erin MayberryErin Mayberry
Health valuation, cost-benefit analysisHealth valuation, cost-benefit analysis Farah ShamszadehFarah Shamszadeh
Gas price forecasting, cost-benefit analysis, Gas price forecasting, cost-benefit analysis, regulatory frameworkregulatory framework
4
BackgroundBackground
Project proposed by SBCAPCDProject proposed by SBCAPCD Research motivationResearch motivation
Recent CA energy crisis has renewed Recent CA energy crisis has renewed interest in capturing this seepage as a interest in capturing this seepage as a potential “green” source of natural potential “green” source of natural gasgas
The SBCAPCD suggested that The SBCAPCD suggested that capturing natural hydrocarbons might capturing natural hydrocarbons might reduce local air pollutionreduce local air pollution
5
Research ApproachResearch Approach
We take an interdisciplinary approach to We take an interdisciplinary approach to evaluating a proposed project by estimating:evaluating a proposed project by estimating: Impacts on water quality and marine ecology Impacts on water quality and marine ecology Effects on air qualityEffects on air quality Regulatory obstacles and requirementsRegulatory obstacles and requirements Economic costs and benefits of installing Economic costs and benefits of installing
additional seepadditional seep gas capture tents gas capture tents Majority of the data for this group project Majority of the data for this group project
came from the UCSB Hydrocarbon Seeps came from the UCSB Hydrocarbon Seeps Project and SBCAPCDProject and SBCAPCD
6
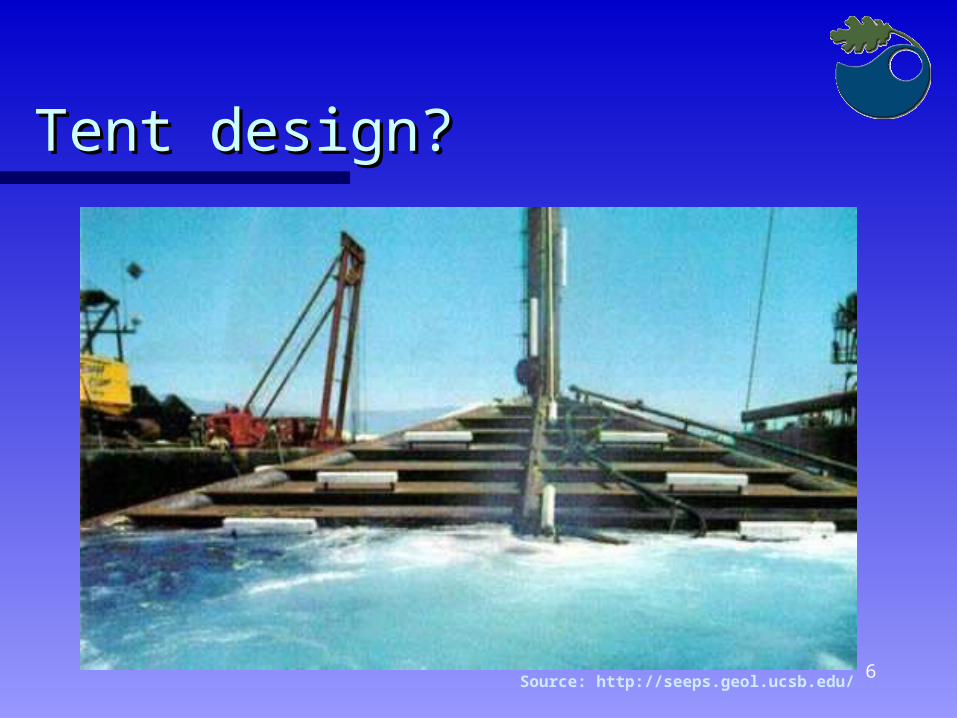
Tent design?Tent design?
Source: http://seeps.geol.ucsb.edu/
7
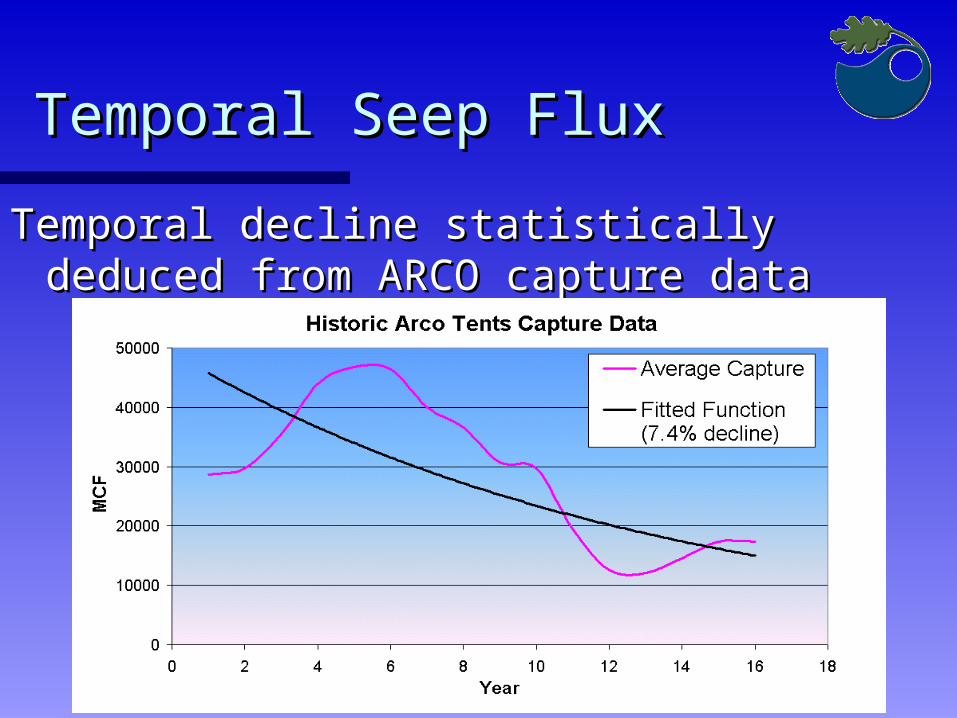
Temporal Seep FluxTemporal Seep Flux
Temporal decline statistically deduced Temporal decline statistically deduced from ARCO capture datafrom ARCO capture data
8
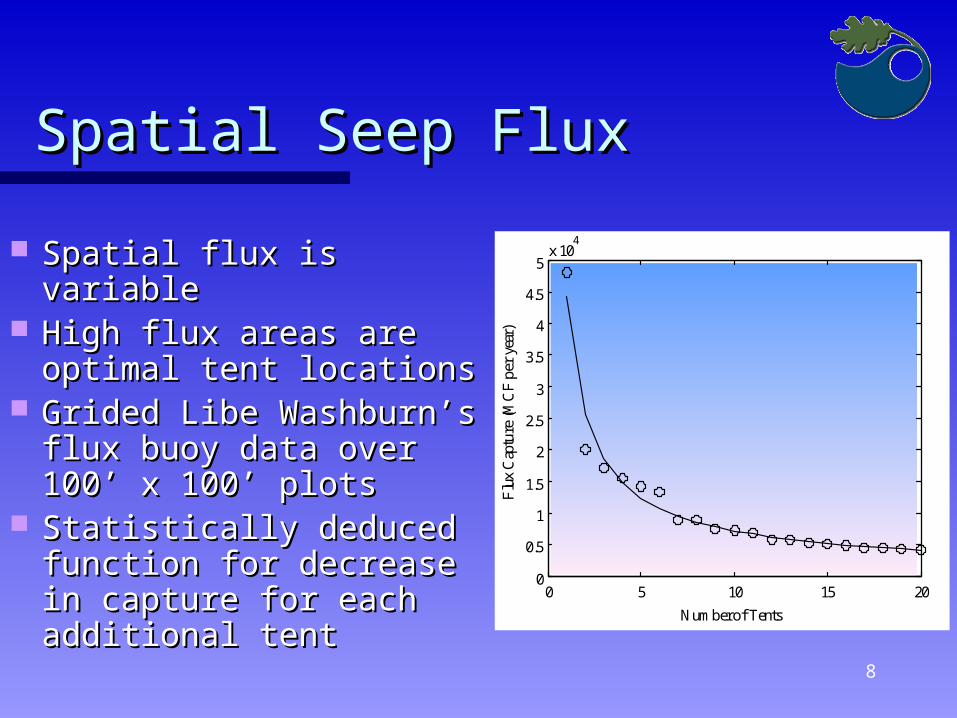
Spatial Seep FluxSpatial Seep Flux
Spatial flux is variableSpatial flux is variable High flux areas are High flux areas are
optimal tent locationsoptimal tent locations Grided Libe Washburn’s Grided Libe Washburn’s
flux buoy data over flux buoy data over 100’ x 100’ plots100’ x 100’ plots
Statistically deduced Statistically deduced function for decrease in function for decrease in capture for each capture for each additional tentadditional tent
0 5 10 15 200
0.5
1
1.5
2
2.5
3
3.5
4
4.5
5x 10
4
Number of Tents
Flu
x C
aptu
re (M
CF p
er y
ear)
9
Environmental Impact Environmental Impact marine environmentmarine environment
Important to understand how Important to understand how additional seep tents may impact:additional seep tents may impact: Seep gas total flux ratesSeep gas total flux rates Fate and transport of hydrocarbon Fate and transport of hydrocarbon
gasesgases Marine ecologyMarine ecology
Interactions with seep ecosystem Interactions with seep ecosystem structurestructure
10
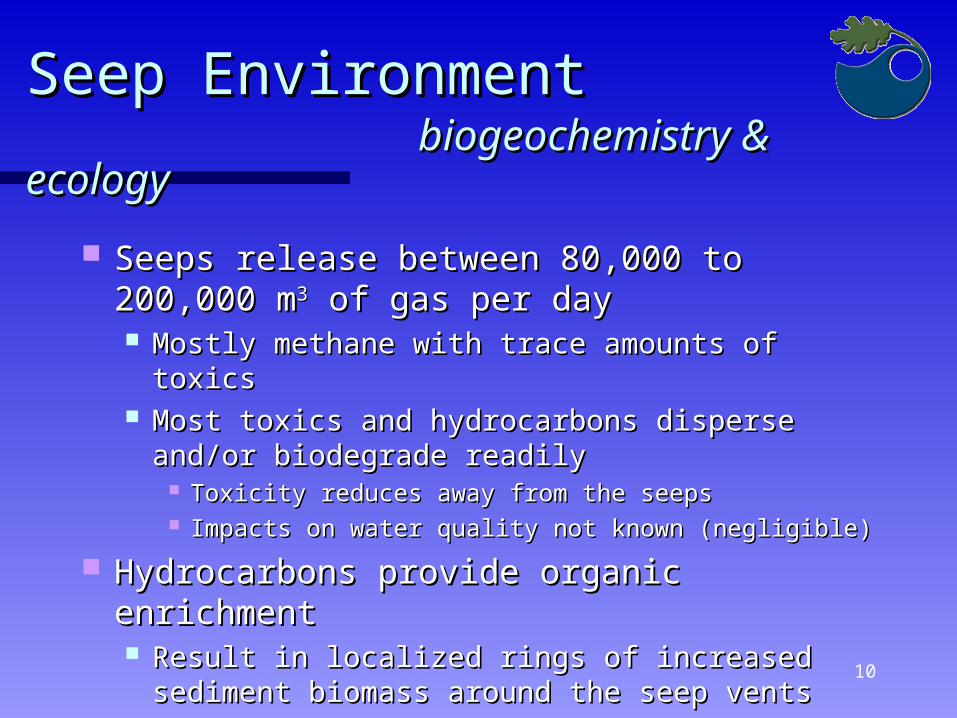
Seep EnvironmentSeep Environment biogeochemistry & biogeochemistry &
ecology ecology
Seeps release between 80,000 to 200,000 Seeps release between 80,000 to 200,000 mm33 of gas per day of gas per day Mostly methane with trace amounts of toxicsMostly methane with trace amounts of toxics Most toxics and hydrocarbons disperse and/or Most toxics and hydrocarbons disperse and/or
biodegrade readilybiodegrade readily Toxicity reduces away from the seepsToxicity reduces away from the seeps Impacts on water quality not known (negligible)Impacts on water quality not known (negligible)
Hydrocarbons provide organic enrichmentHydrocarbons provide organic enrichment Result in localized rings of increased sediment Result in localized rings of increased sediment
biomass around the seep vents biomass around the seep vents
11
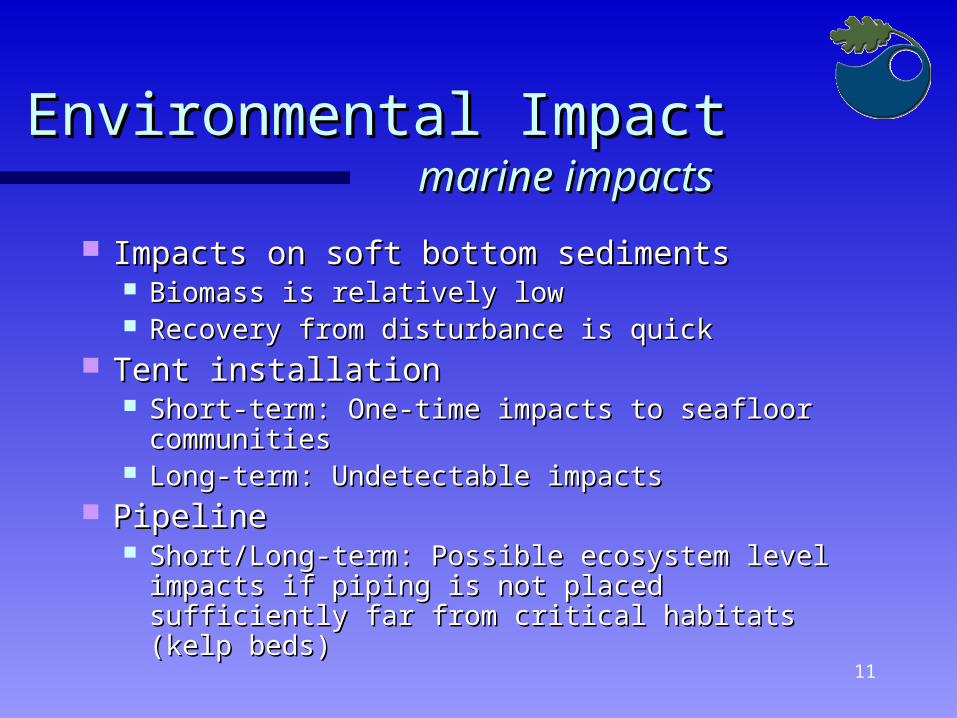
Environmental Impact Environmental Impact marine impactsmarine impacts
Impacts on soft bottom sedimentsImpacts on soft bottom sediments Biomass is relatively lowBiomass is relatively low Recovery from disturbance is quickRecovery from disturbance is quick
Tent installationTent installation Short-term: One-time impacts to seafloor Short-term: One-time impacts to seafloor
communitiescommunities Long-term: Undetectable impactsLong-term: Undetectable impacts
PipelinePipeline Short/Long-term: Possible ecosystem level Short/Long-term: Possible ecosystem level
impacts if piping is not placed sufficiently far impacts if piping is not placed sufficiently far from critical habitats (kelp beds)from critical habitats (kelp beds)
12
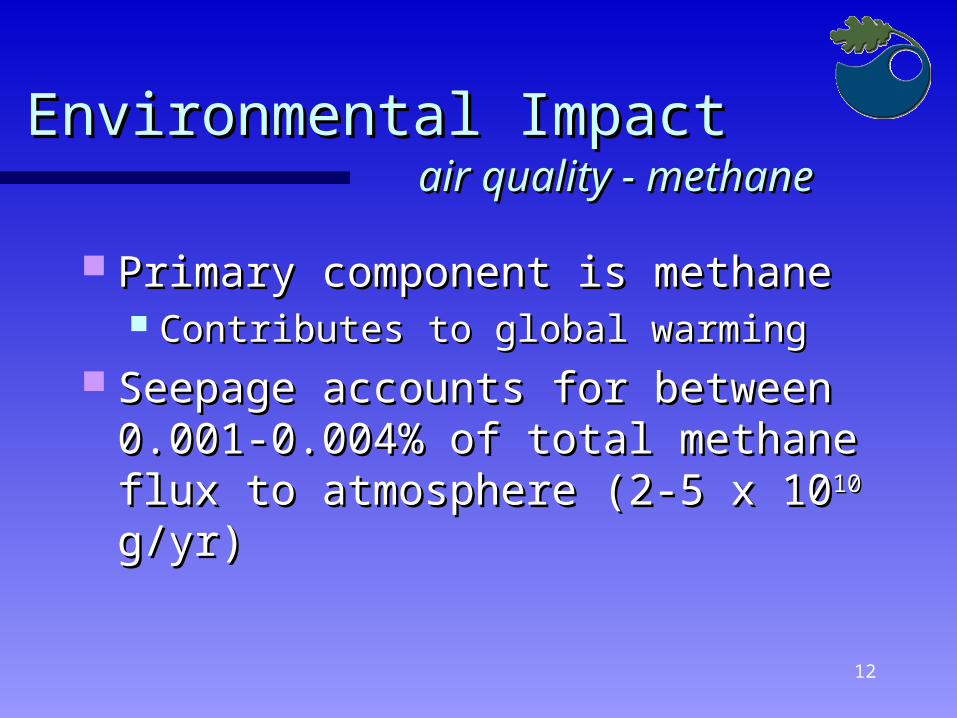
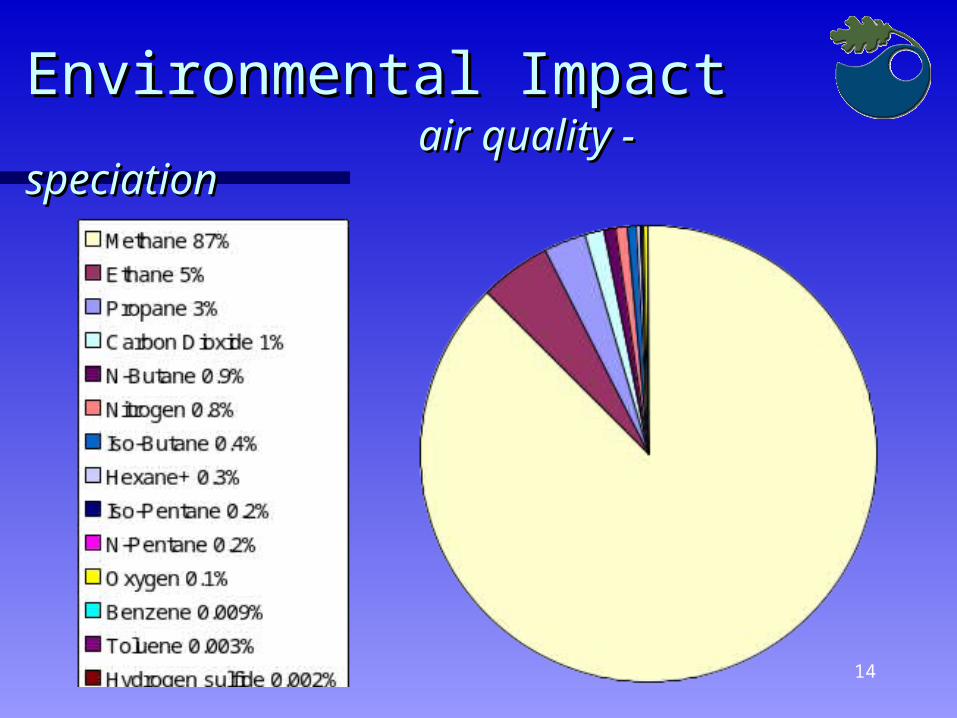
Environmental Impact Environmental Impact air quality - methaneair quality - methane
Primary component is methanePrimary component is methane Contributes to global warmingContributes to global warming
Seepage accounts for between Seepage accounts for between 0.001-0.004% of total methane 0.001-0.004% of total methane flux to atmosphere (2-5 x 10flux to atmosphere (2-5 x 101010 g/yr) g/yr)
13
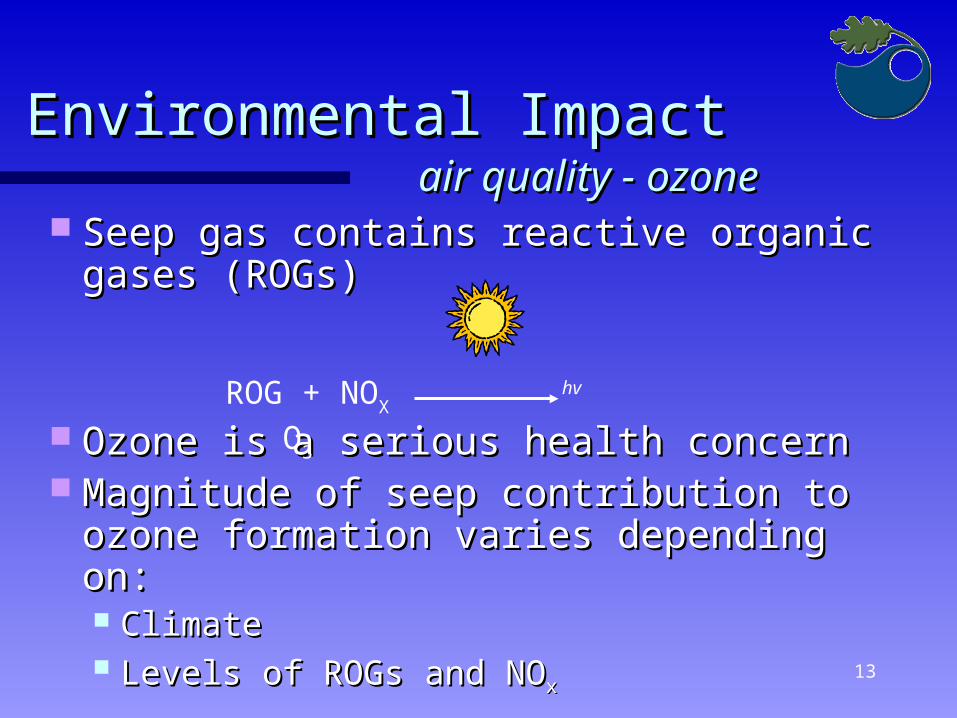
Seep gas contains reactive organic Seep gas contains reactive organic gases (ROGs)gases (ROGs)
Ozone is a serious health concernOzone is a serious health concern Magnitude of seep contribution to Magnitude of seep contribution to
ozone formation varies depending on: ozone formation varies depending on: ClimateClimate Levels of ROGs and NOLevels of ROGs and NOxx
Environmental Impact Environmental Impact air quality - ozoneair quality - ozone
ROG + NOX hv O3
14
Environmental Impact Environmental Impact air quality - air quality -
speciationspeciation
15
Environmental Impact Environmental Impact ozone production ozone production
modelmodel
Relates seep gas emissions to Relates seep gas emissions to ozone formation (reactivity)ozone formation (reactivity)
Estimates the change in ozone Estimates the change in ozone associated with seep gas captureassociated with seep gas capture
Results input to health benefit Results input to health benefit modelmodel Monetizes benefits of improved air Monetizes benefits of improved air
quality from seep tents installationquality from seep tents installation
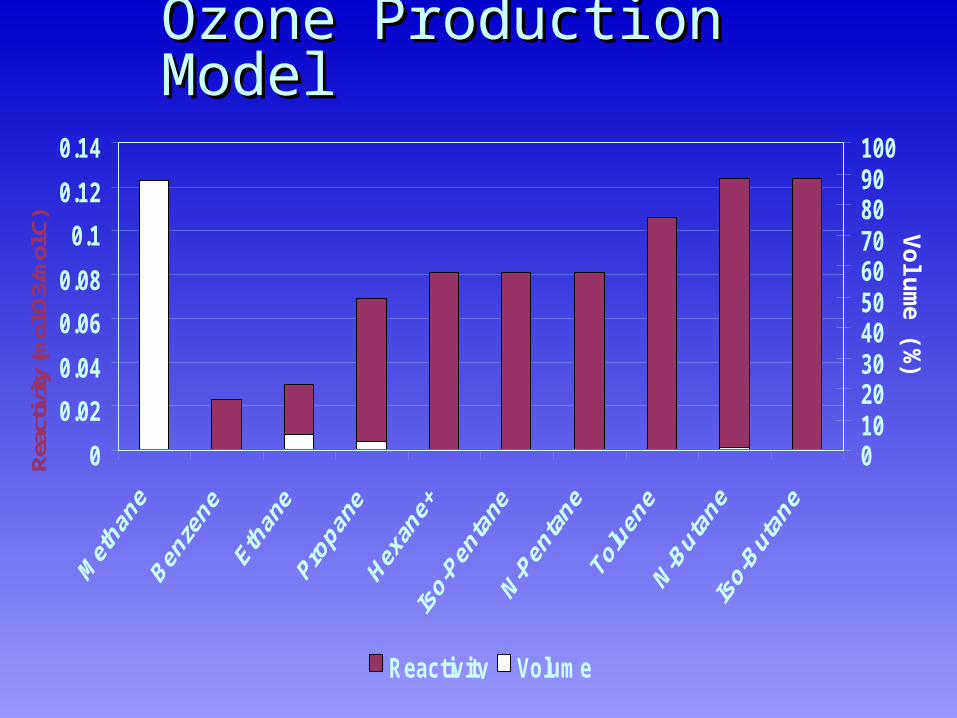
Ozone Production Ozone Production ModelModel
0
0.02
0.04
0.06
0.08
0.1
0.12
0.14
Reac
tivity
(mol
O3/
mol
C)
0102030405060708090100
Reactivity Volume
Vo
lum
e (%)
17
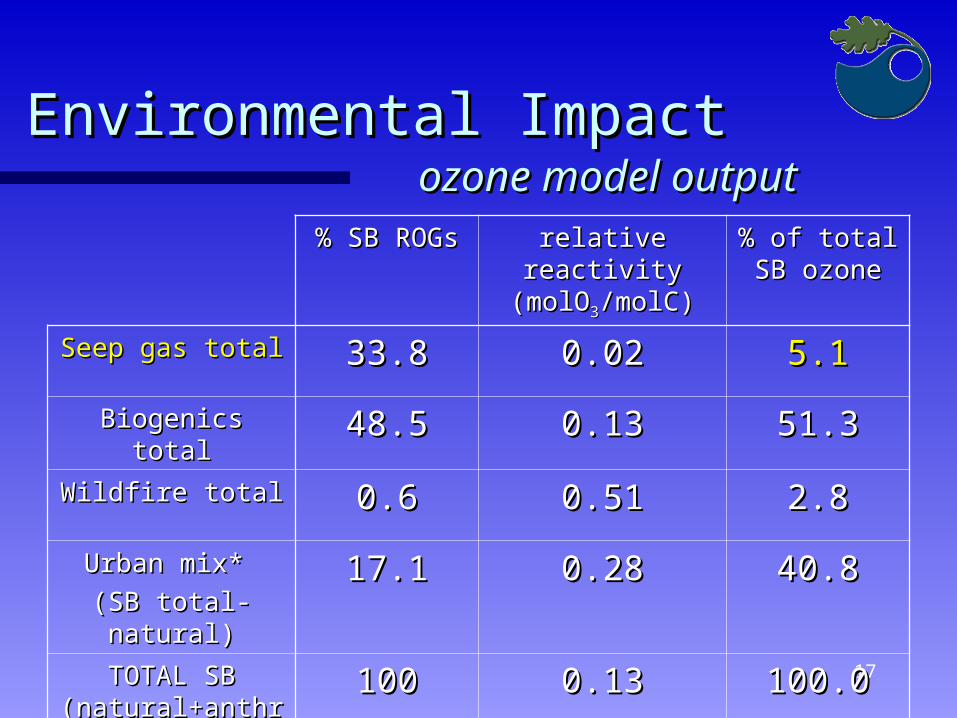
Environmental Impact Environmental Impact ozone model outputozone model output% SB ROGs% SB ROGs relative relative
reactivity reactivity (molO(molO33/molC)/molC)
% of total % of total SB ozoneSB ozone
Seep gas totalSeep gas total 33.833.8 0.020.02 5.15.1Biogenics totalBiogenics total 48.548.5 0.130.13 51.351.3Wildfire totalWildfire total 0.60.6 0.510.51 2.82.8Urban mix* Urban mix*
(SB total-(SB total-natural)natural)
17.117.1 0.280.28 40.840.8
TOTAL SB TOTAL SB (natural+anthro)(natural+anthro)
100100 0.130.13 100.0100.0
18
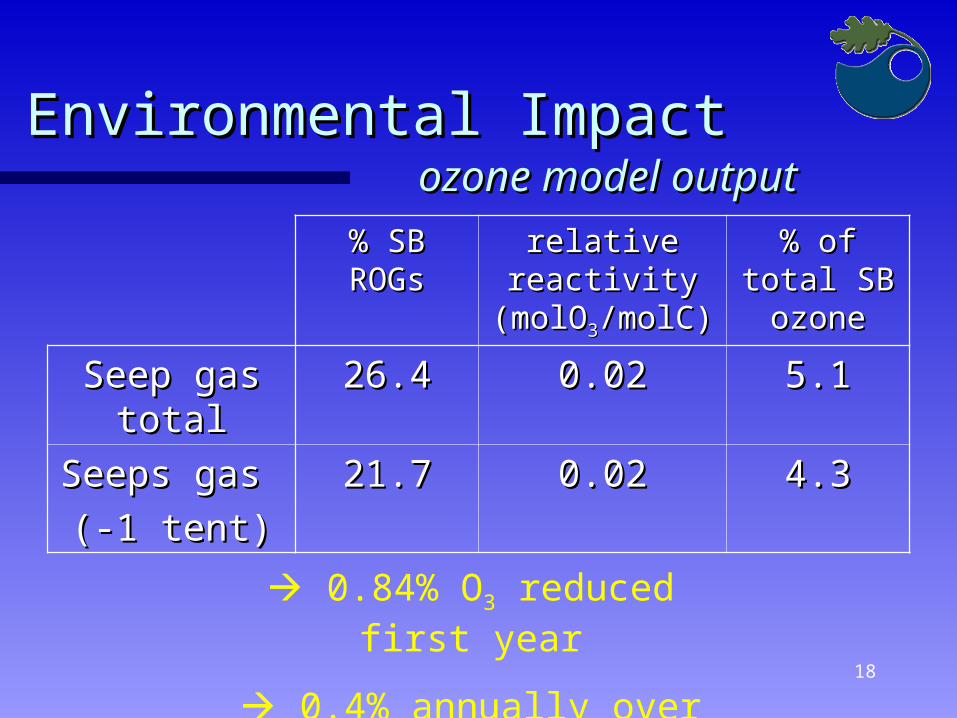
Environmental Impact Environmental Impact ozone model outputozone model output
% SB % SB ROGsROGs
relative relative reactivity reactivity
(molO(molO33/molC)/molC)
% of total % of total SB ozoneSB ozone
Seep gas Seep gas totaltotal
26.426.4 0.020.02 5.15.1
Seeps gas Seeps gas
(-1 tent)(-1 tent)21.721.7 0.020.02 4.34.3
0.84% O3 reduced first year
0.4% annually over 20 years
19
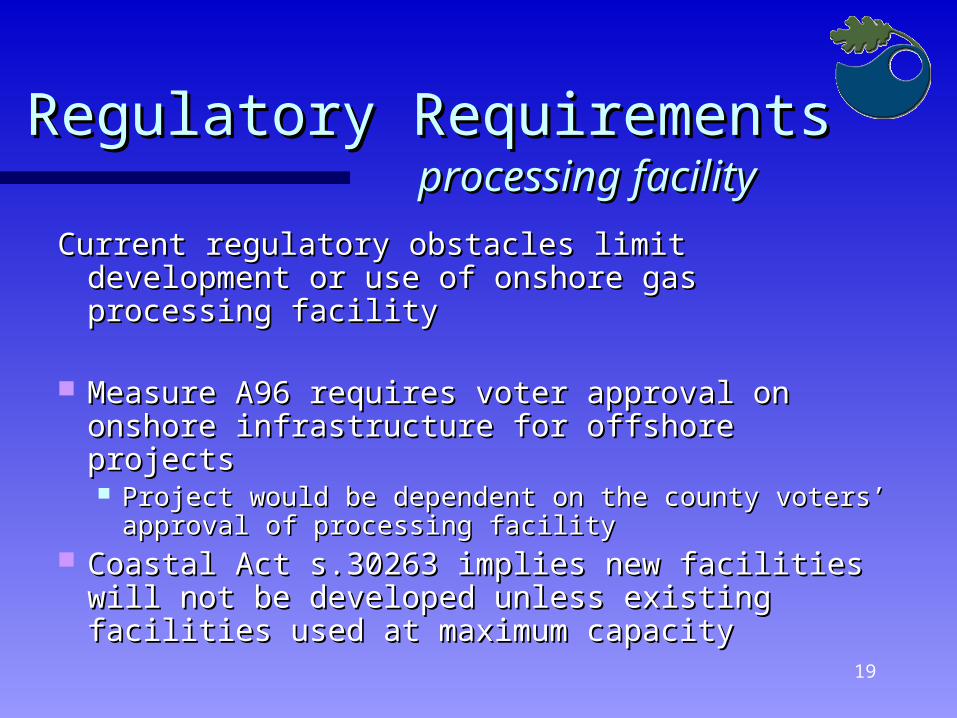
Regulatory Requirements Regulatory Requirements processing facilityprocessing facility
Current regulatory obstacles limit development Current regulatory obstacles limit development or use of onshore gas processing facilityor use of onshore gas processing facility
Measure A96 requires voter approval on Measure A96 requires voter approval on onshore infrastructure for offshore projectsonshore infrastructure for offshore projects Project would be dependent on the county voters’ Project would be dependent on the county voters’
approval of processing facilityapproval of processing facility Coastal Act s.30263 implies new facilities will Coastal Act s.30263 implies new facilities will
not be developed unless existing facilities not be developed unless existing facilities used at maximum capacityused at maximum capacity
20
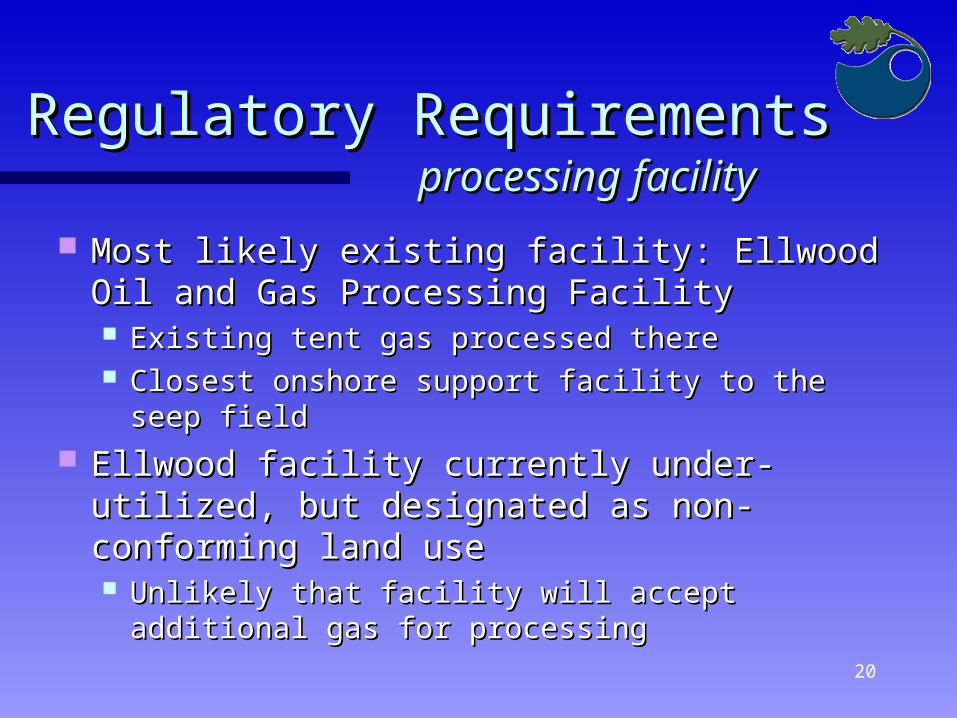
Regulatory Requirements Regulatory Requirements processing facilityprocessing facility
Most likely existing facility: Ellwood Oil and Most likely existing facility: Ellwood Oil and Gas Processing FacilityGas Processing Facility Existing tent gas processed thereExisting tent gas processed there Closest onshore support facility to the seep fieldClosest onshore support facility to the seep field
Ellwood facility currently under-utilized, but Ellwood facility currently under-utilized, but designated as non-conforming land use designated as non-conforming land use Unlikely that facility will accept additional gas for Unlikely that facility will accept additional gas for
processingprocessing
21
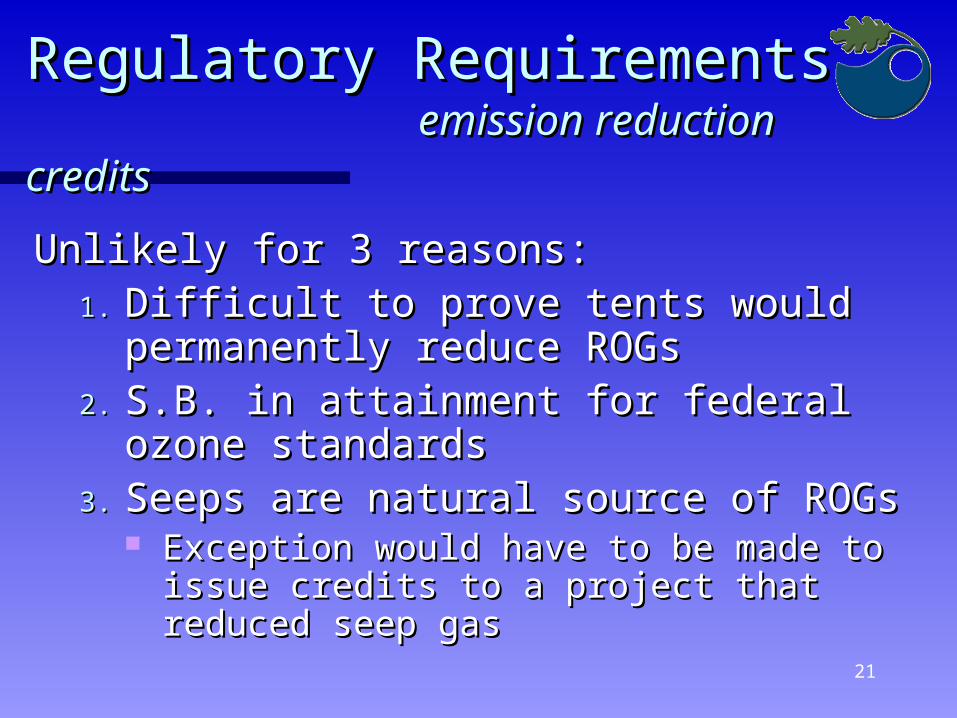
Regulatory Requirements Regulatory Requirements emission reduction emission reduction
creditscredits Unlikely for 3 reasons: Unlikely for 3 reasons:
1.1. Difficult to prove tents would Difficult to prove tents would permanently reduce ROGs permanently reduce ROGs
2.2. S.B. in attainment for federal ozone S.B. in attainment for federal ozone standardsstandards
3.3. Seeps are natural source of ROGsSeeps are natural source of ROGs Exception would have to be made to Exception would have to be made to
issue credits to a project that reduced issue credits to a project that reduced seep gasseep gas
22
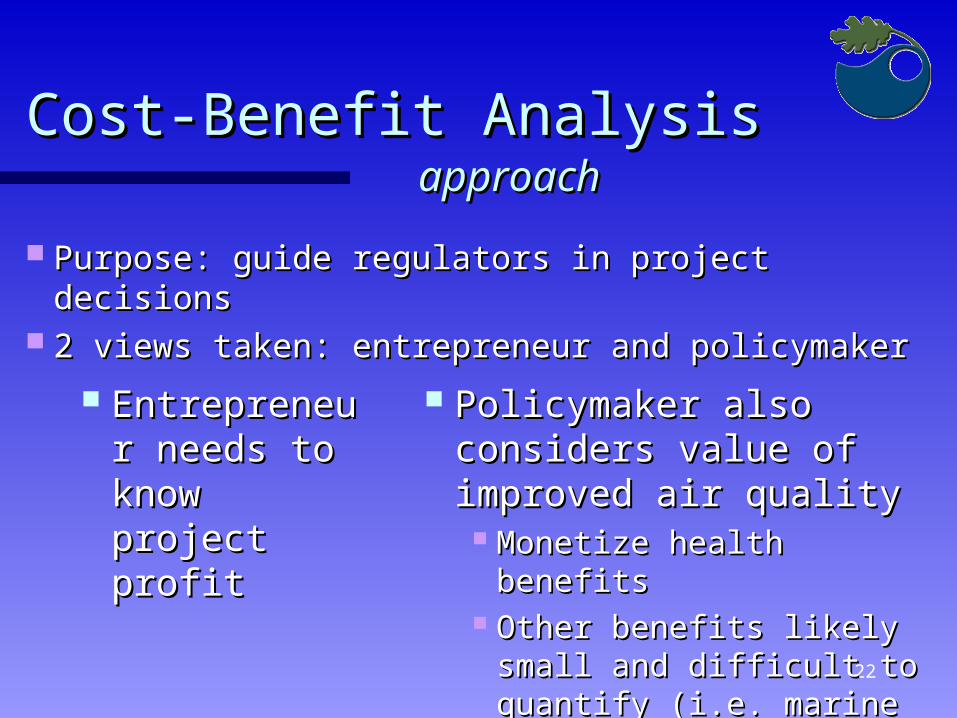
Cost-Benefit Analysis Cost-Benefit Analysis approachapproach
Purpose: guide regulators in project decisionsPurpose: guide regulators in project decisions 2 views taken: entrepreneur and policymaker2 views taken: entrepreneur and policymaker
EntrepreneuEntrepreneur needs to r needs to know project know project profitprofit
Policymaker also Policymaker also considers value of considers value of improved air qualityimproved air quality
Monetize health benefitsMonetize health benefits Other benefits likely small Other benefits likely small
and difficult to quantify and difficult to quantify (i.e. marine ecology)(i.e. marine ecology)
23
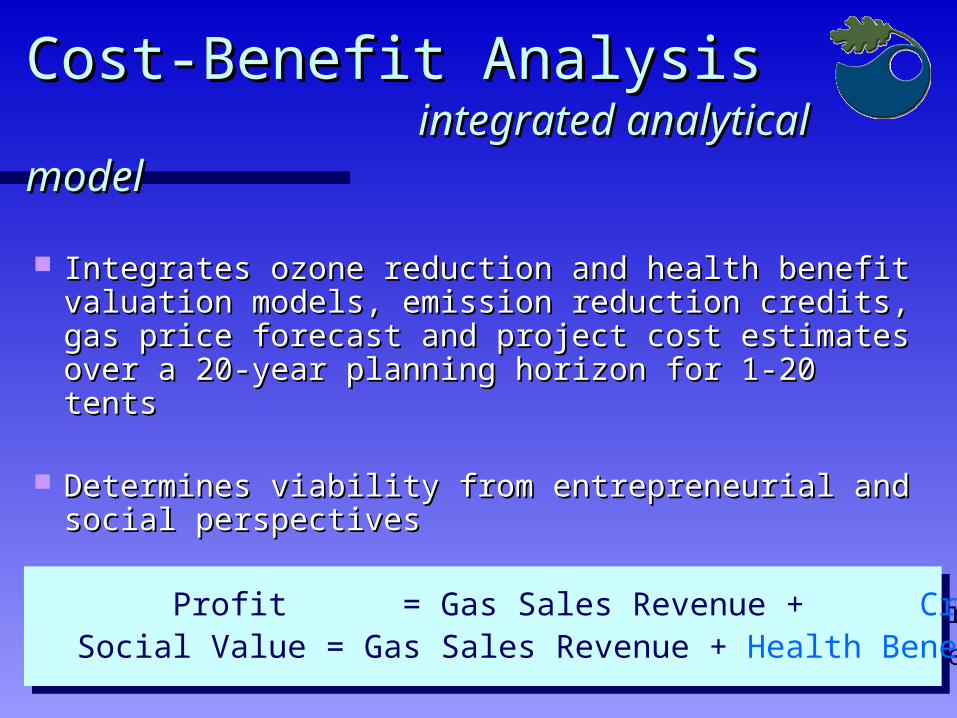
Profit = Gas Sales Revenue + Credits - CostsSocial Value = Gas Sales Revenue + Health Benefits - Costs
Profit = Gas Sales Revenue + Credits - CostsSocial Value = Gas Sales Revenue + Health Benefits - Costs
Cost-Benefit Analysis Cost-Benefit Analysis integrated analytical integrated analytical
modelmodel Integrates ozone reduction and health benefit Integrates ozone reduction and health benefit
valuation models, emission reduction credits, valuation models, emission reduction credits, gas price forecast and project cost estimates gas price forecast and project cost estimates over a 20-year planning horizon for 1-20 tentsover a 20-year planning horizon for 1-20 tents
Determines viability from entrepreneurial and Determines viability from entrepreneurial and social perspectivessocial perspectives
24
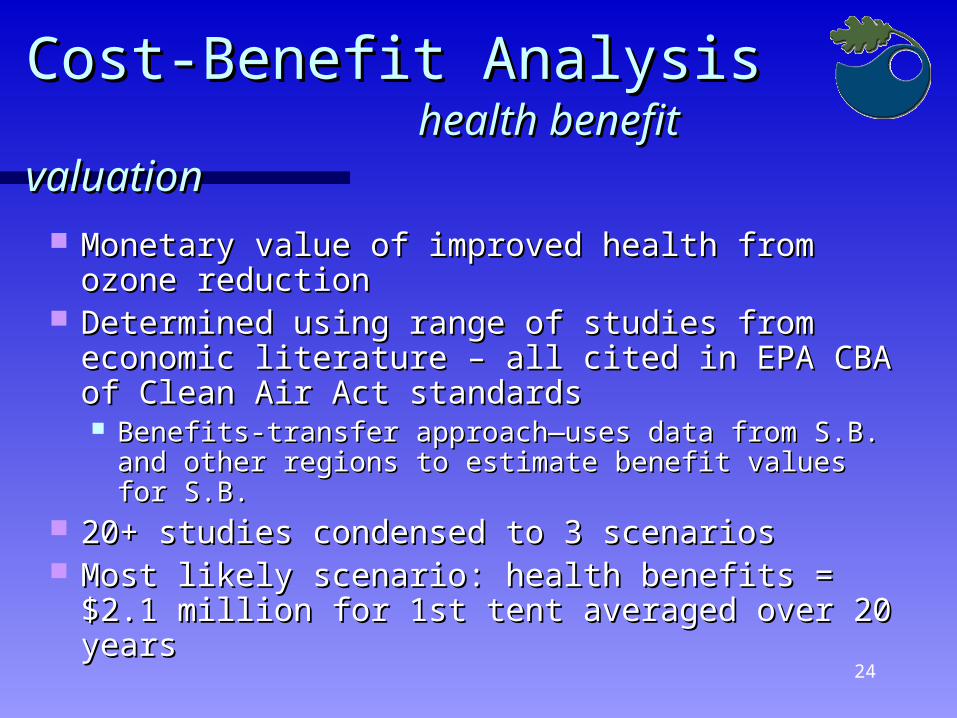
Cost-Benefit Analysis Cost-Benefit Analysis health benefit health benefit
valuationvaluation Monetary value of improved health from Monetary value of improved health from
ozone reductionozone reduction Determined using range of studies from Determined using range of studies from
economic literature – all cited in EPA CBA of economic literature – all cited in EPA CBA of Clean Air Act standardsClean Air Act standards Benefits-transfer approach—uses data from S.B. Benefits-transfer approach—uses data from S.B.
and other regions to estimate benefit values for and other regions to estimate benefit values for S.B.S.B.
20+ studies condensed to 3 scenarios20+ studies condensed to 3 scenarios Most likely scenario: health benefits = $2.1 Most likely scenario: health benefits = $2.1
million for 1st tent averaged over 20 yearsmillion for 1st tent averaged over 20 years
25
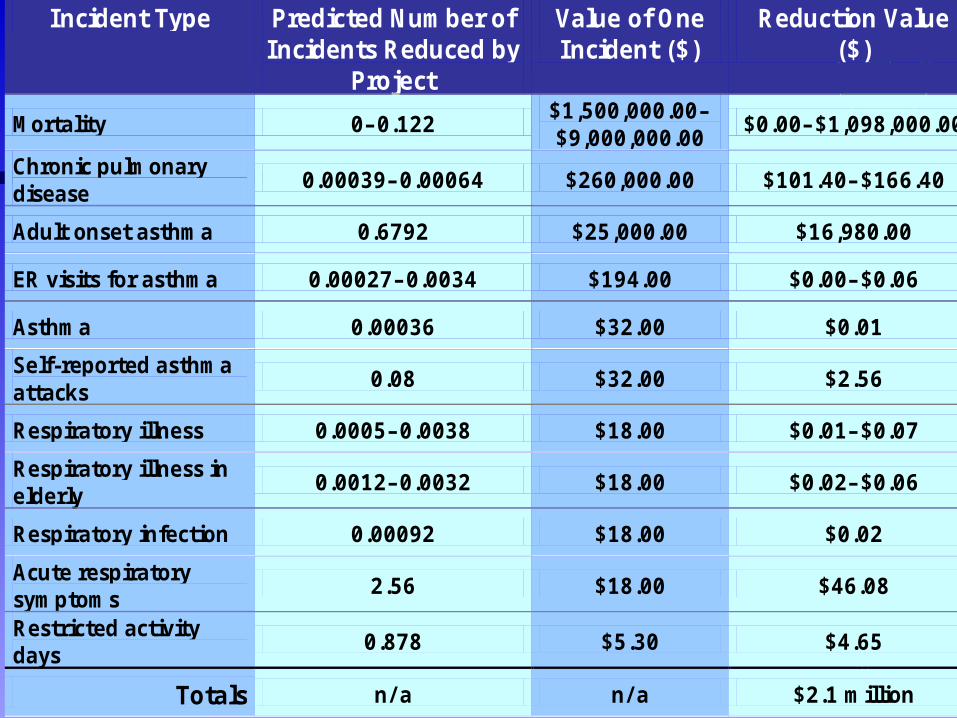
Incident Type Predicted Number of Incidents Reduced by
Project
Value of One Incident ($)
Reduction Value ($)
Mortality 0–0.122 $1,500,000.00–$9,000,000.00
$0.00–$1,098,000.00
Chronic pulmonary disease
0.00039–0.00064 $260,000.00 $101.40–$166.40
Adult onset asthma 0.6792 $25,000.00 $16,980.00
ER visits for asthma 0.00027–0.0034 $194.00 $0.00–$0.06
Asthma 0.00036 $32.00 $0.01
Self-reported asthma attacks
0.08 $32.00 $2.56
Respiratory illness 0.0005–0.0038 $18.00 $0.01–$0.07
Respiratory illness in elderly
0.0012–0.0032 $18.00 $0.02–$0.06
Respiratory infection 0.00092 $18.00 $0.02
Acute respiratory symptoms
2.56 $18.00 $46.08
Restricted activity days
0.878 $5.30 $4.65
Totals n/ a n/ a $2.1 million
26
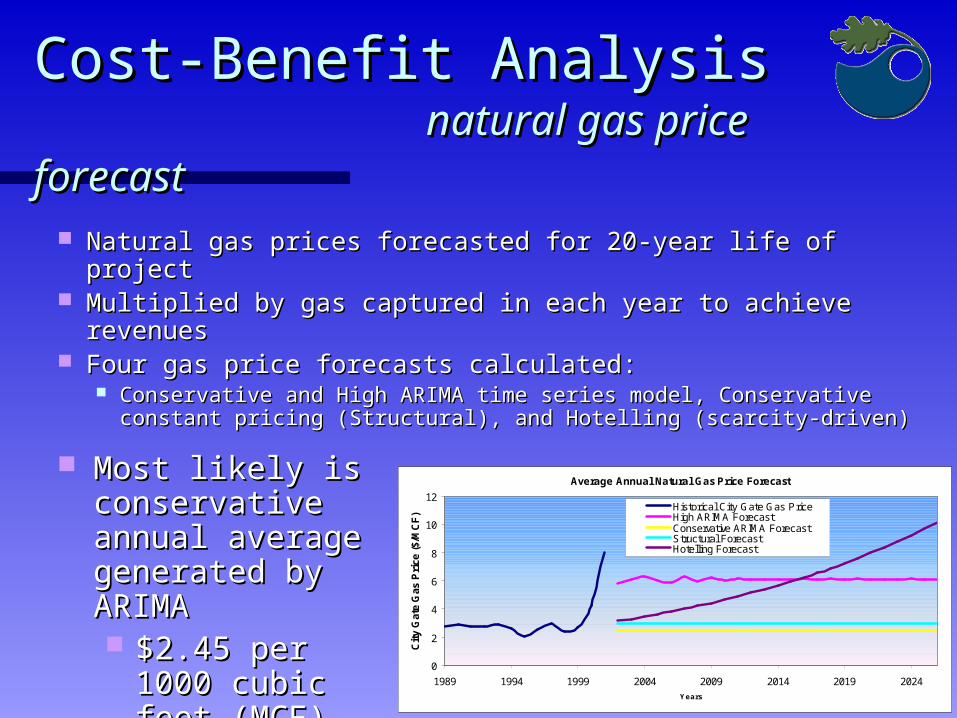
Cost-Benefit Analysis Cost-Benefit Analysis natural gas price natural gas price
forecastforecast Natural gas prices forecasted for 20-year life of projectNatural gas prices forecasted for 20-year life of project Multiplied by gas captured in each year to achieve Multiplied by gas captured in each year to achieve
revenuesrevenues Four gas price forecasts calculated: Four gas price forecasts calculated:
Conservative and High ARIMA time series model, Conservative Conservative and High ARIMA time series model, Conservative constant pricing (Structural), and Hotelling (scarcity-driven)constant pricing (Structural), and Hotelling (scarcity-driven)
Average Annual Natural Gas Price Forecast
0
2
4
6
8
10
12
1989 1994 1999 2004 2009 2014 2019 2024
Years
Cit
y G
ate
Gas
Pri
ce (
$/M
CF
)
Historical City Gate Gas PriceHigh ARIMA ForecastConservative ARIMA ForecastStructural ForecastHotelling Forecast
Most likely is Most likely is conservative conservative annual average annual average generated by generated by ARIMA ARIMA $2.45 per 1000 $2.45 per 1000
cubic feet cubic feet (MCF)(MCF)
27
Cost-Benefit Analysis Cost-Benefit Analysis emission reduction emission reduction
creditscredits Credits worth $5,000/ton ROGs Credits worth $5,000/ton ROGs
reducedreduced 80% transfer ratio: 1.2 tons ROGs 80% transfer ratio: 1.2 tons ROGs
captured for each 1 ton of creditscaptured for each 1 ton of credits Multiplied by amount of ROGs Multiplied by amount of ROGs
reduced by project scenario, then reduced by project scenario, then by transfer percentageby transfer percentage
Not included in most likely scenarioNot included in most likely scenario
28
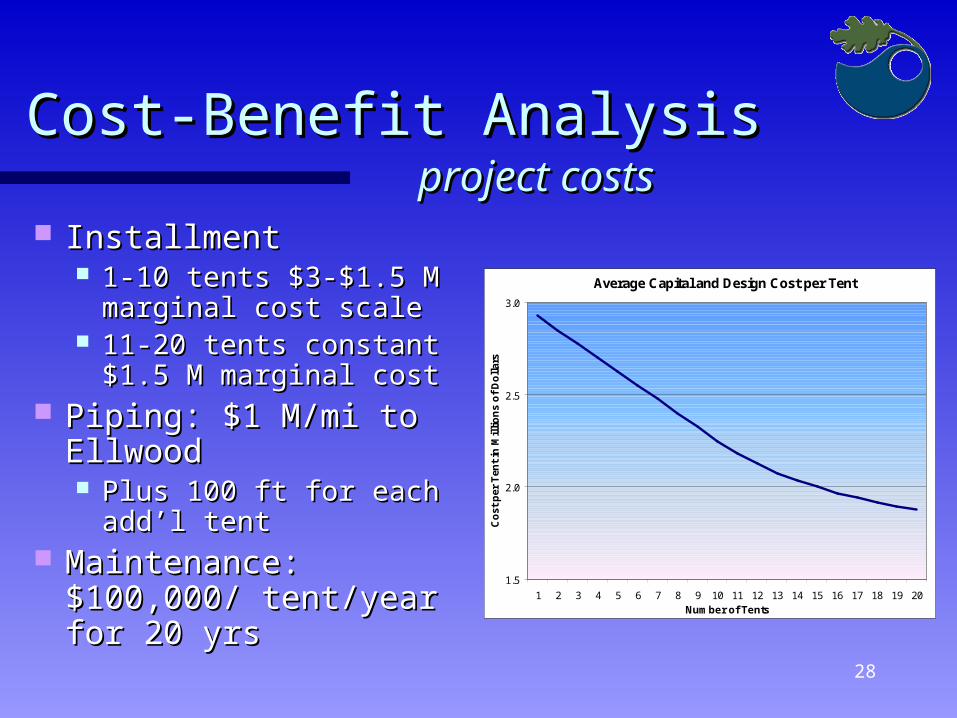
Cost-Benefit Analysis Cost-Benefit Analysis project costsproject costs
InstallmentInstallment 1-10 tents $3-$1.5 M 1-10 tents $3-$1.5 M
marginal cost scalemarginal cost scale 11-20 tents constant 11-20 tents constant
$1.5 M marginal cost$1.5 M marginal cost Piping: $1 M/mi to Piping: $1 M/mi to
EllwoodEllwood Plus 100 ft for each Plus 100 ft for each
add’l tentadd’l tent Maintenance: Maintenance:
$100,000/ tent/year for $100,000/ tent/year for 20 yrs20 yrs
Average Capital and Design Cost per Tent
1.5
2.0
2.5
3.0
1 2 3 4 5 6 7 8 9 10 11 12 13 14 15 16 17 18 19 20Number of Tents
Co
st p
er T
ent
in M
illi
on
s o
f D
oll
ars
29
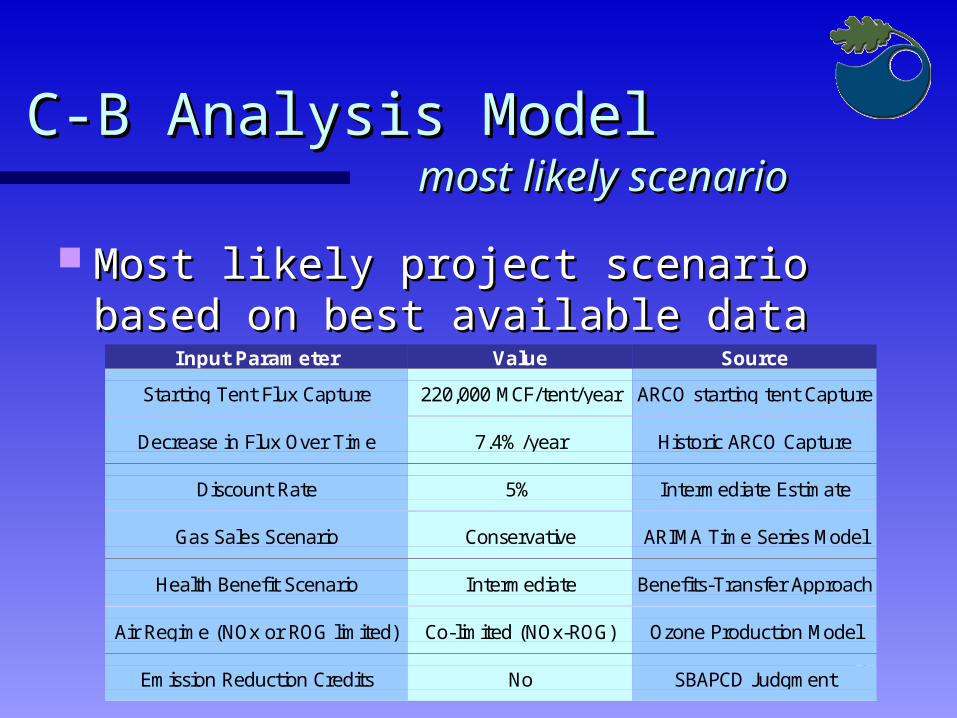
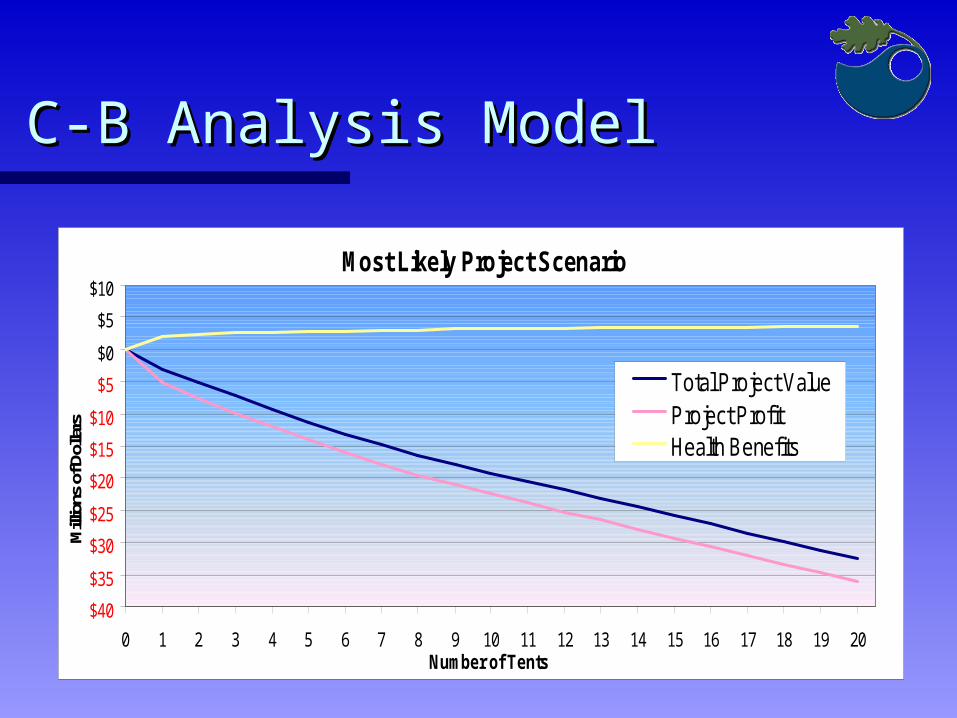
C-B Analysis Model C-B Analysis Model most likely scenariomost likely scenario
Most likely project scenario based on Most likely project scenario based on best available databest available data
Input Parameter Value Source
Starting Tent Flux Capture 220,000 MCF/tent/year ARCO starting tent Capture
Decrease in Flux Over Time 7.4%/year Historic ARCO Capture
Discount Rate 5% Intermediate Estimate
Gas Sales Scenario Conservative ARIMA Time Series Model
Health Benefit Scenario Intermediate Benefits-Transfer Approach
Air Regime (NOx or ROG limited) Co-limited (NOx-ROG) Ozone Production Model
Emission Reduction Credits No SBAPCD Judgment
30
C-B Analysis Model C-B Analysis Model
Most Likely Project Scenario
$40
$35
$30
$25
$20
$15
$10
$5
$0
$5
$10
0 1 2 3 4 5 6 7 8 9 10 11 12 13 14 15 16 17 18 19 20Number of Tents
Mill
ions
of D
olla
rs
Total Project ValueProject ProfitHealth Benefits
31
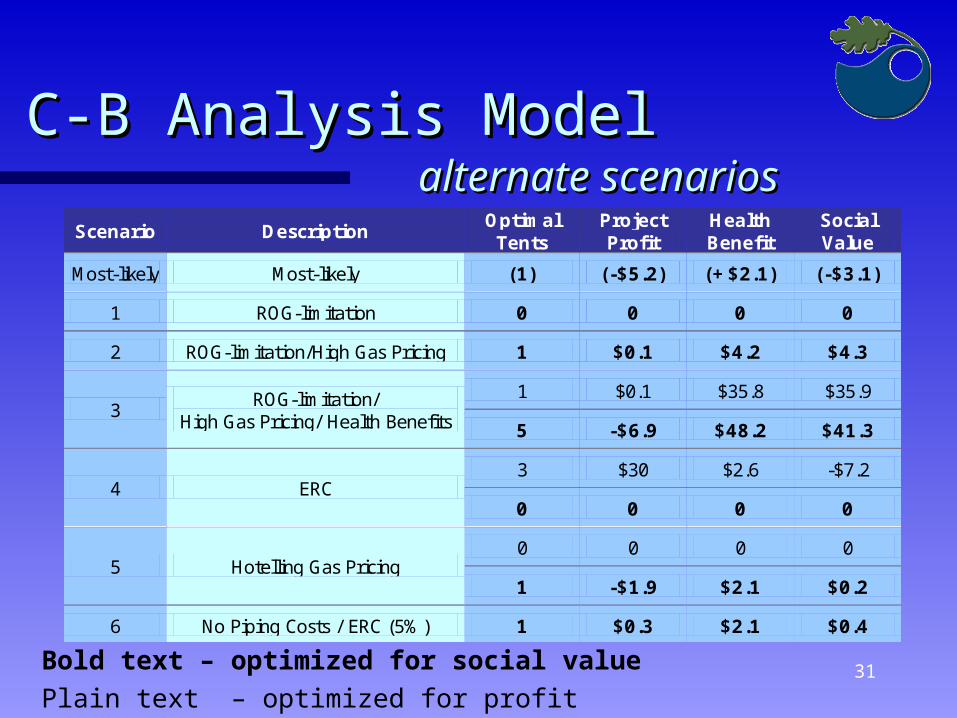
C-B Analysis Model C-B Analysis Model alternate scenariosalternate scenarios
Bold text – optimized for social valuePlain text – optimized for profit
Scenario Description Optimal Tents
Project Profit
Health Benefit
Social Value
Most-likely Most-likely (1) (-$5.2) (+$2.1) (-$3.1)
1 ROG-limitation 0 0 0 0
2 ROG-limitation/High Gas Pricing 1 $0.1 $4.2 $4.3
1 $0.1 $35.8 $35.9 3
ROG-limitation/ High Gas Pricing/ Health Benefits 5 -$6.9 $48.2 $41.3
3 $30 $2.6 -$7.2 4 ERC
0 0 0 0
0 0 0 0 5 Hotelling Gas Pricing
1 -$1.9 $2.1 $0.2
6 No Piping Costs / ERC (5%) 1 $0.3 $2.1 $0.4
32
C-B Analysis Model C-B Analysis Model resultsresults
Under likely project conditions, Under likely project conditions, installing new seep tents NOT practical installing new seep tents NOT practical from social or entrepreneurial viewpointfrom social or entrepreneurial viewpoint
Business’ point of view: project is not Business’ point of view: project is not attractive, unless unlikely conditions:attractive, unless unlikely conditions: Emission reduction credits are issuedEmission reduction credits are issued High market gas pricing conditions are High market gas pricing conditions are
sustainedsustained Society’s point of view: costs to private Society’s point of view: costs to private
firm outweigh society’s benefit firm outweigh society’s benefit
33
C-B Analysis Model C-B Analysis Model results: creditsresults: credits
If health value is greater or project costs are If health value is greater or project costs are lower, ERCs could be issued to compensate an lower, ERCs could be issued to compensate an entrepreneur for their losses on the projectentrepreneur for their losses on the project
Example: Scenario 6 Example: Scenario 6 project loses $1.7 million without creditsproject loses $1.7 million without credits For a credit of 5% of this project’s ROG reduction For a credit of 5% of this project’s ROG reduction
the owners of the tents compensated $2 million the owners of the tents compensated $2 million (industry standard 10% rate of return)(industry standard 10% rate of return)
policymaker could create incentive to produce $2.1 policymaker could create incentive to produce $2.1 million air quality improvement for $2 million in million air quality improvement for $2 million in ERCsERCs
34
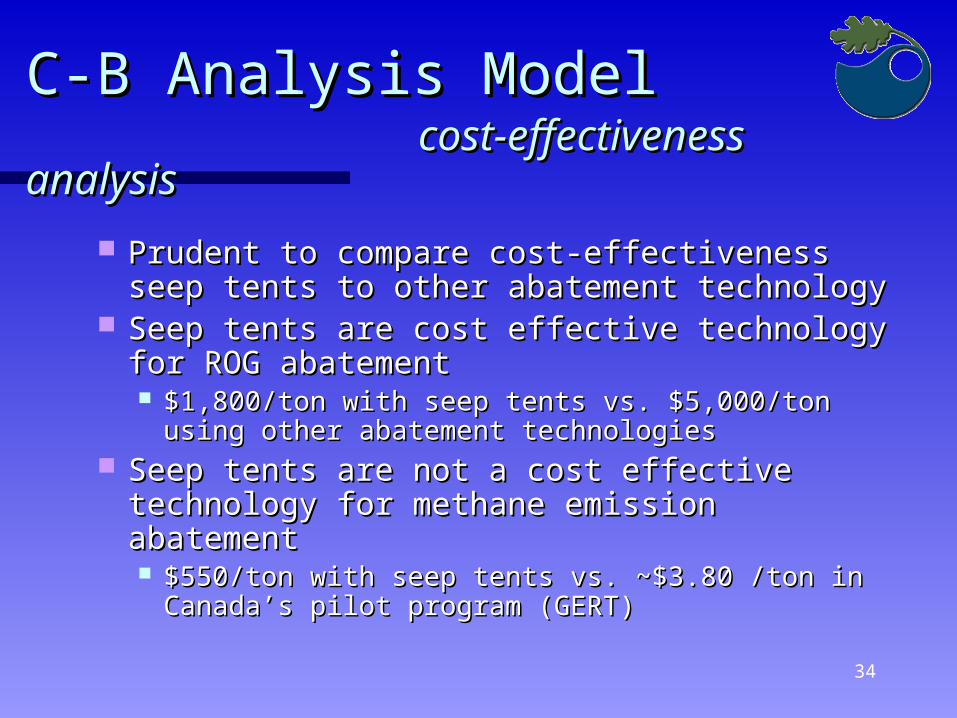
C-B Analysis Model C-B Analysis Model cost-effectiveness cost-effectiveness
analysisanalysis
Prudent to compare cost-effectiveness seep Prudent to compare cost-effectiveness seep tents to other abatement technologytents to other abatement technology
Seep tents are cost effective technology for Seep tents are cost effective technology for ROG abatementROG abatement $1,800/ton with seep tents vs. $5,000/ton using $1,800/ton with seep tents vs. $5,000/ton using
other abatement technologiesother abatement technologies Seep tents are not a cost effective Seep tents are not a cost effective
technology for methane emission technology for methane emission abatement abatement $550/ton with seep tents vs. ~$3.80 /ton in $550/ton with seep tents vs. ~$3.80 /ton in
Canada’s pilot program (GERT)Canada’s pilot program (GERT)
35
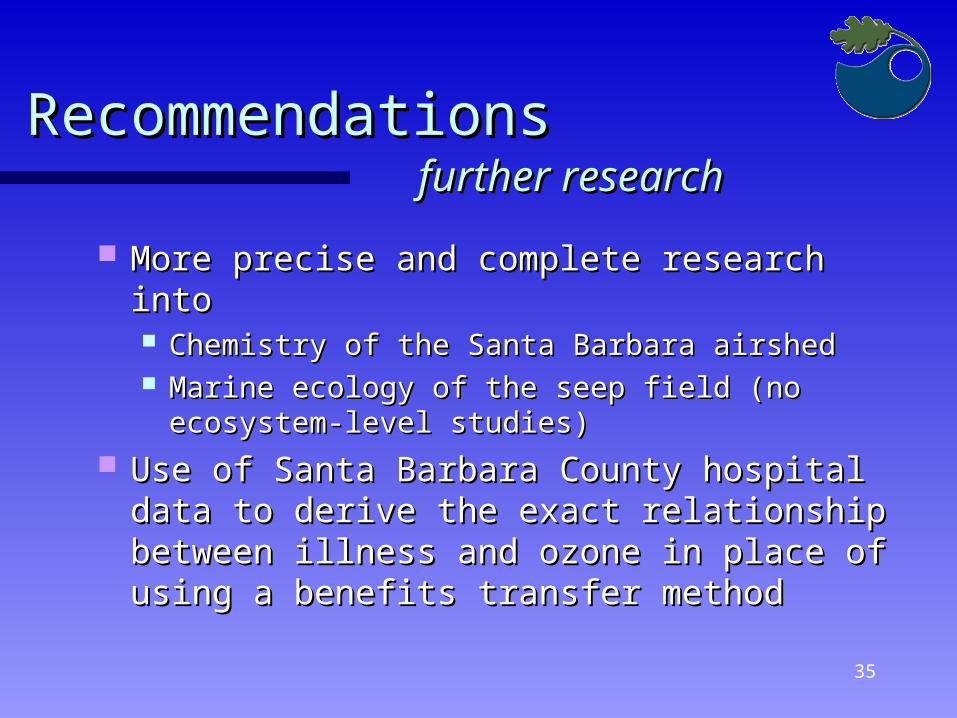
Recommendations Recommendations further researchfurther research
More precise and complete research into More precise and complete research into Chemistry of the Santa Barbara airshedChemistry of the Santa Barbara airshed Marine ecology of the seep field (no Marine ecology of the seep field (no
ecosystem-level studies)ecosystem-level studies) Use of Santa Barbara County hospital Use of Santa Barbara County hospital
data to derive the exact relationship data to derive the exact relationship between illness and ozone in place of between illness and ozone in place of using a benefits transfer methodusing a benefits transfer method
36
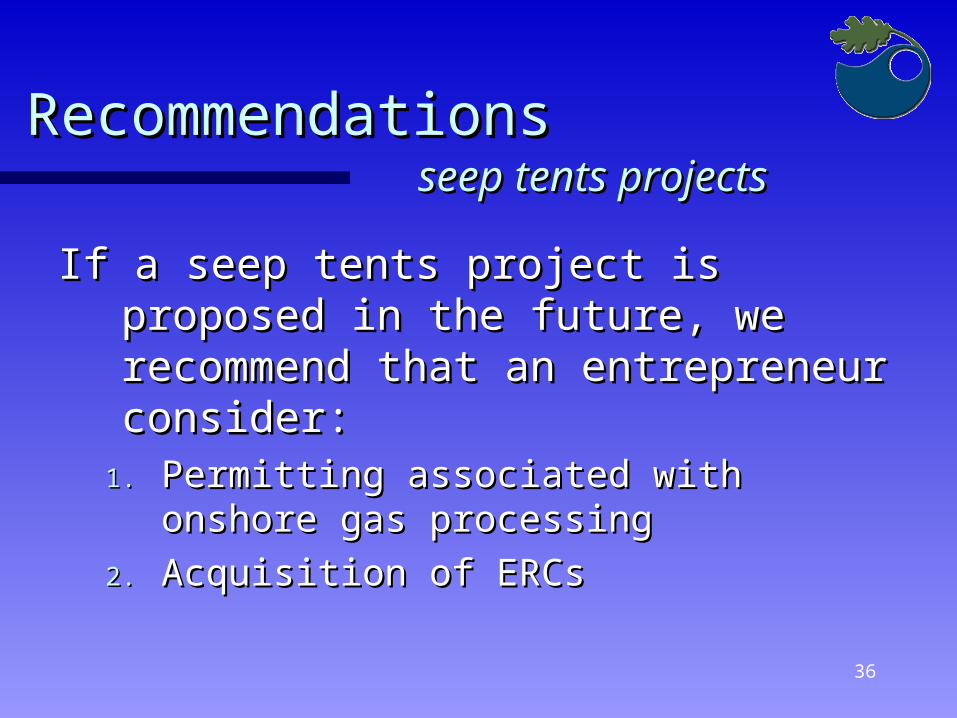
Recommendations Recommendations seep tents projectsseep tents projects
If a seep tents project is proposed in If a seep tents project is proposed in the future, we recommend that an the future, we recommend that an entrepreneur consider: entrepreneur consider:
1.1. Permitting associated with onshore Permitting associated with onshore gas processinggas processing
2.2. Acquisition of ERCsAcquisition of ERCs
37
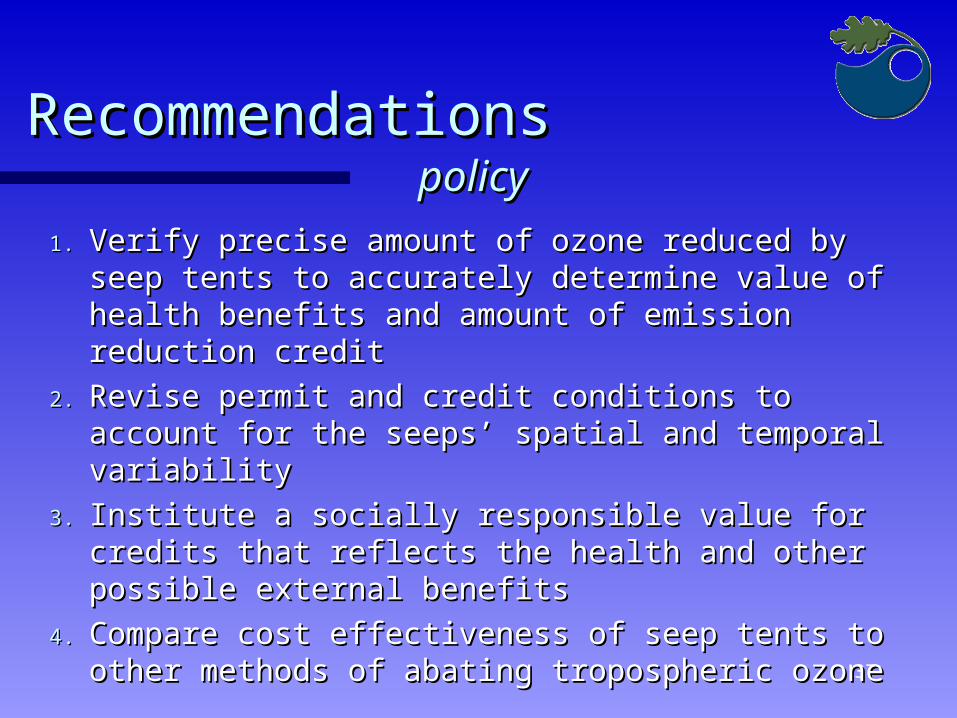
Recommendations Recommendations policypolicy
1.1. Verify precise amount of ozone reduced by Verify precise amount of ozone reduced by seep tents to accurately determine value of seep tents to accurately determine value of health benefits and amount of emission health benefits and amount of emission reduction creditreduction credit
2.2. Revise permit and credit conditions to account Revise permit and credit conditions to account for the seeps’ spatial and temporal variabilityfor the seeps’ spatial and temporal variability
3.3. Institute a socially responsible value for Institute a socially responsible value for credits that reflects the health and other credits that reflects the health and other possible external benefits possible external benefits
4.4. Compare cost effectiveness of seep tents to Compare cost effectiveness of seep tents to other methods of abating tropospheric ozoneother methods of abating tropospheric ozone
38
AcknowledgementsAcknowledgements Bruce Luyendyk, Jordan Bruce Luyendyk, Jordan
Clark, Libe Washburn, Clark, Libe Washburn, James Boles James Boles (UCSB (UCSB Hydrocarbon Seeps Research Hydrocarbon Seeps Research Group)Group)
Tom Murphy, Doug Allard Tom Murphy, Doug Allard Patricia Holden, Mike Patricia Holden, Mike Edwards, Steve Sterner, Edwards, Steve Sterner, Michelle Pasini, and Jim Michelle Pasini, and Jim Fredrickson, Sally Fredrickson, Sally HolbrookHolbrook
Our advisors: Our advisors: Chris Costello Chris Costello and Natalie and Natalie MahowaldMahowald
Spring quarter Spring quarter advisor Mel advisor Mel WillisWillis
Peter Cantle Peter Cantle (SBCAPCD)(SBCAPCD)

Questions?Questions?