Seed System Security Assessment in West Nile Sub region · Seed System Security Assessment in West...
69
Seed System Security Assessment in West Nile Sub region April 2015 Integrated Seed Sector Development Programme Uganda
Transcript of Seed System Security Assessment in West Nile Sub region · Seed System Security Assessment in West...

Seed System Security Assessment in West Nile Sub region
April 2015
Integrated Seed Sector Development Programme Uganda

Seed System Security Assessment in
West Nile Sub-region
Integrated Seed Sector Development Programme In Uganda
Recommended referencing: ISSD Uganda, 2015. Seed System Security
Assessment in West Nile Sub-region. Integrated Seed Sector Development
Programme in Uganda, Wageningen UR Uganda. Kampala
Participating partners: FAO (Nairobi), Danish Refugee Council, ZOA, NilePro Trust
Limited and Local Governments of Arua, Koboko, Adjumani and Moyo District

TABLE OF CONTENTS
LIST OF ACRONYMS.............................................................................................. i
ACKOWLEDGEMENT ........................................................................................... ii
THE ASSESSMENT TEAM ..................................................................................... ii
EXECUTIVE SUMMARY ....................................................................................... iii
1.0 INTRODUCTION .......................................................................................... 1
1.1 BACKGROUND TO THE SEED SECURITY ASSESSMENT ...................................................................................... 1 1.2 ASSESSMENT OBJECTIVES ................................................................................................................................ 1 1.3 ASSESSMENT METHODOLOGY .......................................................................................................................... 2 1.4 ASSESSMENT LIMITATIONS .............................................................................................................................. 5 1.5 REPORT OUTLINE ............................................................................................................................................. 5
2.0 SEED SECURITY CONCEPTUAL FRAMEWORK .............................................. 6
2.1 DEFINITION OF KEY CONCEPTS ........................................................................................................................ 6 2.2 THE ELEMENTS OF SEED SECURITY CONCEPTUAL FRAMEWORK ..................................................................... 7
3.0 DEMOGRAPHIC AND LIVELIHOOD CHARACTERISTICS ................................. 9
3.1 HOUSEHOLD DEMOGRAPHIC CHARACTERISTICS .............................................................................................. 9 3.2 KEY ECONOMIC ACTIVITIES........................................................................................................................... 10 3.3 SOURCES OF HOUSEHOLD INCOME ................................................................................................................. 10 3.4 SAVINGS AND ACCESS TO CREDIT .................................................................................................................. 11 3.5 FOOD CONSUMPTION AND NUTRITION ................................................................................................... 11
4.0 CROP PRODUCTION PRACTICES ................................................................ 13
4.1 MAJOR CROPS GROWN ........................................................................................................................... 13 4.2 AREA CULTIVATED PER CROP ........................................................................................................................ 15 4.3 CROP CULTIVATION PRACTICES ..................................................................................................................... 16 4.4 TRENDS IN AGRICULTURAL SEASONS ............................................................................................................ 18
5.0 SEED SECURITY AT HOUSEHOLD AND COMMUNITY LEVELS ..................... 20
5.1 SEED AVAILABILITY ...................................................................................................................................... 20 5.2 SEED ACCESS ................................................................................................................................................. 22 5.3 SEED QUALITY ............................................................................................................................................... 26 5.4 VARIETAL SUITABILITY ................................................................................................................................. 27 5.5 RESILIENCE OF THE SEED SYSTEM ................................................................................................................ 29 5.6 SEED INSECURITY PERCEPTIONS AND OPTIONS FOR IMPROVEMENT .............................................................. 31 5.7 SEED AID ...................................................................................................................................................... 32
6.0 COMMERCIAL SEED SUPPLY AND DEMAND .............................................. 36
6.1 LOCAL MARKET SEED SUPPLY AND DEMAND................................................................................................ 36 6.2 AGRO-INPUT DEALERS ................................................................................................................................... 39 6.3 SEED PRODUCER GROUPS .............................................................................................................................. 42
7.0 CONCLUSION AND RECOMMENDATIONS ................................................. 46
7.1 SUMMARY OF FINDINGS AND CONCLUSION ................................................................................................... 46 7.2 RECOMMENDATIONS ...................................................................................................................................... 48

ANNEX 1a: LIST OF KEY INFORMANTS INTERVIEWED ........................................ 50
ANNEX 1b: LIST OF GROUPS MET FOR FOCUS GROUP DISCUSSIONS ................. 51
ANNEX 2: CHANGES IN CROP TRENDS OVER PAST FIVE YEARS .......................... 51
ANNEX 3: VARIETIES OF MAIN CROPS GROWN BY DISTRICT .............................. 55

i
LIST OF ACRONYMS
AEZ Agro-Ecological Zone A-I Agro- input CBO Community Based Organization CBS Community Based Seed CEFORD Community Empowerment for Rural Development CMR Crop Multiplication Ratio DAO District Agricultural Officer DFA District Farmers’ Association DRC Danish Refugee Council FAO Food and Agriculture Organization of the United Nations FGD Focus Group Discussion FS Foundation Seed FSS Formal Seed System GAP Good Agronomic Practices HH Households HHS Household Survey ISSD Integrated Seed Sector Development Program KI Key informants KII Key Informant Interviews LC Local Council LG Local Government LMS Local Market Survey LSB Local Seed Business M&E Monitoring and Evaluation MAAIF Ministry of Agriculture, Animal Industry and Fisheries Mt Metric tons NAADS National Agricultural Advisory Services NaCRRI National Crop Resources Research Institute NARO National Agricultural Research Organization NaSARRI National Semi-Arid Resources Research Institute NASECO Nalweyo Seed Company NGO Non-Government Organisation OPM Office of the Prime Minister OSS Own Saved Seed OWC Operation Wealth Creation QDS Quality Declared Seed SAA Seed Aid Actors SACCOs Saving and Credit Cooperatives SNS Social Network Seed SSA Seed Security Assessment SSCF Seed Security Conceptual Framework UGX Uganda Shilling UNADA Uganda National Agro-input Dealers Association UNHCR United Nations High Commission for Refugees UPDF Uganda People’s Defence Forces VSLA Village Saving and Loan Association ZARDI Zonal Agricultural Research and Development Institute

ii
ACKOWLEDGEMENT We appreciate the help and support provided by local government leaders, namely the district and sub-county staff, local councilors as well as the opinion leaders in the study districts, who took time off their busy schedules to willingly support and provide the team with their opinions and suggestions. Appreciation also goes to the key informants, focus group participants and farmers who willingly responded to the various questions put foward during the assessment. Without their cooperation and support, generation of the data used in this report would have been impossible. Most notable are the 344 households members, 25 grain/seed traders and agro-input dealers, 20 key informants, and all the 143 participants at the 10 FGD who provided both primary and secondary information relevant for this report. We take this opportunity to commend the staff of various organizations within the sub-region, with whom we shared various tasks, experiences and reflections during the assessment exercise.
THE ASSESSMENT TEAM
The Seed Security Assessment was conducted by a team of experts in the fields of agriculture, social work, agricultural extension, information technology and monitoring and evaluation. The team was led by Roland Mugumya, the ISSD Monitoring, Evaluation and Communications Coordinator, who provided the overall logistics and ensured a smooth administration of the assessment. Joseph Okidi (the FAO Regional Seed System Specialist based in Nairobi) who facilitated the assessment with support from Polycarp Odoyo Omondi from Somali Aid. The consultant (Peter Wathum ) put together data and information collected and prepared the report.
No Name Organization Designation/field of expertise
Role in SSA
1 Roland Mugumya ISSD M&E and Communications Coordinator
Team Leader
2 Joseph Okidi FAO (Nairobi) Regional Seed System Officer Facilitator
3 Odoyo P. Omondi (Somali Aid, Mogadishu) Agriculture Facilitator
4 Peter Wathum Freelance Consultant Agriculture, M&E Consultant
5 Yashin Angua NilePro Trust Limited Project Manager/Agriculturalist Partner
6 Emilly Drijaru Danish Refugee Council Agriculture Partner
7 Gloria Adrole Drajiru ZOA Agro Skills for You Agriculture Partner
8 Modesto Anguzu Osoga
Former NAADS Officer at Midigo Sub-county-Yumbe District
Agriculture Enumerator
9 Marta Lalia FFS Facilitator- Andevuku Farmers Group- Adjumani District
Agriculture Enumerator
10 Robert Drani Nile Farm Institute, Arua Agriculture Enumerator
11 Anthony Leku Adjumani District Local Government Agriculture Enumerator
12 Mark Nyanzunyi Former NAADS Officer at Metu Sub-county- Moyo District
Agriculture Enumerator
13 Emmanuel Iranya Enterprise Uganda Agriculture Enumerator
14 Bernard Oku Koboko District Local Government Agriculture Enumerator
15 Jimmy Andio Yumbe District Local Government Agriculture Extensionist Enumerator
16 Rogers Acile NilePro Trust Limited Agricultural Extensionist Enumerator
17 Elijah Kirungi Freelance Computer Specialist Information Technology Data Entrant
18 Yoweri Bakunda Freelance Computer Specialist Information Technology Data Entrant

iii
EXECUTIVE SUMMARY
Background and Assessment Objectives: This report is an outcome of a Seed Security Assessment (SSA) conducted in West Nile sub-region in March 2015. The assessment, which was commissioned by the Integrated Seed Sector Development (ISSD) Uganda, was necessitated by the need to fully understand the local community’s perspectives on seed security and how the influx of refugees in the sub-region affects seed demand and supply. The SSA focused on both the formal and informal seed systems which farmers use. Channels assessed included those in the informal seed sector, namely; home stocks, seed obtained from social networks, seed aid, local markets; and the formal seed sector such as agro-input dealers, commercial companies, government, or research stations. The assessment was conducted using the Seed Security Conceptual Framework (SSCF) by attempting to answer questions on seed availability, access, quality, suitability and resilience. A combination of data collection methods was employed, including conducting household survey with 344 households; holding 10 Focus Group Discussions (FGD); conducting 20 Key Informant Interviews (KII); conducting four seed grower interviews; conducting nine agro-input dealer interviews; and conducting 16 local market surveys.
Key Assessment Findings: The SSA revealed the following key findings and conclusion in respect to household food and nutrition security and household seed security:
Household food and nutrition security: Quite a diversity of crops are grown in West Nile, either as pure stands or intercrop, reflecting the different farming practices and agro-ecological zones in the sub-region. The main crops grown are cassava, maize, groundnuts, simsim, beans, rice, and sorghum. Other crops include sweet potatoes, cowpeas, pigeon peas, rice and local and exotic vegetables. Over the past five years, some varieties have disappeared while new ones have been introduced in line with farmers’ preferences. Considering the number of times members of the household eat different food items, food availability can be considered as “adequate”. The households have access to food and income to meet their needs, and are not faced with very high dependency burden. However, some of the refugee households with limited or no land experienced food shortages because they could not fend for their families without food aid. There is generally very little intake of animal protein, vitamins and other nutrients in all households and this makes the households prone to malnutrition. Household seed security: The key findings regarding household seed security are highlighted under the five elements of the SSCF as follows:
Availability of adequate seed, timing and proximity: From the farmers’ perspective, seed is generally available in adequate quantity at the time of planting, especially that from informal sources through own source or local markets. A large number of farmers (50-60%) felt that seed from social networks, CBS, LSB and seed aid was available but not enough and in some cases. delivered late. Over 50% of residents and 71% of refugees considered seed from agro-input dealers to be far away. By their proximity, grain traders are expected to contribute to household seed security through sales of second or third generation seed, which are considered near to the farmer. Some of the traders, however lack the knowledge in seed management as a business, have poor storage facilities and practices, and undertake minimum efforts to improve the commercial value of their grain/seed. The agro-input dealers on the other hand are considered far away by the farmers. They too have limited seed business management skills, limited product knowledge, poor handling and storage.

iv
Seed access: Seed from the local markets and own seed are generally considered the main seed sources. Other seed sources include SNS, CBS, seed aid and agro-input dealers. Household survey data shows that local markets contributed 55-70% of the seed planted in 2014, with the exception of cassava, sweet potatoes and exotic vegetables. OSS (45-47%) and SNS (30-32%) were most pronounced seed sources for roots and tubers. Regarding other sources of improved seed, the major concern by farmers was the high price of seed from agro-input dealers and the late delivery of seed by seed aid actors, which affect the extent to which land can be cultivated and planted with crops. Seed from CBS SNS and LSB were considered by some farmers as affordable while others said they were expensive. The main complaints regarding seed aid included late delivery, small quantities given to recipients and limited number of beneficiaries reached. The main means of acquisition are cash (75%), free delivery (25%), and credit and barter (3%), which some farmers said have limited them from accessing quality seed mainly due to lack of money.
Seed quality: Farmers expressed their satisfaction with the overall seed cleanliness and rates of germination and considered seed from agro-input dealers and CBS to be more clean than their own saved seed and seed from the market. Although farmers were of the view that the quality of seed planted was good, discussions with key informants and participants at FGD cited poor quality of seed on the market, poor seed/grain storage and attacks by pests during seed storage as some of the factors affecting seed security in their area. Their views were echoed by the LG, of which some, have developed Quality Seed Resolutions/Regulations, which among others emphasizes the need for quality seed. The National Seed Policy (NSP) recognizes the importance of the informal seed system and the need to ensure quality control in seed production, seed conditioning and storage of Quality Declared Seed (QDS). It is therefore important that efforts are made to develop capacity of the LSB groups and other CBS groups to produce high quality.
Varietal suitability: Overall, about 75% of the farmers said they like the varieties they grow because they posses attributes such as short maturity duration, and resistance to pests, diseases and drought. Farmers indicated that varieties of major crops have done well in their agro-ecologies and coped with the prolonged dry spells over the past few years. There have been a number of new varieties of crops such as cassava, simsim, groundnuts, maize, beans and rice that have been introduced and adopted by the community. Indeed farmers have multiple seed sources through which they obtain seed, and the major ones being own saved seed, local market, CBS and social networks. For some of the main crops such as cassava, maize, beans, sorghum, groundnuts and simsim, more than seven varieties are being grown. Some of the key informants and participants at FGD singled out the lack of information on some of the varieties they are provided with and limited involvement in decision-making regarding variety introductions as their main concerns regarding varietal suitability. Other participants complained about the limited crops and varieties distributed through seed aidthrough donor and government supported programmes.
Resilience of the seed system: Despite the fact that there are several seed sources and seed varieties in the West Nile, the sub-region continues to face crises and disasters, which renders the households prone to seed insecurity (low resilience). The ability of the farmer to have access to adequate and sufficient quantities of adapted and preferred seed “at all times in both good and bad cropping seasons” has been affected by prolonged dry spells, floods, and influx of refugees over the recent past. On a positive note, the National Seed

v
Policy and LG seed quality regulations recognise informal seed sector as a bona fide source of quality seed. Promotion of community seed production, enforcement of seed quality regulations and provision of information to farmers about seed sources, prices and application will go a long way in improving the resilience of the seed system.
Conclusion Farmers have multiple sources through which they obtain seed, with the major ones being own saved seed, local market, CBS and social networks. From the farmers’ perspective seed is generally available in adequate quantity at the time of planting, especially informal seed through own source or local markets. A large proportion of farmers feel that seed from social networks, LSB and seed aid is available but not enough and that seed from agro-input dealers are far away and expensive. Thus there are concerns about timely availability and proximity of seed, high prices of seed especially with the agro-input dealers and the late delivery of seed by seed aid actors. Discussions with key informants and participants at FGD cited poor quality of seed, poor seed/grain storage and attacks by pests during storage as some of the factors affecting seed security in their area. Farmers like the varieties they grow because they posses such attributes as short maturity duration, and resistance to pests, diseases and drought. However, lack of information about some of the varieties provided and limited involvement in decision-making regarding variety introductions were singled out as their main concerns regarding varietal suitability. Farmers’ ability to have access to adequate and sufficient quantities of adapted and preferred seed at all times has been greatly affected by prolonged dry spell, floods and influx of refugees over the past few years, rendering resilience of the seed system low. Recommendations On the basis of the SSA findings and conclusion above, the following recommendations are proposed:
To increase availability of quality seed, ISSD should strengthen the market component of LSB groups through capacity building, private sector partnerships and creating linkages with producers of foundation seed. Grain/seed traders and agro-input dealers need to be supported to develop their capacity to handle seed business in a better way through training them in product knowledge and safe use and handling.
In order to address farmers concerns about timely availability of seed and proximity, providers of seed (such as seed aid actors and agro-input dealers) need to device ways of bringing seed closer to the farmers so that seed of adequate quantity is available in a timely manner. Agro-input dealers should be linked to farmer groups and encouraged to undertake promotional activities aimed at providing information to farmers about their products.
To improve the quality of seed planted at the household level, farmers should be trained in seed management, post-harvest handling and seed selection; and to promote the use of suitable varieties, farmers should regularly be provided with information regarding the varieties that are on the market or the varieties that are provided as seed aid.
In order to provide an enabling environment for seed security, the local government should be encouraged to enforce quality seed regulations and bye-laws on sale of expired/fake, land use and stray animals to reduce on crop damage and minimize on environmental degradation. This can be done in partnerships with the local government at district and sub-county levels, relevant private sector groups/associations, key seed actors (distributors, sellers, producers) and development partners.

PART ONE: OVERVIEW

1
1.0 INTRODUCTION
1.1 Background to the Seed Security Assessment
This report is an outcome of a Seed Security Assessment (SSA) conducted in West Nile sub-region in March 2015. The assessment, which was commissioned by the Integrated Seed Sector Development (ISSD) Uganda was necessitated by the need to fully understand the local community’s perspectives on seed systems, and how the influx of refugees in the sub-region affects seed demand and supply. The sub-region was selected because of the following reasons: (a) it is one of the three zones in the country where ISSD is supporting Local Seed Business (LSB) groups; (b) it borders South Sudan and Democratic Republic of Congo with potential effect on cross-border trade and refugee influx on seed security; (c) several NGOs are involved in seed security interventions; and (d) it has a diversity of agro-ecological zones (AEZ) and crops grown so as to potentially uncover different types of seed security scenarios and lessons. West Nile sub-region has a history of hosting refugees from the neighbouring Democratic Republic of Congo and South Sudan. The most recent influx of refugees occurred in 2013, when conflict in South Sudan, left thousands of people dead and forced tens of thousands to flee their homes. Data from United Nations High Commission for Refugees (UNHCR) shows that as at the end of 2014, there were about 101,400 refugees, out of which, nearly 89,000 are in Adjumani district (see figure to the right). As part of their support to the crisis, aid agencies have responded to food insecurity in the camps by providing seeds to farmers to enable them become self-reliant while in Uganda. Such intervention though welcome, should provide a real solution and not harm the local seed system and the coping mechanisms.
1.2 Assessment Objectives
The SSA focused on the functioning of seed system which farmers use, both formal and informal. Channels assessed included the informal sector (i.e. home stocks or seed obtained from social networks, CBS, LSB, seed aid, local open markets) and formal sector (such as agro-input dealers, commercial companies, government, or research stations). The assessment was
Box 1.1: A Brief on ISSD
ISSD Uganda contributes to the development of a vibrant, pluralistic and market-oriented seed sector in the country. It focuses on strengthening capacity of farmer groups in quality seed production and marketing of locally adapted crops and varieties and supports them towards the development of functional local seed businesses (LSB). It has a field office in West Nile at Abi Zonal Agricultural Research and Development Institute (Abi ZARDI) that coordinates the districts of Arua, Koboko, Maracha, Yumbe, Moyo, Adjumani, Nebbi and Zombo, where it works with 10 farmer groups.

2
conducted using the Seed Security Conceptual Framework (SSCF) by attempting to answer the following essential questions related to seed security:
a) Availability: Is seed available as measured by quantity, timing and proximity?
b) Access: Can farmers access seed as measured by prices and means of accessing the seed?
c) Seed quality: Is the quality of seed what farmers want and need as measured by % germination, physical and variety purity and farmer satisfaction?
d) Varietal suitability: Are the varieties suitable as measured by adaptability, preference, new variety introductions and access, farmer satisfaction and yield levels?
e) Resilience: How resilient is the system as measured by diversity in crops, varieties and seed sources; supportive policies that recognize both the formal and informal systems; productivity and sustainability; equity through access to equitable decision-making powers, information, technologies and training?
1.3 Assessment Methodology
The following assessment methodology was adopted to obtain a wide range of information and to enhance the quality of data: Training of Data Collectors: A two and half day training was conducted at Heritage Courts in Arua town from 9th to 11th March 2015. The training which was facilitated by Joseph Okidi from FAO Nairobi with support of Omondi Polycarp Odoyo from Somali Aid, was attended by nine data collectors from within West Nile sub-region, two data clerks, ISSD, the consultant and partners from three NGOs – NilePro Trust Limited, Danish Refugee Council (DRC) and ZOA. The objective of the training was to provide sufficient skills to the participants in conducting seed security assessment. The training focused on both theoretical and practical understanding of the basic concept of the seed system; the revised seed security assessment conceptual framework (SSCF); the steps in conducting seed security assessments; and data collection tools such as key informant interview (KII) guides, household and market questionnaires, and focus group discussion (FGD) guide. Through role-play exercises and field trial, the trainees demonstrated how they would apply the acquired skills and techniques in the field. To minimize errors during data entry, the two data clerks were trained for one extra day on database modification and entry by the facilitator, prior to commencement of data entry. Assessment Area and Sampling: The assessment was conducted in four districts, namely Arua, Koboko, Moyo and Adjumani. The selection of these districts was made with the following considerations: o Agro-ecological diversities in order to have a variety of crops grown, weather and rainfall
pattern and altitude (low, middle and high terrains) o Existence of refugees and seed aid interventions o Existence of community seed business among farmer groups with focus on seed quality o Cross border trade in seed and crops
A total of 344 households were selected from the four districts with Arua being the most populated having the highest number (124 households) and Koboko with the lowest sample size

3
(50 households). Ten Focus Group Discussions (FGD) comprising 143 participants were held. Other respondents included private sector actors such as local market traders (16) and agro-input dealers (9). A total of 20 key informant interviews were held with local government (LG) technical staff, sub-county and parish chiefs or local council (LC) chairpersons. Annex 1(a) and 1(b) show list of key informants interviewed and groups visited respectively. Table 1.1 shows selected number of households by sub-county in the four districts assessed.
Table 1.1: Household Sample Size and Agro-ecological Zones District Sub-county Household status Total Agro-
ecological zone (AEZ)
Resident Refugees
Adjumani
Itirikwa 0 10 10 Low
Ofua 49 22 71 Low
Ukusijoni 5 4 9 Low
Sub-total 54 36 90
Arua
Odupi 53 0 53 Mid
Rigbo 28 15 43 Low
Vurra 28 0 28 High
Sub-total 109 15 124
Koboko Kuluba 48 2 50 High
Moyo Metu 80 0 80 Mid
Grand Total 291 53 344
Data Collection Methods: The following collection techniques were adopted to enhance
triangulation of the seed security assessment findings as elaborated below:
Desk Review of Relevant Documents: A desk review of some of the relevant documents was conducted to get detailed insights to enhance the capturing of relevant information. Documents reviewed or referenced included: The Draft National Seed Policy; District Local Government Quality Seed Resolutions/Regulations; ISSD Draft Annual Report, 2013; FAO Seed Security Assessment: A Practitioner’s Guide (FAO – March 2015); and Household Seed Security Concepts and Indicators (FAO – February 2015).
Conducting Key Informative Interviews (KII): KII were conducted using a standard KII interview guide which focused on understanding the general agricultural context; the activities of agro-input dealers and other seed production activities; access to seed policy and other relevant agricultural documents; disasters and impact on seed security; and insight into food and nutrition security from an expert point of view. The key informants included district, sub-county and parish technical personnel and chiefs, farmer fora chairpersons, NGO and CBOs programme/project officers, and seed aid actors (SAA). A total of 20 KII were held in the four districts assessed.
Conducting Focus Group Discussions (FGD): A focus group discussion guide containing questions to facilitate probing, in-depth discussions and consensus generation as well as enhancing the quality of presentation of the assessment findings was used during FGD sessions. The assessment team adopted an ‘enquiry and open discussion’ strategy in the

4
management of the FGD, where participants were engaged in brainstorming, plenary discussions and group activities as well as being asked to give testimonies. A total of 10 FGD involving 143 participants were held.
Conducting Household Survey: To gain quantitative insight into seed system security, a household survey was conducted using a questionnaire. The questionnaire included closed questions as well as open questions to elicit relevant quantitative and qualitative information to address the assessment objectives. The household survey was conducted in eight sub-counties, purposely selected to represent the three agro-ecologies of interest. A total of 344 households (73% males and 27% females headed) were interviewed, with data collectors systematically sampling and interviewing 4-6 households along transect. The household survey questionnaire focused on demographic and livelihood characteristics; crop/seed system profile; and seed channels/sources in reference to the SSCF, and on seed aid with respect to accountability principles.
Seed grower’s interviews: Four seed grower groups assisted by ISSD were interviewed using a semi-structured questionnaire to establish the nature of the group; understand their seed production activities; capacities (skills and resources at hand); their major challenges; and investment plan.
Agro-input dealer’s interviews: A total of nine agro-input dealers were interviewed (2 in Arua, 4 in Moyo, 2 in Adjumani and one in Koboko) but complete data was received and analyzed for eight. The interview with agro-input dealers was aimed at understanding the inputs they are selling, particularly crop and vegetable seeds as well as fertilizers. The interview investigated the demand and supply of the various seed; feedback mechanism, with respect to accountability principles; key challenges and areas for improvement especially in support to poor farmers.
Local market survey (LMS): Local market survey was conducted using a structured questionnaire, with a total of 16 local market traders interviewed. The LMS focused on those who normally sell grain/seed to the farmers during the planting season. It also looked at the demand and supply of the various seed types, seed storage and conditioning.
Data Management and Quality Assurance: To ensure that quality data was collected the following organizational plan and data quality measures were adopted:
Fieldwork Scheduling: The assessment team divided up into two groups under the supervision of a team leader in each group and carried out field data collection simultaneously in Arua/Koboko and Moyo/Adjumani. The group members reviewed the information collected on a daily basis to identify inconsistencies and make on-spot corrections where necessary. All records of interviews and focus group proceedings and filled in questionnaires were provided to ISSD to enable verification and follow up..
Reviewing and Finalisation of Study Tools: The study tools used for data collection were adapted from the Food and Agriculture Organisation (FAO) standard survey tools to ensure that the questions address the assessment objectives and facilitate data collection from the respondents. The data collection tools were pre-tested and fine-tuned accordingly before use in the actual field data collection exercise.

5
Data Analysis: Data analysis for quantitative data was undertaken by using computer MS Excel spreadsheets. Data was entered by two data clerks on a daily basis during field data collection phase. The quantitative data were analysed using various analysis techniques to enhance cross-tabulation and descriptive presentations of key study variables to bring out the desired results of the assessment study. The qualitative data were transcribed and analysed using the thematic and content approaches to enhance the capturing of perceptions and experiences as given by the different stakeholders.
1.4 Assessment Limitations
The SSA assessment study has the following limitations:
Little is known about the seed insecurity in many parts of Uganda and not many studies have been conducted in the area of seed security. This denied the assessment team an opportunity to triangulate some of the findings with secondary data, but rather establish these findings as a baseline for future reference.
Due to complications in ascertaining quantities of seed available at planting time by different seed sources, measuring proportions of diseased seeds from different seed channels, and collecting household incomes and wealth, some of the SSCF indicators were not directly measured but instead qualitative judgments were made by the respondents.
The samples covered in this assessment, for example some of the crops grown (n<30) and seed access among refugees (n=4, with 2 out of 4 accessing seed on credit), are too small to be representative and should therefore only be taken as indicative. Furthermore, a number of views expressed and on which conclusion has been drawn are not supported by data or evidence but represents respondents’ perception.
The key actors, notably farmers and traders do not keep records to which they can refer. Data provided to the team during the assessment was based on memory recall. There is absence of reliable data on production, marketing and consumption making it rather difficult to triangulate findings on food and seed security.
1.5 Report Outline
This report is divided into three parts and made up of seven chapters. Part One on general overview comprises the introductory chapter, which highlights the background for the study, the scope of work and assessment methodology; and a chapter on seed security conceptual framework, which highlights the key elements of SSCF and their indicators. Part Two is made up of four chapters and highlights key assessment findings which include: demographic and livelihood characteristics of the households; crop production practices; seed security (availability, access, quality, suitability and resilience), nature of crises and their effects, and seed security perceptions within the community; and commercial seed supply and demand (seed/grain traders, agro-input dealers, and seed growers). Part Three of the report highlights some of the main assessment findings, conclusions and makes recommendations on follow up activities. A series of annexes, including list of persons met, locations of focus group meetings, changes in crop trends and reasons for change over the past five years, and varieties of main crops grown by district concludes the report.

6
2.0 SEED SECURITY CONCEPTUAL FRAMEWORK
2.1 Definition of Key Concepts
Below are definitions of key concepts used in the Seed Security Assessment. The definitions are obtained from the FAO Discussion Paper on Household Seed Security Concepts and Indicators.
Seed Security: Household seed security is said to exist when the household has sufficient access to adequate quantities of good quality seed and planting materials of preferred crop varieties at all times following both good and bad cropping seasons. This definition can be extended to the intra household level by substituting “household” with “men and women” as follows: Seed security exists when men and women within the household have sufficient access to quantities of available good quality seed and planting materials of preferred crop varieties at all times in both good and bad cropping seasons. Seed security exists when quality seed is physically available to households at the right time and place and when households have access to quality seed and planting materials of preferred/suitable crop and varieties (2008 FAO definition).
Seed System: Seed system is the value chain of the demand, production, conditioning and supply of seeds inside a given agricultural set up. Formal seed system entails new varieties developed by formal plant breeding by international or national research institutes or seed companies; released varieties that are multiplied and sold as certified/modern varieties. The objective is to provide high quality seed of adapted varieties to farmers. It entails the following logical progression: plant breeding, variety testing and release, early generation seed multiplication, certified seed production and quality control, storage and conditioning, and commercialization. Informal seed system entails farmers’ access to seeds via their own production, social networks, community based seed and local markets. In the informal seed system, production of seeds, multiplication, distribution and storage is in farmers’ hands and the multiplication, distribution and storage of seeds are a part of production system.
Varieties: Varieties have names assigned to them and have unique seed colors, shape, size and organoleptic properties. Varieties have different growth habit – duration and architecture. Improved varieties are a product of formal plant breeding, normally homogenous and produced by the formal sector but often later are produced by farmers. Local varieties on the other hand are landraces selected by farmers or improved varieties in the hands of farmers for many years. They are not certified and sometimes not homogenous.
Seed Security Conceptual Framework: The Seed Security Conceptual Framework (SSCF) is a way of conceptualizing and visualizing seed security at the household level. It contains five elements which are critical to ensuring seed security namely: (i) seed availability (seed supply at the right time and place); (ii) seed access (means to acquire); (iii) seed quality (germination, physical purity, free from pests and diseases); (iv) varietal suitability (adapted crop varieties farmers prefer and need); and (v) stability of seed system in the context of shocks and stresses (resilience).

7
2.2 The Elements of Seed Security Conceptual Framework
The FAO Discussion Paper on Household Seed Security Concepts and Indicators identifies the elements of household seed security as: (i) availability of seed; (ii) access to seed; (iii) varietal suitability; (iv) seed quality; and (v) resilience of the seed system. Due to complications in ascertaining quantities of seed available at planting time by different seed sources, measuring proportions of diseased seeds from different seed channels, and collecting household incomes and wealth, some of the indicators that are associated with seed security are not reflected or discussed in this report. The following indicators were measured during the SSA and used to draw conclusions on the five elements of household seed security:
Availability (adequacy of seed by crop and source, rating of seed availability, timely availability by seed source, and proximity by seed sources)
Access (seed sources, farmers’ perception on costs, and means of acquisition)
Quality (perceptions on physical cleanliness, germination)
Suitability (crop and variety diversity, use of improved varieties)
Resilience (variety diversity, varieties phased out, ability to cope with weather changes and crises).
The elements of the seed security conceptual framework (essentially derived from food security framework) and the indicators by which they were measured are presented in Table 2.1 below.
Table 2.1: The Elements of Household Seed Security Element Definition Key Indicators
Availability of seed
Seed availability refers to the supply of seed from all sources. Under this definition, adequate availability of seed exists when there is sufficient seed from own saved seed, social networks, in local markets, the formal seed sector and from seed aid suppliers to meet seed needs of local households. The available seed should be in reasonable proximity to the farmer and be available in time for planting.
Quantity of own saved seed or grain stored at the household, known to exist within social networks, or available in local markets at planting time which farmers could use as seed;
Quantity of seed available with local agro-input dealers, or through seed aid organisations at planting time;
Proximity of seed sources in relation to the household – e.g. distance to local markets, local seed stockists.
Access to seed
Access to seed is defined as the ability to acquire seed through exchange, loan, barter or use of power in social networks. Thus whilst seed may be available within a social network (see above), it may not be accessed due to lack of power, status or influence of the household to acquire it. Seed may also be obtained through barter – i.e. in exchange for another commodity or service such labour, and it may be given on loan, on the condition that an equal or greater quantity is returned at a later date. Seed may be acquired through the market place in exchange for cash, in local markets or with seed distributors (formal sector).
Amount of seed accessible by the household through social networks (social access);
Prices of seed in local markets, seed companies and local seed stockists.

8
Varietal suitability
This aspect of seed security refers to the ability of farmers to access seed of crop varieties which have the characteristics that they prefer. There are a range of desirable characteristics which may differ between men and women within the household. The most commonly cited desirable characteristics include: appearance, taste, aroma, storability, high income potential, high production potential, disease and pest resistance in the field. Households require seed of crop varieties that they know, have a preference for and are confident to plant. In some cases farmers can identify the seed of the varieties they use.
Level of farmer satisfaction with the crop and varieties they are currently growing or desire to grow;
Specifically desired characteristics which are/are not present in the varieties which they are currently growing;
Number and types of problems related to current varieties (duration, pest, disease, yield);
Farmer access to accurate and useful information about varieties they are being provided.
Seed quality
Seed quality is a technical parameter that includes a number of seed attributes such as germination, physical purity, seed health, and – for some crops – varietal purity. Though it is a quantitative parameter the perception of the farmer depends on the crop and what they consider normal or acceptable. Some of these seed attributes are apparent when you examine the seed and others are not. Seed quality attributes are an essential parameter of seed security because of their potentially positive or negative impact on the farmer’s ability to successfully establish a crop in the field and to have a reasonable yield. The key attributes of seed quality are germination, physical purity, seed health, and variety purity.
Rate of germination of seeds from different seed channels: provided by farmers; local market; social network ;
Mean % physical purity of seeds from different seed channels: provided by farmers; local market; social network.
Resilience of the seed system
Resilience is the degree to which the household’s seed system can resist, adapt to and recover from shocks and stresses which threaten the integrity of household seed security. A resilient seed system is one in which the farmer has adequate access to sufficient quantities of adapted and preferred seed “at all times in both good and bad cropping seasons” (see definition of seed security above). Thus the degree of resilience is measured by the extent to which seed security is adversely affected by a particular shock or series of shocks. Some households may be susceptible to very small shocks, in which case we can say that they are highly prone to seed insecurity (very low resilience).
Crop diversity (risk spreading);
Different abilities to switch between seed source channels – linked to: amounts of stored seed;
Degree of social access, proximity to local markets;
Different access to information about climate, seed sources, prices;
Different policy environments (e.g. whether the informal sector is recognized as a bona fide source of seed or not in the existing policy frameworks).
Source: Adapted from the FAO Household Seed Security Concepts and Indicators (Discussion Paper, Feb 2015)

PART TWO: KEY ASSESSMENT FINDINGS

9
3.0 DEMOGRAPHIC AND LIVELIHOOD CHARACTERISTICS
3.1 Household Demographic Characteristics
Table 3.1 below shows the demographic characteristics of the surveyed households. About 73% of the households are male-headed and 27% female-headed. Average household size is 7.3 persons with residents (7.4 persons) having larger household sizes than refugees (6.5 persons). Highest household size was reported in Koboko (8.1 persons) and lowest in Moyo (6.5 persons). Analysis of households by age group shows that on average about 56% of the households members are children (less than 18 years), 27% are youths (18-35 years), 14% are in the 36-60 year age group. On average, 3% of household members are over 60 years, indicating a dependency or burden ratio1 of 1.44. This is a reasonably fair ratio, since one person within the productive age group (18-60 years) looks after 1.44 persons (those less than 18 year or above 60 years). In addition, the same number of men (2 per household and women are involved in agriculture
Table 3.1: Demographic Characteristics of Surveyed Households
Adjumani Arua Koboko Moyo Total
Gender of head of household
a) Female 28% 29% 20% 26% 27%
b) Male 72% 71% 80% 74% 73%
n 89 124 50 78 341
Average household size (number of people per household)
a) Resident 8.6 7.2 8.2 6.5 7.4
b) Refugees 6.5 6.3 7.0 6.5
c) Overall 7.8 7.1 8.1 6.5 7.3
Age group (as % of household members)
a) <5 years 22% 22% 26% 16% 22%
b) 5-17 years 36% 33% 32% 36% 34%
c) 18-35 years 25% 26% 27% 30% 27%
d) 36-60 years 15% 15% 13% 14% 14%
e) >60 years 2% 3% 1% 3% 3%
Average number of household members involved in agricultural activities
a) Men 2.1 1.9 2.0 2.4 2.1
b) Women 2.0 2.0 1.9 1.9 2.0
c) Total 4.1 3.8 3.9 4.3 4.0
About 50% of the household heads have attained primary education, 25% secondary education, 20% no formal education and 5% tertiary education (Figure 3.1). This implies that at least 80% of the household heads have attained some level of formal education and should therefore be able to comprehend the basic concepts in commercial agriculture. In
1 Dependency ratio is the proportion of the very young and the aged (children and old) divided by the
productive age group (youth and productive age group). A ratio greater than one shows a high dependency
ratio and vice versa

10
0%
10%
20%
30%
40%
50%
60%
70%
Adjumani(n=86)
Arua (n=122) Koboko(n=50)
Moyo (n=75) Total (n=333)
No formal education
Primary level
Secondary level
Tertiary level
0%
20%
40%
60%
80%
100%
120%
Refugee Resident
Adjumani Arua Koboko Moyo Total0.00
1.00
2.00
3.00
4.00
5.00
6.00
7.00
8.00
9.00
Poultry Goat Cattle Sheep Pigs
Refugee
Resident
addition, most of the residents have lived in the area for at least 30 years, while refugees have been around for about 7 years (the highest reported was in Arua district of nearly 13 years).
Figure 3.1: Respondent Education level
3.2 Key Economic Activities
The key set of economic activities at the household level is typically agro-pastoral setting, with about 77% of refugees and 85% of residents rearing livestock, though less than 50% of the refugees in Arua had livestock. Most commonly kept livestock are poultry and goats with some cattle mainly kept by the residents. Livestock Unit (equivalent of cattle), is higher among residents (4.4) than the refugees (1.6) with some variations from district to district. Figures 3.2a and 3.2b below show percent of households with livestock and average number of livestock per household respectively. Fig 3.2a: Percent of Households with Livestock Fig 3.2b: Average Livestock Numbers
3.3 Sources of Household Income
About 90% of the resident households and 37% of refugee households identified crop produce as their major source of income. Nearly 25% of refugee households recognized farm labour as their second most important source of income. Petty trade, charcoal/fuel wood and livestock sales were other sources of income mentioned but by less than 20% of the households (Figure 3.3).
11
0% 10% 20% 30% 40% 50% 60% 70% 80% 90% 100%
Remittences
Salary
Non-onfarm labour
Livestock sales
Charcoal/fuel wood
Hunting and gathering
On-farm labour
Petty trade
Crop produce
Resident (n=283)Refugee (n=53)
0.0%
10.0%
20.0%
30.0%
40.0%
50.0%
60.0%
70.0%
80.0%
Refugee (n=51) Resident (n=282) Total (n=333)
Not able to access credit Able to access credit
0.0%
10.0%
20.0%
30.0%
40.0%
50.0%
60.0%
70.0%
80.0%
Refugee (n=52) Resident (283) Total (n335)
Do Not save Save
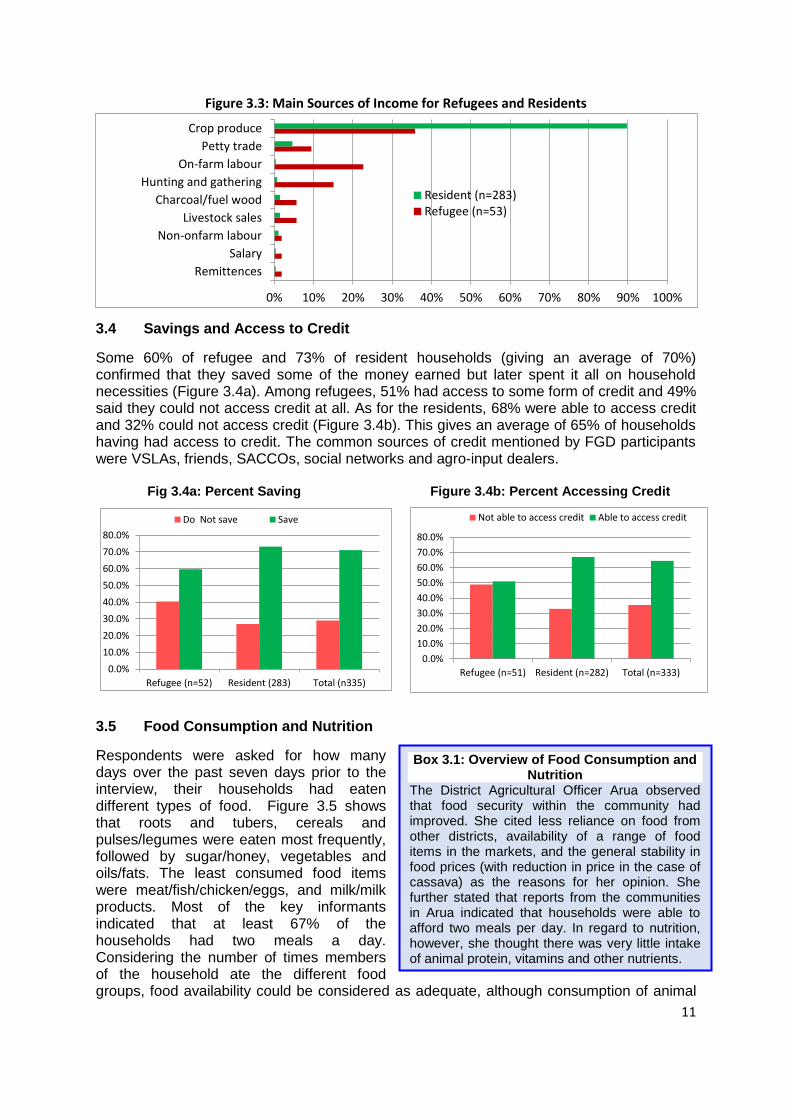
Figure 3.3: Main Sources of Income for Refugees and Residents
3.4 Savings and Access to Credit
Some 60% of refugee and 73% of resident households (giving an average of 70%) confirmed that they saved some of the money earned but later spent it all on household necessities (Figure 3.4a). Among refugees, 51% had access to some form of credit and 49% said they could not access credit at all. As for the residents, 68% were able to access credit and 32% could not access credit (Figure 3.4b). This gives an average of 65% of households having had access to credit. The common sources of credit mentioned by FGD participants were VSLAs, friends, SACCOs, social networks and agro-input dealers. Fig 3.4a: Percent Saving Figure 3.4b: Percent Accessing Credit
3.5 Food Consumption and Nutrition
Respondents were asked for how many days over the past seven days prior to the interview, their households had eaten different types of food. Figure 3.5 shows that roots and tubers, cereals and pulses/legumes were eaten most frequently, followed by sugar/honey, vegetables and oils/fats. The least consumed food items were meat/fish/chicken/eggs, and milk/milk products. Most of the key informants indicated that at least 67% of the households had two meals a day. Considering the number of times members of the household ate the different food groups, food availability could be considered as adequate, although consumption of animal
Box 3.1: Overview of Food Consumption and Nutrition
The District Agricultural Officer Arua observed that food security within the community had improved. She cited less reliance on food from other districts, availability of a range of food items in the markets, and the general stability in food prices (with reduction in price in the case of cassava) as the reasons for her opinion. She further stated that reports from the communities in Arua indicated that households were able to afford two meals per day. In regard to nutrition, however, she thought there was very little intake of animal protein, vitamins and other nutrients.

12
protein and vitamins is limited, probably due to lack of means to buy them. This implies that the households are prone to malnutrition. According to the key informants, malnutrition is attributed to inadequate food intake, lack of diversity, limited knowledge about balanced diet, poor methods of preparation, and negative behavioural and cultural attitudes. In nearly all cases residents eat the various food groups more frequently than the refugees, with the exception of cereals and oils and fats, which could be attributed to food aid agencies which tend to distribute more cereals and oil to refugees. Figure 3.5: Number of Days Different Food Groups were Eaten in a Week by Resident
and Refugee Households
The findings on household demographic and livelihood characteristics show that every person within the productive age group looks after 1.44 persons and that agro-pastoralism is the mainstay of the households with crop produce as their major source of income. About 70% of the households do save part of the money they earn and use it later to meet household needs and nearly 65% of households have access to credit through VSLAs, friends, and social networks. Key informants observed that food security within the community had improved over the years as exemplified by less reliance on food from other districts, availability of a range of food items in the markets, and the general stability in food prices. These findings imply that households do not have a very high dependency burden and have access to food and income to meet their household needs. In regard to nutrition, however, there is very little intake of animal protein, vitamins and other nutrients and this makes the households prone to malnutrition.

13
0%
10%
20%
30%
40%
50%
60%
70%
80%
90%
Refugee (n=53)
Resident (n=291)
0%
10%
20%
30%
40%
50%
60%
70%
80%
Refugee (n=53)
Resident (n=291)
4.0 CROP PRODUCTION PRACTICES
4.1 Major Crops Grown
Quite a diversity of crops are grown, with the most popular ones being cassava, maize, groundnuts, simsim, beans and sorghum. Other crops grown are sweet potatoes, cowpeas, pigeon peas, rice and exotic vegetables. The range of crops grown appears similar to both residents and refugees. From the crop production results in 2014 and anticipated for 2015 (Figure 4.1a and 4.1b), the crop production system in West Nile sub-region can be described as Root-Cereal-Oil-Legume based cropping system. Figure 4.1a: Households Reporting Growing a Particular Crop in 2014
Figure 4.1b: Households Anticipating to Grow a Particular Crop in 2015
When asked whether they grew the crops mainly for food/domestic use or for income/commercial purpose, most households said they grew the crops primarily for food and would only sell surpluses realised (Figure 4.2). The findings from the study also revealed that about 90% of exotic vegetables are grown for income, while 50-60% of rice and sesame and 20-35% of local vegetables are grown for income. Further still, male headed households had more crop gown for income than female headed ones.

14
0%
20%
40%
60%
80%
100%
120%
Food
Income
0%
20%
40%
60%
80%
100%
Swee
t p
ota
to (
n=
8)
Co
wp
eas
(n
=5)
Mai
ze (
n=3
2)
Sorg
hu
m (
n=2
7)
Gro
un
dn
uts
(n
=42
)
Bea
ns
(n=2
8)
Cas
sava
(n
=52
)
pig
eon
pea
s (n
=12
)
Sesa
me
(n=4
0)
Tota
l (n
=246
)
Co
wp
eas
(n
=23
)
Sorg
hu
m (
n=5
1)
pig
eon
pea
s (n
=16
)
Swee
t p
ota
to (
n=
29)
Bea
ns
(n=6
7)
Cas
sava
(n
=18
9)
Gro
un
dn
uts
(n
=98
)
Mai
ze (
n=1
77
)
Loca
l veg
eta
ble
s (n
=6)
okr
a (n
=5)
Sesa
me
(n=9
6)
Ric
e (n
=15
)
Tom
ato
es
(n
=6)
On
ion
s (n
=13
)
Tota
l (n
=748
)
Female headed Male headed
Income Food
Figure 4.2: Proportions of Crops for Food and Income
When asked who made decisions on the utilisation of income from the sales of crops and vegetables, refugee households reported more decision making by women than men. In both cases of resident and refugee households, women made the most decision from sales of vegetables (Table 4.1), hence demonstrating the importance of vegetables as an important source of income to women. Table 4.1: Household Decision Making from Sales of Other Crops and Vegetables Decision-making on Household classification Total
Residents Refugees
Income from vegetable sales
Men
Women
Both
17% 43% 40%
0%
64% 36%
16% 45% 39%
Income from other crop sales
Men
Women
Both
20% 21% 59%
16% 46% 38%
20% 24% 56%

15
0%
20%
40%
60%
80%
100%
Changed
No change
0% 5% 10% 15% 20% 25% 30%
Unpecified
Free seed
Access to more labour
Lack of seed
Lack of land
Better crop performance
Household need
Between 5% and 30% of the households said they would change from growing some of the major crops in 2015, including okra, finger millet, sweet potatoes, pigeon peas, and cow peas. Less than 15% thought they would change from growing cassava, maize, groundnuts, sesame, beans, rice and exotic vegetables (notably cabbage, tomatoes and onions). Figure 4.3 shows the extent of change that the households anticipate in 2015.
Figure 4.3: Famers Changing Major Crops in 2015
The reasons for changing major crops in 2015 include the need to meet household needs (24%), the need to have secure market (21%), expectation of better crop performance (17%) and increase in price, availability of free seed and lack of enough labour (1%). Figure 4.4 shows a range a reasons for changing some of the major crops.
Figure 4.4: Reasons (n=128) for Changing Major Crops
4.2 Area Cultivated per Crop
The average land cultivated per crop in 2014 was 0.3-0.9 acres among refugee households and 0.4-2.0 acres among resident households, signifying the fact that residents have access to larger pieces of land than refugees. Residents cultivate at least one acre under rice, sesame, cassava, maize and pigeon peas, while refugees cultivate at least 0.5 acres under cassava, pigeon peas, maize, sesame and beans. In most cases households anticipate to increase area under the major crops by 15% to 75% (Table 4.2). These anticipated changes for 2015 will, however, depend on a number of factors such as the weather access to land, labour, finance and seed/planting materials among others.

16
0% 10% 20% 30% 40%
Unspecified
Replanting of seed
Lack of tools and…
Increased need at…
Poor yielding varieties
Lack of seed
Lack of labour
Lack of land
Decrease (n=104)
0% 5% 10% 15% 20% 25% 30% 35%
Unspecified
Better access to seed
Good sand selling prices
Access to more labour force
Secure market
High yielding varieties
Access to more land
Increased need at household
Increase (n=354)
Table 4.2: Average Land Size (acres) for Major Crops for Refugees and Residents: 2014 and anticipated 2015
Crop Refugees Residents
2014 2015 % increase 2014 2015 % increase
Cassava 0.9 1.8 100% 1.3 1.5 15%
Maize 0.7 0.9 29% 1.1 1.6 45%
Groundnuts 0.4 0.8 100% 0.8 1.1 38%
Sesame 0.6 0.8 33% 1.4 1.8 29%
Beans 0.6 0.7 17% 0.6 0.9 50%
Sorghum 0.4 0.5 25% 0.9 1.1 22%
Sweet potato 0.3 0.5 67% 0.6 0.6 0%
Cowpeas 0.4 0.7 75% 0.8 1.0 25%
Pigeon peas 0.8 1.2 50% 1.1 1.4 27%
Rice 0.3 1.0 200% 2.0 3.5 75%
Onions 0.3 0.3 0% 0.5 0.6 20%
Tomatoes 0.3 0.5 67% 0.4 0.7 75%
Okra 0.5 0.7 40% 0.5 0.5 0%
The overall positive change in area is expected to result in increase in seed demanded depending on variety types planted, planting methods and spacing, cropping practices (sole vs. intercrop) among others. FGD participants expressed the opinion that the overall situation in 2015 might not be any different from the situation in 2014 since no significant changes in farming practices are expected, though some households thought they would reduce or increase area under production for the reasons cited in Figure 4.5 below.
Figure 4.5: Reasons for Anticipated Change in Land Area (acre) Cultivated in 2015
4.3 Crop Cultivation Practices
The majority of households still use the hand hoe as the means for opening land and weeding. Minimum tillage technology and animal traction were reported in Arua, Koboko and Adjumani by hardly 20% of the households. Use of tractor is virtually non-existent across the sub-region (Figure 4.6). The use of rudimentary hand tools as a means of opening land greatly affects households’ ability to open up sizeable portion of land due to labour scarcity/costs and short planting season which is hardly one month in many places.

17
0%
10%
20%
30%
40%
50%
60%
70%
80%
90%
100%
Hand tools Minimum tillage Animal Traction Slash & burn Tractor
Adjumani Arua Koboko Moyo Overall
Figure 4.6: Means of Opening Land by District
Irrigation and use of fertilizers: Most famers (99%) depend on rainfall which is highly unpredictable. Similarly, most famers (99%) do not use inorganic fertilizers. Only 3% of the cultivated field had organic fertilizers amendment. Average Seed Rates: Table 4.3 shows seed rates for the major crops as reported by the households. Moyo reported significantly lower seed rates for cassava and maize. Compared to the recommended seed rates under good management of sole crop, the seed rates are much higher for most crops, with the exception of pigeon peas and rice. This could be explained by the difference arising from row planting under good management as opposed to broadcasting under the traditional farming methods.
Table 4.3: Average Seed Rate (Kg/acre) for Major Crops Grown in West Nile Sub-region
Crop Adjumani Arua Koboko Moyo Average Good mgt STDEV
Cassava 177 284 234 131 245 255 67
Maize 14 12 14 6 12 10 4
Groundnuts (unshelled)
57 48 63 29 50 42 15
Sesame 10 8 20 7 9 3 6
Beans 44 35 40 8 36 30 16
Sorghum 34 6 4 7 12 4 14
Cowpeas 2 4 4 4 1
Pigeon peas 3 11 3 6 8 5
Rice 16 27 17 18 30 6
Finger millet 50 14 7 18 2 23
Note: i) A bag of cassava cuttings is about 45kg (so the of number bags is between 3 and 6 per acre),
depending on spacing. ii) A bag of unshelled grounds is about 45kg and enough to plant an acre. However, note that
the quantity of seed used also depends on variety types.
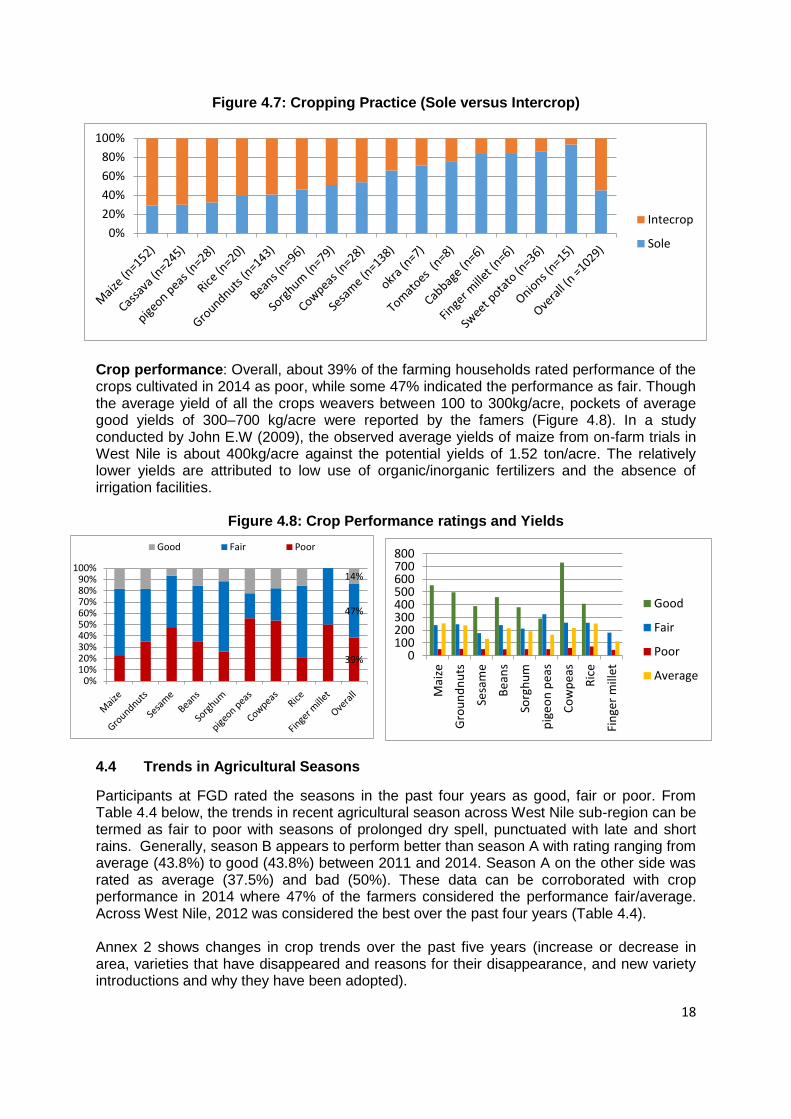
Cropping practice: Figure 4.7 below shows that crops that are mostly grown as pure stands are exotic vegetables, finger millet, sweet potatoes, sesame and cow peas (reported by >50% of farmers). The ones that are mostly intercropped include maize, cassava (when still young), pigeon peas, rice, groundnuts and beans.
18
0%
20%
40%
60%
80%
100%
Intecrop
Sole
39%
47%
14%
0%10%20%30%40%50%60%70%80%90%
100%
Good Fair Poor
0100200300400500600700800
Mai
ze
Gro
un
dn
uts
Sesa
me
Be
ans
Sorg
hu
m
pig
eo
n p
eas
Co
wp
eas
Ric
e
Fin
ger
mill
etGood
Fair
Poor
Average
Figure 4.7: Cropping Practice (Sole versus Intercrop)
Crop performance: Overall, about 39% of the farming households rated performance of the crops cultivated in 2014 as poor, while some 47% indicated the performance as fair. Though the average yield of all the crops weavers between 100 to 300kg/acre, pockets of average good yields of 300–700 kg/acre were reported by the famers (Figure 4.8). In a study conducted by John E.W (2009), the observed average yields of maize from on-farm trials in West Nile is about 400kg/acre against the potential yields of 1.52 ton/acre. The relatively lower yields are attributed to low use of organic/inorganic fertilizers and the absence of irrigation facilities.
Figure 4.8: Crop Performance ratings and Yields
4.4 Trends in Agricultural Seasons
Participants at FGD rated the seasons in the past four years as good, fair or poor. From Table 4.4 below, the trends in recent agricultural season across West Nile sub-region can be termed as fair to poor with seasons of prolonged dry spell, punctuated with late and short rains. Generally, season B appears to perform better than season A with rating ranging from average (43.8%) to good (43.8%) between 2011 and 2014. Season A on the other side was rated as average (37.5%) and bad (50%). These data can be corroborated with crop performance in 2014 where 47% of the farmers considered the performance fair/average. Across West Nile, 2012 was considered the best over the past four years (Table 4.4). Annex 2 shows changes in crop trends over the past five years (increase or decrease in area, varieties that have disappeared and reasons for their disappearance, and new variety introductions and why they have been adopted).

19
Table 4.4: Recent Trends in Agricultural Seasons District 2011 2012 2013 2014
A B A B A B A B
Arua
Koboko
Moyo
Adjumani
Across West Nile
Note: A = First season (March-July); B = Second season (August December)
Bad season Average season Good season
Crop Multiplication Ratios: Table 4.5 shows Crop Multiplication Ratios (CMR) for 2014 harvest. CMR are as low as 5-14 for groundnuts, beans, finger millet and rice signifying low yields in relation to the seed rate. On the other hand CMR was as high as 60 for cow peas, implying a fairly good yield in relation to the seed rate. It is worth noting that for all crops, CMR under good management far exceeds those at farmer fields due in part to the poor agronomic practices, lack of improved seed and other management aspects including post-harvest handling (PHH). Although 20-50% of famers considered harvest as poor, from the multiplication rates less than 20% of the harvest is required for seed.
Table 4.5: Crop Multiplication Ratio2 for 2014 Harvest Crop Seed Rate
(kg/acre) Average yield (kg/acre)
Multiplication Ratio (MR)
% of Harvest needed for seed
Under good management, sole crop (data from Abi ZARDI)
Seed rate Yield MR
Maize 12 254 22 4.6% 10 1,800 180
Groundnuts 50 239 5 20.9% 42 1,000 23
Sesame 9 133 15 6.6% 3 400 133
Beans 36 216 6 16.7% 30 900 30
Sorghum 12 192 16 6.3% 4 800 200
Pigeon peas 6 164 28 3.5% 8 800 100
Cowpeas 4 217 60 1.7% 4 600 150
Rice 18 251 14 7.1% 30 1,500 50
Finger millet 18 112 6 15.7% 2 800 400
The findings on on crop production practices shows that quite a diversity of crops are grown, signifying the different agro-ecological zones in the sub-region. The crops are grown on a small scale (less than 2 acres) as pure stands and inter-crop. Over the past five years, some varieties have disappeared while new ones have been introduced. Nearly 40% of the households rated performance of the crops cultivated in 2014 as poor, while some 47% indicated the performance as fair (average yield of most crops was 100-300kg/acre). There were, however, cases of good yields of 300–700 kg/acre reported by about 13% of the famers. The relatively lower yields in West Nile could be attributed to poor agronomic practices, low use of organic/inorganic fertilizers as well as absence of irrigation facilities. Another reason for low yields is the recent trends in agricultural season across West Nile sub-region is as a result of prolonged dry spells coupled with late and or short rains.
2 Crop Multiplication ratio (CMR) for a particular crop is obtained by dividing the yield (kg/acre) by the seed
rate (kg/acre). Under good management practices CMR are typically above 30 with some crops having CMR of
as high as 400-500.

20
65%
35%
0%
20%
40%
60%
80%
100%
Not enough Enough
74%
55%
0%
20%
40%
60%
80%
100%
Sub
-to
tal
Ad
jum
ani
Aru
a
Ko
bo
ko
Sub
-to
tal
Ad
jum
ani
Aru
a
Ko
bo
ko
Mo
yo
Tota
l
Refugees Resident Overall
2014
Enough Not enough
75%
62%
0%
20%
40%
60%
80%
100%
Sub
-to
tal
Ad
jum
ani
Aru
a
Ko
bo
ko
Sub
-to
tal
Ad
jum
ani
Aru
a
Ko
bo
ko
Mo
yo
Tota
l
Refugee Rsidents Overall
2015
Enough Not enough
5.0 SEED SECURITY AT HOUSEHOLD AND COMMUNITY LEVELS
5.1 Seed Availability
Seed availability denotes farmers’ seed supply from all sources regardless of the variety or quality of seed. The most critical indicators of seed availability are having seed within close proximity to the farm household at the time of planting, and this should be adequate enough to plant the desired area of land that meet the interest (food and income) of the farming household.
Availability of adequate quantity of seed: Overall, 65% of the farmers who planted in 2014 indicated that there was enough seed available from the various sources (Figure 5.1), although 45%, 50% and 60% respectively observed that seed provided through CBS, SNS and SAA were not enough (Figiure 5.2). Generally rating of availability in 2014 and 2015 are similar with about 75% of the respondents indicating that enough seed was available in 2014 and will be available in 2015 considering all the seed sources (Figure 5.3). However, more refugees (62%) in Arua feel not enough seed will be available in 2015, and this is 7% above the rating of 2014.
Figure 5.1 Seed Availability status by crop in 2014 Figure 5.2: Seed Availability by Source
Figure 5.3: Overall Seed Availability in 2014 and Anticipation for 2015

21
30%
64% 22% 30%
26% 4%
0%
20%
40%
60%
80%
100%
Sub
-to
tal
A-I
-De
aler
s
CB
S
LMS
Ow
n
Seed
.Aid
SNS
Sub
-to
tal
A-I
-De
aler
s
CB
S
LMS
Ow
n
Seed
.Aid
SNS
Tota
l
Refugees Residents Overall
End season
Mid-season
At beginning
Before
0%
20%
40%
60%
80%
100%
Sub
-to
tal
A-I
-De
aler
s
CB
S
LMS
Seed
.Aid
SNS
Sub
-to
tal
A-I
-De
aler
s
CB
S
LMS
Seed
.Aid
SNS
Tota
l
Refugees Resident Overall
Another district District Sub-county
Timing and proximity of the seed to the faming households: For most of the seed sources, over 85% of the farmers obtained their seed before or at the start of the planting season, therefore availability of seed at the time of planting was not a big problem in the districts assessed, However, for seed aid, 53% of refugees and 66% of residents received seed before or at the beginning of the season. Also in the case of SNS 78% of refugee households received seed before or at the beginning of the planting season (Figure 5.4). Apart from OSS which in most cases is considered within farmer’s reach, at least 20% of the farmers (Figure 5.5) considered the sources of seed a bit far (either within the district but outside their sub-county or another district). Seed from agro-input dealers was considered far away by 50% of residents and 71% of refugee households. Seed from local markets and that from seed aid seed was considered far away by about 27 % and 11% of residents.
Figure 5.4: Timely Availability by Seed Source and Residential Status
Figure 5.5: Proximity of Seed Sources to the Residents and Refugees in 2014
From the farmers’ perspective, seed is generally available in adequate quantity at the time of planting, especially informal seed through own source or local markets. A large number of farmers (50-60%) felt that seed from social networks, CBS and seed aid was available but not enough. Apart from seed aid, farmers felt that seed from other sources were available at the time for planting. Over 50% of residents and 71% of refugees considered seed from agro-input dealers to be far away and about 30% and 20% of the farmers thought seed from the local market and CBS respectively were far from their localities. Thus although farmers’ perception is that seed is generally available, there are concerns about their adequacy, timely availability and proximity. This shows the need for

22
the providers of seed to device ways of bringing seed closer to the beneficiaries and also the need to encourage agro-input dealers to take their services closer to the farmers, so that seed of adequate quantity is available in a timely manner.
5.2 Seed Access
Access to seed is defined as the ability to acquire seed through exchange, loan, barter or use of power in social networks. Seed may be acquired from the market place or local market in exchange for cash, or from seed distributors (formal sector).
Cost of seed: The farmers’ major concern was the high prices of seed with the agro-input dealers, the local market and CBS. All the refugees that obtained seed from agro-input dealers considered the prices high (50% very expensive and 50% expensive), while 80% of residents considered prices by the agro-input dealers high (28% very expensive and 52% expensive). The prices of seed from agro-input dealers are relatively high compared to the prices of uncertified varieties found in the local market (Box 5.1). Some 60-68% of farmers considered the prices from the local market equally high (Figure 5.6).
FGD participants observed that in response to the high prices, farmers tend to utilize multiple seed sources in order to meet their seed demand. For instance, farmers who could not afford to buy all the seed they need from the agro-input dealers topped up by buying from relatively cheaper sources, mainly the local market and to some limited extent from the social networks. Figure 5.6: Costs of Seed by Source as Perceived by the Refuges and Residents
Box 5.1: Seed Prices by Seed Source
At the time of the assessment, beans in the local market was being sold at about UGX 2,300-2,500 per kg while, K132 (bean seed) was being sold at UGX4,500-5,000 per kg by the agro-input dealers. Similarly groundnuts was being sold at UGX 3,000 and UGX 4,000 per kg in the local market and by agro-input dealers respectively. Maize grain was being sold at UGX 800-1,000 per kg in the local market while Longe series were being sold at UGX 4,000-4,500 per kg by agro-input dealers.

23
0%
5%
10%
15%
20%
25%
30%
35%
40%
45%
50% Adjumani (n=297)
Arua (n=403)
Koboko (n=152)
Moyo (n=251)
Overall (n=1085)
0%
5%
10%
15%
20%
25%
30%
35%
40%
45%
Residents (n=907)
Refugee (n=163)
Overall (n=1070)
0%10%20%30%40%50%60%70%80%90%
100%
Sub
tota
l (n
=13
7)
A-I
-De
aler
s (n
=4)
CB
S (n
=11
)
LMS
(n=
67
)
Seed
.Aid
(n
=2
7)
SNS
(n=
27
)
Sub
tota
l (n
=57
8)
A-I
-De
aler
s (n
=35
)
CB
S (n
=30
)
LMS
(n=
38
7)
Seed
.Aid
(n
=2
7)
SNS
(n=
99
)
Tota
l (n
=7
15
)Refugee Resident Overall
Free
Battered
Credit
Cash
Means of acquisition: Figure 5.7 shows the different means of acquiring seed from the different seed sources. The most common means are free of charge (seed aid, CBS, and SNS) and on cash basis (agro-input dealers, local market and SNS). Two out of the four of refugees who acquired seed from agro-input dealers said they were given on credit, while about 5% of residents and refugees obtained seed through SNS on credit. Some of the farmers linked their inability to access quality seed to use of cash as the main means of acquisition (75%). They cited the agro-input dealers and the local market traders as be unwilling to provide seed on credit or on ex-change for other items (barter).
Figure 5.7: Means of Acquiring the Seed by Different Sources
Major seed sources: Figures 5.8 and 5.9 show seed sources by district and household residential status respectively. In 2014, the local market was the main source of seed (43% of households), followed by own saved seed (34%), social network seed (12%), seed aid (5%), and community based seed and agro-input dealers (4% each). Seed purchased from the local market was most reported in Koboko (48% of the households and least in Moyo (39% of households). Own saved seed was most reported in Moyo (41%) and Arua (38%) and least reported in Adjumani (24%) and Koboko (27%). In terms of residential status, more resident households reported use of own saved seed (37%) compared to refugee households (14%). This could be attributed to the fact that residents tend to produce enough for eating and put aside some for selling or for seed, as opposed to refugees who tend to consume all they produce due to limited production.
Figure 5.8: Seed Sources by District Figure 5.9: Sources by Residential Status

24
0%
10%
20%
30%
40%
50%
60%Cassava (n=268)
Sweet potato (n=41)
0%
10%
20%
30%
40%
50%
60%
70%Maize (n=161)
Sorghum 9n=81)
Rice (n=21)
Finger Millet 9n=6)
0%
20%
40%
60%
80%
Groundnuts (n=147)Sesame (n=142)Beans (n=103)Pigeon peas (n=28)Cowpeas (n=27)
0%
20%
40%
60%
80%
100%
Onions (n=19)
Okra (n=11)
Tomatoes (n=10)
Analysis of seed sources by crop (Figure 5.10) shows that in the case of roots and tubers such as cassava and sweet potatoes, own and SNS are the main seed sources. In the case of cereals the local market is the main sources of seed followed by own. Similar patterns emerge for pulses and oil crops, with the local market being the main source of seed followed by own. Agro-input dealers are the main source of seed for exotic vegetables followed by the local market.
Figure 5.10: Seed Source by Crop
Figure 5.11 shows different seed sources by crop in the form of seed source mapping. The seed source mapping shows the significance, proximity and cost implication of each source to the farmers. In developing the seed source mapping triangulation was made with responses from FGD participants. These maps can give a summary of seed availability, proximity and access (cost impression) for major important crops Figure 5.11: Seed Source Mapping for Major Crops Grown in West Nile Sub-region Maize Cassava

25
The seed source mapping for maize above shows that the major sources of seed as the local market followed by own. Maize seed from agro-input dealers, seed aid and SNS follow in that order. In terms of proximity own seed is the nearest to the farmer followed by the local market and SNS. Seed from agro-input dealers and seed aid are considered far away from the farmer. Own seed and seed from seed aid and SNS are free of charge, while the local market seed is considered affordable by some farmers and expensive by others. Maize seed from agro-input dealers are generally considered expensive. In the case of cassava own cuttings are clearly the main and nearest source, followed by cuttings obtained from social networks. Cuttings from the local market, seed aid and research are considered limited in quantity. In terms of costs, own cuttings and those from seed aid are free of charge, while cuttings obtained through social networks are free of charge to farmers who are members and considered affordable by others. Cuttings from the local market are considered affordable, while those from research stations are considered expensive. Sesame Sorghum
The local market and own seed are the main sources of sesame seed, followed to a lesser extent by seed aid and social networks. Sesame seed from agro-input dealers and LSB groups are considered limited in quantity. The nearest seed source is own, followed by LSB, the local market and social networks. Seed aid and agro-input dealers are considered relatively far away compared to other sources. Own seed and seed from seed aid are free of charge, while seed from social networks as free of charge to farmers who are members but considered affordable by non-members. The local market seed for sesame is considered affordable by some farmers and expensive by others. Sesame seed from LSB groups and agro-input dealers are generally considered expensive. Sorghum seed is mostly obtained from the local market and own seed. Seed from social networks and seed aid are also considered significant. The nearest seed sources is own, followed by social networks, local market and seed aid in that order. The local market seed is considered affordable by some farmers and expensive by others. Sorghum seed from social networks is obtained free of charge by farmers who are members and considered affordable by others. Own seed and seed aid are free of charge. Beans Groundnuts

26
The main beans and groundnuts seed source is the local market followed by own. The other sources including social networks, seed aid, LSB groups and agro-input dealers are relatively insignificant. Seed from the local market and LSB groups is considered affordable by some farmers and expensive by others, while seed from social networks is free for members and considered affordable by others. Seed from agro-input dealers is considered expensive and those from seed aid and own are free of charge. The local market and own seed are generally considered the main seed sources, with SNS and to a lesser extent CBS and seed aid as other seed sources. Household survey data show that the local market contributed 55-70% of the seed planted in 2014, with the exception of cassava and sweet potatoes and exotic vegetables. OSS (45-47%) and SNS (30-32%) were most pronounced seed sources for roots and tubers. Discussions with key informants and FGD participants revealed that agro-input dealers remain major seed source for exotic vegetables, certified and standard seeds (maize, rice and groundnut and beans). Seed aid provides improved seeds both from formal and informal seed system to refugees and their host communities, with most of the seed distributed directly to the beneficiaries by the organizations supporting the famers. In regard to other sources of improved seed, the major concern by farmers regarding access to seed is the high prices of seed with the agro-input dealers. Supporting community-based seed production initiatives and creating linkages between agro-input dealers and farmer groups could reduce on costs of seed through economies of scale and enhance means of acquisition. 5.3 Seed Quality
Seed quality is a technical parameter that includes a number of seed attributes such as germination, physical purity, and seed health.
Physical cleanliness: Generally, seed from the agro-input dealers and CBS were considered clean3 by 95% of the farmers while some 80-85% of the farmers considered their own saved seed, seed from the local market, seed aid and social network seed as clean seed and 11-15% as fairly clean4 (Figure 5.12).
Seed germination: Germination of important crop seeds, from all sources, was considered generally good by over 90% of the farmers (Figure 5.13). Some 2-8% considered the germination as fair and 2-6% as poor.
Thus in regard to seed quality, farmer expressed their satisfaction with the overall cleanliness and rates of germination. The views of the farmers are, however, not tested or supported by data but rather represents their perception on what they though was good, fair or bad germination and may appear contrary to common belief and views expressed by key informants and participants at FGD, who cited poor seed quality as a major issue affecting seed security.
3 Clean seed is considered where there is no impurities/debris, and no physical or pest damage.
4 Fairly clean seed is where there is some impurities but no damage
Box 5.2: Quality Seed Resolutions/Regulations
ISSD has assisted some District Local Governments in West Nile to develop quality seed resolutions. The Quality Seed Resolutions spell out roles of community leaders, family heads, community members and quality seed technical committee in adhering to seed quality throughout the seed chain. It further emphasizes quality seed measures to be at seed sources, seed suppliers, seed marketing, and smallholder seed production. It emphasizes seed storage and participation of the household. If this is enforced, it will greatly enhanced the quality of seed planted by farmers.

27
5% 0%
15% 11% 15% 16% 13%
50%
60%
70%
80%
90%
100%
A-I-Dealers CBS LMS Own Seed.Aid SNS Overall
Not clean
Fairly clean
Clean
97% 98% 91% 90% 93% 91% 92%
3% 0% 7% 8% 2% 8% 7%
0% 2% 1% 1% 6% 1% 2%
50%
60%
70%
80%
90%
100%
A-I-Dealers(n=38)
CBS (n=41) LMS(n=456)
Own(n=347)
Seed.Aid(n=54)
SNS (n=125) Overall
Poor
Fair
Good
Figure 5.12: Physical Seed Cleanliness by Source
Figure 5.13: Rating of Seed Germination by Various Sources.
Although farmers were of the view that the quality of seed planted was good, discussion with key informants and participants at FGD cited poor quality of seed, incidence of fake seed on the market disguised as genuine seed through colouration and packaging, poor seed/grain storage and attacks by pests during storage as some of the factors affecting seed security in their area. There is a need to carry out research/tests on quality to determine germination rates, physical purity and seed health among other. At the same time farmers should be trained in seed management, post-harvest handling and seed selection. The local government should also be encouraged to effect bye-laws on sale of expired and fake seed through effective monitoring of seed dealers and traders. 5.4 Varietal Suitability
This aspect of seed security refers to the ability of farmers to access seed of crop varieties which have the characteristics that they prefer. Generally, farmer in the West Nile sub-region grow both improved and local varieties. The improved varieties have over the past few years been introduced through seed aid, seed producer groups supported by NGOs, and social networks. All these efforts have contributed to availability of the improved varieties from the formal sector. Farmers indicated that varieties of the major crops have done well in their agro-ecologies and coped with the prolonged dry spells over the past few years. There have been a number of new varieties introduced and adopted by the community such as cassava (TME14 and Nase series), simsim (Sesame series), groundnuts (Serenut series), maize (Longe series), beans (K132 and Nabe series) and rice (Nerica series). FGD participants noted that these varieties have been adopted due to: short maturity period in the field, drought and disease tolerant, high yielding, good taste, and high marketability among others. Most of these varieties were obtained from research, seed aid and NAADS. On the other hand, some crops such as Bambara nuts, pearl millet, and a few

28
0%
20%
40%
60%
80%
100%
120%Improved Local
0%10%20%30%40%50%60%70%80%90%
100%
Not same
Same variety
varieties of cassava and sorghum that were introduced in the communities have proved unsuitable (i.e. long maturity period, bitter taste, low marketability, difficultly in cooking) and consequently abandoned. Figure 5.14 below shows that farmers mainly plant improved seed varieties of exotic vegetables and the local seed varieties of indigenous vegetables. Among the staples (maize, cassava, beans, sesame, groundnuts and sorghum), 20-70% of farmers reported planting improved seeds, with maize reported by 69%, followed by cassava cuttings (54%), beans (52%) and sesame (50%). Improved vines of sweet potatoes are among the least planted ( 3% of farmers) crops. Annex 3 shows varieties of main crops grown by district and why they were adopted. The annex was derived from FGD held in the four districts assessed.
Figure 5.14: Improved and Local Seed Planted by Crop
When asked whether they would change varieties of the main crops grown, only 2-15% of the farmers answered in affirmative: beans (15% of farmers), followed by cassava (13%), sesame (11%), groundnuts (5%), maize (4%), rice (3%), sorghum (3%) and sweet potatoes (2%). Between 12% and 42% of farmers intend to change varieties of the exotic vegetables grown in 2014. Figure 5.15 below shows the proportion of farmers who intend to change varieties of main crops planted in 2014. The reasons for changing varieties revolve around the good/bad performance of a given variety, resistance/lack of resistance to pests and diseases and existence/absence of seed from other cheaper or free sources (Figure 5.16).
Figure 5.15: Change in Crop Varieties

29
0% 5% 10% 15% 20% 25% 30% 35% 40% 45%
Poor resistance of previous varieties to pests
Lack of seed from seame source
Lost of seed/variety
Availaility of seed from another source
Resistance of the new variety to diseases
Resistance of the new variety to pests
Figure 5.16: Reason for Changing
Overall, about 75% of the farmers like the varieties they grow because they posses attributes such as short maturity duration, and resistance to pests, diseases and drought. Farmers indicated that varieties of major crops have done well in their agro-ecologies and coped with the prolonged dry spells over the past few years. There have been a number of new varieties of crops such as cassava, simsim, groundnuts, maize, beans and rice that have been introduced and adopted by the community. All these have significantly contributed to the progressive increase in use of improved varieties and retention of some of the good-performing local varieties. However, some of the key informants and participants at FGD singled out lack of information on some of the varieties they are provided with and limited involvement of the community in deciding which - varieties are to be introduced as the main concern regarding varietal suitability. 5.5 Resilience of the Seed System
Resilience is the degree to which the household’s seed system can resist, adapt to and recover from shocks and stresses which threaten the integrity of household seed security. Some of the most popular varieties grown by the famers in West Nile sub-region are shown in Figure 5.17. There is a mix of local and improved varieties, with each crop having at least seven different varieties planted (beans and cassava have >12 varieties). The high level of diversity of varieties within a given crop species signifies that the household’s seed system in West Nile sub-region is generally resilient to weather (drought) and biotic (pest and diseases) shocks.
However, crises continue to be observed in West Nile sub-region characterized by prolonged dry spell, floods, and influx of refugees as a result of internal conflicts in South Sudan. These crises according to key informants and FGD participants have resulted in crop failures, poor harvest and general food and seed security vulnerability at the household level. Table 5.1 shows the nature of crises and their impact by district over the past few years.

30
25%
9%
9% 5%
3% 3% 3% 3% 2%
2%
11%
7%
4%
2% 1%
1%
9%
Cassava (n=269) TME 14*
SS4*
Nase 14*
Derekenyi (SS4)*
Mabulu
Naads*
Abiria (Bitter)
Nase 4*
Akena*
NASE 3*
Other improved*
Omwo
Basumenge
Angaraku
Akulu
Aliwara
Other Locals
37.9%
11.2% 9.9% 1.9%
9.3%
6.2% 1.2%
1.2% 21.1%
Maize (n=161) Longe 5*
Katumani*
Longe 4*
Longe 1*
Other Improved*
PDU*
Bomu
Sidi
Other Locals
30%
10%
6%
3%
12%
23%
4%
3% 3%
3% 2% 2%
Beans (n=103) K132*
NABE 4*
K131*
NABE 15*
Other improved*
Other locals
Red type
Cicia
White
Yellow
indrize
Ofute
34.6%
30.9%
9.9%
8.6%
7.4%
3.7% 2.5%
2.5%
Sorgum (n=81)
1 Serena*
2 Sekedo*
3 OtherImproved*
4 Godo
5 Acholi Godo
Table 5.1: Cases of Crises and their Impact District Period Nature of crisis Impact
Arua 2013 Influx of refugees
Prolonged dry spell in season A
Too much rainfall in season B
Unpredictable and changing weather patterns
Negative effect on cropping system due to seasonal changes
Crop failure, poor harvest, especially of first season crops
Seed and food security vulnerability, especially among refugees with limited or no land
Koboko 2014 Prolonged dry spell in season A
Too much rainfall between July and September (season B)
Poor harvest
Little food at household and market
Quality of seed was affected since most seed is from informal sources
Moyo Almost every year
Cross-border conflicts
Prolonged dry spells
Occasional floods
Loss of lives during tribal clashes
Poor harvest
Loss of crop and livestock Adjumani Almost
every year Prolonged dry spell and
floods
Influx of refugees in season A
Poor harvest
Crops were destroyed
People resorted to cutting down trees and charcoal burning as main source of income
Figure 5.17: Seed Varieties Grown by Crop (* denotes improved varieties)

31
5.6 Seed Insecurity Perceptions and Options for Improvement
FGD participants cited a number of reasons why seed insecurity exists and suggested what could be done to solve the problem. Among the common reasons for seed insecurity are poor quality of seed, poor post-harvest seed management, poor storage of seed, pests and diseases, high costs of improved seed, and seed storage, limited access to foundation seed, late delivery of seed by seed aid actors, limited number of agro-input dealers and prolonged droughts and occasional floods. Some of the suggested solutions to seed insecurity include the need to strengthen community seed multiplication, training farmers in post-harvest management, seed storage and seed selection, timely delivery of seed, creating linkages between agro-input dealers and farmers, and enforcing bye-laws on seed quality. Table 5.2 below provides district-wise assessment for the reasons why seed insecurity exist and what could be the main solutions.
Table 5.2: Seed Problem Perception and Options for Improvement District Why seed problem exists What could be the main solutions
Arua Prolonged dry spell affects production and quality
Late delivery of limited quantity of seed by seed aid actors hinders commercial adoption
Poor quality of seed on the market
Seeds of good quality are expensive and far away from the farmers
Theft of saved seeds in some areas
Lack of proper post-harvest seed management
Destruction of crops, especially cassava stalks and potato vines by stray animals and wild fires
Poor seed storage at the household and community
Strengthen community seed multiplication
Distribute seed in time through use of renowned agro-input dealers
Train farmers on seed selection and post-harvest handling
Create farmer-agro-input dealer linkages
Institute and enforce seed bye-laws on animal movement and seed quality
Train farmers in environmental conservation, seed management, GAP and post-harvest handling and storage
Koboko Pests and diseases
Inadequate seeds
Inaccessibility of seeds
Poor seed quality
Train farmers in pest management
Promote seed production within the community
Encourage agro-input dealers to move

32
Lack of knowledge in seed management
Poor storage of seed
Quality seed are far away (issue of proximity)
Quality seeds are expensive
to rural areas
Train farmers in seed management and storage
Provide good storage facilities for groups
Moyo Uncontrolled pests and diseases
Lack of quality seeds
High prices of improved seeds
Limited knowledge on advantages of improved seeds
Unsuitable varieties for the local environment
Limited access to foundation seed (Soroti, Arua or Kampala)
Train farmers in pest control and management
Institute bye-laws on sale of expired seed and inspect seed sellers regularly
Sensitize the community on the importance of quality seeds
Encourage agro-input dealers to open up shops nearer the community
Avail foundation seed to farmer groups Adjumani Late delivery of planting materials by seed aid
Stray animals which destroy cassava stalk and potato vines meant for planting
Land degradation and exhausted soils
Prevalence of Striga
Uncontrolled pests and diseases
Lack of improved seeds
Drought and floods
Seed aid should be provided in a timely manner (before on-set of rains)
Enforce bye-laws on animal movement, seed quality and environmental conservation
Train farmers in pest/disease identification and control
Promote seed production among farmer groups
Train farmers in GAP, crop rotation and environmental conservation
Despite the fact that there are several seed sources and seed varieties in the West Nile, the sub-region continues to face crises and disasters, which renders the households prone to seed insecurity (low resilience). The ability of the farmer to have access to adequate and sufficient quantities of adapted and preferred seed “at all times in both good and bad cropping seasons” has been affected by prolonged dry spells, floods, and influx of refugees over the recent past. This has resulted in crop failures, poor harvest and general food and seed security vulnerability at the household level. On a positive note, the National Seed Policy and LG seed quality regulations recognise informal seed sector as a bona fide source of quality seed. Promotion of community seed production, enforcement of seed quality regulations and provision of information to farmers about seed sources, prices and application will go a long way in improving the resilience of the seed system. 5.7 Seed Aid
The history of seed aid in West Nile dates back to the 1980’s when the government (through OPM, MAAIF, NAADS, and LG programs), and the donor community (through bilateral arrangements, international and local NGOs), responded to the needs of conflict-affected populations such as internally displaced persons and the refugees as well as to weather related problems such as droughts and floods. Over 15 organisations are involved in the distribution of seed aid in the four districts assessed, with the main ones being CEFORD, DRC, CARITAS and the successor to NAADS known as Operation Wealth Creation (OWC). Among the seed aid actors interviewed was DRC, which has been distributing seed to the refugees and host community for the past six years. The seeds distributed by DRC are a donation from United Nations bodies such as UNHCR and FAO and they include cassava cuttings (Nase 14), maize (Longe 5), simsim (Sesame 2), cowpeas (local variety) and
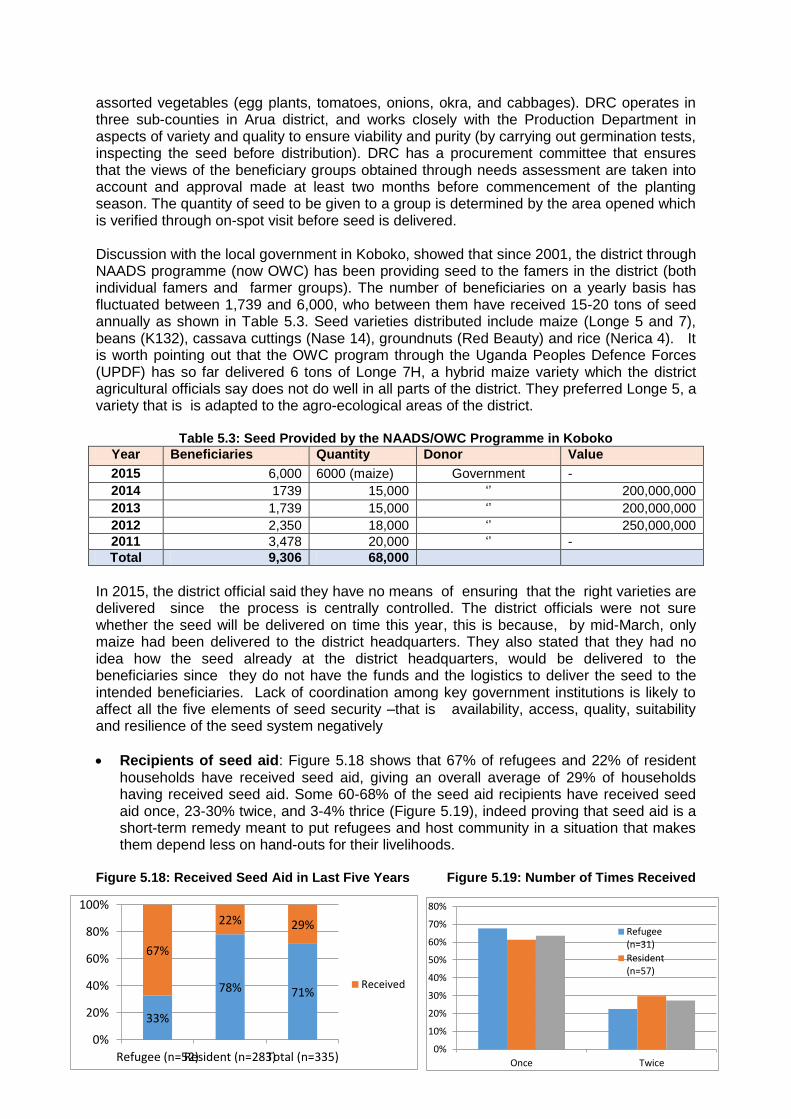
33
33%
78% 71%
67%
22% 29%
0%
20%
40%
60%
80%
100%
Refugee (n=52)Resident (n=283)Total (n=335)
Received
0%
10%
20%
30%
40%
50%
60%
70%
80%
Once Twice
Refugee(n=31)
Resident(n=57)
assorted vegetables (egg plants, tomatoes, onions, okra, and cabbages). DRC operates in three sub-counties in Arua district, and works closely with the Production Department in aspects of variety and quality to ensure viability and purity (by carrying out germination tests, inspecting the seed before distribution). DRC has a procurement committee that ensures that the views of the beneficiary groups obtained through needs assessment are taken into account and approval made at least two months before commencement of the planting season. The quantity of seed to be given to a group is determined by the area opened which is verified through on-spot visit before seed is delivered. Discussion with the local government in Koboko, showed that since 2001, the district through NAADS programme (now OWC) has been providing seed to the famers in the district (both individual famers and farmer groups). The number of beneficiaries on a yearly basis has fluctuated between 1,739 and 6,000, who between them have received 15-20 tons of seed annually as shown in Table 5.3. Seed varieties distributed include maize (Longe 5 and 7), beans (K132), cassava cuttings (Nase 14), groundnuts (Red Beauty) and rice (Nerica 4). It is worth pointing out that the OWC program through the Uganda Peoples Defence Forces (UPDF) has so far delivered 6 tons of Longe 7H, a hybrid maize variety which the district agricultural officials say does not do well in all parts of the district. They preferred Longe 5, a variety that is is adapted to the agro-ecological areas of the district.
Table 5.3: Seed Provided by the NAADS/OWC Programme in Koboko
Year Beneficiaries Quantity Donor Value
2015 6,000 6000 (maize) Government -
2014 1739 15,000 ‘’ 200,000,000
2013 1,739 15,000 ‘’ 200,000,000
2012 2,350 18,000 ‘’ 250,000,000
2011 3,478 20,000 ‘’ -
Total 9,306 68,000
In 2015, the district official said they have no means of ensuring that the right varieties are delivered since the process is centrally controlled. The district officials were not sure whether the seed will be delivered on time this year, this is because, by mid-March, only maize had been delivered to the district headquarters. They also stated that they had no idea how the seed already at the district headquarters, would be delivered to the beneficiaries since they do not have the funds and the logistics to deliver the seed to the intended beneficiaries. Lack of coordination among key government institutions is likely to affect all the five elements of seed security –that is availability, access, quality, suitability and resilience of the seed system negatively
Recipients of seed aid: Figure 5.18 shows that 67% of refugees and 22% of resident households have received seed aid, giving an overall average of 29% of households having received seed aid. Some 60-68% of the seed aid recipients have received seed aid once, 23-30% twice, and 3-4% thrice (Figure 5.19), indeed proving that seed aid is a short-term remedy meant to put refugees and host community in a situation that makes them depend less on hand-outs for their livelihoods.
Figure 5.18: Received Seed Aid in Last Five Years Figure 5.19: Number of Times Received
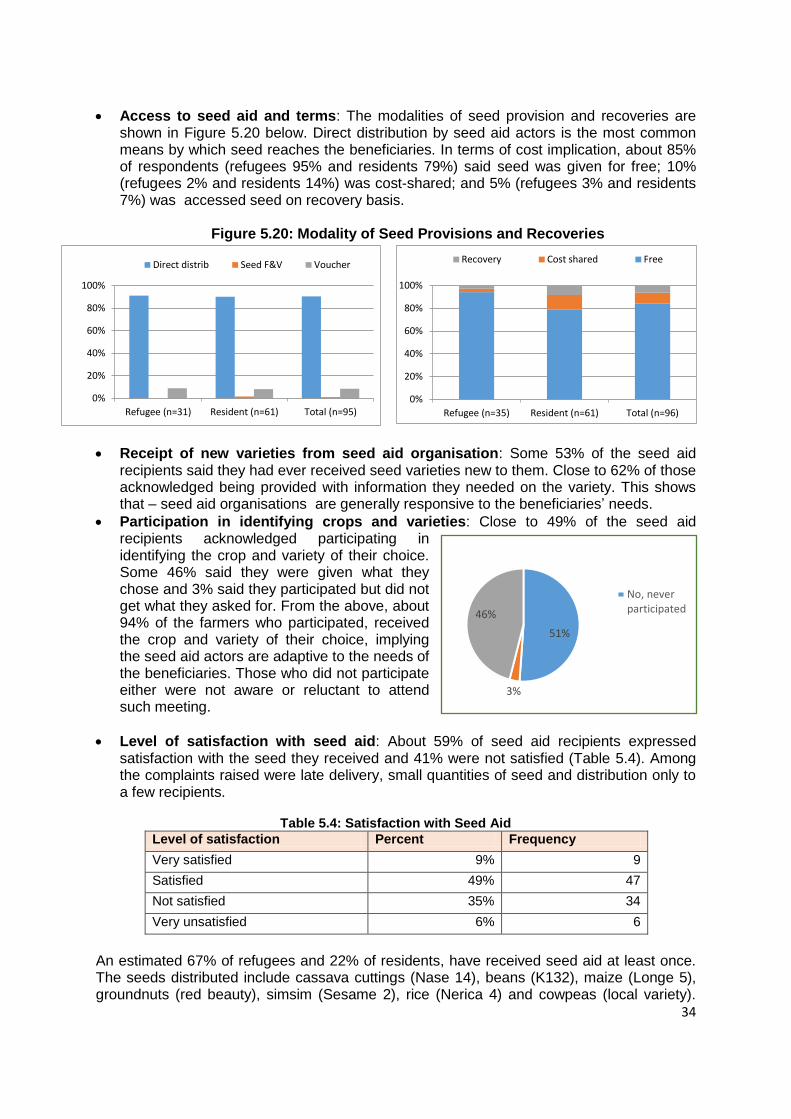
34
0%
20%
40%
60%
80%
100%
Refugee (n=31) Resident (n=61) Total (n=95)
Direct distrib Seed F&V Voucher
0%
20%
40%
60%
80%
100%
Refugee (n=35) Resident (n=61) Total (n=96)
Recovery Cost shared Free
51%
3%
46%
No, neverparticipated
Access to seed aid and terms: The modalities of seed provision and recoveries are shown in Figure 5.20 below. Direct distribution by seed aid actors is the most common means by which seed reaches the beneficiaries. In terms of cost implication, about 85% of respondents (refugees 95% and residents 79%) said seed was given for free; 10% (refugees 2% and residents 14%) was cost-shared; and 5% (refugees 3% and residents 7%) was accessed seed on recovery basis.
Figure 5.20: Modality of Seed Provisions and Recoveries
Receipt of new varieties from seed aid organisation: Some 53% of the seed aid recipients said they had ever received seed varieties new to them. Close to 62% of those acknowledged being provided with information they needed on the variety. This shows that – seed aid organisations are generally responsive to the beneficiaries’ needs.
Participation in identifying crops and varieties: Close to 49% of the seed aid recipients acknowledged participating in identifying the crop and variety of their choice. Some 46% said they were given what they chose and 3% said they participated but did not get what they asked for. From the above, about 94% of the farmers who participated, received the crop and variety of their choice, implying the seed aid actors are adaptive to the needs of the beneficiaries. Those who did not participate either were not aware or reluctant to attend such meeting.
Level of satisfaction with seed aid: About 59% of seed aid recipients expressed satisfaction with the seed they received and 41% were not satisfied (Table 5.4). Among the complaints raised were late delivery, small quantities of seed and distribution only to a few recipients.
Table 5.4: Satisfaction with Seed Aid
Level of satisfaction Percent Frequency
Very satisfied 9% 9
Satisfied 49% 47
Not satisfied 35% 34
Very unsatisfied 6% 6
An estimated 67% of refugees and 22% of residents, have received seed aid at least once. The seeds distributed include cassava cuttings (Nase 14), beans (K132), maize (Longe 5), groundnuts (red beauty), simsim (Sesame 2), rice (Nerica 4) and cowpeas (local variety).

35
There are two categories of seed aid actors, namely the government and donor community Most of the seed aid at the district level is handled in collaboration with the Production Department to ensure the right quantity and quality of seed is delivered. Seed aid is designed as a short-term remedy meant to assist refugees and host community by making them less dependent of food ration and other handouts for their livelihoods after three seasons. Consequently, the proportion of households receiving seed aid reduces by each round of distribution. The main areas of complaint about seed aid included late delivery, small quantities given to beneficiaries and the limited number of recipients. A few complained about the low level of involve ement in identifying crop and varieties of their choice. Other complaints were related to the limited number of crops and varieties that are distributed through seed aid which, affects varietal suitability and resilience of the seed system, especially in in time of crises or disasters.

36
0%
20%
40%
60%
80%
31%
23% 15%
8%
8%
8% 8%
Sesame Varieties (N=13)
Sesame 2
local
Acord
Black
Gure
Gwere
White
27%
27% 18%
9%
9%
9%
Beans Varieties (n=11)
local
Nabe 15
Yellow
Kahihura
K132
K20
6.0 COMMERCIAL SEED SUPPLY AND DEMAND
This chapter discusses seed business and constraints among key commercial seed actors, namely the grain/seed traders, agro-input dealers and local seed producers in the rural settings. It presents the main crops and seed varieties traded, levels of demand, prices, challenges faced by the seed actors and after sales services provided. The chapter complements household and key informant findings. 6.1 Local Market Seed Supply and Demand
Business profile: All the gain traders interviewed in the local markets observed that farmers buy some of the grains for planting. Grain trade is undertaken by both male and female, with varying levels of education from no formal education (19%), primary education (50%), to secondary education (31%). The majority of the traders (63%) have been in the seed/grain business for less than 5 years, about 31% for 5-10 years and 6% for more than 10 years. Some 69% of the traders operate on a full-time basis and 31% on part-time basis. The seed/grain business: The most common seed/grain sold are beans (reported by 69% of the traders); sesame (69%); groundnuts (44%); sorghum (38%), pigeon peas and maize (25%). Rice (6%), finger millet, cow peas and green grams (13%) are the least traded (Figure 6.1). In terms of volume, the most traded was sesame, followed by beans, groundnuts, finger millet and cowpeas in that order. These are purchased both for home consumption and for planting.
Figure 6.1: Crop Seed in the Market
The common varieties sold in the market are shown in Figure 6.2, with at least four different varieties for beans, sesame, groundnuts and maize in the market. Some of the varieties in the market are second or even third generations of improved varieties.
Figure 6.2: Seed Varieties in the Market
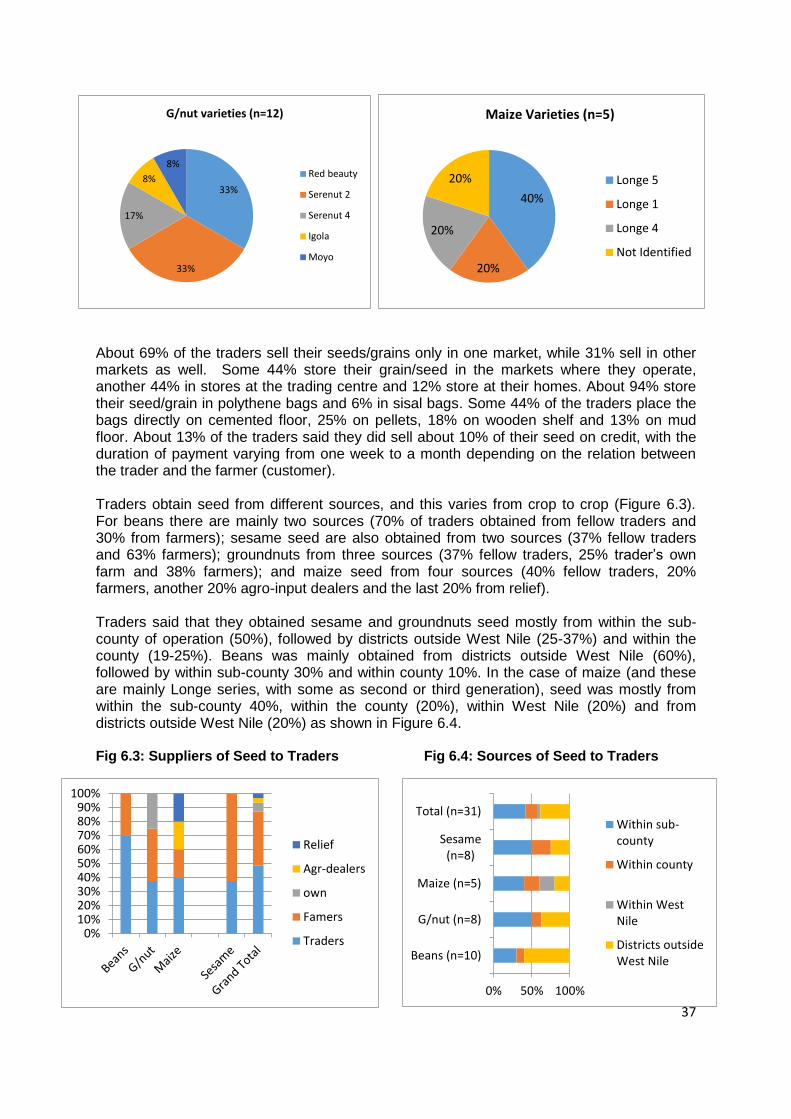
37
33%
33%
17%
8%
8%
G/nut varieties (n=12)
Red beauty
Serenut 2
Serenut 4
Igola
Moyo
0%10%20%30%40%50%60%70%80%90%
100%
Relief
Agr-dealers
own
Famers
Traders
0% 50% 100%
Beans (n=10)
G/nut (n=8)
Maize (n=5)
Sesame(n=8)
Total (n=31)Within sub-county
Within county
Within WestNile
Districts outsideWest Nile
40%
20%
20%
20%
Maize Varieties (n=5)
Longe 5
Longe 1
Longe 4
Not Identified
About 69% of the traders sell their seeds/grains only in one market, while 31% sell in other markets as well. Some 44% store their grain/seed in the markets where they operate, another 44% in stores at the trading centre and 12% store at their homes. About 94% store their seed/grain in polythene bags and 6% in sisal bags. Some 44% of the traders place the bags directly on cemented floor, 25% on pellets, 18% on wooden shelf and 13% on mud floor. About 13% of the traders said they did sell about 10% of their seed on credit, with the duration of payment varying from one week to a month depending on the relation between the trader and the farmer (customer). Traders obtain seed from different sources, and this varies from crop to crop (Figure 6.3). For beans there are mainly two sources (70% of traders obtained from fellow traders and 30% from farmers); sesame seed are also obtained from two sources (37% fellow traders and 63% farmers); groundnuts from three sources (37% fellow traders, 25% trader’s own farm and 38% farmers); and maize seed from four sources (40% fellow traders, 20% farmers, another 20% agro-input dealers and the last 20% from relief). Traders said that they obtained sesame and groundnuts seed mostly from within the sub-county of operation (50%), followed by districts outside West Nile (25-37%) and within the county (19-25%). Beans was mainly obtained from districts outside West Nile (60%), followed by within sub-county 30% and within county 10%. In the case of maize (and these are mainly Longe series, with some as second or third generation), seed was mostly from within the sub-county 40%, within the county (20%), within West Nile (20%) and from districts outside West Nile (20%) as shown in Figure 6.4. Fig 6.3: Suppliers of Seed to Traders Fig 6.4: Sources of Seed to Traders

38
-
1,000
2,000
3,000
4,000
5,000
6,000
Price/kg.now Price onemonth befor
planting
Price atplanting
Beans G/nut
Maize Sesame
0%
5%
10%
15%
20%
25%
30%
35%
40%
45%
Jan Feb Mar AprMay
Jun Jul Aug Sep Oct Nov Dec
Beans(n=27)
G/nut(n=19)
56%
88%
60% 70% 69%
33%
13%
40% 20% 25%
0%
10%
20%
30%
40%
50%
60%
70%
80%
90%
100%
Beans (n=9)G/nut (n=8)Maize (n=5) Sesame(n=10)
Overall(n=32)
Not clean
Fairly clean
Clean
Grain/seed prices: Prices in the local markets, varied depending on the time of the season with the highest prices at planting time. Sesame presented the highest increase in price of nearly UGX 1,500 per kg, followed by beans (UGX 700 per kg), groundnuts (UGX 500 per kg) and maize (UGX 200 per kg) as shown in Figure 6.5. Generally the peak demand for seed is April-May and July-August, corresponding to the first and second planting seasons. Maize, groundnut and bean seeds are more demanded in April-May (first rain season) and sesame seed in June-August (Figure 6.6). Fig 6.5: Average Prices in the Local Market Figure 6.6: Demand Period for Seed
Seed quality: Between 56% and 88% of the traders classified their grain/seed as clean, 13-40% as fairly clean and 5-10% as not clean. Groundnuts seed was considered by the traders as the cleanest, followed by maize, sesame and beans (Figure 6.7). While this may appear to be inconsistent with farmers’ perception which rated seed from the local market at 80-85% clean, the figure is actually in line with farmers’ perception, especially when “clean” and “fairly clean” are combined (making the rating of clean seed as 88-94%). Again as is the case with the rating by farmers, the traders’ ratings are not based on data supported by some experiment or parameters of purity, but rather a subjective opinion.
Figure 6.7: Physical Quality of Seed in the Market

39
0%
20%
40%
60%
80%
100%
Clean outimpurities
Sort outbroken ones
Sortaccording to
varieties
Gradeaccording to
size
Packageaccording to
demand
Display freshand old
productsseparately
Sell grain andseed
separately
Yes No
Traders reported undertaking some limited efforts to improve the commercial value of their grain/seed. These included cleaning out impurities, sorting according to demand, sorting broken ones, and sorting according to varieties (Figure 6.8).
Figure 6.8: Activities Undertaken to Improve Commercial Value of Seed/Grain (n=8)
6.2 Agro-input Dealers
Business profile: Complete data was received and analysed from eight agro-input dealers, five of them at the district headquarters and three at sub-county level. Out of the eight, five were males and three females. About 25% of the agro-input dealers are in the youth category (20-35 years), 62% may be classified as being in the productive age group (35-65 years) and 13% as elderly (above 65 years). The agro-input dealers have attained reasonable level of education, with 38% having attained secondary education and 62% tertiary education. This implies that the agro-input dealers are able to comprehend their business demands and plan accordingly. Most of the agro-input dealers have been in the business for over 10 years (62%), while only 12% have been in the business for less than 5 years. Close to 63% of the agro-input dealers operate at the district headquarters where there is sizeable demand for inputs, with Arua Municipality having the highest number of agro-input dealers (reported to be about 12). In many instances, only one agro-input dealer may operate in a whole county, with some counties not even having any agro-input dealer. In terms of business ethics, only one agro-input dealer was found to be having crop seed and chemicals as a stand-alone business entity and following recommended safe handling and storage practices, while the rest mixed up crop seeds and chemicals with other items including food items such as sugar, cooking oil and general merchandise. Seed sales: Virtually all agro-input dealers sell vegetable seed; 88% sell certified crop seed, agro-chemicals and hand tools; 50% sell fertilizers and other equipment; and 25% sell animal ploughs, animal drugs and feeds. The main types of seed sold include vegetable seed, oilseed (groundnuts and sesame), cereals (maize, sorghum, rice) and pulses (beans and soya beans). Although seed are sold mainly on cash basis, some 63% of the agro-input dealers said they sold 2-10% of their seed on credit to farmers whom they know and trust. Figure 6.9 shows the various types of seed sold by agro-input dealers. Although none of the agro-input dealers visited displaced cassava cuttings in their shops, three of them mentioned selling on order (i.e. cutting the cassava stems from their own gardens to supply clients on order).

40
0%10%20%30%40%50%60%70%80%90%
100%
Figure 6.9: Types of Seed Sold by Agro-input Dealers (n=8)
According to the agro-input dealers, apart from vegetable seed, the top five crop seed demanded are: maize (75%), beans (63%), groundnuts and sorghum (50%), and rice, simsim and soya beans (38%). Table 6.1 shows the varieties commonly sold by the agro-input dealers varieties.
Table 6.1: Most Common Varieties Sold by Crop
Crop Most common varieties sold
Maize Longe 5, Longe 4, Longe 10, Pannar
Beans K132, K131, Nabe 4
Groundnuts Serenut 2
Sorghum Sesso 3, Serena
Rice Superica 2, Nerica 4
Simsim Sesame series
Soya beans Maksoy, Nam soy
Table 6.2 shows varieties, prices, quantities sold, highest period of demand and main suppliers of the five leading crop seed. Highest sales were recorded by the main agro-input dealer based in Arua town, who sold to individual farmers and obtained contracts from SAA such as DRC and CARITAS.
Table 6.2: Crops and Varieties Sold
Particulars Maize Beans Sorghum Ground-nuts
Soya bean
Longe5 Longe4
Pannar K132 K131 Nabe Sesso Serena Serenut 2
Namsoy
Maksoy
Common packing unit
5kg 5kg 5kg 1kg 1kg 1kg 2kg 2kg 2kg 2kg 2-5kg
Current price (UGX/kg)
4,500 4,500 6,500 5,000 5,000 5,000 2,000 2,000 4,000 3,000 4,500
Price at Planting 4,500 4,500 6,500 5,000 5,000 5,000 2,000 2,000 4,000 3,000 4,500
Price one month after planting
4,500 4,500 6,500 5,000 5,000 5,000 2,000 2,000 4,000 3,000 4,500
Average qty bought by farmers (kg)
2-5kg 5kg 4kg 2kg 2kg 2kg 2kg 2kg 5-6kg 2kg 2kg
Quantity sold last season (tons)
0.3-1 0.2-0.5 0.5-1.5 0.2-6.5 0.3-0.5 0.2-1 0.3-0.5 0.1-0.3 0.3-0.5 0.1-0.3 0.3-1.5
Months of highest demand
First rains April-May; and second rains July-August
Main suppliers Victoria Seed, NASECO, East African Seed, Container Village, Kampala
Seed Producers and Associations
See beans
District Associations,

41
0% 10% 20% 30% 40% 50% 60% 70% 80%
Provide transport
Extension services
Follow-up visits
Demonstration sites
Calling clients on phone
Radio talk shows
Replace seed if poor germination
Take inputs to clients
Seed Producers
Fertilizer demand and supply: About 50% of the agro-input dealers sold fertilizers and 50% did not sell due to lack of demand. Only 20-25% of the fertilizers sold were utilized for crop production and 75-80% for vegetable production. Only 25% of the dealers sold all three fertilizers, Urea, NPK and DAP, while the others sold only one type - mostly DAP. The main agro-input dealer in Arua Municipality sold up to 1ton of a particular fertilizer in a season, while those in rural areas sold 100-250kg. At the time of the assessment, it was only the agro-input dealer in Arua Municipality who had some fertilizer in stock and was expecting more within a fortnight. Table 6.3 shows fertilizer demand and supply situation, with generally low usage, attributed to: (i) the fact that some farmers consider their soil fertility good enough and think that applying fertilizer would “spoil” their soils; (ii) the high cost of fertilizer; and (iii) the lack of knowledge on usefulness of fertilizer in boosting crop yields.
Table 6.3: Fertilizer Demand and Supply
Particulars Commonly Sold Fertilizer
Urea NPK DAP
Current price (UGX/kg) 3,000-4,000 2,500-4,000 3,000-4,000
Average quantity bought by farmers (kg)
2-15kg 3-15kg 2-15kg
Quantity sold by dealer last season (tons)
0.2-0.6 0.3-1.0 0.3-0.5
Quantity in stock at time of visit (tons)
0-0.1 0-1 0-0.5
Month of highest demand April-June; and August-September
Main suppliers Balton, General and Allied, Container Village in Kampala
After sales services and feedback: A number of agro-input dealers provide after sales services to their customers, in the form of promotional activities, advice, extension services and demonstrations (Figure 6.10). Most dealers followed-up on their clients and showed them how to plant the seed or apply the fertilisers, how to identify and control pests, spacing and other related agronomic practices. Some 38% have established demonstration gardens which they use as centres for technology dissemination during field days. A few others (25%) call their clients on phone to find out overall performance and even replace the seeds if germination is poor. One of the agro-input dealers uses the radio to air out advice and tips on farming.
Figure 6.10: After Sales Services Provided by Agro-input Dealers (n=8)
The agro-input dealers said the farmers usually provided them both positive and negative feedback on germination rates, variety performance, pest and disease resistance and overall crop quality. Complaints raised by farmers include the adulterated nature of seeds on the
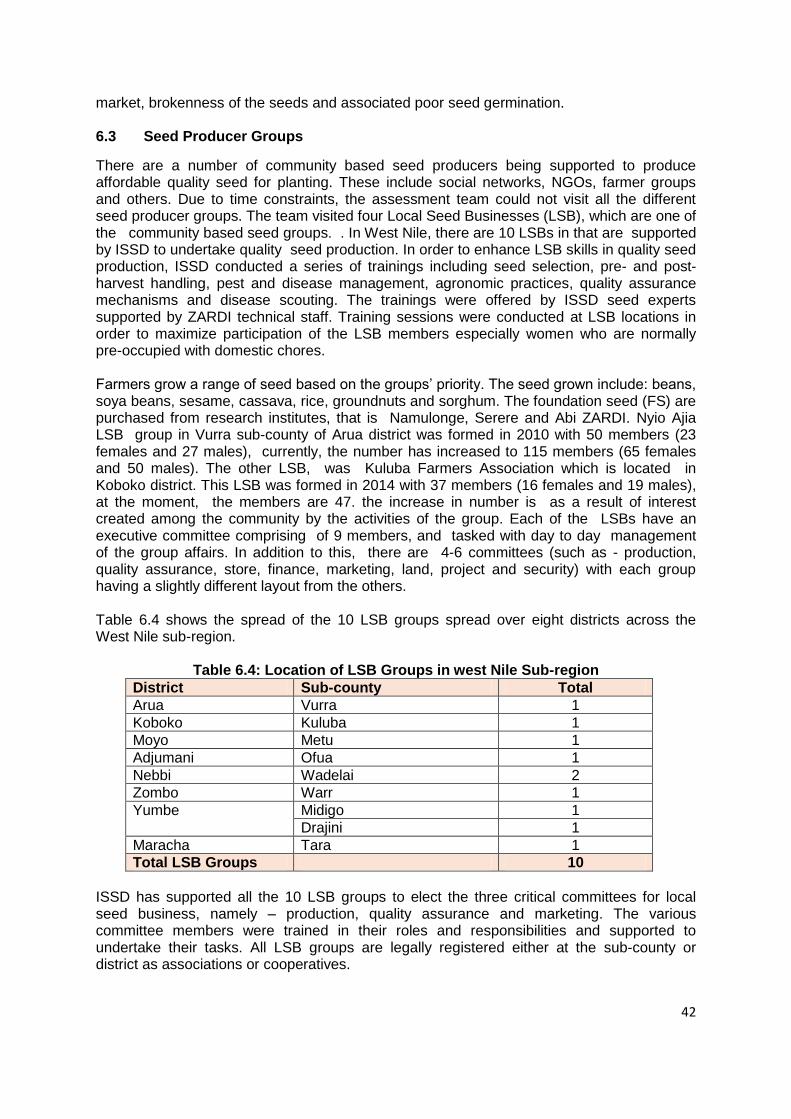
42
market, brokenness of the seeds and associated poor seed germination. 6.3 Seed Producer Groups
There are a number of community based seed producers being supported to produce affordable quality seed for planting. These include social networks, NGOs, farmer groups and others. Due to time constraints, the assessment team could not visit all the different seed producer groups. The team visited four Local Seed Businesses (LSB), which are one of the community based seed groups. . In West Nile, there are 10 LSBs in that are supported by ISSD to undertake quality seed production. In order to enhance LSB skills in quality seed production, ISSD conducted a series of trainings including seed selection, pre- and post- harvest handling, pest and disease management, agronomic practices, quality assurance mechanisms and disease scouting. The trainings were offered by ISSD seed experts supported by ZARDI technical staff. Training sessions were conducted at LSB locations in order to maximize participation of the LSB members especially women who are normally pre-occupied with domestic chores. Farmers grow a range of seed based on the groups’ priority. The seed grown include: beans, soya beans, sesame, cassava, rice, groundnuts and sorghum. The foundation seed (FS) are purchased from research institutes, that is Namulonge, Serere and Abi ZARDI. Nyio Ajia LSB group in Vurra sub-county of Arua district was formed in 2010 with 50 members (23 females and 27 males), currently, the number has increased to 115 members (65 females and 50 males). The other LSB, was Kuluba Farmers Association which is located in Koboko district. This LSB was formed in 2014 with 37 members (16 females and 19 males), at the moment, the members are 47. the increase in number is as a result of interest created among the community by the activities of the group. Each of the LSBs have an executive committee comprising of 9 members, and tasked with day to day management of the group affairs. In addition to this, there are 4-6 committees (such as - production, quality assurance, store, finance, marketing, land, project and security) with each group having a slightly different layout from the others. Table 6.4 shows the spread of the 10 LSB groups spread over eight districts across the West Nile sub-region.
Table 6.4: Location of LSB Groups in west Nile Sub-region
District Sub-county Total
Arua Vurra 1
Koboko Kuluba 1
Moyo Metu 1
Adjumani Ofua 1
Nebbi Wadelai 2
Zombo Warr 1
Yumbe Midigo 1
Drajini 1
Maracha Tara 1
Total LSB Groups 10
ISSD has supported all the 10 LSB groups to elect the three critical committees for local seed business, namely – production, quality assurance and marketing. The various committee members were trained in their roles and responsibilities and supported to undertake their tasks. All LSB groups are legally registered either at the sub-county or district as associations or cooperatives.
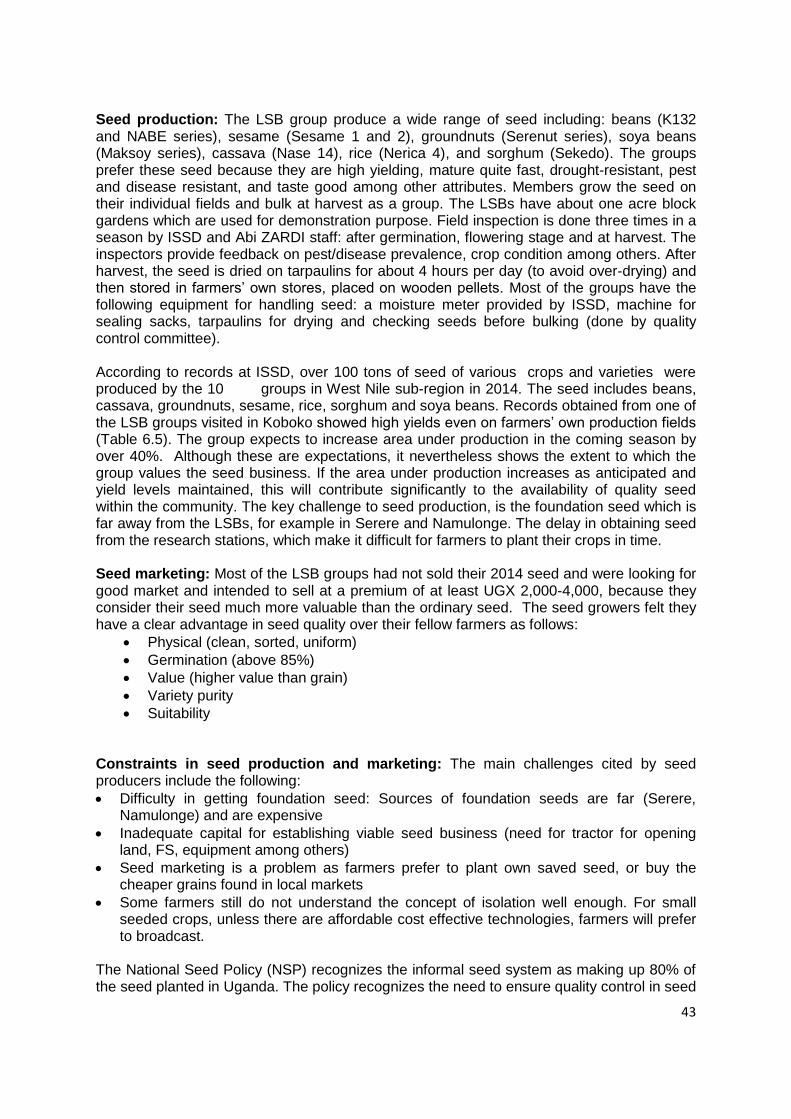
43
Seed production: The LSB group produce a wide range of seed including: beans (K132 and NABE series), sesame (Sesame 1 and 2), groundnuts (Serenut series), soya beans (Maksoy series), cassava (Nase 14), rice (Nerica 4), and sorghum (Sekedo). The groups prefer these seed because they are high yielding, mature quite fast, drought-resistant, pest and disease resistant, and taste good among other attributes. Members grow the seed on their individual fields and bulk at harvest as a group. The LSBs have about one acre block gardens which are used for demonstration purpose. Field inspection is done three times in a season by ISSD and Abi ZARDI staff: after germination, flowering stage and at harvest. The inspectors provide feedback on pest/disease prevalence, crop condition among others. After harvest, the seed is dried on tarpaulins for about 4 hours per day (to avoid over-drying) and then stored in farmers’ own stores, placed on wooden pellets. Most of the groups have the following equipment for handling seed: a moisture meter provided by ISSD, machine for sealing sacks, tarpaulins for drying and checking seeds before bulking (done by quality control committee). According to records at ISSD, over 100 tons of seed of various crops and varieties were produced by the 10 LSB groups in West Nile sub-region in 2014. The seed includes beans, cassava, groundnuts, sesame, rice, sorghum and soya beans. Records obtained from one of the LSB groups visited in Koboko showed high yields even on farmers’ own production fields (Table 6.5). The group expects to increase area under production in the coming season by over 40%. Although these are expectations, it nevertheless shows the extent to which the group values the seed business. If the area under production increases as anticipated and yield levels maintained, this will contribute significantly to the availability of quality seed within the community. The key challenge to seed production, is the foundation seed which is far away from the LSBs, for example in Serere and Namulonge. The delay in obtaining seed from the research stations, which make it difficult for farmers to plant their crops in time. Seed marketing: Most of the LSB groups had not sold their 2014 seed and were looking for good market and intended to sell at a premium of at least UGX 2,000-4,000, because they consider their seed much more valuable than the ordinary seed. The seed growers felt they have a clear advantage in seed quality over their fellow farmers as follows:
Physical (clean, sorted, uniform)
Germination (above 85%)
Value (higher value than grain)
Variety purity
Suitability Constraints in seed production and marketing: The main challenges cited by seed producers include the following:
Difficulty in getting foundation seed: Sources of foundation seeds are far (Serere, Namulonge) and are expensive
Inadequate capital for establishing viable seed business (need for tractor for opening land, FS, equipment among others)
Seed marketing is a problem as farmers prefer to plant own saved seed, or buy the cheaper grains found in local markets
Some farmers still do not understand the concept of isolation well enough. For small seeded crops, unless there are affordable cost effective technologies, farmers will prefer to broadcast.
The National Seed Policy (NSP) recognizes the informal seed system as making up 80% of the seed planted in Uganda. The policy recognizes the need to ensure quality control in seed

44
production, seed conditioning and storage of Quality Declared Seed (QDS). The support provided to LSB groups by ISSD which include training, supervision, technical backstopping and inspection are thus in line with the seed policy, which recognizes the seed produced by such groups as QDS. Furthermore, some District LG, with support from ISSD have developed Quality Seed Resolutions/Regulations, which among others emphasize the need for quality seed and recognizes the quality of seed produced by LSB groups. It is therefore important that efforts are made to develop capacity of the LSB groups and other local seed producers and to link them to foundation seed sources and seed markets.
By the nature of their proximity, grain traders are in a position to contribute to the attainment of household seed security through sales of second or third generation seed, which are considered near to the farmer and generally affordable. Some traders, however lack the knowledge in seed management as a business, have poor storage facilities and practices, and undertake minimum efforts to improve the commercial value of their grain/seed. The agro-input dealers on the other hand are considered far away by the farmers and their products generally expensive. They too have limited seed business management skills, low product knowledge and poor handling and storage. Grain/seed traders and agro-input dealers need to be supported to develop their capacity to handle seed business in a better way and need to be monitored to ensure conformity to quality seed regulations.
A Nerica 4 Rice Seed Garden (on the left) and NABE 4 Beans Seed Garden (on the right) belonging to Andevuku LSB Group. There is potential for increasing quality seed production

PART THREE: CONCLUSIONS AND RECOMMENDATIONS

7.0 CONCLUSION AND RECOMMENDATIONS
7.1 Summary of Findings and Conclusion
The SSA revealed the following key findings and conclusion in respect to household food and nutrition security and household seed security: Household food and nutrition security: Quite a diversity of crops are grown in West Nile, either as pure stands or intercrop, reflecting the different agro-ecological zones in the sub-region. The main crops grown are cassava, maize, groundnuts, simsim, beans and sorghum. Other crops include sweet potatoes, cowpeas, pigeon peas, rice and local and exotic vegetables. Over the past five years, some varieties have disappeared while new ones have been introduced in line with farmers’ preferences. Generally households have access to food and income to meet their needs and are not faced with very high dependency burden. Considering the number of times members of the household eat different food items, food availability can be considered as “adequate”. Some of the refugee households with limited or no land experienced food shortages due to their inability to fend for their families without food aid. There is generally very little intake of animal protein, vitamins and other nutrients in all households and this makes the households prone to malnutrition. Household seed security: The conclusion on household seed security for the five elements of the SSCF is as follows:
Availability of adequate seed, timing and proximity: From the farmers’ perspective seed is generally available in adequate quantity at the time of planting, especially informal seed through own source or local markets. A large number of farmers (50-60%) felt that seed from social networks, CBS and seed aid was available but not enough. Over 50% of residents and 71% of refugees considered seed from agro-input dealers to be far away. Thus although farmers’ perception is that seed is generally available, there are concerns about their timely availability and proximity. By their proximity, grain traders are expected to contribute to household seed security through sales of second or third generation seed, which are considered near to the farmer. Some of the traders, however lack the knowledge in seed management as a business, have poor storage facilities and practices, and undertake minimum efforts to improve the commercial value of their grain/seed. The agro-input dealers on the other hand are considered far away by the farmers and have limited linkages with producer groups. They too have limited seed business management skills, low product knowledge and poor handling and storage.
Seed access: Seed from the local markets and own seed are generally considered the main seed sources. Other seed sources include SNS, CBS, seed aid and agro-input dealers. Household survey data show that seed from local markets contributed 55-70% of the seed planted in 2014, with the exception of cassava, sweet potatoes and exotic vegetables. OSS (45-47%) and SNS (30-32%) were most pronounced seed sources for roots and tubers. CBS including SNS and LSB were considered by some farmers as affordable while others said they were expensive. Regarding other sources of improved seed, the major concern by farmers was the high prices of seed from agro-input dealers. In the case of seed aid, farmers complained about late delivery, the small quantities given to recipients and the limited number of beneficiaries reached. The main means of acquisition are cash (75%), free delivery (25%), and credit and barter (3%), which some farmers said have limited them from accessing quality seed mainly due to lack of money.

47
Supporting community-based seed production initiatives and creating linkages between agro-input dealers and farmer groups could reduce on costs of seed through economies of scale and enhance access to seed.
Seed quality: Farmers expressed their satisfaction with the overall seed cleanliness and rates of germination and considered seed from agro-input dealers and CBS to be more clean than their own saved seed and seed from the market. Although farmers were of the view that the quality of seed planted was good, discussions with key informants and participants at FGD cited poor quality of seed on the market, poor seed/grain storage and attacks by pests during seed storage as some of the factors affecting seed security in their area. Their views are echoed by the LG, some of whom have developed Quality Seed Resolutions/Regulations, which among others emphasizes the need for quality seed. The National Seed Policy recognizes the informal seed system as making up 80% of the seed planted in Uganda. The policy recognizes the need to ensure quality control in seed production, seed conditioning and storage of Quality Declared Seed (QDS). The support provided to LSB groups by ISSD which include training, supervision, technical backstopping and inspection are thus in line with the seed policy, which recognizes the seed produced by such groups as QDS. It is therefore important that efforts are made to develop capacity of the LSB groups and other CBS groups to produce high quality. There is a need to carry out a research/tests on quality to determine germination rates, physical purity and seed health. At the same time farmers should be trained in seed management, post-harvest handling and seed selection. The local government should be encouraged to effect bye-laws on sale of expired and fake seed through effective monitoring of seed dealers and traders.
Varietal suitability: Overall, about 75% of the farmers like the varieties they grow because they posses such attributes as high yields, short maturity duration, and resistance to pests, diseases and drought. Farmers indicated that varieties of the major crops have done well in their agro-ecologies and coped with the prolonged dry spells over the past few years. There have been a number of new varieties of crops such as cassava, simsim, groundnuts, maize, beans and rice that have been introduced and adopted by the community. All these have significantly contributed to the progressive increase in the use of improved varieties and retention of some of the local varieties. For some of the main crops such as cassava, maize, beans, sorghum, groundnuts and simsim, more than seven varieties are being grown. Some of the key informants and participants at FGD singled out the lack of information about some of the varieties they are provided and limited involvement in decision-making regarding variety introductions as their main concerns regarding varietal suitability. Others complained of the limited crops and varieties distributed through seed aid, which they say affects varietal suitability and resilience of the seed system, especially in cases of crises or disasters.
Resilience of the seed system: Despite the fact that there are several seed sources and seed varieties in the West Nile, the sub-region continues to face crises and disasters, which renders the households prone to seed insecurity (low resilience). The ability of the farmer to have access to adequate and sufficient quantities of adapted and preferred seed “at all times in both good and bad cropping seasons” has been affected by prolonged dry spell, floods, and influx of refugees over the recent past. On a positive note, the National Seed Policy and LG seed quality regulations recognise informal seed sector as a bona fide source of quality seed. Promotion of community seed production, enforcement of seed quality regulations and provision of information to farmers about seed sources, prices and application will go a long way in improving the resilience of the seed system.

48
7.2 Recommendations
On the basis of the SSA findings and conclusion above, the following recommendations are made. The recommendations focus on the need to increase the availability of and access to quality seeds; improve quality, varietal sustainability and resilience of the seed system; build capacities of key actors to improve on their production and business skills; and address issues of enabling environment in seed security. 1. In order to increase the availability of quality seed, ISSD should strengthen the market
component of LSB groups through capacity building and private sector partnerships and creating linkages with agro-input dealers and producers of foundation seed. Grain/seed traders and agro-input dealers need to be supported to develop their capacity to handle seed business in a better way by training them in agro-input business skills, and in product knowledge and safe use handling.
2. To address farmers concerns about timely availability of seed and proximity, providers of seed (such as seed aid actors and agro-input dealers) need to device ways of bringing seed closer to the beneficiaries and the farmers, so that seed of adequate quantity is available in a timely manner.
3. With a view to increasing crop yields, training should be intensified in GAP, PHH, storage and use of yield-enhancing inputs such as organic and inorganic fertilizers. Farmers also need to sensitized on proper farming practices (crop rotation, fallowing) and water harvesting and conservation so as to conserve the environment. Such training should be organized in partnership with LG at the district and sub-county levels.
4. To help reduce on costs of seed and make it more accessible through economies of scale, efforts should be made at creating linkages between agro-input dealers and farmer groups. Agro-input dealers should be encouraged to undertake promotional activities such as establishment of demonstration garden aimed at providing information to farmers about their products.
5. To address issues on quality of seed, farmers should be trained in seed management, post-harvest handling and seed selection. Farmers through their groups should be encouraged to carry out research/tests on quality to determine germination rates, physical purity and seed health.
6. In order to enhance varietal suitability, farmers should regularly be provided with information about the varieties on the market or the ones they are provided as seed aid. In the case of seed aid, farmers should be involved in decision-making regarding variety introductions.
7. To increase resilience of the seed system, efforts should be made to increase seed production through the informal seed sector by intensifying training in seed production, management and storage.
8. In order to provide an enabling environment for seed security, the local government should be encouraged to enforce quality seed regulations and bye-laws on sale of expired/fake, land use and stray animals to reduce on crop damage and minimize on environmental degradation. This can be done in partnerships involving the local government at district and sub-county levels, relevant private sector groups/associations, key seed actors (distributors, sellers, producers) and development partners.

ANNEXES

50
ANNEX 1a: LIST OF KEY INFORMANTS INTERVIEWED
No Name Organization Designation Telephone/Email
1 Gertrude Badaru Arua District LGV District Agricultural Officer
0772653387 [email protected]
2 Samuel Abio Samuel
Koboko District LGV District Agricultural Officer
0755 934920/791066369 [email protected]
3 Judith Azakozu Danish Refugee Council (DRC)
Project Manager 0772772173 [email protected]
4 Modest Arima Odupi Sub-county LGIII Sub-county Chairperson
0774420978 [email protected]
5 Bosco Driwale Odupi Sub-county LGIII Chairperson, Farmer Fora
0781715909 [email protected]
6 Augustus Wadri Vurra Sub-county LGIII Chairperson, Nyio Ayavu Farmers Association (NAFA)
0782666102 [email protected]
7 Leo Draniga Vurra Sub-county LGIII Secretary General, NAFA
07820884755 [email protected]
8 Dosteo Adomati Vurra Sub-county LGIII Seed Quality Controller, Nyio-Ajia and NAFA
0777450432
9 James Lam Rigbo Sub-county LGIII Refugee Welfare Council (RWC) II Chairperson
0771238197 [email protected]
10 Bakam Magai Rigbo Sub-county LGIII Chairperson, Odobu 2 Cluster
11 John Isse Moyo District Farmers’ Association (MDFA)
Chairperson, MDFA 0782803803
12 Jane Lugua Moyo District Farmers’ Association (MDFA)
Project Coordinator, MDFA
0782306196
13 Tom Mamgbi Moyo District LGV District Agricultural Officer
0756188584
14 Phillip Amamani Moyo District LGV - Metu Agricultural Officer 0771462959
15 Patrick Obukunyang
Danish Refugee Council (DaRC)
Project Officer, Adjumani Office
0774693922
16 Lydia Kutegeka Lutheran World Federation (LWF)
Livelihoods Officer, Adjumani
0773291261
17 Anthony Leku Adjumani District LGV District Agricultural Officer
0772182839
18 Patrick Adowa NRC Project Officer, Adjumani Office
0787929457
19 Maurice Okunzi Operation Wealth Creation (OWC)
Coordinator, Adjumani 0772677120

51
ANNEX 1b: LIST OF GROUPS MET FOR FOCUS GROUP DISCUSSIONS
Name of Group Number of Participants
Village Parish Sub-county
District
1 Lugbari Farmers’ Group 10 Lower Ajia Lugbari Odupi Arua
2 Lower Ongurua Farmers; Group
10 Ongurua Imvepi Odupi Arua
3 Ocea Old Case Refugee Group
10 Ocea Ocea Rigbo Arua
4 Marikulu Farmers’ Group 10 Kagoropa Ayipe Kuluba Koboko
5 Amadrimaa Farmers’ Group 16 Pakamyidra Patabo
Ayiro Metu Moyo
6 Kadabara Farmers’ Group 17 Cinya West Pamoyi Metu Moyo
7 Andevuku Mixed Farm Group 10 Kureku East
Bacere Ofua Adjumani
8 Aliwara Refugees and Host Community Group
14 Aliwara Mungula Itirikwa Adjumani
9 Urugua Refugee Group 26 Urugua Mungula Itirikwa Adjumani
10 Kulukulu Refugees and Nationals
20 Kulukulu Ayiri Ukusijoni Adjumani
Total Participants 143
ANNEX 2: CHANGES IN CROP TRENDS OVER PAST FIVE YEARS
A: Increase in area cultivated District Crops Reasons
Arua Simsim High marketability
Used for food and income Sorghum Used for both food and income
Mixed with cassava as staple food
Seed aid and short maturity Beans Used for food and income
Part of daily menu
Good taste varieties Koboko Groundnuts Market readily available
Used for food and income
Has multiple use Simsim Market readily available
Used for food and income Cassava Main diet at household
Food security Moyo Cassava Used for food and income
Simsim High marketability

52
Used for food and income
Pest and disease resistant Sorghum Tolerant to drought and floods
Used for food and income Adjumani Cassava For food and income
High marketability
High yielding Maize For food, income and seed
Good yields
High marketability Rice High marketability
Good yields
For food and income
B: Decrease in area cultivated
District Crops Reasons
Arua Tobacco Labour intensive
Low income from the crop
Other more competing crops have emerged Cassava Destruction by stray animals and bush fire
Long maturity period
Pests and diseases Groundnuts Expensive seeds
Few people benefit from seed aid
Vermin destruction
Pests and diseases Koboko Sorghum Market not readily available
Takes long to mature Millet Labour intensive
Introduction of other crop varieties like cassava has displaced the crop
Pigeon peas Takes long to mature
Market not readily available Moyo Groundnuts Susceptible to drought and floods
Less tolerant to pests and diseases Maize Prevalence of Striga weeds
Susceptible to drought and floods Millet High labour demand
Adjumani Simsim Low yields
Pests and diseases
Limited quality seed Groundnuts Pests and diseases
Poor germination and low yields Sorghum Pests and diseases
Takes long to mature
Low/poor yields
Low marketability
Commonly destroyed by birds

53
C: Crops and varieties that have disappeared
District Crops Varieties Reasons for disappearing Origin of variety
Arua Bambara nuts Local Long maturity period Ancestors
Millet Local Labour intensive
Limited market
Issue with variety suitability
Destruction by birds
South Sudan Seed aid Ancestor
Green grams Local Expensive seed
Little interest by locals
South Sudan
Koboko Green grams Local Not tasty
No market
Community/ancestors
Mania Local Hard to grind
Bad taste
Community/ancestors
Likiria Local No market Community/ancestors
Moyo Yams Local Lack of planting material
Nigeria
Pearl millet Local Too much destruction by birds
South Sudan
Cotton Local Low price
High labour demand, e.g. sorting
Colonialists
Adjumani Pearl millet Local Commonly destroyed by birds
Labour demanding
Requires virgin land
South Sudan
Bambara nuts Local Low marketability
Lack of seeds
Takes long to cook
South Sudan
Chinese simsim (Enu)
Local Difficult to grind
Labour intensive
South Sudan
D: New variety introductions District Crops Varieties Why adopted Origin of variety
Arua Cassava TME 14 and NASE series
Short maturity period
Drought and disease tolerant
For both food and income
High yielding
Good taste
Research through NAADS, Seed aid (e.g. DRC)
Simsim Sesame I and II High yielding
Short maturity
High marketability
Research and seed aid
Groundnuts Serenut 3 and 4 Short maturity
High yielding
Resistant to pests and diseases
Through NAADS and seed aid

54
Drought resistant
Tasty Maize Longe 5 Short maturity
Drought resistant
High yielding
Seed aid
Koboko Cassava TME 14 and NASE 14
Short term (matures fast)
Drought resistant
High yielding
High marketability
Research through the NAADS program
Simsim Sesame 1, 2, 3 Short term (matures fast)
High yielding
Drought resistant
Pest and disease tolerant
High marketability
Serere (Soroti)
Maize Longe series High yielding
Drought resistant
High marketability
Abi ZARDI and through the NAADS program
Moyo Cassava TME 14 and NASE 14
Has market for both stalks and roots
High yielding
Short maturity period (9 months)
Good taste
Abi ZARDI through NAADS and ISSD
Simsim Sesame 2 High marketability
High yielding
Serere (Soroti)
Beans NABE 4 High yielding
Cooks fast
Sweet and liked by people
Abi ZARDI through NAADS and ISSD
Groundnuts Red Beauty Good taste
High oil content
High marketability
From research through NAADS
Adjumani Cassava NASE 14 Early maturing
High yielding
Sweet taste
Seed aid (DRC, ACORD)
Rice Nerica series Early maturing
High yielding
Tolerant to Striga
Good taste
Seed aid (DRC, CEFORD) and through NAADS
Soya bean Namsoy For food and income
Nutritious
Seed aid (ACORD, CARITAS)
Beans K132 and Nabe series
Early maturing
High marketability
Cooks fast
Good taste
Abi ZARDI and NARO

55
ANNEX 3: VARIETIES OF MAIN CROPS GROWN BY DISTRICT
District Crop Major varieties
grown Rank Advantages Disadvantages
Arua Cassava TME 14 1 High yielding
Drought and disease resistant
Takes long mature
Mingoro 2 High yielding
Takes long time in the soil
Bitter
Akena 3 Short maturity
High yielding
Sweet taste
Less tolerant to diseases
Beans Agurupia 1 High yielding
Short maturity
Fast cooking
Tasty
Prone to pests and diseases
K132 2 High yielding
Short maturity
Fast cooking
Tasty
Prone to pests and diseases
Nabe series 3 High yielding
Short maturity
Fast cooking
Tasty
Prone to pests and diseases
Simsim Sesame 2 1 Short maturity
High marketability
High oil content
Explodes easily
Sesame 1 2 Does not explode easily
Available in the market
High yielding
Takes long to mature
Local 3 Does not explode easily
Takes long to mature
Pests and diseases
Groundnuts Red Beauty 1 High marketability
Varietal stability
Pests and diseases
Moderate yields
Serenut 4 2 Short maturity
Good yields
Prone to diseases
Serenut 2 3 High yielding
Drought tolerant
Long maturity period
Bad taste
Hard to grind
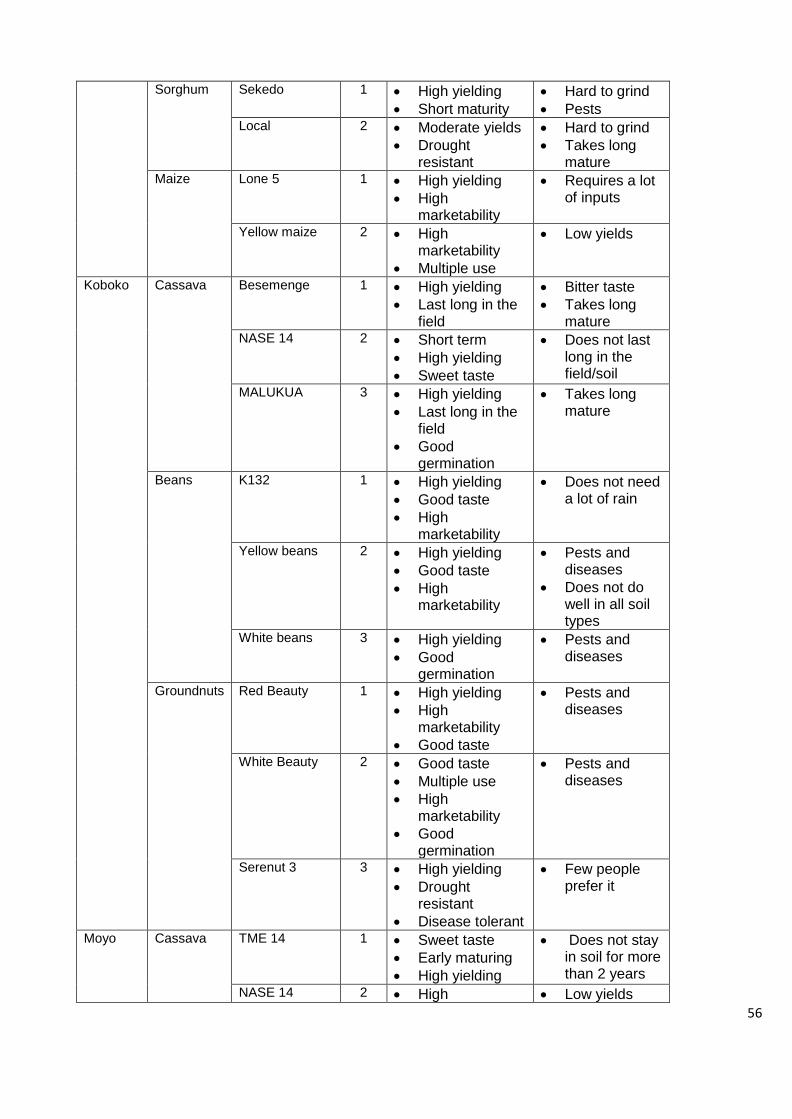
56
Sorghum Sekedo 1 High yielding
Short maturity
Hard to grind
Pests Local 2 Moderate yields
Drought resistant
Hard to grind
Takes long mature
Maize Lone 5 1 High yielding
High marketability
Requires a lot of inputs
Yellow maize 2 High marketability
Multiple use
Low yields
Koboko Cassava Besemenge 1 High yielding
Last long in the field
Bitter taste
Takes long mature
NASE 14 2 Short term
High yielding
Sweet taste
Does not last long in the field/soil
MALUKUA 3 High yielding
Last long in the field
Good germination
Takes long mature
Beans K132 1 High yielding
Good taste
High marketability
Does not need a lot of rain
Yellow beans 2 High yielding
Good taste
High marketability
Pests and diseases
Does not do well in all soil types
White beans 3 High yielding
Good germination
Pests and diseases
Groundnuts Red Beauty 1 High yielding
High marketability
Good taste
Pests and diseases
White Beauty 2 Good taste
Multiple use
High marketability
Good germination
Pests and diseases
Serenut 3 3 High yielding
Drought resistant
Disease tolerant
Few people prefer it
Moyo Cassava TME 14 1 Sweet taste
Early maturing
High yielding
Does not stay in soil for more than 2 years
NASE 14 2 High Low yields

57
marketability
Early maturing
Sweet taste Sorghum Sekedo 1 High yielding
Early maturing
Not disturbed much by birds
Pests and diseases
Seso series 2 Big seeds
Taste good
High marketability
Low yields
Prone to flooding
Serena 3 Taste good
Good yields
Less tolerant to Striga
Does not like much rain
Pigeon peas
Local mobiri 1 Good yield
Good taste
Takes long to cook
Local iti 2 Good yield
Cooks faster
Good taste
Takes longer to mature
Pests and diseases
Adjumani Cassava Nase 14 1 Disease tolerant
Early maturing
Sweet taste
High yielding
Only a few have planted due to limited cassava stalks
TME 14 2 Good taste
Early maturing
High marketability
Good yields
Easily affected by diseases
SS 4 3 Early maturing
High yielding
Prone to diseases
Cannot be inter-cropped
Maize Longe 5 1 Good yield
High marketability
Tolerant to diseases
Termites can destroy
Difficult to weed
Longe 4 2 Early maturing
Good yields
Prone to Striga weeds
Needs to be harvested early, otherwise will break
Yellow maize 3 High nutrient value
Bad taste
Low marketability
Simsim Sesame III 1 Good yield
High marketability
Difficulty in getting seeds
Required

58
Early maturing adequate rains
Iti (local) 2 Good yield
Good taste
Takes long to mature
Sesame II 3 Good yield
High marketability
Takes long to mature
Difficulty in getting seeds
Requires adequate rain
Beans K132 1 Good yields
Short maturity
Good taste
Fast cooking
High marketability
Prone to floods
Pests and diseases
Nabe series 2 Short maturity
Good taste
Fast cooking
High marketability
Prone to floods
Pests and diseases
Yellow beans 3 High marketability
Moderate yield
Good taste
Prone to pests and diseases
Small local (Indrize)
Good yield
Good taste
Fast cooking
Prone to floods