see page 3 see page 4 see page 5 see page ... - Saudi Aramco

8/17/2019 see page 29
http://slidepdf.com/reader/full/see-page-29 1/260
School of Engineering
Department of Chemical Engineering
AEROBIC BIOTRICKLING FILTRATION FOR
BIOGAS DESULFURIZATION
PhD Thesis
Directed by
Dr. David Gabriel Buguña
Dr. María del Mar Baeza Labat
Andrea Monzón Montebello
May 2013

8/17/2019 see page 29
http://slidepdf.com/reader/full/see-page-29 2/260
© Andrea Monzón Montebello, 2013
Aerobic biotrickling filtration for biogas desulfurization
© Gustavo Monzón Montebello, 2013
Cover illustration – Untitled

8/17/2019 see page 29
http://slidepdf.com/reader/full/see-page-29 3/260
Title Aerobic biotrickling filtration for biogas desulfurization
Presented by Andrea Monzón Montebello
Directors Dr. David Gabriel Buguña
Dr. María del Mar Baeza Labat
Doctoral Programme in Environmental Science and
Technology, Specialization in Environmental Technology.
Programa de Doctorat en Ciència i Tecnologia Ambientals,
Especialitat en Tecnologia Ambiental.
ICTA – Institut de Ciència i Tecnologia Ambientals.
Departament d’Enginyeria Química.
Escola d’Enginyeria.
Universitat Autònoma de Barcelona.
Bellaterra, May 2013.
The Spanish Government (MEC – Ministerio de Educación y Ciencia) provided
financial support through the Project CYCT CTM2009-14338-C03-01 and CTM2009-
14338-C03-02. The Department of Chemical Engineering at UAB is an unit of Bio-
chemical Engineering of the Xarxa de Referència en Biotecnologia de Catalunya
(XRB), Generalitat de Catalunya.

8/17/2019 see page 29
http://slidepdf.com/reader/full/see-page-29 4/260

8/17/2019 see page 29
http://slidepdf.com/reader/full/see-page-29 5/260
DAVID GABRIEL BUGUÑA, professor agregat del Departament d’Enginyeria
Química de la Universitat Autònoma de Barcelona i MARÍA DEL MAR BAEZA
LABAT, professora titular del Departament de Química de la Universitat
Autònoma de Barcelona,
CERTIFIQUEM:
Que l’enginyera química ANDREA MONZÓN MONTEBELLO ha
realitzat sota la nostra direcció el treball titulat:
“ AEROBIC BIOTRICKLING FILTRATION FOR BIOGAS
DESULFURIZATION” , el qual es presenta en aquesta memòria
i que constitueix la seva Tesi per a optar al Grau de Doctor per la
Universitat Autònoma de Barcelona.
I perquè en prengueu coneixement i consti als efectes oportuns,
presentem a l’Escola d’Enginyeria de la Universitat Autònoma de
Barcelona l’esmentada Tesi, signant el present certificat a
Bellaterra, 31 de Maig de 2013.
Dr. David Gabriel Buguña Dra. María del Mar Baeza Labat

8/17/2019 see page 29
http://slidepdf.com/reader/full/see-page-29 6/260

8/17/2019 see page 29
http://slidepdf.com/reader/full/see-page-29 7/260
to Sávio,
music and love of my life.

8/17/2019 see page 29
http://slidepdf.com/reader/full/see-page-29 8/260
8/17/2019 see page 29
http://slidepdf.com/reader/full/see-page-29 9/260
Acknowledgements
I have no words to express my gratitude to David Gabriel and Mireia Baeza, for theoutstanding scientific and technical advice and for the remarkable human support.
Research is only possible thanks to teamwork. I would like to thank all colleagues,partners, supervisors and friends I met during this work, specially,
from the Department of Chemical Engineering, UAB:Javier Lafuente, Marc Fortuny, Roger Rovira, Mabel Mora, Luis Rafael López, TérciaBezerra, Jerónimo Hernández, Juan Pedro Maestre, Óscar Prado, Shafik Husni,Armando González and Wenceslao Bonilla, from the Gas Treatment Group; JuanBaeza and Laura Rago, from GENOCOV Group; Montserrat Sarrà, Coordinator ofDoctoral Programme in Environmental Science and Technology; Lorena Ferrer,Margot Clariana, Manuel Plaza, Rosi Tello and Pili Marti, for Laboratory support; José
Luis Montesinos, Carles Solà, Julián Carrera, María Eugenia Suárez, Laura Cervera,Marina Guillén, Carles Cruz, Javier Guerrero, Gloria González, Nùria Montpart,Daniel Calleja, Ernest Marco, Mohammad Hoque and Paqui Blánquez, for teachingactivities advice and cooperation; Montserrat Martínez, Miriam Lázaro, Rosa Fuentesand Nati Campamelòs, from Secretary;
from the Department of Chemistry, UAB:Eva Arasa, Cynthia Martínez, Rosa Olivè, Sofia Almeida and Regina Carrión, fromthe Sensors and Biosensors Group;
from the Universitat Politècnica de Catalunya – UPC:Xavier Gamisans, Ginesta Rodríguez, Antoni Dorado and Xavier Guimerà, from theDepartment of Mining Engineering and Natural Resources - Manresa; José Fresno,from the Institute of Textile Research and Industrial Cooperation of Terrassa;
from the Universidad de Cádiz – UCA:Martín Ramírez, Maikel Fernández, Fernando Almengló, Domingo Cantero and JoséManuel Gómez, from the Biological and Enzymatic Reactors Group.
My sincere thanks to Raquel Gómez, from Adasa Sistemas, S.A. and to TomásMartínez, from TMI, S.L.
I thank my dear friends Angélica Santis, Rossmery Rodríguez, Nelsy Loango,Catalina Cànovas, Laura Pramparo, Natalia Tikhomirova, Isaac Fernández, MichellePognani, Tahseen Sayara, Max Cárdenas, Milja Pesic, Rebeca Contreras, FelicitasVázquez, Roberto Quirós, Lorena Fernández, Arnaud Fossen, Richard Cotê, andAndréia Anschau. I sincerely thank Sávio de La Corte, Natalia M. Montebello,Mariángel Martín and Carlos C. Monzón for edition recommendations. Finally, I thankmy dear brother Gustavo M. Montebello for the lovely cover art.
And to my beloved family, thanks once again.

8/17/2019 see page 29
http://slidepdf.com/reader/full/see-page-29 10/260
8/17/2019 see page 29
http://slidepdf.com/reader/full/see-page-29 11/260
Table of contents
Index i
List of Figures and Tables v
List of Equations ix
List of Abbreviations xi
Abstract xv
Resum xvi
Resumen xvii
1 Research motivation and thesis overview 1
2 Introduction 7
3 Objectives 41
4 General materials and methods 45
5 On-line monitoring of H2S and sulfide by a flow analyzer 87
6 Preliminary study on the on-line determination of sulfate 111
7 Neutral H2S biotrickling filtration and transition to acidic pH 133
8 Simultaneous removal of methylmercaptan and H2S 157
9 Acidic H2S biotrickling filtration 175
10 Conclusions and future work 195
11 References 203
Annexes 223

8/17/2019 see page 29
http://slidepdf.com/reader/full/see-page-29 12/260

8/17/2019 see page 29
http://slidepdf.com/reader/full/see-page-29 13/260
i
Index
List o f Figures and Tables..................................... v
List of Equations............................................................................................... ix
List of Abbreviations... .......... xi
Abst ract ........... .............xv
Resum...... .................... xvi
Resumen...... ................ xvii
Research motivation and thesis overview
1.1 Research motivation................................ 3
1.2 Thesis overview...... ...................... 4
Introduction
2.1 Atmospheric sulfur pollution................................9
2.2 Hydrogen sulfide..... ...................... 10
2.2.1 Physicochemical properties of H2S...............................10
2.2.2 Toxicology, hazards and therapeutic potential of H2S................ 12
2.3 Methylmercaptan...........................15
2.3.1 Physicochemical properties of CH3SH............................. 15
2.3.2 Toxicology and occupational hazards of CH3SH........................ 16
2.4 Sulfur compounds detection...................................17
2.4.1 Hydrogen sulfide detection................................ 17
2.4.2 Sulfide detection.....
......................... 19 2.4.3 Sulfate detection...........................21
2.5 Energy from biogas..................................22
2.6 Desulfurization technologies...............................24
2.6.1 Physicochemical technologies........................... 24
2.6.2 Biological technologies............................27
2.7 The biological sulfur cycle.......................................................................... 35
2.7.1 Sulfur-oxidizing bacteria................................................................. 37
Objectives........................41
General materials and methods
4.1 Biotrickling filter experimental setup...........................................................47
4.2 Sampling procedure................................................................................... 54
4.2.1 Gas sampling..................................................................................54
4.2.2 Liquid sampling...............................................................................55
4.2.3 Solid sampling................................................................................ 56
4.3 Biotrickling filter performance calculations................................................. 58
4.4 Construction of tubular electrodes............................................................. 63
4.4.1 Tubular electrodes of crystalline membrane...................................63
4.4.2 Tubular electrodes of polymeric liquid membrane.......................... 65
1
2
34

8/17/2019 see page 29
http://slidepdf.com/reader/full/see-page-29 14/260
Aerobic biotrickling filtration for biogas desulfurization
ii
4.5 Construction of conventional electrodes.................................................... 67
4.6 Characterization of analytical systems....................................................... 70
4.6.1 Performance parameters for ion-selective electrodes.................... 74
4.7 Analytical methods..................................................................................... 79
4.7.1 Gas analysis................................................................................... 79
4.7.2 Liquid analysis................................................................................ 81 4.7.3 Solid analysis..................................................................................85
On-line monitoring of H2S and sulfide by a flow analyzer
5.1 Summary and scope.................................................................................. 89
5.2 Introduction.................................................................................................91
5.3 Materials and methods............................................................................... 93
5.3.1 Reagents and standards................................................................ 93
5.3.2 Experimental flow analyzer setup................................................... 94
5.3.3 Experimental conditions..................................................................97
5.4 Results and discussion...............................................................................98 5.4.1 On-line monitoring with the flow analyzer system...........................98
5.4.2 Overall biotrickling filter performance monitoring............................102
5.4.3 Sulfur fate....................................................................................... 104
5.5 Conclusions................................................................................................110
Preliminary study on the on-line determination of sulfate
6.1 Summary and scope.................................................................................. 113
6.2 Introduction.................................................................................................115
6.3 Materials and methods............................................................................... 119
6.3.1 Reagents and standards................................................................ 119 6.3.2 Sensing membrane cocktail composition....................................... 120
6.3.3 Sensor response characterization.................................................. 121
6.3.4 Study of interferences.....................................................................122
6.4 Results and discussion...............................................................................123
6.4.1 Membrane composition optimization.............................................. 123
6.4.2 Effect of operational conditions...................................................... 126
6.4.3 Sensor response to interferences...................................................127
6.5 Conclusions................................................................................................131
Neutral H2S biotrickling filtration and transition to acidic pH
7.1 Summary and scope.................................................................................. 135
7.2 Introduction.................................................................................................137
7.3 Materials and methods............................................................................... 138
7.3.1 Inoculation and operational conditions........................................... 138
7.3.2 Experimental conditions................................................................. 140
7.4 Results and discussion...............................................................................141
7.4.1 Start-up and operational optimization............................................. 141
7.4.2 Effect of the gas contact time......................................................... 147
7.4.3 Transition to acidic pH conditions................................................... 151
7.5 Conclusions................................................................................................154
5
6
7
8/17/2019 see page 29
http://slidepdf.com/reader/full/see-page-29 15/260
Index
iii
Simultaneous removal of methylmercaptan and H2S
8.1 Summary and scope.................................................................................. 159
8.2 Introduction.................................................................................................161
8.3 Materials and methods............................................................................... 162
8.3.1 Experimental conditions..................................................................162
8.4 Results and discussion...............................................................................164 8.4.1 Effect of CH3SH in biogas desulfurization.......................................164
8.4.2 Effect of the gas contact time......................................................... 165
8.4.3 Sulfur mass balance....................................................................... 171
8.5 Conclusions................................................................................................173
Ac id ic H2S biotrickling filtr ation
9.1 Summary and scope.................................................................................. 177
9.2 Introduction.................................................................................................179
9.3 Materials and methods............................................................................... 180
9.3.1 Operational and experimental conditions....................................... 180 9.4 Results and discussion...............................................................................182
9.4.1 Effect of the gas contact time......................................................... 182
9.4.2 Effect of the H2S loading rate..........................................................185
9.4.3 H2S removal profile throughout the bed..........................................187
9.4.4 Biosulfur to sulfate oxidation...........................................................188
9.5 Conclusions................................................................................................194
Conclusions and future work
10.1 General conclusions...................................................................................197
10.2 Future research recommendations............................................................200
References...................... 203
nnexes
Molecular representation of some sulfur compounds..........................................223
Video “990 days in 3 minutes” – Description and comments.............................. 225
Curriculum Vitae Académico............................................................................... 227
8
9
10
11
A

8/17/2019 see page 29
http://slidepdf.com/reader/full/see-page-29 16/260
Aerobic biotrickling filtration for biogas desulfurization
iv
8/17/2019 see page 29
http://slidepdf.com/reader/full/see-page-29 17/260
v
List of Figures and Tables
Introduction
Figure 2.1 Toxicological effects in human health by exposure to H2S............. 13
Figure 2.2 Schematic of a typical FIA manifold................................................20
Figure 2.3 Schematic of the Claus process..................................................... 25
Figure 2.4 Schematic of a chemical absorption process................................. 26
Figure 2.5 Schematic of a bioscrubber............................................................ 29
Figure 2.6 Schematic of an open-bed biofilter................................................. 30
Figure 2.7 Schematic of a counter-current biotrickling filter.............................32
Figure 2.8 Simplified representation of the biological sulfur cycle................... 35
Table 2.1 Physicochemical properties of H2S................................................. 11
Table 2.2 Dissociation constants of H2S......................................................... 12
Table 2.3 Physicochemical properties of CH3SH............................................16
Table 2.4 Sensors for direct detection of H2S................................................. 18
Table 2.5 Main components in biogas and related effects............................. 23
Table 2.6 Representative chemotrophic SOB................................................ 38
Table 2.7 Main characteristics of Acidithiobacillus sp. and Thiobacillus sp....39
General materials and methods
Figure 4.1 BTF system schematic. Equipment number as in Table 4.1.......... 48
Figure 4.2 Image of the BTF experimental setup.............................................49
Figure 4.3 Images of packing material before and after BTF packing............. 53
Figure 4.4 Preparation of the final solid sample (FSS).................................... 56
Figure 4.5 Preparation of the dry final solid sample (dry-FSS)........................57
Figure 4.6 Construction of tubular electrodes of crystalline membrane
(Ag2S) for S2- analysis.....................................................................64
Figure 4.7 Images of constructed tubular electrodes of crystalline
membrane (Ag2S) for S2- analysis...................................................65
Figure 4.8 Construction of tubular electrodes of polymeric liquid
membrane for SO42- analysis..........................................................66
Figure 4.9 Images of constructed tubular electrodes of polymeric
liquid membrane for SO42- analysis.................................................67
Figure 4.10 Construction of conventional electrodes of polymeric liquid
membrane for batch measure of SO42-........................................... 68
Figure 4.11 Images of constructed conventional electrodes of polymeric
liquid membrane for SO42- batch measure......................................69
Figure 4.12 Images during and after application of the polymeric liquid
membrane on constructed conventional electrodes....................... 70
Figure 4.13 Typical ISE calibration curve.......................................................... 71
2
4

8/17/2019 see page 29
http://slidepdf.com/reader/full/see-page-29 18/260
Aerobic biotrickling filtration for biogas desulfurization
vi
Table 4.1 Technical specification – BTF system........................................... 50
Table 4.2 Mineral medium composition.......................................................... 52
Table 4.3 Liquid sampling during reference operation....................................55
Table 4.4 PBS solution composition............................................................... 57Table 4.5 Technical specification – H2S sensor (SureCell)........................... 79
Table 4.6 Chromatographic conditions for CH3SH analysis........................... 80
Table 4.7 Technical specification – pH sensor (5334)................................... 81
Table 4.8 Technical specification – pH sensor (U405).................................. 82
Table 4.9 Technical specification – TDS sensor (SympHony)....................... 83
Table 4.10 Chromatographic conditions for anionic analysis........................... 84
On-line monitoring of H2S and sulfide by a flow analyzer
Figure 5.1 Typical gas diffusion cell with a PVDF membrane..........................92
Figure 5.2 Schematic of the FIA/GD-CFA analytical system for
on-line monitoring of the BTF......................................................... 94
Figure 5.3 Experimental on-line monitoring data. Dotted line indicates
inlet H2S concentration. Arrows show gas phase
determinations. Inset shows a detailed 25-min period data............ 99
Figure 5.4 Linear regression test for (a) FIA system for TDS analysis
and (b) GD-CFA system for H2S analysis.......................................101
Figure 5.5 TDS and H2S profiles. Error bars of 95% confidence
interval for n=3 analysis.................................................................. 101
Figure 5.6 (a) Evolution of H2S EC and RE with data from commercial
sensor. (b) Average H2S EC and RE versus LR with data
from GD-CFA analyzer................................................................... 103
Figure 5.7 On-line monitoring of pH, DO, ORP and [H2S]in during
experimental period........................................................................ 105
Figure 5.8 TDS, SO42- and S2O3
2- concentration monitoring............................106
Figure 5.9 Sulfur mass balance and DO/S2- ratio during experiments.............107
Table 5.1 Experimental conditions for TDS accumulation.............................. 98 Table 5.2 SO4
2- and S0 production as a function of the O2/H2S supplied
ratio and DO/S2- ratio...................................................................... 109
Preliminary study on the on-line determination of sul fate
Figure 6.1 SL and LD evolution for (a) membrane M1 and (b) membrane
M2, with n=24 points for each electrode calibration curve.
Dashed line indicates theoretical sensitivity for divalent anions
(SL = -29.6 mV·dec-1)..................................................................... 124
Figure 6.2 Optimization of (a) sample volume and (b) carrier flow rate
of the FIA system for preliminary interference evaluation..............128
5
6
8/17/2019 see page 29
http://slidepdf.com/reader/full/see-page-29 19/260
List of Abbreviations
vii
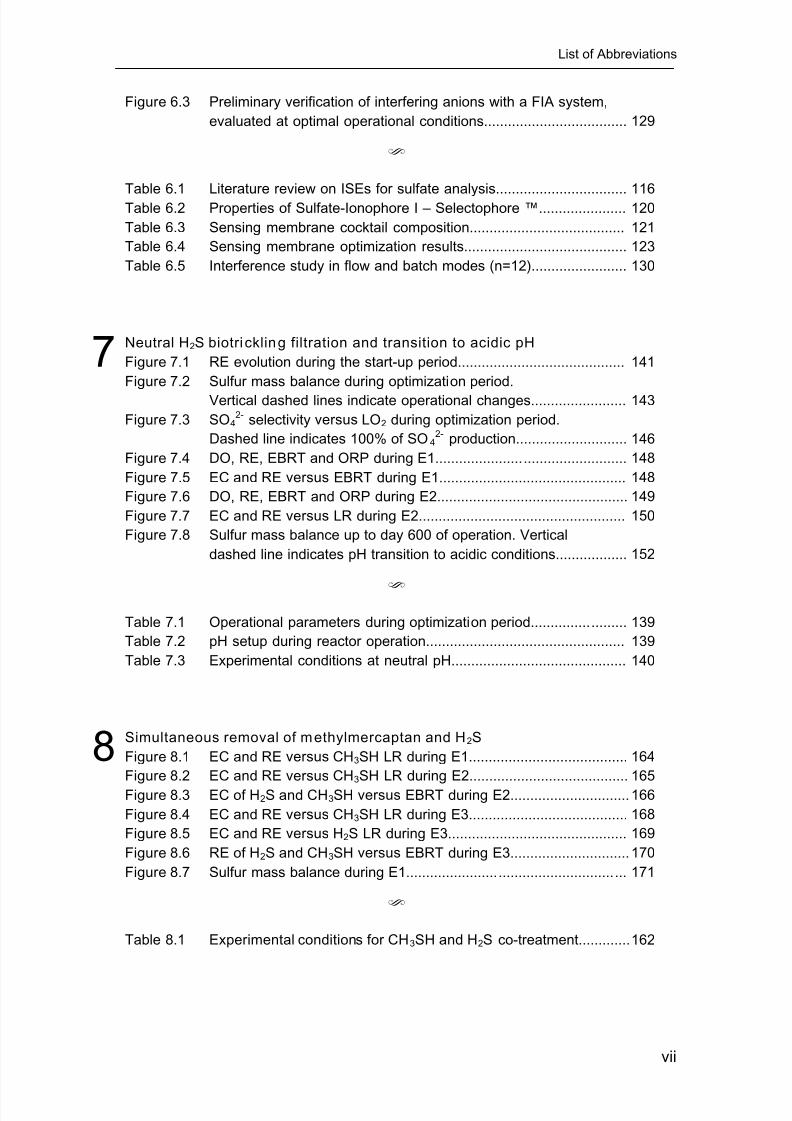
Figure 6.3 Preliminary verification of interfering anions with a FIA system,
evaluated at optimal operational conditions....................................129
Table 6.1 Literature review on ISEs for sulfate analysis.................................116
Table 6.2 Properties of Sulfate-Ionophore I – Selectophore ™......................120
Table 6.3 Sensing membrane cocktail composition....................................... 121
Table 6.4 Sensing membrane optimization results.........................................123
Table 6.5 Interference study in flow and batch modes (n=12)........................130
Neutral H2S biotri ckling filtration and transition to acidic pH
Figure 7.1 RE evolution during the start-up period.......................................... 141
Figure 7.2 Sulfur mass balance during optimization period.
Vertical dashed lines indicate operational changes........................143
Figure 7.3 SO42- selectivity versus LO2 during optimization period.
Dashed line indicates 100% of SO42- production............................ 146
Figure 7.4 DO, RE, EBRT and ORP during E1................................................148
Figure 7.5 EC and RE versus EBRT during E1............................................... 148
Figure 7.6 DO, RE, EBRT and ORP during E2................................................149
Figure 7.7 EC and RE versus LR during E2.................................................... 150
Figure 7.8 Sulfur mass balance up to day 600 of operation. Vertical
dashed line indicates pH transition to acidic conditions..................152
Table 7.1 Operational parameters during optimization period........................139
Table 7.2 pH setup during reactor operation.................................................. 139
Table 7.3 Experimental conditions at neutral pH............................................140
Simultaneous removal of methylmercaptan and H2S
Figure 8.1 EC and RE versus CH3SH LR during E1........................................164
Figure 8.2 EC and RE versus CH3SH LR during E2........................................165
Figure 8.3 EC of H2S and CH3SH versus EBRT during E2..............................166
Figure 8.4 EC and RE versus CH3SH LR during E3........................................168
Figure 8.5 EC and RE versus H2S LR during E3.............................................169
Figure 8.6 RE of H2S and CH3SH versus EBRT during E3..............................170
Figure 8.7 Sulfur mass balance during E1.......................................................171
Table 8.1 Experimental conditions for CH3SH and H2S co-treatment.............162
7
8

8/17/2019 see page 29
http://slidepdf.com/reader/full/see-page-29 20/260
Aerobic biotrickling filtration for biogas desulfurization
viii
Ac id ic H2S biotrickling filtr ation
Figure 9.1 DO, RE, EBRT and ORP during E1................................................183
Figure 9.2 EC and RE versus LR during E1.................................................... 184
Figure 9.3 EC, RE and SO42- selectivity versus LR during E2......................... 185
Figure 9.4 RE as a function of the filter bed height during E1......................... 187
Figure 9.5 RE as a function of the filter bed height during E2......................... 188 Figure 9.6 Sulfur mass balance during E2 and E3.......................................... 189
Figure 9.7 Sulfur mass balance from days 660 to 990 of operation................ 190
Figure 9.8 Biosulfur consumption rate during starvation experiments............. 191
Figure 9.9 Images of biomass and solids sampling after 317 days
at acidic pH..................................................................................... 192
Figure 9.10 Image of packing material after 317 days at acidic pH................... 193
Table 9.1 Experimental conditions at acidic pH.............................................. 181
Table 9.2 Biosulfur consumption during starvation experiments.................... 190
nnexes
Table A.1 Video “990 days in 3 minutes” – Detailed content.......................... 226
9
A

8/17/2019 see page 29
http://slidepdf.com/reader/full/see-page-29 21/260
ix
List of Equations
[1] H2S + H2O ↔ HS- + H3O+ 14
[2] HS- + H2O ↔ S2- + H3O+ 14
[3] HS- + O2 → 0.5 S2O32- + 0.5 H2O 16
[4] CH3SH + H2O ↔ CH3S- + H3O
+ 19
[5] 2 CH3SH + 0.5 O2 → CH3SSCH3 + H2O 19
[6] H2S + CO2 + nutrients + O2 → cells + S0 / SO42- + H2O 40
[7] H2S → S0 → S2O32- → S2O6
2- →S3O62- → S4O6
2- → SO32- → SO4
2- 40
[8] HS- + 0.5 O2 → S0 + OH- {ΔG0 = -145.2 kJ (mol S-substrate)-1} 40
[9] HS- + 2 O2 → SO42- + H+ {ΔG0 = -732.6 kJ (mol S-substrate)-1} 41
[10] S0 + 1.5 O2 + H2O → SO42- + 2 H+ 41
[11] S2O32-
+ 2 O2 + H2O → 2 SO42-
+ 2 H+
41 [12] 3 H2S + NO3
- → 3 S0 + 0.5 N2 + 3 H2O 41
[13] 3 H2S + 4 NO3- → 3 SO4
2- + 2 N2 + 6 H+ 41
[14] LR = [(Q biogas + Q Air IN) Cin] / V 58
[15] EBRT = V / (Q biogas + Q Air IN) 58
[16] RE = [(Cin – Cout) / Cin] 100 58
[17] EC = [(Q biogas + Q Air IN) (Cin – Cout)] / V 59
[18] O2/H2S supplied = (0.21 Q Air IN) / Q H2S IN 59
[19] LO2 = DO Q recirculation 60
[20] DO/S2- = DO / TDS 60
[21] (S-S0
) produced = [S-H2S] IN-OUT – [(S-SO42-
)+(S-S2O32-
)+(S-S2-
)] P-MM 61 [22] pS-S0 = [(S-S0) produced / (V t)] 62
[23] -pS-S0 = [(S-S0) consumed / (V t)] 62
[24] pS-SO42- = [(S-SO4
2-) produced / (V t)] 62
[25] S-SO42-/S-H2S removed = (S-SO4
2-) produced / (S-H2S) removed 63
[26] S-S0/S-H2Sremoved = (S-S0) produced / (S-H2S) removed 63
[27] E = K + [SL1 log(ai)] 72
[28] E = K + [SL2 log(ai + Σ ((Kpot i,j , aj zi/zj) + LDap)] 72
[29] E = K + [SL2 log(ai + C )] 72
[30] H = K + [SL1 log(ci)] 73
[31] H = K + [SL2 log(ci + C)] 74 [32] C = LDap + Σ (Kpot SO4
2-,j aj
2/zj) 76
[33] Kpot SO42-
, j = C / cj 2/zj 77
[34] 2 CH3SH + 7 O2 → 2 CO2 + 2 H2SO4 + 2 H2O 161
[35] 2 CH3S- + H+ + 1/8 S8 ↔ HS- + CH3SSCH3 161
[36] 2 CH3S- + S8 ↔ Sy
2- + CH3SxCH3 (with x + y = 10) 161

8/17/2019 see page 29
http://slidepdf.com/reader/full/see-page-29 22/260
Aerobic biotrickling filtration for biogas desulfurization
x

8/17/2019 see page 29
http://slidepdf.com/reader/full/see-page-29 23/260
xi
List of Abbreviations
ABPP N-4-4-(anilinocarbothioyl)-
amino benzylphenyl-N-phenyl
thiourea
ABS acrylonitrile butadiene styrene
AD anaerobic digestio n
AP acetophenone
ATC automatic temperature
compensation
BA benzylacetate
BBPA bis(1-butylpentyl) adipate
BDPP 4-(4-bromophenyl)-2,6-
diphenylpyrilium perchlorateBEHP bis(2-ethylhexyl) phthalate
BEHS bis(2-ethylhexyl) sebacate
Bis-thiourea 2 α,α-bis(N-butylthio-
ureylene)-m-xylene
Bis-thiourea 3 α,α-bis(N-phenyl-
thioureylene)-m-xylene
Bis-thiourea B 1,3-bis(3-phenylthio-
ureidomethyl)-benzene
Bis-thiourea HA α,α-bis(N-phenylthio-
ureylene)-2-hexyl-adamantyl
Bis-urea 1 α, α-bis(N-butylureylene)-
m-xylene
Bis-urea 4 α, α-bis(N-1-heptyldecyl-
ureylene)-m-xylene
BMImBF4 1-butyl-3-methyl imidazolium
tetrafluoro borate
BMImPF6 1-butyl-3-methyl imidazolium
hexafluoro phosphate
BN 1-bromonaphthalene
BTF biotrickling filterCAS chemical abstracts service
CFA continuous flow analysis
CH3SH methylmercaptan
CH4 methane
CMCPE chemically modified carbon
paste electrode
CN α-chloronaphthalene
CO2 carbon dioxide
COS carbonyl sulfide
CP chloroparaffin
CrL Schiff N-N’-ethylenebis(5-hydroxy-
salicyldeneiminate)-
chromium(III) chloride
CRS cold-rolled steel
CS carbon steel
CS2 carbon disulfide
CTAB cetyltrimethylammonium
bromide
CuL N-N’-bis(2-amino-1-oxo-
phenelenyl)phenylenediamine
copper(II)
DBP dibutyl phthalateDEA diethanolamine
DMDS dimethyl disulfide
DMFC differential mass flow
controller
DMS dimethyl sulfide
DMTS dimethyl trisulfide
DO dissolved oxygen
DOP dioctyl phthalate
DOS bis(2-ethylhexyl) sebacate
DTOA dodecyltrioctylammoniumiodide
E electrical potential
EBRT empty bed residence time
EC elimination capacity
EDTA ethylenediamine tetraacetic
acid
ET ethylmercaptan
FIA flow injection analysis
FID flame ionization detector
FIM fixed interference method
FNDPE 2-fluoro-2-nitrodiphenyl ether
FPNPE 2-fluorophenyl 2-nitrophenyl
ether
FSS final solid sample
GC gas chromatography
GD-CFA gas diffusion-continuous flow
analysis
Guanidine-I N-N’-dicyclohexyl-N’’-
octadecyl guanidine
H2S hydrogen sulfide (gas)
HCO3- bicarbonate

8/17/2019 see page 29
http://slidepdf.com/reader/full/see-page-29 24/260
Aerobic biotrickling filtration for biogas desulfurization
xii
HDAB hexadecylammonium bromide
HDTODAB hexadecyltrioctadecyl-
ammonium bromide
HEPES 2-(4,2-hydroxyethyl-1-pipera-
zinyl) ethanesulfonic acid
HPLC high-performance liquidchromatography
HRT hydraulic residence time
HTAB hexadecyltrimethylammonium
bromide
HTFAB hexyl p-trifluoroacetyl
benzoate
Hydroxyl-Schiff 2,2’-(2,5,8,11-
tetraazadodeca-1,11-diene-
1,12-diyl)bis-4-nitrophenol
IC ion chromatographyICP-MS inductively coupled plasma -
mass spectrometry
IDLH immediately dangerous to life
and health
IL ionic liquid
Imidazole-P 2,6-bis(6-nitrobenzo-
imidazoyl)-N-octadecyl
piperidine
Ionophore-L 2,5-diphenyl-1,2,4,5-
tetraazabicyclo-(2,2,1)-heptane
ISE ion-selective electrode
K(TFPB) potassium tetrakis(3,5-bis-
trifluoromethylphenyl) borate
KTpClPB potassium tetrakis(4-
chlorophenyl) borate
LCD liquid-crystal display
LD limit of detection
LDap apparent limit of detection
LED light-emitting diode
LinR linear range
LLRL low linear-range limit
LO2 load of O2
LOV lab-on-a-valve
LR loading rate
LTCC low temperature cofired
ceramics
MB methylene blue
MCFA multicommutation flow
analysis
MDEA methyldiethanolamine
MEA monoethanolamine
MES 2-(N-morpholino)
ethanesulfonic acid
Mg/Al-SO4 HT hydrotalcite compound
(Mg6 Al2(OH)·16SO4·4H2O)
MOImCl 1-methyl-3-octylimidazolium
chlorideMPM matched potential method
MSFA multisyringe flow analysis
MTOAC methyltrioctylammonium
chloride
Na-TPB sodiumtetraphenyl borate
NB nitrobenzene
Ncell cellular nitrogen
NDIR nondispersive infrared
NDPE 2-nitrodiphenyl ether
NO2
-
nitriteNO3
-nitrate
NOB 1-nonyloxyl-2-butanol
NTA nitrilotriacetic acid
O2 oxygen
OA oleic acid
o-NPOE o-nitrophenyloctyl ether
ORP oxidation-reduction potential
PACA-I polyazacycloalkane
PANI polyaniline
PBS phosphate buffer salinePDMS poly(dimethylsiloxane)
pK a dissociation constant
PP polypropylene
ppbv part per billion (volumetric)
ppmm part per million (volumetric)
PPS polyphenylene sulfide
pS-S0 production rate of S0
-pS-S0 consumption rate of S0
pS-SO42- production rate of SO4
2-
PTFE polytetrafluoroethylene
PU polyurethane
PVC polyvinylchloride
PVC-HMW polyvinylchloride high
molecular weight
PVDF polyvinylidene fluoride
PVF polyvinyl fluoride
QAS-DM tris(2,3,4-dodecyloxyl)benzyl-
dimethyloctylammonium
chloride
QAS-MM tris(2,3,4-dodecyloxyl)benzyl-
dioctylmethylammonium
chloride

8/17/2019 see page 29
http://slidepdf.com/reader/full/see-page-29 25/260
List of Abbreviations
xiii
QAS-TM tris(2,3,4-dodecyloxyl)benzyl
trimethylammonium chloride
RE removal efficiency
RSC reduced sulfur compound
S sulfur (in general)
S0 elemental sulfurS
2- sulfide
S2O32-
thiosulfate
S2O62-
dithionate
S3O62-
trithionate
S4O62-
tetrathionate
SAOB sulfide antioxidant buffer
Schiff base-I 6-6’-diethoxy-2-2’-(2,2-
dimethylpropane-1,3-diylbis-
nitrilomethylidyne-
diphenolato nickel (II)SIA sequential injection analysis
SL sensitivity of an ISE
SO2 sulfur dioxide
SO32-
sulfite
SO42-
sulfate
SOB sulfur-oxidizing bacteria
SS stainless steel
SSM separate solutions method
TDDBTMA Cl tris(2,3,4-dodecyloxy)
benzyltrimethylammoniumchloride
TDDMA Cl tridodecylmethylammonium
chloride
TDS total dissolved sulfide
THF tetrahydrofuran
THTDP Cl trihexyltetradecyl-
phosphonium chlorideTIC total inorganic carbon
TLV tickling liquid velocity
TLV-STEL threshold limit value – short-
term exposure limit
TLV-TWA threshold limit value – time-
weighted average
TNODA trinonyloctadecylammonium
chloride
TOMAC trioctylmethylammonium
chlorideTripodal-2 aminochromenone tris-(2-
aminoethylamine)
TRIS tris-(hydroximethyl)
aminoethylamine
TSS total suspended solids
VOC volatile organic compound
VOSC volatile organic S compound
VSS volatile suspended solids
ZPC zinc-phthalocyanine
Zwiterrion-2 bis(guanidinium)dihydrochloride
Molecular representation in Annexes

8/17/2019 see page 29
http://slidepdf.com/reader/full/see-page-29 26/260
Aerobic biotrickling filtration for biogas desulfurization
xiv

8/17/2019 see page 29
http://slidepdf.com/reader/full/see-page-29 27/260
xv
Abstract
The performance of an aerobic biotrickling filter (BTF) was assessed during a total
period of 990 days on the desulfurization of a synthetic biogas containing 2,000 ppmv
of H2S (≈50 g S-H2S·m-3·h-1), using a metallic random packing material (stainless steel
Pall rings). After the optimization of the operation at neutral pH, the simultaneous
removal of methylmercaptan (CH3SH) and H2S was studied. Afterwards, the
uninterrupted transition from 440 days at neutral pH (6.0 – 6.5) to 550 days at acidic
pH (2.50 – 2.75) was performed. In parallel, sensing tools for the on-line monitoring of
H2S, total dissolved sulfide (TDS = H2S(aq) + HS- + S2-) and sulfate (SO42-) were
developed applying ion-selective electrodes (ISEs).
An ISE of crystalline membrane was used in the proposed analytical system,
consisting in a flow injection analyzer (FIA) for TDS detection integrated as a detector
into a continuous flow analyzer with a gas diffusion step (GD-CFA) for H2S detection,
which was proven to be reliable for on-line monitoring of the BTF. The preliminary
study on the on-line determination of SO42- was performed by an ISE of polymeric liquid
membrane, prepared with a commercial ionophore. However, low selectivity to SO42-
was found in the presence of interfering anions, discouraging the application of
constructed electrodes.
Operational parameters of the BTF were optimized under neutral pH, such as the
aeration rate, the trickling liquid velocity (TLV) and the hydraulic residence time (HRT),
achieving a minimum elemental sulfur (S0
) production. Also, the behavior of the BTFwas studied as a function of the empty bed residence time (EBRT) and the H2S loading
rate (LR). A maximum elimination capacity (EC) of 135 g S-H2S·m-3·h-1 was found.
Removal efficiency (RE) above 99% was obtained at the reference EBRT of 131 s. The
simultaneous removal of CH3SH and H2S was investigated at neutral pH, for
concentrations commonly found in biogas (2,000 ppmv of H2S and 10 – 75 ppmv of
CH3SH). Maximum ECs were 1.8 g S-CH3SH·m-3·h-1 and 100 g S-H2S·m-3
·h-1. The
natural presence of CH3SH in biogas was considered beneficial because of the
unclogging effect produced by the consumption of S0 by chemical reaction with CH3SH.
Finally, the BTF long-term operation under acidic pH was characterized in terms of
EBRT and LR, obtaining an ECmax of 220 g S-H2S·
m-3
·
h-1
. The H2S removal profile wasassessed and the oxidation rate of S0 accumulated inside the filter bed was evaluated
by periodical H2S starvation episodes. Results indicate that the first third of the filter
bed is responsible for 70 to 80% of the total H 2S removal. Oxidation of S0 to SO42- was
suggested as a S-clogging control strategy under acidic conditions. Despite the
important amount of S0 produced under acidic pH, overall BTF desulfurizing capacity
was comparable to that obtained previously under neutral pH.

8/17/2019 see page 29
http://slidepdf.com/reader/full/see-page-29 28/260
Aerobic biotrickling filtration for biogas desulfurization
xvi
Resum
Es va gestionar l'operació d'un biofiltre percolador (BTF) durant un període total de
990 dies per a la dessulfuració d'un biogàs sintètic contenint 2,000 ppm v d’H2S (≈ 50 g
S-H2S·m-3·h-1), utilitzant un material de rebliment aleatori (anelles Pall d'acer
inoxidable). Després de l'optimització de l'operació a pH neutre, es va estudiar
l'eliminació simultània de metilmercaptà (CH3SH) i H2S. A continuació es va executar
la transició ininterrompuda des de 440 dies a pH neutre (6.0 – 6.5) a 550 dies a pH
àcid (2.50 – 2.75). Paral·lelament es van desenvolupar eines per a la monitorització en
línia d’H2S, sulfur dissolt total (TDS = H2S(aq) + HS- + S2-) i sulfat (SO42-), aplicant
elèctrodes selectius d'ions (ISEs).
Es va emprar un ISE de membrana cristal·lina en el sistema analític proposat, que
consisteix en un analitzador per injecció de flux (FIA) per anàlisi de TDS integrat com a
detector en un analitzador de flux continu amb una etapa prèvia de difusió de gas (GD-
CFA) per l’anàlisi d’H2S, el qual es va mostrar idoni per a la monitorització en línia del
BTF. Es va realitzar l'estudi preliminar de la determinació en línia de SO 42- utilitzant un
ISE de membrana líquida polimèrica, preparada amb un ionòfor comercial. No obstant
això, es va obtenir baixa selectivitat per al SO42- en presència d'anions interferents, el
que desaconsella l'aplicació dels elèctrodes construïts.
Es van optimitzar paràmetres operacionals del BTF a pH neutre, com ara la taxa
d'aeració, la velocitat de percolació (TLV) i el temps de residència hidràulica (HRT),obtenint una mínima producció de sofre elemental (S0). També es va estudiar la
resposta del BTF enfront del temps de contacte del gas (EBRT) i de la càrrega
aplicada (LR) d’H2S. La capacitat d'eliminació (EC) màxima va ser de 135 g S-H2S·m-
3·h-1. Per a un EBRT de referència de 131 s, l'eficàcia d'eliminació (RE) va ser superior
al 99%. Es va investigar l'eliminació simultània de CH3SH i H2S a pH neutre, a
concentracions normalment trobades en biogàs (2,000 ppmv d’H2S i 10 – 75 ppmv de
CH3SH). Les màximes EC trobades van ser de 1.8 g S-CH3SH·m-3·h-1 i 100 g S-H2S·m-
3·h-1. La presència natural de CH3SH en el biogàs va ser considerada beneficiosa per
l’efecte de descolmatació del llit produït pel consum de S0 per reacció química amb
CH3SH. Finalment, es va caracteritzar l'operació a llarg termini del BTF sota condicionsàcides de pH en funció del EBRT i la LR, obtenint una ECmax de 220 g S-H2S·m-3·h-1.
Es va estudiar el perfil d'eliminació d’H2S i es va avaluar la velocitat d'oxidació del S0
acumulat dintre del llit durant episodis periòdics d'inanició. Els resultats indiquen que el
primer terç del llit és responsable pel 70 – 80% del total eliminat d’H2S. L'oxidació de
S0 a SO42- se suggereix com una estratègia de control contra la colmatació del llit per
sofre. Tot i la important quantitat de S0 produït a pH àcid, la capacitat de dessulfuració
global del BTF va ser comparable a l'obtinguda anteriorment a pH neutre.

8/17/2019 see page 29
http://slidepdf.com/reader/full/see-page-29 29/260
xvii
Resumen
Se gestionó la operación de un biofiltro percolador (BTF) durante un período total
de 990 días en la desulfuración de un biogás sintético conteniendo 2,000 ppmv de H2S
(≈50 g S-H2S·m-3·h-1), utilizando un material de empaque aleatorio (anillos Pall de
acero inoxidable). Después de la optimización de la operación a pH neutro, se estudió
la eliminación simultánea de metilmercaptano (CH3SH) y H2S. A continuación se
ejecutó la transición ininterrumpida de 440 días a pH neutro (6.0 – 6.5) a 550 días a
pH ácido (2.50 – 2.75). Paralelamente se desarrollaron herramientas para la
monitorización en línea de H2S, sulfuro disuelto total (TDS = H2S(aq) + HS- + S2-) y
sulfato (SO42-), aplicando electrodos selectivos de iones (ISE).
Se empleó un ISE de membrana cristalina en el sistema analítico propuesto, que
consiste en un analizador por inyección de flujo (FIA) para análisis de TDS integrado
como detector en un analizador de flujo continuo con una etapa previa de difusión de
gas (GD-CFA) para análisis de H2S, el cual se mostró idóneo para la monitorización en
línea del BTF. Se realizó el estudio preliminar de la determinación en línea de SO42-
utilizando un ISE de membrana líquida polimérica, preparada con un ionóforo
comercial. Sin embargo, se obtuvo baja selectividad al SO42- en presencia de aniones
interferentes, lo que desaconseja la aplicación de los electrodos construidos.
Se optimizaron parámetros operacionales del BTF a pH neutro, tales como la tasa
de aeración, la velocidad de percolación (TLV) y el tiempo de residencia hidráulica(HRT), obteniendo una mínima producción de azufre elemental (S0). También se
estudió la respuesta del BTF frente al tiempo de contacto del gas (EBRT) y a la carga
aplicada (LR) de H2S. La capacidad de eliminación (EC) máxima fue de 135 g S-
H2S·m-3·h-1. Para un EBRT de referencia de 131 s, la eficacia de eliminación (RE) fue
superior al 99%. Se investigó la eliminación simultánea de CH3SH y H2S a pH neutro,
a concentraciones comúnmente encontradas en biogás (2,000 ppmv de H2S y 10 – 75
ppmv de CH3SH). Las ECs máximas halladas fueron de 1.8 g S-CH3SH·m-3·h-1 y
100 g S-H2S·m-3·h-1. La presencia natural de CH3SH en el biogás fue considerada
beneficial debido al efecto de descolmatación del lecho producido por el consumo de
S0
por reacción química con CH3SH. Finalmente, se caracterizó la operación a largoplazo del BTF bajo condiciones ácidas de pH en función del EBRT y la LR, obteniendo
una ECmax de 220 g S-H2S·m-3·h-1. Se estudió el perfil de eliminación de H2S y se
evaluó la velocidad de oxidación del S0 acumulado en el lecho durante episodios
periódicos de inanición. Los resultados indican que el primer tercio del lecho es
responsable por el 70 – 80% del total eliminado de H 2S. La oxidación de S0 a SO42- se
sugiere como una estrategia de control contra la colmatación del lecho por azufre. A
pesar de la importante cantidad de S0 producido a pH ácido, la capacidad de
desulfuración global del BTF fue comparable a la obtenida anteriormente a pH neutro.

8/17/2019 see page 29
http://slidepdf.com/reader/full/see-page-29 30/260
Aerobic biotrickling filtration for biogas desulfurization
xviii

8/17/2019 see page 29
http://slidepdf.com/reader/full/see-page-29 31/260
1
research motivation and
thesis overview

8/17/2019 see page 29
http://slidepdf.com/reader/full/see-page-29 32/260
Aerobic biotrickling filtration for biogas desulfurization
2
T her e i s no subject so old t hat
something new cannot be said about it.
F y odor M D ost oy ev sk y
M oscow, 182 1 Saint Pet er sbur g, 1881

8/17/2019 see page 29
http://slidepdf.com/reader/full/see-page-29 33/260
3
1 Research motivation and thesis overview
1.1 Research motivation
Renewable energy sources are becoming more important over the last
decades as a result of both increasing global energy demand and the
restriction caused by the scarcity of fossil energy sources. Environmental
legislation evolves alongside scientific and technical development, aiming
for the protection and preservation of natural resources and also to ensure
the ideal standards of health, social welfare and quality of life for us and for
our future generations. The exploitation of biogas as a renewable energy
source is one of the promoted technologies in the European Union and
particularly in Spain, in order to achieve the goal of 20% of energy coming
from renewable sources until 2020. Before entering any energy conversion
system, the quality of the biogas must be carefully monitored and hydrogen
sulfide (H2S) must be removed, jointly with other reduced sulfur compounds
(RSCs), attending to technical restrictions and for environmental and health
protection. In addition to these irrefutable motivations, the economical
advantage of applying a biological process for biogas desulfurization,
instead of a physicochemical one, should be considered as a really
attractive subject in the sphere of the energy business.
This research has been done at the Department of Chemical Engineering
of the UAB, within the Gas Treatment Group. Construction of electrodesand other analytical procedures were performed in collaboration with the
Sensors and Biosensors Group of the Chemical Department at UAB. A
previous study was developed by others in order to design and build a lab-
scale biotrickling filter (BTF) system to treat highly H2S-loaded gas streams
(Fortuny et al., 2010; 2011). In this way, a comprehensive study of biogas
mimics sweetening was done, characterizing the operation of the reactor
under neutral pH conditions applying a structured, organized packing
material.
8/17/2019 see page 29
http://slidepdf.com/reader/full/see-page-29 34/260
Aerobic biotrickling filtration for biogas desulfurization
4
This thesis intended to deepen the study on the desulfurization of highly
H2S-loaded synthetic biogas by aerobic biotrickling filtration under different
conditions and, concomitantly, to develop analytical tools for the on-line
monitoring of the reactor. The performance of the system was assessed
under neutral and acidic pH conditions, applying a random packing
material, for a total period of 990 consecutive days.
1.2 Thesis overview
Research motivation is exposed in this first Chapter. A general overview
of the thesis is herein presented to facilitate the consulting andunderstanding of the structure of the document. A general introduction is
provided in Chapter 2, by briefly defining the principal concepts that are
used in this study. Main topics treated are related to the characterization of
H2S and methylmercaptan (CH3SH), including available technologies for
detection and removal of sulfur compounds. Special attention is paid to
biological technologies for H2S elimination from biogas, specifically
biotrickling filtration. The biological sulfide oxidation is also briefly described.In Chapter 3, main objectives of the research are stated, dividing the
actions into two principal categories: Monitoring and Performance.
General materials and methods applied during this research are
described in Chapter 4. A comprehensive description of the BTF
experimental setup is provided, as well as the explanation of the
construction of used electrodes, the exposition of parameters used in
analytical systems characterization and the specification of common
analytical techniques. Specific experimental conditions and reagents are
detailed in each result Chapter.
Results obtained during the experimental period are presented and
discussed from Chapter 5 to Chapter 9. The optimization of an analytical
flow-based system for the integrated detection and quantification of H2S(g)
and total dissolved sulfide (TDS = H2S(aq) + HS- + S2-) is presented in

8/17/2019 see page 29
http://slidepdf.com/reader/full/see-page-29 35/260
1. Research motivation and thesis overview
5
Chapter 5. Moreover, the analytical system was implemented in the studied
BTF, allowing the on-line determination of the targeted species. A
preliminary study on the on-line determination of sulfate (SO42-) is outlined
in Chapter 6. Based on a commercially available selective ionophore, a
liquid membrane is optimized for the construction of an ion-selective
electrode (ISE), aiming the on-line determination of SO42-. After evaluating
the drawbacks faced during this study, technical alternatives are suggested.
In Chapter 7, the uninterrupted transition from neutral to acidic pH
conditions is described and overall results in terms of desulfurization
performance are presented up to day 600 of operation. The start-up at
neutral pH, the optimization of the operation aiming at the minimization of
biologically produced elemental sulfur and the steady-state operation at
neutral pH for 440 days are presented in detail. In Chapter 8, the
simultaneous removal of H2S and CH3SH is studied under neutral pH
conditions, for concentrations of both pollutants normally found in biogas.
Furthermore, the effect of the gas contact time reduction and the pollutants
load increase are evaluated. The operation at acidic pH was carried out for
550 days, after the uninterrupted pH transition described in Chapter 7,
totalizing 990-uninterrupted operation days. Results obtained during the
acidic pH operation until the end of operation are presented in Chapter 9.
The response of the reactor to H2S starvation episodes is also investigated,
as well as the H2S removal profile along the filter bed height.
Finally, in Chapter 10, general conclusions are presented and future
research recommendations are proposed.

8/17/2019 see page 29
http://slidepdf.com/reader/full/see-page-29 36/260
Aerobic biotrickling filtration for biogas desulfurization
6

8/17/2019 see page 29
http://slidepdf.com/reader/full/see-page-29 37/260
2
introduction

8/17/2019 see page 29
http://slidepdf.com/reader/full/see-page-29 38/260
Aerobic biotrickling filtration for biogas desulfurization
8
Only fools and charlatans know everything
and u nder st and n ot hin g.
A n t o n P C h ek h o v
T aganr og, 1860 B adenwei ler , 1904

8/17/2019 see page 29
http://slidepdf.com/reader/full/see-page-29 39/260
9
2 Introduction
2.1 Atmospheric sulfur pollut ion
Sulfur is involved in a wide variety of biogeochemical reactions that affect
the global carbon and oxygen cycles. Sulfur is found abundantly in pyrite
and gypsum sediments and in oceanic sulfate salts. It is also essential for
life. The sulfur cycle is fundamental to understand the geochemical
evolution of the Earth and other planets, like recently discussed about the
bulk sulfur composition on Mars (King and McLennan, 2010). Sulfur can be
found in 25 isotopic forms, from which 4 are stable: 32S, 33S, 34S and 36S,
with relative abundance values of 94.93%, 0.76%, 4.29% and 0.02%,
respectively (Johnston, 2011). As can be deduced, 32S is the most
significant occurring isotope, and engineering calculations are made over
this assumption. The study of sulfur isotope composition of seawater sulfate
reflects the balance of fluxes of sulfur into and out the ocean and can be
considered as a powerful tool to explain global biogeochemical changes.
Sulfur occurs in a variety of valence states, from -2 (S2-), 0 (elemental
sulfur, S0) and +6 (SO42-). Volcanoes are responsible for natural release of
sulfur compounds, primarily sulfur dioxide (SO2), but also other sulfur
compounds are found in biological processes, like H2S and other RSCs,
namely volatile organic sulfur compounds (VOSCs) such as CH3SH,
dimethyl sulfide (DMS), dimethyl disulfide (DMDS) and carbonyl sulfide(COS). H2S release to the atmosphere causes the phenomenon known as
acid rain, since H2S reacts with ozone to form sulfuric acid. Also SO2 is
considered as extremely dangerous to the atmosphere because it is an acid
rain precursor. SO2 emissions from anthropogenic sources are considered
as the major issue related to the environmental management. SO2 is
formed by the combustion of sulfur-containing fuels, thus desulfurization
processes must be applied before fuels burning. It is also the case of
biogas, which H2S content can be significantly high, as later discussed.

8/17/2019 see page 29
http://slidepdf.com/reader/full/see-page-29 40/260
Aerobic biotrickling filtration for biogas desulfurization
10
Besides the environmental implications of sulfur compounds, also they are
considered extremely toxic for human health, and special protection
measures must be taken when the risk of exposure is present.
2.2 Hydrogen sulfide
2.2.1 Physicochemical properties of H2S
H2S is a colorless gas and has a strong offensive odor of rotten eggs at
low concentrations. At higher concentrations, it has a sweetish odor, but at
concentrations higher than 100 ppmv of H2S, paralysis of the olfactory nerve
occurs an odor may not be detected. The primary uses of H2S include the
production of elemental sulfur and sulfuric acid, the manufacture of heavy
water and other chemicals, in metallurgy and as an analytical reagent
(HSDB, 2012). In agriculture, it is used as a disinfectant. Occupational
exposure to H2S occurs primarily from its presence in petroleum, natural
gas, soil, sewer gas and as a byproduct of chemical reactions. H2S is
produced from numerous environmental sources including bacterial
decomposition of vegetable and animal proteinaceous material.
H2S is soluble in certain polar organic solvents, notably methanol,
acetone, propylene carbonate, sulfolane, tributyl phosphate, various
glycols, and glycol ethers. It is also soluble in glycerol, gasoline, kerosene,
carbon disulfide, and crude oil.
However, aqueous solutions of H2S are not stable. H2S is a weak diprotic
acid and the level of deprotonation depends on the pH of the solution,
according to Equation 1 and Equation 2 (Steudel, 2004).
H2S + H2O HS- + H3O+ [1]
HS-
+ H2O S2-
+ H3O+
[2]

8/17/2019 see page 29
http://slidepdf.com/reader/full/see-page-29 41/260
2. Introduction
11
Relevant information and physicochemical characteristics of H2S are
summarized in Table 2.1. (ATSDR, 2006; HSDB, 2012).
Table 2.1 Physicochemical properties of H2S
Common name Hydrogen sulfide
Synonyms
Hydrosulfuric acid, sulfur hydride, sulfurated
hydrogen, dihydrogen monosulfide, sewer
gas, swamp gas
CAS register number 7783-06-4
Chemical formula H2S
Spatial molecular representation
Molecular weight (ºC) 34.08
Melting poi nt (ºC) -85.49
Boiling point (ºC) -60.33
Flash poin t (ºC) 26.00
Au to igni tion temperature (ºC) 260.00
Lower explosive limit (%) 4.30 (in air)
Upper explosive limit (%) 45.50 (in air)
Density (g·L-1
) 1.5392 (0 ºC; 760 mmHg)
Relative density in air 1.192
Solubility in water (g·L-1
) 5.3 (10 ºC); 4.1 (20 ºC); 3.2 (30 ºC)
Vapor pressure (mmHg) 15,600 (25 ºC)
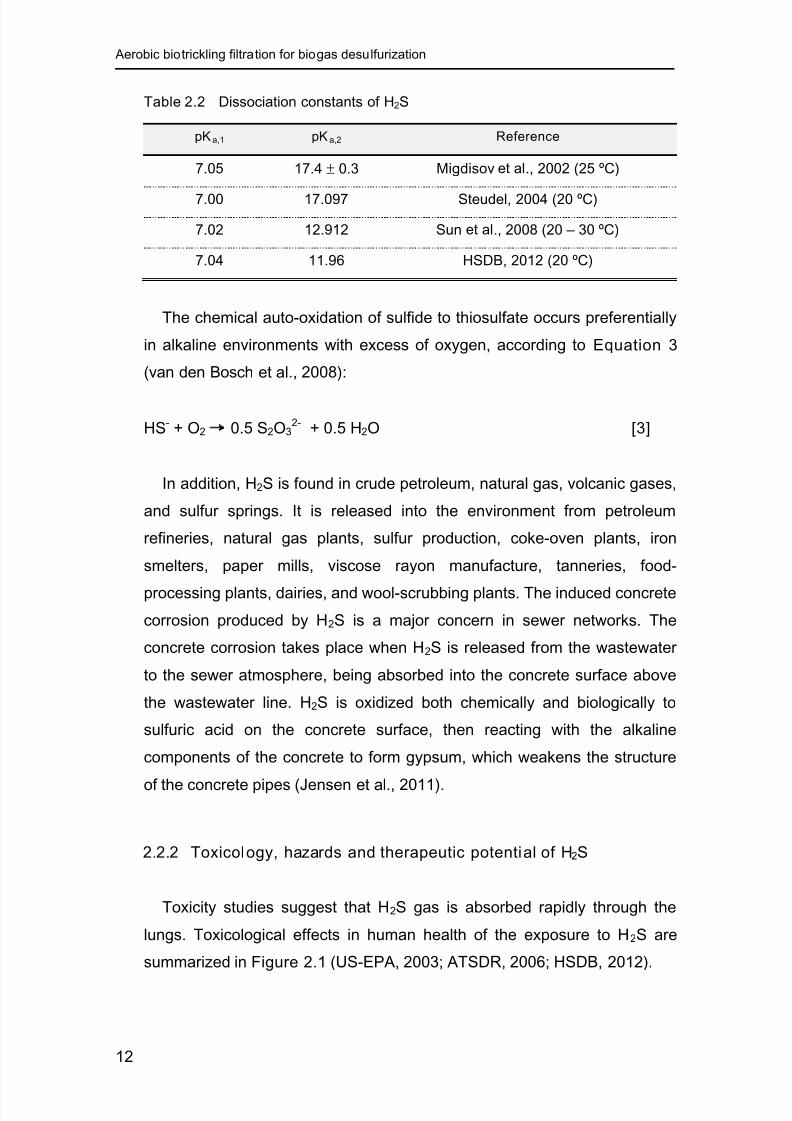
The scientific community has systematically discussed the second
dissociation constant of H2S; reported values can differ up to eight orders of
magnitude (Migdisov et al., 2002; Sun et al., 2008). In Table 2.2, the most
frequently adopted values for H2S dissociation constants are given. Despite
the high uncertainty level in the reported values of the second dissociation
constant (pKa,2), it is assumed that sulfide ions (S2-) are only present in
extremely alkaline solutions (pH>12).
8/17/2019 see page 29
http://slidepdf.com/reader/full/see-page-29 42/260
Aerobic biotrickling filtration for biogas desulfurization
12
Table 2.2 Dissociation constants of H2S
pK a,1 pK a,2 Reference
7.05 17.4 ± 0.3 Migdisov et al., 2002 (25 ºC)
7.00 17.097 Steudel, 2004 (20 ºC)
7.02 12.912 Sun et al., 2008 (20 – 30 ºC)
7.04 11.96 HSDB, 2012 (20 ºC)
The chemical auto-oxidation of sulfide to thiosulfate occurs preferentially
in alkaline environments with excess of oxygen, according to Equation 3
(van den Bosch et al., 2008):
HS- + O2 0.5 S2O32- + 0.5 H2O [3]
In addition, H2S is found in crude petroleum, natural gas, volcanic gases,
and sulfur springs. It is released into the environment from petroleum
refineries, natural gas plants, sulfur production, coke-oven plants, iron
smelters, paper mills, viscose rayon manufacture, tanneries, food-
processing plants, dairies, and wool-scrubbing plants. The induced concrete
corrosion produced by H2S is a major concern in sewer networks. The
concrete corrosion takes place when H2S is released from the wastewater
to the sewer atmosphere, being absorbed into the concrete surface above
the wastewater line. H2S is oxidized both chemically and biologically to
sulfuric acid on the concrete surface, then reacting with the alkaline
components of the concrete to form gypsum, which weakens the structure
of the concrete pipes (Jensen et al., 2011).
2.2.2 Toxicology, hazards and therapeutic potential of H2S
Toxicity studies suggest that H2S gas is absorbed rapidly through the
lungs. Toxicological effects in human health of the exposure to H2S are
summarized in Figure 2.1 (US-EPA, 2003; ATSDR, 2006; HSDB, 2012).

8/17/2019 see page 29
http://slidepdf.com/reader/full/see-page-29 43/260
2. Introduction
13
Figure 2.1 Toxicological effects in human health by exposure to H2S
H2S is an extremely toxic and irritating gas. In sufficiently high
concentrations, it can cause instant death by blocking the oxidative
processes of tissue cells and by reducing the O2-carrying capacity of the
blood. Free H2S in blood depresses the nervous system and larger amounts
can paralyze the nervous system. In acute poisoning, death is due to
respiratory failure and asphyxiation. Although absorption through the skin is
minimal, contact with liquid H2S causes frostbite. In animals and humans, it
distributes to the blood, brain, lung, heart, liver, spleen, and kidney.
Moreover, the exposure to H2S is a major concern in occupational health
management and strict limits are imposed. Common exposure accidents
with fatal victims are due to the accumulation of H2S in close environments,
like pits or sumps, since the gas is heavier than air. The loss of the sense of
smell at concentrations relatively low for the industrial emission parameters
(≈
100 ppmv of H2S) is the major concern for health protection actions, and
proper detection and protection equipment must be used when working in
0 100 200 300
400 500 600 700 800 900 1,000
H2S exposure concentration (ppmv of H2S)
15 –
75
100 – 300
300 – 500
500 – 700
700 – 1,000
> 1,000
Odor threshold
Irritation of eyes and respiratory
system, nausea, headache
Paralysis of
the olfactory
nerve after
few minutes,
severe eye,
nose, throat
and lungs
irritation after60 minutes
Loss of consciousness,
irreversible lung damage and
death within 30 to 60 minutes
Rapidunconsciousness,
cessation of respiration
and death within a few
minutes
Sudden
unconsciousness,
instant death at the
first breathing
Beginning eye and respiratory irritation 10
0.008 – 0 .13
Loss of
consciousness,
severe lung
damage and
possible deathafter few hours
Lethal for 50% ofhumans within 5 minutes
1,100 1,200 0 00 200 300 4 500 600 00 800 900 ,000
S exposure concentrati v o
15 –
7
100 – 300
300 – 500
500 – 700
700 – ,00
> 1,000
Odor threshold
Irritation of eyes and respiratory
system, nausea, headache
Para ysis o
the olfactory
nerve after
few minutes,
v ,
nose, throat
and lungs
irritation afterminutes
Loss of consciousness,
rrevers e ung amage an
death within 30 to 60 minutes
Rapidunconsciousness,
cessation of respirati
and death within a few
minutes
Sudd
unconsciousness,
instant death at the
first breathing
eginning eye and respiratory irritation10
0.008 – 0 .13
Loss of
consciousness,
severe lung
damage and
possible deatha ter ew hours
Lethal for 50% ofumans w t n 5 m nute
,100 ,200
8/17/2019 see page 29
http://slidepdf.com/reader/full/see-page-29 44/260
Aerobic biotrickling filtration for biogas desulfurization
14
potential H2S risk areas. For this reason, the immediately dangerous to life
and health concentration (IDLH) is defined at 100 ppmv of H2S (NIOSH,
2011a). At this concentration, adverse health effects are irreversible and the
ability to escape from the contaminated environment is already impaired.
Exposure limits to H2S are defined as follows (ACGIH, 1996):
• TLV-TWA (Threshold Limit Value – time-weighted average): is the
time-weighted average concentration for a normal 8-hours workday
and a 40-hours workweek to which nearly all workers may be
repeatedly exposed, day after day, without adverse effect.
• TLV-STEL (Threshold Limit Value – short-term exposure limit): is
the short-term exposure limit for a 15-minutes exposure.
In Spain, H2S was included in 2012 in the index of controlled substances
for occupational exposure (INSHT, 2012), adopting the values
recommended in USA and the EU. Exposure limits are as follows:
TLV-TWA = 5 ppmv of H2S
TLV-STEL = 10 ppmv of H2S
Despite its intrinsic toxicity, H2S has been the focus of intensive medicine
research in the past few years, with special attention to its therapeutic
potentialities. Recently recognized as a gasotransmitter, H2S is, jointly with
nitric oxide and carbon monoxide, one of the gaseous signaling molecules
that modulate many cellular functions (Epelman and Tang, 2012; Predmore
et al, 2012).
Promising results are been obtained in the pharmaceutical investigation
on the beneficial effects of several H2S-releasing drugs. Many therapeutic
targets have been successfully proved for H2S therapy, including cancer,
heart failure, organ transplant, peripheral artery disease, inflammatory
bowel disease, Alzheimer’s disease, acute myocardial infarction, stroke,
atherosclerosis, hypertension, erectile dysfunction, metabolic syndrome,
diabetes and thrombosis (Martelli et al., 2012; Vandiver and Snyder, 2012).

8/17/2019 see page 29
http://slidepdf.com/reader/full/see-page-29 45/260
2. Introduction
15
2.3 Methylmercaptan
2.3.1 Physicochemical properties of CH3SH
CH3SH is a colorless gas with an extremely unpleasant characteristic
odor of rotten cabbage and an odor threshold as low as 1.5 ppb v of CH3SH
(ATSDR, 1992; Roberts, 2000). Like H2S, CH3SH is heavier than air and
accumulates in lower closed environments, representing a high risk for
human health, specially for workers at underground labors in petrochemical
industry and in wastewater treatment facilities. CH3SH is soluble in alcohol,
ether, petroleum and naphta. Commercially produced by the reaction of H2Swith methanol, CH3SH is extensively used in the synthesis of the amino
acid methionine. It is also used as an intermediate in the manufacture of jet
fuels, pesticides, fungicides, and plastics. CH3SH occurs naturally in sour
gases during drilling operations, in coal tar and petroleum distillates.
Because of its distinctive strong odor, trace of CH3SH is used as an odorant
in gas natural networks, ensuring its early detection in potential dangerous
situations. CH3SH is also employed in pharmaceutical formulations and asa flavor and fragrance additive of a large number of products; it can be
found also in cheese, milk, coffee and oysters (Roberts, 2000).
CH3SH is a weak monoprotic acid that deprotonates in aqueous solutions
according to Equation 4, with a dissociation constant (pKa) value of
approximately 9.7 (Smet et al., 1998). Under aerobic conditions, CH3SH
chemically auto-oxidizes to form mainly DMDS, according to Equation 5
(Jocelyn, 1972):
CH3SH + H2O CH3S- + H3O
+ [4]
2 CH3SH + 0.5 O2 CH3SSCH3 + H2O [5]
Relevant information and physicochemical characteristics of CH3SH are
summarized in Table 2.3 (ATSDR, 1992; HSDB, 2003).

8/17/2019 see page 29
http://slidepdf.com/reader/full/see-page-29 46/260
Aerobic biotrickling filtration for biogas desulfurization
16
Table 2.3 Physicochemical properties of CH3SH
Common name Methylmercaptan
Synonyms
Methanethiol, thiomethyl alcohol, methyl
sulfhydrate, mercaptomethane, thiomethanol
CAS register number 74-93-1
Chemical formula CH3SH
Spatial molecular representation
Molecular weight (ºC) 48.11
Melting poi nt (ºC) -123.10
Boiling point (ºC) 6.20
Flash poin t (ºC) -17.78
Lower explosive limit (%) 3.90 (in air)
Upper explosive limit (%) 21.80 (in air)
Density (g·L-1
) 0.8665 (0ºC; 760 mmHg)
Relative density in air 1.66
Solubility in water (g·L-1
) 23.30 (20 ºC); 15.39 (25 ºC)
Vapor pressure (mmHg) 1,515 (26.1 ºC)
2.3.2 Toxicology and occupational hazards of CH3SH
The toxicology of CH3SH has been less investigated than in the case of
H2S, probably because of its less occurrence. However, the intense noxiousodor of CH3SH and the variety of health effects reported indicates than
CH3SH is more toxic than other higher thiols, even when the metabolic path
in humans has not been yet fully described (HSDB, 2003). CH3SH is
primary absorbed by the lungs and exposure occurs by inhalation.
Nevertheless, no agreement has been established regarding to the relation
between the extension of the exposure and the severity of the symptoms
(ATSDR, 1992).

8/17/2019 see page 29
http://slidepdf.com/reader/full/see-page-29 47/260
2. Introduction
17
Potential symptoms of the exposure to CH3SH include irritation of eyes,
skin and respiratory tract, cough, sore throat, headache, nausea, shortness
of breath, dizziness, unconsciousness, pulmonary edema and respiratory
failure. Dermic contact with CH3SH liquid can produces frostbite, despite it
is the less frequent exposure via (ATSDR, 1992). The IDLH concentration
for CH3SH is defined as 150 ppmv of CH3SH (NIOSH, 2011b). Occupational
exposure limits established in Spain are as follows (INSHT, 2012):
TLV-TWA = 0.5 ppmv of CH3SH
TLV-STEL = 10 ppmv of CH3SH
2.4 Sulfur compounds detection
The determination of sulfur compounds like H2S, CH3SH, DMS and
DMDS has been traditionally performed by gas chromatography (GC)
(NIOSH, 1994). However, accurate analytical methodology is scarce in
different matrices (Vitenberg et al, 2007; Tangerman, 2009).
2.4.1 Hydrogen sulfide detection
Gas-phase H2S can be measured indirectly, as in the case of GC,
especially for low H2S concentrations, commonly found in biological, food
and pharmaceutical samples (Catalan et al., 2006; Vitenberg et al., 2007).
However, this off-line methodology presents a series of drawbacks, mainly
in relation with the loss of the analyte during the sampling procedure
(NIOSH, 2006). Direct, real-time methodologies are also available.
However, commercially available sensors for direct determination of H2S
normally operate in a range up to 1,000 ppmv of H2S, which represents an
operational limitation for high H2S-cointaining gases, as biogas. Most
representative sensors for direct detection of H2S are shown in Table 2.4,
(Pandey et al., 2012) and their principal characteristics, regarding to the
sensing principle, common fabrication materials and performancecharacterization are summarized.

8/17/2019 see page 29
http://slidepdf.com/reader/full/see-page-29 48/260
Aerobic biotrickling filtration for biogas desulfurization
18
Table 2.4 Sensors for direct detection of H2S
Sensor
type
Semiconducting
oxide
Electro-
chemicalOptical
Conducting
polymer
Surface
acoustic
wave
Sensing
principle
Conductivity
impedance
Ampero-
metry,
Potentio-
metry
Absorption,
Fluorescence,
Colorimetry
Conductivity
impedance
Oscilla-
tion
frequen-
cy
Common
materials
SnO2, Fe2O3,
WO3, BaTiO3,
ZnO, In2O3, CuO-
SnO2
Pt-
electrode,
Au-
Nafion,
Ceramic,doped-
SnO2
Fused silica,
photoacoustic
cells, quartz
crystal,
colorimetric
dyes
Polyaniline-
gold,
polyaniline-
metal salts
WO3, Au,
LiNbO3,
Poly-
aniline
Response
time (s) 3 – 120 4 – 10 ≈0.2 66 – 120
100 –
240
Recovery
time (s) 9 – 240 12 – 30 - 180 – 300 360
Range
(ppmv H2S) 0.005 – 1,200 0.1 – 100 0.02 – 100 0.0001 – 100
5x10-
–
500
Limit of
detection
(ppbv H2S)
4 – 3,000100 –
sub-ppm1 – sub-ppm 0.1 < 10
Semiconducting metal-oxide sensors are considered a simple, small and
low cost technology and have been successfully applied for H2S sensing,
mostly with SnO2 or doped-SnO2 thin film. These sensors work by
identifying the electronic changes in the surface of the metal-oxide film
produced by the reaction of the targeted gas with the sensor metal-oxide
component (Fine et al., 2010). Electrochemical sensors may be of liquid or
solid electrolytes, but for H2S determination, mostly solid-electrolyte sensors
are applied (Pandey et al., 2012). Sensing principle is either amperometric
or potentiometric. In amperometry, changes in the current signal are related
to the concentration of the analyte; in potentiometry, changes in the voltage
are measured (Vlasov et al., 2010). In optical sensors, the analyte interacts
with the light emitted by the optical fiber and the attenuation of the light

8/17/2019 see page 29
http://slidepdf.com/reader/full/see-page-29 49/260
2. Introduction
19
waves can be detected by absorption, luminescence or by the optical
response of an intermediate agent (Sarma and Tao, 2007). Different types
of carbon nanotubes are used as the conducting material in conducting-
polymer sensors, while the polymer offers the selectivity to the targeted gas
(Hernandez et al., 2012; Mohammadzadeh et al., 2012). Also polyaniline-
based nanofibers are used for H2S and VOSCs sensing (Liu et al., 2012).
2.4.2 Sulf ide detection
Once dissociated in aqueous solutions, H2S is found as TDS, commonly
referred to as simply sulfide. Many sulfide detection systems are available,as the traditional methods of methylene blue (MB), the iodimetric and the
ion-selective methods (APHA, 2006a). In the MB method, sulfide, ferric
chloride and dimethyl-p-phenylenediamine react to form MB, quantified by a
colorimetric method. The iodimetric method consists in the titrimetric
quantification of oxidated S2- with iodine. ISEs based on silver sulfide
electrodes are commercially available for reliable determination of S2-.
However, the use of flow-based methods for sulfide determination has
gain importance in the last few years, for both direct and indirect approach
(Ferrer et al., 2007). In the direct mode, the analyte can be directly detected
by a wide number of techniques, like spectrophotometry, fluorescence,
chemiluminescence, polarography, voltammetry, amperometry or
potentiometry. In the indirect approach, sulfide is separated from the liquid
matrix and detected as H2S. Diverse flow-based techniques are available,
namely flow injection analysis (FIA), continuous flow analysis (CFA),
sequential injection analysis (SIA), multicommutation flow analysis (MCFA),
multisyringe flow analysis (MSFA) and the latest developed lab-on-a-valve
platforms (LOV) (Cerda et al., 1999; Miro and Hansen, 2012). In despite of
the wide range of flow techniques existent and the large analytical
applicability of such systems, only the FIA technique will be summarized in
this thesis.

8/17/2019 see page 29
http://slidepdf.com/reader/full/see-page-29 50/260
Aerobic biotrickling filtration for biogas desulfurization
20
The FIA technique was first described by Ruzicka and Hansen (1975)
and since then it has promoted a huge develop in modern analytical
procedures in diverse fields like environmental, pharmaceutical, biological
and food applications, among others (Ruzicka, 1994; Hansen, 1996;
Evgenev et al., 2001; Trojanowicz, 2009; Felix and Angnes, 2010; Dilgin et
al., 2012; Ertek et al., 2012; Melchert et al., 2012). A simplified schematic of
a FIA manifold is shown in Figure 2.2. The sample to be analyzed is
injected and dispersed into a continuous carrier solution flow that is directed
to the detection system, in which a transitory signal peak is obtained. The
detector identifies a baseline when no sample is present and a peak when
the sample is detected. The analytical response is the difference between
peak heights and the baseline.
Figure 2.2 Schematic of a typical FIA manifold
FIA, as well as others flow-based techniques, offers several advantages
when compared to off-line systems, such as the automatic preparation of
samples, the continued calibration of sensors and the simultaneous
detection of multiple analytes, besides the well-known advantages related
to the high reproducibility, stability, fast response, low reagents
consumption and low cost.
Peristaltic
pump
Injection
valve
Carrier
Waste
Sample
Detection
system
ISE
Sample
loop

8/17/2019 see page 29
http://slidepdf.com/reader/full/see-page-29 51/260
2. Introduction
21
2.4.3 Sulfate detect ion
SO42- is one of the most abundant anions in marine environment and it is
the predominant S-species in soil. SO42- determination is of special
importance for environmental atmospheric management, remarkably when
referred to the acid rain precipitation. It is also a relevant compound in
various chemical and pharmaceutical processes. In water analysis, SO42- is
analyzed by a turbidimetric method (APHA, 1980). However, different
methods have been developed for other applications in which SO42- is
present at low concentrations, such as ion chromatography (IC), capillary
electrophoresis and ISEs.
Polymeric-based membrane ISEs have been developed for more than 60
analytes, being the most frequently applied chemical sensor type. Among
others chemical sensors, ISEs present many advantages, such as analysis
speed, portability, no sample destruction and a wide range of measuring,
besides their essential property of selectivity (de Marco et al., 2007).
However, selectivity in ISEs depends on a large extend on the presence of
neutral or electrically charged lipophilic complexing agents known as
ionophores, that interact selectively with the targeted analyte (Bakker et al.,
1999; Buhlmann et al., 2000). Besides the ionophore, other components of
a polymeric membrane are the polymeric matrix, a plasticizer and lipophilic
ionic additives (Faridbod et al., 2008). Lipophilic additives enhance the
diffusion of the analyte inside the membrane and are of capital significance
in highly hydrophilic anions, like SO42-, which is at the end of the Hofmeister
selectivity sequence (organic anions > ClO4- > SCN- > I- > NO3- > Br - > Cl- >
HCO3- > SO4
2-, HPO42-), a widely accepted and used lipophilicity expression
(Wojciechowski et al., 2010). Ionophores based on urea compounds have
been successfully applied for SO42- sensing, due to their high binding
affinity and selectivity (Nishizawa et al., 1998; Phillips et al., 2005; Jia et al.,
2010; Young and Jolliffe, 2012). A comprehensive review on nowadays-
published literature regarding polymeric matrix ISEs for SO42- sensing is
presented later on Chapter 6.

8/17/2019 see page 29
http://slidepdf.com/reader/full/see-page-29 52/260
Aerobic biotrickling filtration for biogas desulfurization
22
2.5 Energy from biogas
The European Union has a target from its energy and climate change
policy known as the 20/20/20 goal that establish 20% of renewable energy
in the final energy demand, 20% of reduction of greenhouse gases
emissions and 20% of increase of energy efficiency. Global actions are
been already taken at a long term perspective, envisioning the reduction of
global emissions by about 40% by 2050 and decreasing greenhouse gases
emissions by 80-95% by 2050 (European Commission, 2011; Duic et al.,
2013). In Spain, about 25% of the electric power comes currently from
renewable energy sources, mainly wind and solar thermoelectric and
photovoltaic technologies (Ruiz-Romero et al., 2012). Promotion policies for
the development of renewable energy technologies, such as biogas, are
priority in global sustainable energy actions (San Miguel et al., 2010).
However, besides the inherent technical challenge, social resistance
showed by the unwillingness to pay extra costs of renewable energy
(Gracia et al., 2012), is another difficulty to overcome.
Biogas is a versatile renewable fuel that, because of its high energetic
content, can be used as an energy source for power and heat or cool
production. Biogas consists mainly of methane (CH4) and carbon dioxide
(CO2), but also contains some trace compounds such as H2S, thiols,
siloxanes, ammonia and other volatile organic compounds (VOCs), as
detailed in Table 2.5. Yet, the composition of biogas depends intimately on
the origin and characteristics of the substrate.
A content in CH4 higher than 45% makes the biogas a flammable
mixture, whit 4.4 to 15% of CH4 in air. Thus, the conversion of its chemical
energy into heat, electricity or fuel is possible by combustion. Also, the
interest in the exploitation of biogas energy potential has been encouraged
by the increasing global concern about climate change, specially related to
the greenhouse gases emissions, and as an alternative option to facing the
fossil fuels depletion (Abatzoglou and Boivin, 2009; Hennig and Gawor,2012; Yamasaki et al., 2013).
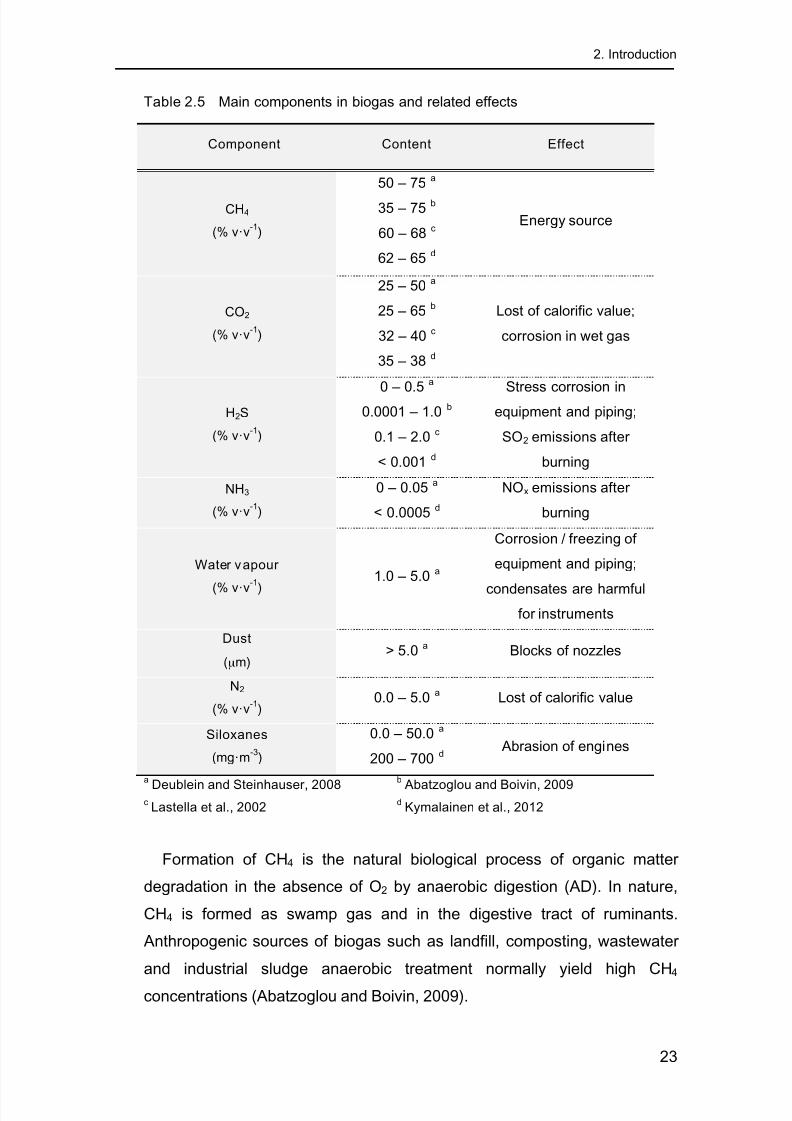
8/17/2019 see page 29
http://slidepdf.com/reader/full/see-page-29 53/260
2. Introduction
23
Table 2.5 Main components in biogas and related effects
Component Content Effect
CH4
(% v·v-1
)
50 – 75 a
35 – 75 b
60 – 68 c
62 – 65 d
Energy source
CO2
(% v·v-1
)
25 – 50 a
25 – 65 b
32 – 40 c
35 – 38 d
Lost of calorific value;
corrosion in wet gas
H2S
(% v·v-1
)
0 – 0.5
a
0.0001 – 1.0 b
0.1 – 2.0 c
< 0.001 d
Stress corrosion inequipment and piping;
SO2 emissions after
burning
NH3
(% v·v-1
)
0 – 0.05 a
< 0.0005 d
NOx emissions after
burning
Water vapour
(% v·v
-1
)
1.0 – 5.0 a
Corrosion / freezing of
equipment and piping;
condensates are harmful
for instruments
Dust
(μm)> 5.0 a Blocks of nozzles
N2
(% v·v-1
)0.0 – 5.0 a Lost of calorific value
Siloxanes
(mg·m-3
)
0.0 – 50.0 a
200 – 700 d Abrasion of engines
a
Deublein and Steinhauser, 2008b
Abatzoglou and Boivin, 2009c Lastella et al., 2002
d Kymalainen et al., 2012
Formation of CH4 is the natural biological process of organic matter
degradation in the absence of O2 by anaerobic digestion (AD). In nature,
CH4 is formed as swamp gas and in the digestive tract of ruminants.
Anthropogenic sources of biogas such as landfill, composting, wastewater
and industrial sludge anaerobic treatment normally yield high CH4
concentrations (Abatzoglou and Boivin, 2009).

8/17/2019 see page 29
http://slidepdf.com/reader/full/see-page-29 54/260
Aerobic biotrickling filtration for biogas desulfurization
24
AD is widely applied for wastewater sludge and municipal solid waste
treatment, agricultural and livestock wastes and diverse industrial effluents
(Khalid et al., 2011). AD can be understood as a succession of four main
reactions: hydrolysis, acidogenesis, acetogenesis and methanogenesis.
During hydrolysis, organic molecules are de-polymerised by extra-cellular
enzymes; obtained monomers are then converted into short- and long-chain
organic acid, alcohols, hydrogen and CO2. Then, bacteria known as
acetogens degrade the products from acidogenesis phase to produce acetic
acid, hydrogen and CO2. Acetic acid is finally degraded by methanogenic
bacteria, producing CH4 (Deublein and Steinhauser, 2008). The CH4
content in the biogas depends on the control of several operational
parameters during AD, such as H2 partial pressure, concentration of
microorganisms, type of substrate, pH, temperature and nutrients C/N ratio.
Biogas impurities, remarkably H2S and other RSCs, must be removed
before energy production, avoiding equipment corrosion and because of the
risk of releasing sulfur oxides. Allowable H2S amount in biogas for energy
recovery purposes varies from 1 to 10 ppmv of H2S in the case of fuel cells
applications and through 130 to 500 ppmv of H2S for gas motor and burning
engines, respectively (Deublein and Steinhauser, 2008; Ciccoli et al., 2010).
2.6 Desulfurization technologies
2.6.1 Physicochemical technologies
Technologies for the desulfurization of gas streams could be divided
according to the quantity of H2S to be removed. In this way, for large
quantities of H2S removed (> 20 t S·day-1), we must refer to the classical
Claus process, schematized in Figure 2.3 (de Angelis, 2012), applied
largely at the petrochemical and related industries (Tyurina et al., 2011).
Normally used for the recovery of sulfur after a previous concentration step
by amine absorption, the Claus process consists in a step of combustionfollowed by a cascade configuration of catalytic reactors. When CO2 and

8/17/2019 see page 29
http://slidepdf.com/reader/full/see-page-29 55/260
2. Introduction
25
H2S are present, the selection of the amine is related to the ratio of these
components. Commonly used amine solutions are monoethanolamine
(MEA), diethanolamine (DEA) and methyldiethanolamine (MDEA) (Busca
and Pistarino, 2003).
Figure 2.3 Schematic of the Claus process
Most of S0 is currently produced by the Claus process and commercially
valorized for the production of sulfur compounds, mainly sulfuric acid
(Busca and Pistarino, 2003). However, the gaseous out stream of the last
catalytic reactor of the Claus process (tail gas) contain a mixture of sulfur
compounds (H2S, SO2, COS, CS2 and S0) and need further hydrogenation
before being recycled to the first reactor (de Angelis, 2012).
For the removal of moderate to low H2S quantities (< 20 t S·day-1), most
frequently applied physicochemical technologies are based in absorption,
adsorption and direct conversion of sulfur compounds. The dissolution of a
gas stream directly into a solvent liquid is known as chemical absorption
(Figure 2.4) (Busca and Pistarino, 2003). The selection of the liquid
absorbent is done accordingly with the nature and properties of the
contaminant and the operational conditions (Rene et al., 2012).
H2S
Air
Furnace
Liquid sulphur
Tail gas
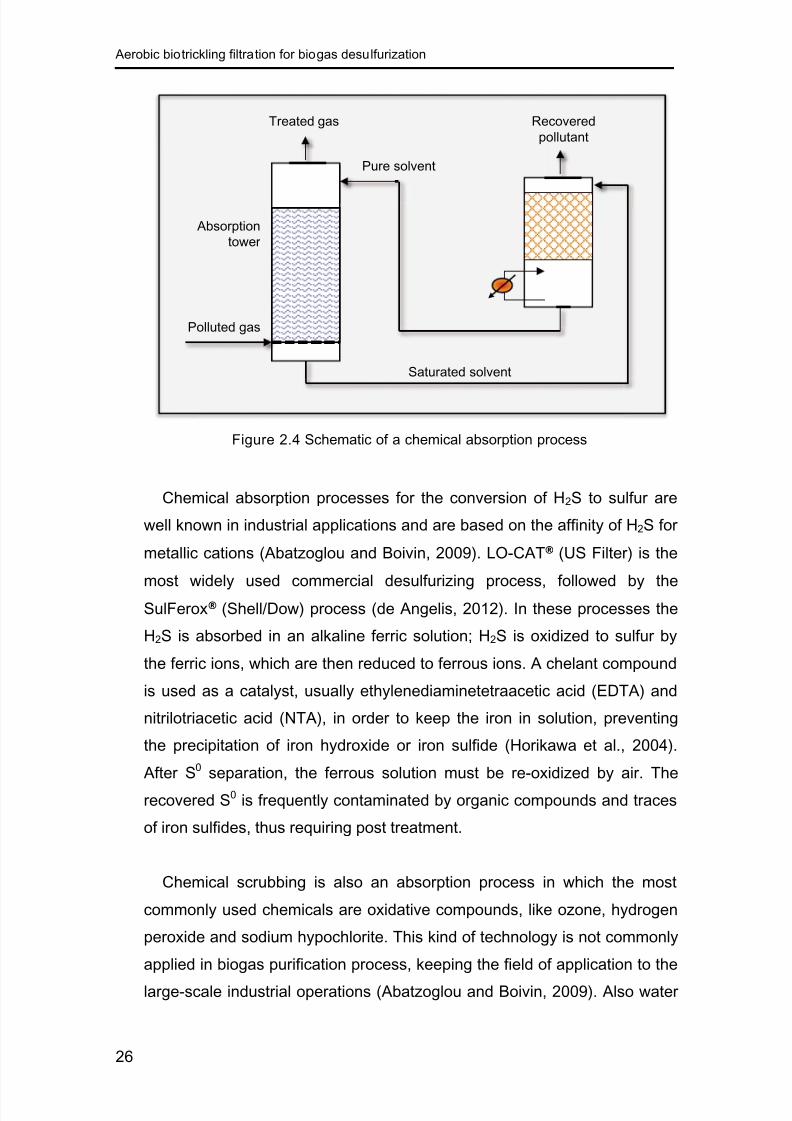
8/17/2019 see page 29
http://slidepdf.com/reader/full/see-page-29 56/260
Aerobic biotrickling filtration for biogas desulfurization
26
Figure 2.4 Schematic of a chemical absorption process
Chemical absorption processes for the conversion of H2S to sulfur are
well known in industrial applications and are based on the affinity of H2S for
metallic cations (Abatzoglou and Boivin, 2009). LO-CAT® (US Filter) is the
most widely used commercial desulfurizing process, followed by theSulFerox® (Shell/Dow) process (de Angelis, 2012). In these processes the
H2S is absorbed in an alkaline ferric solution; H2S is oxidized to sulfur by
the ferric ions, which are then reduced to ferrous ions. A chelant compound
is used as a catalyst, usually ethylenediaminetetraacetic acid (EDTA) and
nitrilotriacetic acid (NTA), in order to keep the iron in solution, preventing
the precipitation of iron hydroxide or iron sulfide (Horikawa et al., 2004).
After S0 separation, the ferrous solution must be re-oxidized by air. The
recovered S0 is frequently contaminated by organic compounds and traces
of iron sulfides, thus requiring post treatment.
Chemical scrubbing is also an absorption process in which the most
commonly used chemicals are oxidative compounds, like ozone, hydrogen
peroxide and sodium hypochlorite. This kind of technology is not commonly
applied in biogas purification process, keeping the field of application to the
large-scale industrial operations (Abatzoglou and Boivin, 2009). Also water
Absorption
tower
Treated gas
Pure solvent
Recovered
pollutant
Polluted gas
Saturated solvent
8/17/2019 see page 29
http://slidepdf.com/reader/full/see-page-29 57/260
2. Introduction
27
scrubbing is suitable for air pollution control, normally in countercurrent type
packed scrubbers, but the elevated consumption of water and the need of
multiple units are economical and technical limitations for its application in
environmental desulfurization (Rene et al., 2012). Conversion of H2S to low
solubility metallic sulfides is done by the diffusion of the H2S-containing gas
into sulfate aqueous solutions, such as CuSO4 or ZnSO4, but also a ferric
solution is needed to form S0 via a redox reaction. The application of this
technology implies high costs and complexity, being not suitable for low
scale desulfurization (Abatzoglou and Boivin, 2009).
Physical or physicochemical adsorption is based in the selective
adsorption of the pollutant into a solid adsorbent. Most commonly applied
adsorbents are activated carbons, activated alumina, silica gels and zeolites
(Schlegelmilch et al., 2005; Estrada et al., 2012). Wood chips impregnated
with iron oxides, also known as iron sponge, is the most frequently used
iron-oxide technology for biogas desulfurization, normally operated in batch
mode with a separate regeneration step (Abatzoglou and Boivin, 2009). In
thermal treatment, both catalytic and non-catalytic techniques can be used.
Catalytic processes allow the application of lower temperatures, hence
reducing energy costs. However the cost of catalysts remain an important
issue to be taken into account.
2.6.2 Biological technologies
Based on naturally occurring bioprocesses, biological technologies for
the desulfurization of gas streams are widely applied, mainly for biogas
purification and odor control operations, but also for highly-loaded gas
streams treatment. Biological reactors are considered to be effective,
reliable, environmentally friendly, robust and economical. Some attractive
features of biological processes are the low chemical consumption and the
relatively low energy requirements, since bioprocesses normally are
conducted at atmospheric pressure and ambient temperature. Also,
biological systems do not transfer pollutants to other media, like scrubbing
8/17/2019 see page 29
http://slidepdf.com/reader/full/see-page-29 58/260
Aerobic biotrickling filtration for biogas desulfurization
28
liquids or adsorbents. The advantages of biological desulfurization when
compared with physicochemical technologies are evident from both
technical and economical point of views (Devinny et al., 1999; Burgess et
al., 2001; Schlegelmilch et al., 2005). Biological technologies are believed
to present an operating cost up to six times lower than physicochemical
ones, with the additional advantages to be less sensitive than those
(Estrada et al., 2012).
Microorganisms associated with sulfur compounds removal are normally
present as a biofilm layer that grows attached to a carrier material, but also
systems with suspended biomass are available. Pollutants in the gas phase
must be transferred to the biofilm or absorbed into the liquid phase to be
biologically degraded. Moisture or liquid content is thus a vital parameter,
frequently controlled together with others such as temperature, pH and
nutrients content (Devinny et al., 1999). Biofilters and BTFs are the most
commonly used reactor configurations for desulfurization of waste gases
(Estrada et al., 2012; Rene et al., 2012). Also bioscrubbers have been
applied for H2S and VOCs removal and other biotechnologies such as
membrane bioreactors, two-phase bioreactors and activated sludge
diffusion (Iranpour et al., 2005; Kennes et al., 2009). Moreover, the
combination of physicochemical and biological technologies or the use of
two-stage biological reactors is recommended to overcome some specific
operational restrictions (Rene et al., 2012). BTF operation will be presented
in more details in order to define and characterize the reactor configuration
used in this research.
Bioscrubbers
Bioscrubbers (Figure 2.5) are a combination of an absorption unit
followed by a separated biological unit. In the absorption step, commonly a
packed tower configuration, the contaminant is absorbed into the liquid
phase and then, once absorbed, is directed to a separated agitated
bioreactor, usually a conventional activated sludge reactor. Once the
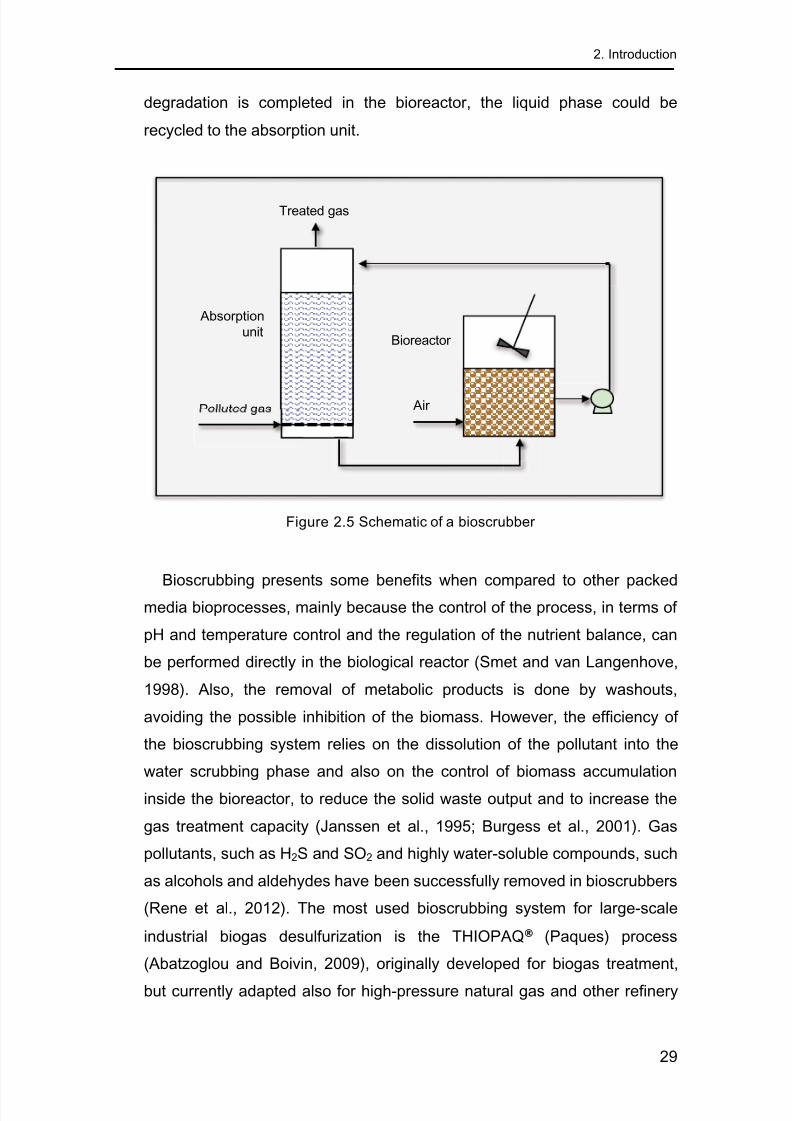
8/17/2019 see page 29
http://slidepdf.com/reader/full/see-page-29 59/260
2. Introduction
29
degradation is completed in the bioreactor, the liquid phase could be
recycled to the absorption unit.
Figure 2.5 Schematic of a bioscrubber
Bioscrubbing presents some benefits when compared to other packed
media bioprocesses, mainly because the control of the process, in terms of
pH and temperature control and the regulation of the nutrient balance, can
be performed directly in the biological reactor (Smet and van Langenhove,
1998). Also, the removal of metabolic products is done by washouts,
avoiding the possible inhibition of the biomass. However, the efficiency of
the bioscrubbing system relies on the dissolution of the pollutant into the
water scrubbing phase and also on the control of biomass accumulation
inside the bioreactor, to reduce the solid waste output and to increase the
gas treatment capacity (Janssen et al., 1995; Burgess et al., 2001). Gas
pollutants, such as H2S and SO2 and highly water-soluble compounds, such
as alcohols and aldehydes have been successfully removed in bioscrubbers
(Rene et al., 2012). The most used bioscrubbing system for large-scale
industrial biogas desulfurization is the THIOPAQ® (Paques) process
(Abatzoglou and Boivin, 2009), originally developed for biogas treatment,
but currently adapted also for high-pressure natural gas and other refinery
Air
Treated gas
Polluted gas
Absorption
unit Bioreactor

8/17/2019 see page 29
http://slidepdf.com/reader/full/see-page-29 60/260
Aerobic biotrickling filtration for biogas desulfurization
30
gases desulfurization (van den Bosch et al., 2007; Janssen et al., 2008).
The system consists in a scrubbing unit with sodium carbonate followed by
a bioreactor, in which microorganisms of the genus Thiobacillus are
responsible for the oxidation of sulfide to elemental sulfur. THIOPAQ®
technology is also frequently applied in the petrochemical industry, with the
advantage of substituting the traditional amine absorption plus Claus
process plus Tail gas treatment (Benschop et al., 2004).
Biofilters
Traditionally designed as open soil beds, biofilters (Figure 2.6) havebeen extensively used for waste gas and odor control in industrial and
municipal facilities (Iranpour et al., 2005). The improvement on the design
and operation of this kind of reactor lead to more complex features with
closed system configurations and automated control (Rene et al., 2012;
Shareefdeen, 2012). When potentially toxic pollutants are treated by
biofiltration, a closed reactor configuration is required because of the
associated environmental and health restrictions.
Figure 2.6 Schematic of an open-bed biofilter
Treated gas
Air
Polluted gas
Intermittent water and
nutrients supply
Drain

8/17/2019 see page 29
http://slidepdf.com/reader/full/see-page-29 61/260
2. Introduction
31
Characteristically an aerobic process, biofiltration consists in the pass of
the contaminated gas stream through a porous bed that supports
immobilized microorganisms; the contaminant in the gas phase is first
absorbed into the water interphase of the biofilm and then biologically
degraded. Biofilters are normally packed with organic materials, like
compost, wood, pine bark, peat, granulated sludge and other materials
(Dumont and Andres, 2009; Pantoja-Filho et al., 2010; Dumont et al.,
2012a). This feature provides a nutrient source for the microorganisms,
minimizing the needs of extra nutrients supply. However, the moisture of the
filter bed must be ensured and periodical watering of the biofilter must be
provided in order to keep the water content of the filter bed (Devinny et al,
1999; Dorado et al., 2010).
Major drawbacks in biofiltration refers, jointly with the humidity control of
the filter bed, to the need of large quantities of packing material, to the
deterioration of the packing at the long-term operation, leading to a loss of
performance, and to the accumulation of metabolites from the biological
degradation process. Also, major cost of the biofilters operation is related to
the packing material replacement (Prado et al., 2009; Rojo et al., 2012).
The effectiveness of the biofiltration process depends on the nature of the
pollutant and its water solubility as well as on the activity of the biofilm. To
ensure an effective operation, also other parameters must be controlled,
such as the media pH, temperature, bed moisture, nutrients supply, O2
availability and pressure drop inside the filter bed (Burgess et al., 2001;
Devinny and Ramesh, 2005; Andreasen et al., 2012).
Various organic and inorganic compounds have been successfully
treated in biofilters, like alcohols, aldehydes, ketones, hydrocarbons,
carboxylic acids, H2S and NH3 (Iranpour et al., 2005; Rene et al., 2012;
Detchanamurthy and Gostomski, 2012). The biofiltration of H2S have been
extensively reported, especially for odor control, where low concentrations
of H2S are present and high flow rates are applied (Hirai et al., 1990; Wani
et al., 1999; Cho et al., 2000; Elias et al., 2002; Malhautier et al., 2003;Schieder et al, 2003). Fungal biofilters have been successfully applied on

8/17/2019 see page 29
http://slidepdf.com/reader/full/see-page-29 62/260
Aerobic biotrickling filtration for biogas desulfurization
32
the removal of hydrophobic VOCs, due to the capability to perform under
extreme acidic pH conditions with low humidity content (van Groenestijn et
al., 2001; Kennes and Veiga, 2004; Vergara-Fernandez et al., 2012).
Biotrickling filters
BTFs (Figure 2.7) work quite similarly to biofilters, except that the
packed bed is continuously trickled over with a nutrient solution. Packing
material is usually of inert nature (Devinny et al., 1999; Kennes et al., 2009).
Plastic, metallic or ceramic rings, saddles and spherical elements and
polyurethane (PU) foam are commonly used. Also, perlite, celite, lava rockand activated carbon (Ramirez et al., 2009) are applied.
Figure 2.7 Schematic of a counter-current biotrickling filter
Mass transfer from gaseous to liquid phase of packed towers has been
comprehensively studied and the effect of fluid dynamics has been
established for a large number of commonly applied random packing
materials (Mackowiak, 2011). However, in BTFs, mass transfer is
profoundly affected by the development of the biofilm layer, even if it can bemaximized with increasing the gas velocity (Kim and Deshusses, 2008a).
Treated gas
Air
Nutrients
supply
Recycle
pump
Polluted gas
Liquid purge

8/17/2019 see page 29
http://slidepdf.com/reader/full/see-page-29 63/260
2. Introduction
33
Microorganisms attached to packing material develop in a complex
biofilm, where the pollutant absorption and diffusion take place. The
polluted gas is forced to pass through the packed bed in either down or
upflow mode, while the liquid phase is collected in a sump and continuously
recycled over the packing. Reactor inoculation is required because of the
inert nature of the packing material. Specific inoculation with selected
microbial strains or non-specific inoculation, with a mixture of
microorganisms can be used (Aroca et al., 2007; Sercu et al., 2007).
Biomass growth control is an important operational parameter to prevent
clogging of the filter bed. Also, the thicker the biofilm, the worse the
pollutant and oxygen transfer through the deeper portion or the biofilm, thus
reducing the treatment efficiency and raising the pressure drop (Devinny
and Ramesh, 2005; Mannucci et al., 2012). To overcome the biomass
accumulation problem, several actions are possible, from the restriction on
nutrients supply, the addition of growth-limiting concentrations of NaCl, to
the use of predating higher organism and the development of mechanical
processes for biomass removal, like backwashing and air sparging (Devinny
et al., 1999; van Groenestijn and Kraakman, 2005; Kennes et al., 2009).
Besides maintaining the humidity and nutrients content, the recirculating
liquid phase allows an accurate control of the system pH and the biological
by-products removal by periodical purges, preventing possible inhibitory
effects (Cox and Deshusses, 1998). The superficial trickling liquid velocity
(TLV) may affect the reactor performance when exceeding a critical value
up to which no sloughing of the biomass is achieved. In BTFs, normal TLV
values are below 10 m·h-1 (Kim and Deshusses, 2008b). The performance
of the system is closely related to the pollutant solubility in the liquid phase
and a dimensionless air-water partitioning coefficient below 1 is
recommended (van Groenestijn and Hesselink, 1993; Devinny et al, 1999).
Treatment of compounds with air-water partitioning coefficients
considerably lower than 1, such as H2S, CH3SH, DMS and DMDS (Smet et
al., 1998; Liu et al., 2013) is, consequently, highly feasible in BTFs, even if
the treatment of VOCs is preferentially done in biofilters (Iranpour et al.,2005). BTFs have been successfully applied in the removal of H2S and
8/17/2019 see page 29
http://slidepdf.com/reader/full/see-page-29 64/260
Aerobic biotrickling filtration for biogas desulfurization
34
other RSC mixtures, for low and high pollutant concentrations (Ruokojarvi et
al., 2000; Gabriel and Deshusses, 2004; Kim and Deshusses, 2005; Sercu
et al., 2005; Jin et al., 2007; Fortuny et al., 2008; Arellano-Garcia et al.
2009; Ramirez et al., 2009; Tomas et al., 2009; Fortuny et al., 2011; Lafita
et al., 2012; Montebello et al., 2012).
Other bio logical technologies
Other biological technologies are also applied in the desulphurization of
air and gas streams, like membrane bioreactors, two-phase bioreactors and
activated sludge diffusion. In membrane bioreactors, pollutants in the gasphase are diffused to the liquid phase, through a membrane. Biological
degradation is achieved by the biofilm attached to the membrane, with high
mass transfer capacities. (Reij et al., 1998; Burgess et al., 2001). Selection
of the membrane type must be done taking into account pollutant properties
and hydraulic characteristics of the system. Major drawbacks of this
technique are related to the cost of the membrane. Also, excessive growth
of the biofilm can lead to fouling episodes that produces, in extreme cases,the breakdown of the system (de Bo et al., 2002; Kumar et al., 2008).
The treatment of hydrophobic VOCs and other compounds scarcely
soluble in water can be done in two-phase bioreactors. The previous
addition of a non-aqueous liquid phase, such as organic solvents or
polymers, improves the mass transfer of the pollutant. Solvents, known as
the transfer vector, are immiscible in water and slowly releases the pollutant
into the aqueous phase, where are biologically degraded; the increase in
the mass transfer is larger the greater the solubility of the compound in the
solvent (Cesario et al., 1997; Muñoz et al., 2012). Commonly used transfer
vectors are silicone oils (polydimethylsiloxanes), hexadecane and
perfluorocarbons. Recent research reports reveal promising possibility for
the application of two-phase bioreactors at industrial scale (Rocha-Rios et
al., 2011; Dumont et al., 2012b; Muñoz et al., 2012), in contrast with the
traditional laboratory-scale application of such technology.

8/17/2019 see page 29
http://slidepdf.com/reader/full/see-page-29 65/260
2. Introduction
35
Activated sludge diffusion represents an alternative, cost-effective
technology to other biological media-based bioreactors. The polluted gas
stream is sprinkled directly into the aeration tank, thus being diffused
together with the oxygen into the mixed liquor of the activated sludge unit,
making possible the biological degradation by the existent microorganisms
(Burgess et al., 2001; Barbosa et al., 2006). This technology offers the
possibility of overcoming most of the limitations encountered in biotrickling
filters and biofilters, such as the deterioration of packing materials or the
accumulation of metabolites. Nevertheless, despite the demonstrated
efficiency in the removal of H2S, the lack of reliable data has limited the
application of this technique (Lebrero et al., 2011).
2.7 The biological sulfur cycle
Sulfur can be present in a variety of oxidation states in the biological
sulfur cycle, being -2 (S2-
), 0 (S0) and +6 (SO4
2-) the most significant in
nature, as briefly shown in Figure 2.8 (adapted from Robertson and
Kuenen, 2006).
Figure 2.8 Simplified representation of the biological sulfur cycle
S(x)2-
S0n
Organic
RSC
S2O32-
SO42-
Sulfidic
minerals
(pyrite)
dissimilatory SO42- reduction
biological oxidation with O2 / NO3-
b i o l o g i c a l o x i d a t i o n
SO42-
reserves
(seawater)
d i s s i m
i l a t o
r y
s u l f u
r r e d
u c t i o
n b i o l o g i c a l
o x i d a t i o n
Sulfur
deposits
assimilatory SO42-
reduction
mineralization
processes
b i o l o g i c a l o x i d a t i o n
a n a e r o b i c
o x i d a t i o n
b y
p h o t o t r o p h i c
b a c t e r i a
a n a e r o b i c
o x i d a t i o n
b y
p h o t o t r o p h i c
b a c t e r i a

8/17/2019 see page 29
http://slidepdf.com/reader/full/see-page-29 66/260
Aerobic biotrickling filtration for biogas desulfurization
36
Inorganic sulfur plays an important role in biological metabolism, being
used either as a sulfur source in assimilatory metabolism or as electron
donor/acceptor in the dissimilatory metabolism, allowing very important
biological energy processes (Bruser et al., 2004). Many oxidation-reduction
reactions occur in both sides of the sulfur cycle. SO42-
, on the reductive
side, acts as an electron acceptor and is converted to S2- by numerous
microorganisms. On the oxidative side, RSCs act as electron donors to be
converted to S0 and SO4
2- by phototrophic or chemolithotrophic bacteria
(Robertson and Kuenen, 2006; Tang et al., 2009). The oxidative side of the
sulfur cycle is more relevant for the understanding of the concepts focused
in this thesis.
The biological removal of H2S can be overall described according to the
Equation 6 (Syed et al. 2006), considering the simplified metabolism of
chemotrophs organisms.
H2S + CO2 + nutrients + O2 cells + S0 / SO4
2- + H2O [6]
When the oxidation is partially achieved, high values of SO3
2-
and S
2-
arefound. The complete pathway of sulfide oxidation has been proposed as the
intermediates sequence oxidation according to Equation 7 (Duan et al.,
2005), being S0 and SO4
2- the final products with the formation of
intermediary products such as thiosulfate, dithionate, trithionate,
tetrathionate and sulfite.
H2S S0 S
2O
3
2- S2O
6
2- S3O
6
2- S4O
6
2- SO3
2- SO4
2- [7]
However, biological degradation depends strongly on the type of bacteria
present. Chemotrophic bacteria are able to oxidize H2S using O2 as an
electron acceptor. The electron donors could be S0, H2S, or S2O32- (Tang et
al., 2009). Aerobic biological sulfide oxidation can be described according to
Equation 8 and Equation 9 (Kelly, 1999).
HS- + 0.5 O2 S0 + OH- { G0 = -145.2 kJ (mol S-substrate)-1} [8]
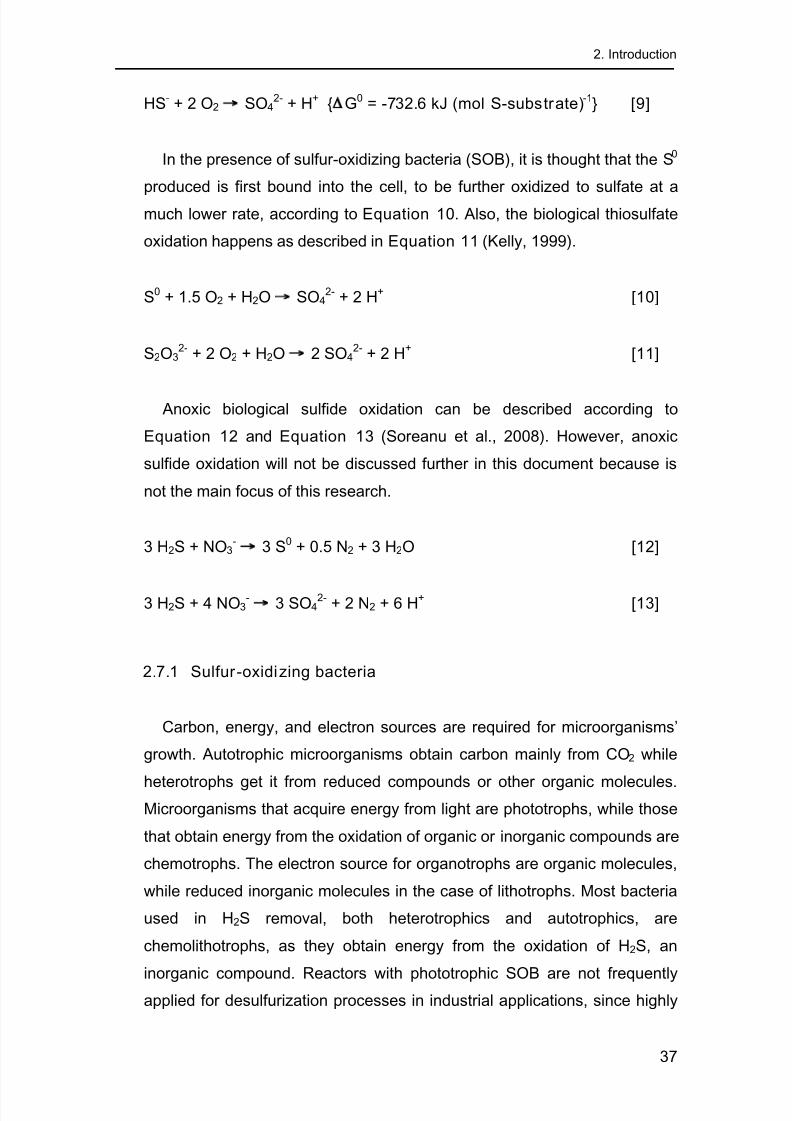
8/17/2019 see page 29
http://slidepdf.com/reader/full/see-page-29 67/260
2. Introduction
37
HS- + 2 O2 SO42- + H+ { G0 = -732.6 kJ (mol S-substrate)-1} [9]
In the presence of sulfur-oxidizing bacteria (SOB), it is thought that the S0
produced is first bound into the cell, to be further oxidized to sulfate at a
much lower rate, according to Equation 10. Also, the biological thiosulfate
oxidation happens as described in Equation 11 (Kelly, 1999).
S0 + 1.5 O2 + H2O SO42- + 2 H+ [10]
S2O32-
+ 2 O2 + H2O 2 SO42-
+ 2 H+ [11]
Anoxic biological sulfide oxidation can be described according to
Equation 12 and Equation 13 (Soreanu et al., 2008). However, anoxic
sulfide oxidation will not be discussed further in this document because is
not the main focus of this research.
3 H2S + NO3- 3 S0 + 0.5 N2 + 3 H2O [12]
3 H2S + 4 NO3- 3 SO4
2- + 2 N2 + 6 H
+ [13]
2.7.1 Sulfur-oxidizing bacteria
Carbon, energy, and electron sources are required for microorganisms’
growth. Autotrophic microorganisms obtain carbon mainly from CO2 while
heterotrophs get it from reduced compounds or other organic molecules.Microorganisms that acquire energy from light are phototrophs, while those
that obtain energy from the oxidation of organic or inorganic compounds are
chemotrophs. The electron source for organotrophs are organic molecules,
while reduced inorganic molecules in the case of lithotrophs. Most bacteria
used in H2S removal, both heterotrophics and autotrophics, are
chemolithotrophs, as they obtain energy from the oxidation of H2S, an
inorganic compound. Reactors with phototrophic SOB are not frequently
applied for desulfurization processes in industrial applications, since highly

8/17/2019 see page 29
http://slidepdf.com/reader/full/see-page-29 68/260
Aerobic biotrickling filtration for biogas desulfurization
38
clean and transparent reactors are required. In Table 2.6, representative
chemotrophic SOB that have been described to growth lithotrophically by
the oxidation of RSCs are presented (Bruser et al., 2004; Robertson and
Kuenen, 2006; Syed et al., 2006).
Table 2.6 Representative chemotrophic SOB
Bacteria Trophy SubstrateOptimum pH
growth
α
- P r o t e o -
b a c t e r i a
Rhodobacter F HS-, S2O32-, S0 6.5 – 7.5
Paracoccus versutus F HS-, S2O32-, S0 6.0 – 8.0
Thiobacillus novellus F S2O32- 6.0 – 8.0
- P r o t e o b a c t e r i a
Thiobacillus thioparus O HS-, S2O32-, S0 6.0 – 8.0
Thiobacillus denitrificans O HS-, S2O32-, S0 6.8 – 7.4
Thiomonas thermosulfatus F S2O32-, S0 5.2 – 5.6
Thiomonas cuprinus F S0 3.0 – 4.0
Thiomonas intermedia F HS-, S2O32-, S0 5.5 – 6.0
γ
- P
r o t e o b a c t e r i a
Beggiaota F HS-, S2O32- 6.0 – 8.0
Acidithiobacillusferrooxidans
O HS-, S2O32-, S0 2.0 – 4.0
Acidithiobacillusthiooxidans
O HS-, S2O32-, S0 2.0 – 3.5
Halothiobacillus
halophillusO S2O3
2- 7.0
Halothiobacillusneapolitanus O HS-, S2O32-, S0 6.0 – 8.0
Thiomicrospira O HS-, S2O32- 6.0 – 8.0
Thiotrix nivea F HS-, S2O32-, S0 6.0 – 8.5
ε
- P r o t e o -
b a c t e r i a Thiovulum O HS-, S0 6.0 – 8.0
Sulfurimonas denitrificans O HS-, S2O32-, S0 6.0 – 8.0
F: facultative autotroph
O: obligate autotroph

8/17/2019 see page 29
http://slidepdf.com/reader/full/see-page-29 69/260
2. Introduction
39
Several studies in H2S biofiltration and biotrickling filtration indicate that
obligate chemoautotrophs Thiobacillus sp. and Acidithiobacillus sp. are the
most frequently applied SOB (Robertson and Kuenen 2006). In Table 2.7,
main growth conditions and other information for most representative
Acidithiobacillus sp. and Thiobacillus sp. are given (Robertson and Kuenen,
2006; Syed et al., 2006).
Table 2.7 Main characteristics of Acidithiobacillus sp. and Thiobacillus sp.
Ac id ithiob aci llus
ferrooxidans
Ac id ithiob acil lus
thiooxidans
Thiobacillus
thioparus
Thiobacillus
denitrificans
Optimal pH
growth2.0 – 4.0 2.0 – 3.5 6.0 – 8.0 6.8 – 7.4
Optimal
temperature
growth (ºC)
30 – 35 28 – 30 28 30
Energy
sourceFe2+, RSCs
H2S, S0, poli-
thionatesS2O3
2-, S2- S2O3
2-, S4O52-,
SCN-, S2-, S0
Oxygen
requirement
Facultative
anaerobe
Strictly
aerobe
Strictly
aerobe
Facultative
anaerobe

8/17/2019 see page 29
http://slidepdf.com/reader/full/see-page-29 70/260
Aerobic biotrickling filtration for biogas desulfurization
40

8/17/2019 see page 29
http://slidepdf.com/reader/full/see-page-29 71/260
3objectives

8/17/2019 see page 29
http://slidepdf.com/reader/full/see-page-29 72/260
Aerobic biotrickling filtration for biogas desulfurization
42
I want t o un der st and y ou;
I st udy y our obscu r e lan guage.
l x a n d er S P u s h k i n
M oscow, 179 9 Saint Petersburg, 1837
8/17/2019 see page 29
http://slidepdf.com/reader/full/see-page-29 73/260
43
3 Objectives
The general objective of this research was to improve the existingknowledge in the aerobic biotrickling filtration of biogas mimics aiming at the
desulfurization of high loads of H2S in a lab-scale counter-current BTF, using a
random packing material. To accomplish this main purpose, specific objectives
are outlined into two main categories: Monitoring and Performance.
Monitoring
• To optimize the operational conditions of an integrated continuous
gas/liquid flow analytical system for the determination of H2S(g) and total
dissolved sulfide (TDS = H2S(aq) + HS- + S2-). To achieve this objective, a
tubular ISE of a crystalline membrane of Ag2S was constructed and
characterized (Chapter 5).
• To incorporate the optimized H2S/TDS analyzer based on flow injectionanalysis technique into the BTF, for the on-line monitoring of its
performance during real operation episodes (Chapter 5).
• To validate the response of the constructed Ag2S electrodes with a
commercial available ISE for TDS measurement (Chapter 5).
• To study the application of a commercial bis-thiourea ionophore and to
optimize the composition of the sensing cocktail for the construction of an
ISE for direct determination of SO42- (Chapter 6).
• To construct conventional and tubular ISE of liquid membrane for SO42-
determination and to characterize the behavior of the electrodes as a
function of the operational conditions (Chapter 6).
• To study the selectivity of constructed SO42- electrodes in the presence of
interfering anions at concentrations found in real BTF samples (Chapter 6).

8/17/2019 see page 29
http://slidepdf.com/reader/full/see-page-29 74/260
Aerobic biotrickling filtration for biogas desulfurization
44
Performance
• To operate the studied aerobic BTF under neutral pH conditions, comprising
the start-up of the system and the optimization of the operation. The
minimization of biologically produced elemental sulfur (biosulfur) was the
initial target for neutral pH operation (Chapter 7).
• To optimize the main operational parameters for the steady-state operation
at neutral pH operation, accomplishing the minimization of biosulfur
production (Chapter 7).
• To evaluate the influence of the simultaneous removal of CH3SH and H2S
on the overall desulfurization capacity of the reactor under neutral pH
operation (Chapter 8).
• To study the effect of the gas contact time and the pollutants load on the
simultaneous removal of H2S and CH3SH (Chapter 8).
• To perform the uninterrupted transition from neutral to acidic pH operation,
without re-inoculation of the reactor (Chapter 7).
• To determine the maximum elimination capacity and to investigate the
effect of the gas contact time and the H2S load over the desulfurization
performance of the reactor under acidic pH operation (Chapter 9).
• To assess the removal efficiency and the elimination capacity along the
filter bed depth, determining the desulfurization profile of the reactor under
acidic pH operation (Chapter 9).
• To study the behavior of the system under repeated H2S starvation periods
and to evaluate the oxidation of the produced biosulfur as a clogging control
strategy under acidic pH operation (Chapter 9).

8/17/2019 see page 29
http://slidepdf.com/reader/full/see-page-29 75/260
4general materials and methods

8/17/2019 see page 29
http://slidepdf.com/reader/full/see-page-29 76/260
Aerobic biotrickling filtration for biogas desulfurization
46
T he st r ongest of all war r i or s
ar e t hese t wo T i me and P at i ence.
L ev N T ol st oy
Yasnay a Polyan a, 1828 A st apovo, 1910

8/17/2019 see page 29
http://slidepdf.com/reader/full/see-page-29 77/260
47
4 General materials and methods
General materials and methods are exposed in this Chapter. A detailedtechnical specification and operational description of the BTF system studied in
Chapter 7, Chapter 8 and Chapter 9 are presented and performance
calculations are explained. Also, the construction procedure of tubular and
conventional electrodes investigated in Chapter 5 and Chapter 6 is described
and definitions regarding the characterization of analytical systems are
provided. Finally, analytical methods are detailed. Specific techniques and
experimental conditions are presented later in each Chapter of results.
4.1 Biotrickling filter setup
The studied reactor is a conventional counter-current BTF operated at
room temperature, acclimatized at 20 – 30 ºC, in gas up-flow mode. A
schematic and a picture of the experimental setup are shown in Figure 4.1
and Figure 4.2. Main design features, equipment information, manufacturer
indication and reference conditions are detailed in Table 4.1. Synthetic
biogas, consisting of metered amounts of H2S and N2 (Carburos Metálicos,
Spain), was fed to the BTF by differential mass flow controllers (DMFC)
(Bronkhorst, The Netherlands). Dry air was injected into the bottom of the
aeration unit by a DMFC, using a fine bubble diffuser. Exceeding air from
the aeration unit was directed to the bottom of the main reactor, producing
under reference conditions a maximum dilution factor of the syntheticbiogas inside the reactor of 27%. In the case of real biogas, and taking into
account that the explosive limits for biogas are from 4.4 to 15.0% of CH4 in
air, no risk of explosion of the gas mixture is expected since the maximum
dilution ratios of biogas with air are generally below 10%. In this thesis,
biogas is always reported as prepared, with no dilution at all, simulating a
real situation. However, as the dilution inside the BTF directly affects its
performance, other parameters such as loading rate (LR), empty bed
residence time (EBRT), removal efficiency (RE) and elimination capacity

8/17/2019 see page 29
http://slidepdf.com/reader/full/see-page-29 78/260
Aerobic biotrickling filtration for biogas desulfurization
48
(EC), are reported considering this dilution term. This methodology reflects
the variation of the aeration rate, which is crucial for the calculation of the
O2/H2S supplied ratio (v·v-1), an indication of the O2 availability in gas phase.
Figure 4.1 BTF system schematic. Equipment number as in Table 4.1
pH, T
DO
LC
HCl
pH C
NaOH
ORP DO
FIA (TDS)
Mineralmedium
Gas inlet
G 1/3
G 2/3
G 3/3
Gas outlet
DMFC H2S
DMFC N2
DMFC CH3SH
DMFC Air
Sampling to IC(SO4
2- / S2O32-)
Purge
Recirculation
DMFC Air(H2S sensor)
GD-CFA (H2S)
H2Ssensor
Sampling to GC(CH3SH)
NaClOtrap
NaHCO3
Aeration
unit
Humidification column(H2S sensor)
1
3
4
5
6
7
8
9
10
11
12
13
14
15
16
17
18 19
20
21 22
23
24
25
26
27
28
2
Mainreactor

8/17/2019 see page 29
http://slidepdf.com/reader/full/see-page-29 79/260
4. General materials and methods
49
Figure 4.2 Image of the BTF experimental setup
Outlet gas phase is suited with online monitoring of H2S (EuroGas
Management, UK), as detailed further in Section 4.7.1. Manual valve
manipulation allows H2S detection at different gas ports. Experimental setup
is prepared for the coupling of the FIA/GD-CFA system described in
Chapter 5, for the on-line detection of H2S and TDS. Moreover, laboratory
premises are equipped with atmospheric H2S sensor and alarm system.
The recirculation pump continuously trickles the liquid phase over the
packed bed. Automated pumping of mineral medium and purge, which are
interconnected to a level control system installed inside the aeration unit,
warrant the renovation of the liquid phase. An on/off pH control system
based on the addition of NaOH (1 mol·L
-1
) (Panreac, Spain) or HCl
(1 mol·L-1) (Panreac, Spain) was used to keep the pH at the desired value.

8/17/2019 see page 29
http://slidepdf.com/reader/full/see-page-29 80/260

8/17/2019 see page 29
http://slidepdf.com/reader/full/see-page-29 81/260

8/17/2019 see page 29
http://slidepdf.com/reader/full/see-page-29 82/260
Aerobic biotrickling filtration for biogas desulfurization
52
Pipe and junction accessories of H2S and CH3SH lines were in
polyvinylidene fluoride (PVDF). Pipe of air and N2 lines were in polyamide.
Liquid pipe material was silicone rubber and polyamide. Plastic valves were
used in liquid lines and safety PVDF gas valves were used in H2S and
CH3SH lines.
Liquid phase is equipped with the on-line monitoring of dissolved oxygen
(DO) (WTW, Germany), oxidation-reduction potential (ORP) (Crison
Instruments, Spain) and pH/Temperature (Crison Instruments, Spain).
Inorganic carbon source was continuously supplied as NaHCO3 (3 g C·L-1)
(Panreac, Spain). Mineral medium composition and reagent’s supplier are
detailed in Table 4.2. All reagents were off analytical grade. Trace
elements, added in a proportion of 1 mL of trace elements per liter of
mineral medium, were prepared according to Pfenning et al. (1981).
Table 4.2 Mineral medium composition
Reagent Concentration Supplier
NH4Cl 1.00 g·L-1 Panreac, Spain
KH2PO4 0.12 g·L-1 Sigma Aldrich, Germany
K2HPO4 0.15 g·L-1 Panreac, Spain
MgSO4·7H2O 0.20 g·L-1 Panreac, Spain
CaCl2 0.02 g·L-1 Panreac, Spain
Trace elements 1.00 mL·L-1
FeCl2·4H2O 1.50 mg·L-1 Panreac, Spain
H3BO3 0.06 mg·L-1 Sigma Aldrich, Germany
MnCl2·4H2O 0.10 mg·L-1 Panreac, Spain
CoCl2·6H2O 0.12 mg·L-1 Panreac, Spain
ZnCl2 0.07 mg·L-1 Panreac, Spain
NiCl2·6H2O 0.025 mg·L-1 Panreac, Spain
CuCl2·2H2O 0.015 mg·L-1 Panreac, Spain
NaMoO4·2H2O 0.025 mg·L-1 Panreac, Spain
EDTA·Na2O8·2H2O 4.28 mg·L-1 Sigma Aldrich, Germany
HCl 6.76 mL·L-1 Panreac, Spain
T r a c e e l e m e n t s : M i l l i - Q
w a t e r
( 1 8 M Ω ·
c m
- 1 ) u p t o 5 L / p H
a d j u s t e d t o 4 . 2 w i t h N a O H

8/17/2019 see page 29
http://slidepdf.com/reader/full/see-page-29 83/260
4. General materials and methods
53
Pictures of packing material used during the complete 990-days
operation are shown in Figure 4.3. Packing elements were the smallest
commercially available at the time of the operation herein reported, with a
specific surface area of 515 m2·m-3 and a packing density of 520 kg·m-3.
Figure 4.3 Images of packing material before and after BTF packing
Results previously obtained at our research group recommended the use
of random packing material for improving the biomass sampling process. It
was previously stated that the structure of the HD-QPack as packing
material, as used by Fortuny et al. (2008; 2011) and Montebello et al.
(2010), lead to a lost in the preservation of biomass samples. Metallic
material was suggested in order to improve the integrity of the sample
during its detachment from the support. The identification of the microbial
consortium of the BTF and the bacterial ecology assessment are performedby others (Maestre et al., 2010; Rovira et al., 2010; Bezerra et al., 2013). In
this sense, aiming to identify possible differences in the microbial
consortium along the filter bed, three ports for biomass and solids sampling
were mechanized in the main reactor, corresponding gas outlet sampling
ports: at the bottom section (G 1/3), at the middle section (G 2/3) and at the
top section (G 3/3) of the filter bed column height, as shown in Figure 4.1.
Also, biomass and solids were sampled from the gas inlet section, totalizingfour different biomass and solids sampling points.
8/17/2019 see page 29
http://slidepdf.com/reader/full/see-page-29 84/260
Aerobic biotrickling filtration for biogas desulfurization
54
4.2 BTF sampling procedures
4.2.1 Gas sampl ing
Gas sampling of the BTF, for off-line H2S and CH3SH quantification, was
performed using Tedlar® bags of 1 L (SKF, USA), as commonly adopted for
gas sampling. Main composition of Tedlar® bags is a polyvinyl fluoride
(PVF) polymer resin. Bags are suited with a PP valve and a replaceable
septum of 4 mm diameter, in PTFE faced silicone. If no syringe injection is
required for sample extraction, the content of the bag is extracted using the
3/16” PTFE tubing stem connection in bag’s valve. Gas sampling pointswere located at the gas inlet port of the main reactor and at the gas outlet
ports of each section of the main reactor (G 1/3, G 2/3 and G 3/3), as
shown in Figure 4.1. Furthermore, sampling points located after H2S and
CH3SH gas cylinders, but yet before the gas inlet port of the main reactor,
allowed the preparation of standards, as required for the calibration of the
respective analyzers, as well as the determination of the inlet biogas
pollutant content.
Before gas sample collection, Tedlar® bags were cleaned with dry air
three times, inside a gas fume hood with respiratory protection. Bags were
filled up to 80% of the capacity, as normally assumed for safety reasons.
Gas samples were analyzed within the first 24 hours after sample collection
(Coyne et al., 2011). Gas standards of H2S and CH3SH were prepared
using unique Tedlar® bags for each standard, avoiding contamination. The
same previous cleaning procedure as for sample collection was applied for
standards preparation. Additionally, bags were conditioned by replenishing
with the desired standard concentration before its preparation. Under
reference operation, continuous on-line sampling at outlet gas port (G 3/3)
was performed for H2S monitoring by the installed dedicated
electrochemical H2S sensor, as described later on Section 4.7.1. During
experiments, different sampling frequencies were adopted, as further
detailed in the corresponding Chapters of results.

8/17/2019 see page 29
http://slidepdf.com/reader/full/see-page-29 85/260
4. General materials and methods
55
4.2.2 Liqu id sampling
Liquid samples of the BTF for off-line determinations were taken primarily
at the purge and at the recirculation lines. Samples of the mineral medium
solution were taken at working-day frequency for ionic composition analysis
by IC, under the conditions specified later on Section 4.7.2. Samples of
bicarbonate solution were also taken for total inorganic carbon (TIC)
determination. Frequency under reference operation, volume and analytical
procedure applied to liquid samples are detailed in Table 4.3.
Table 4.3 Liquid sampling during reference operation
Sampling
point *
Sampling
frequency
Sample vo lume
(mL) Performed analysis
Purge 1 / day (labour) 1.5SO4
2-, S2O32-, NO2
-,
NO3-, Cl-, PO4
3- (by IC)
Mineral medium 1 / deposit
preparation1.5
SO42-, S2O3
2-, NO2-,
NO3-, Cl-, PO4
3- (by IC)
Bicarbonate
1 / deposit
preparation 2.0 TIC
* after respective pumping system
For ionic composition and TIC analysis, liquid samples were filtered with
disposable 0.22 μm syringe filter driven units from Millipore®, provided with
a high-density polyethylene housing and membrane of hydrophilic
Durapore®. Samples were preserved under refrigeration at 4 ºC for use
until 24 h after sample collection and under freezer at -20 ºC for longer
storage periods. Samples were diluted with Milli-Q water (18 MΩ·cm-1), in a
1:10 proportion for IC analysis and in a 1:5 proportion for TIC determination.
Additionally, a liquid sampling point was located in the recirculation line for
TDS determination applying the flow analyzer described in Chapter 5, with
a two-stage filtration system, comprising a first step of tangential filtration (3
μm) followed by a direct filtration element (0.22 μm), as later detailed in
Section 5.3.2.

8/17/2019 see page 29
http://slidepdf.com/reader/full/see-page-29 86/260
Aerobic biotrickling filtration for biogas desulfurization
56
4.2.3 Solid sampling
The content of the filter bed was fully withdrawn immediately after the
shutdown of the system to obtain viable samples of biomass and solids
from each section of the BTF (top, middle, bottom and gas inlet sections).
The final sample of solids (FSS) was prepared as shown in Figure 4.4,
obtaining one separated FSS for each filter bed section.
Figure 4.4 Preparation of the final solid sample (FSS)
Biomass and solids detachment from packing material elements was
done by washing out with a phosphate buffer saline (PBS) solution, with the
composition detailed in Table 4.4. After PBS washing, the solid was
centrifuged at 7,000 rpm during 10 minutes and then it was re-suspended in
a known volume of Milli-Q water (18 MΩ·cm-1), to rinse out PBS traces and
to recover the cleaned suspended solids. Samples were preserved under
refrigeration at 4 °C. Biomass samples were taken by others for further
biological identification. After an ultrasonication step, a portion of the
cleaned FSS solution was used to quantify cellular nitrogen (Ncell). Other
portion of FSS was used to determine total suspended solids (TSS) and
volatile suspended solids (VSS), as detailed later on Section 4.7.3.
1: Top
section
2: Middle
section
3: Bottom
section
4: Gas
inlet
section
PBS
Milli-Q
water
7,000 rpm
10 min
FSS
4 ºC
e
m
1, 2, 3, 4
(separated)
1 2 3 4

8/17/2019 see page 29
http://slidepdf.com/reader/full/see-page-29 87/260
4. General materials and methods
57
Table 4.4 PBS solution composition
ReagentConcentration
(g·L-1
) Supplier
Na3PO4·12H2O 0.328 Sigma Aldrich, Germany
NaH2PO4· H2O 0.552 Panreac, Spain
NaCl 0.526 Panreac, Spain
KCl 0.0746 Panreac, Spain
Another portion of the cleaned FSS solution was treated to obtain the
dry-FSS, as shown in Figure 4.5, for further analysis of sulfur and metals.
Dry-FSS was prepared from the FSS, applying centrifugation at 7,000 rpm
during 10 minutes, washing out with Milli-Q water (18 MΩ·cm-1
) and
additional centrifugation during 10 minutes, followed by drying at 105 °C in
a closed Falcon tube of 50 mL. Once dry, the solid was homogenized first
with spatula and then with ceramic mortar; storage was performed by
refrigeration at 4 ºC. Dry-FSS was first combusted at 1,000 ºC for S
analysis by high-performance liquid chromatography (HPLC). For metal
trace analysis by inductively coupled plasma optical emission spectroscopy(ICP-OES), dry-FSS was first microwave-digested.
Figure 4.5 Preparation of the dry-final solid sample (dry-FSS)
Milli-Q water
FSS
4 ºC
1 2 3 4
105 ºC
1 2 3 4
Dry-FSS
24 h
7,000 rpm
10 min
7,000 rpm
10 min
Solid homogenization (powder)
N
N
p H =
7
w i t h
N a O H

8/17/2019 see page 29
http://slidepdf.com/reader/full/see-page-29 88/260
Aerobic biotrickling filtration for biogas desulfurization
58
4.3 Biotrickl ing fil ter performance calculations
Operation of BTFs is normally characterized by the expression of the LR
and the EBRT, according to Equation 14 and Equation 15. Reactor’s
performance can be described by the RE and the EC, according to
Equation 16 and Equation 17 (Devinny et al., 1999). The LR represents
the mass of contaminant (H2S or CH3SH) per volume and time.
LR = [(Q biogas + Q Air IN) Cin] / V [14]
Where:
LR = Loading rate (g pollutant ·m-3
·h-1)
Q biogas + Q Air IN = Total gas flow rate (m3·h-1)
Cin = Pollutant inlet concentration (g pollutant ·m-3)
V = Reactor’s bed volume (m3)
EBRT = V / (Q biogas + Q Air IN) [15]
Where:EBRT = Empty bed residence time (s)
V = Reactor’s bed volume (m3)
Q biogas + Q Air IN = Total gas flow rate (m3·h-1)
The EBRT represents the time that the gas is in contact with the packed
bed. Once the packed bed is totally colonized by the microorganisms, the
real gas contact time inside the reactor is shorter than the EBRT. The true
residence time is calculated multiplying the EBRT by the bed porosity.
RE = [(Cin – Cout) / Cin] 100 [16]
Where:
RE = Removal efficiency (%)
Cin = Pollutant inlet concentration (g pollutant ·m-3)
Cout = Pollutant outlet concentration (g pollutant ·m
-3
)
8/17/2019 see page 29
http://slidepdf.com/reader/full/see-page-29 89/260
4. General materials and methods
59
The RE represents the fraction (%) of the contaminant removed and is
characteristic of each reactor, since it varies with the concentration of the
pollutant and is not referred to the reactor size or to the bed volume. Thus,
the expression of the elimination capacity is required.
EC = [(Q biogas + Q Air IN) (Cin – Cout)] / V [17]
Where:
EC = Elimination capacity (g pollutant ·m-3
·h-1)
Q biogas + Q Air IN = Total gas flow rate (m3·h-1)
Cin = Pollutant inlet concentration (g pollutant ·m-3)
Cout = Pollutant outlet concentration (g pollutant ·m-3)
V = Reactor’s bed volume (m3)
The EC represents the mass of the contaminant eliminated per unit
volume of the reactor and time. When the reactor performs with 100% RE,
the EC is equal to LR. When EC begins to be lower than LR, the critical EC
is reached. If the LR is still increased, eventually an overall maximum EC is
achieved (ECmax).
Another parameter used to characterize the BTF operation was the
O2/H2S supplied ratio, which expresses the volumetric relation between the
supplied O2 and H2S, according to Equation 18.
O2/H2S supplied = (0.21 Q Air IN) / Q H2S IN [18]
Where:
O2/H2S supplied = Ratio O2/H2S supplied (v·v-1)
Q Air IN = Air inlet flow – fed into aeration unit (mL air ·min-1)
Q H2S IN = H2S inlet flow – fed into main reactor (mL H2S·min-1)
This parameter indicates the O2 fed (gas phase) into the reactor,
considering the volume of air bubbled into the aeration unit. Noteworthy,
only the O2 dissolved into the liquid phase (measured as DO) is biologically

8/17/2019 see page 29
http://slidepdf.com/reader/full/see-page-29 90/260
Aerobic biotrickling filtration for biogas desulfurization
60
available for microorganisms’ metabolism, and the degree of the
oxygenation depends on the gas/liquid transference device type and
effectiveness. In this sense, the calculation of the O2/H2S supplied ratio is
intended to report the operational setup of O2 (air) and H2S, aiming the
reproducibility of exposed experiments. However, the DO measurement at
the recirculation line (Figure 4.1) disregards the effective amount of O2 that
can be transferred to the liquid as consequence of the air by-pass between
the aeration unit and the main reactor. Further research recommendations
on this topic are given later in Chapter 10.
The product of the recirculation flow rate (Q·recirculation) and the DO
concentration in the recirculation line, which is directly linked to the ratio
O2/H2S supplied ratio, corresponds to the O2 load (LO2) effectively present into
the liquid phase, calculated according to Equation 19. This parameter
expresses the biologically available O2 (dissolved), at the top of the reactor.
LO2 = DO Q recirculation [19]
Where:
LO2 = O2 load (mg O2·min-1)
DO = DO at the recirculation line (mg O2·L-1)
Q recirculation = Recirculation flow rate (L·min-1)
Also, the availability of O2, dissolved in liquid phase, in relation with the
quantity of TDS produced during sulfide accumulation episodes is the
DO/S
2-
ratio [mg O2·
(mg S
2-
)
-1
]. The DO/S
2-
ratio was calculated accordingto Equation 20. TDS was measured as described in Chapter 5.
DO/S2- = DO / TDS [20]
Where:
DO/S2- = DO/S2- ratio (mg O2·(mg S2-)-1)
DO = DO at the recirculation line (mg O2·L-1)
TDS = TDS at the recirculation line (mg S2-·L
-1)

8/17/2019 see page 29
http://slidepdf.com/reader/full/see-page-29 91/260
4. General materials and methods
61
The DO/S2- ratio could be related to the capability of the system to
produce either SO42-
or S0, according to the stoichiometric relation obtained
from Equation 8 and Equation 9 (Kelly, 1999). Theoretically, a DO/S2- ratio
lower than 0.5 indicates that S0 is the main product while a value higher
than 2 indicates that the main product is SO42-
.
The quantity of biologically produced S0 (also referred to as biosulfur)
was estimated by the difference between total S-H2S removed and the total
(SO42- + S2O3
2- + S2-) produced, according to Janssen et al. (1997).
Calculation was performed according to Equation 21, where the sub-
indexes IN-OUT and P-MM represent the sampling point for gas (in and out
ports) and liquid (purge and mineral medium) samples, respectively. SO42-
and S2O32- were quantified by IC, as described in Section 4.7.2. S2- was
quantified as TDS, measured as described in Chapter 5.
(S-S0) produced = [S-H2S] IN-OUT – [(S-SO42-)+(S-S2O3
2-)+(S-S2-)] P-MM [21]
Where:
(S-S0) produced = Amount of S0 produced (g S-S0)
[S-H2S] IN-OUT = Amount of H2S removed (g S-H2S)
[(S-SO42-)] P-MM = Amount of SO4
2- produced (g S-SO42-)
[(S-S2O32-)] P-MM = Amount of S2O3
2- produced (g S-S2O32-)
[(S-S2-)] P-MM = Amount of S2- produced (g S-S2-)
It is worth noticing that the calculation expressed in Equation 21 can
result in a negative figure in either the case of interruption of the H 2S
feeding to the system (starvation periods) or when the S0 accumulated
inside the filter bed is consumed concomitantly with the direct H2S
oxidation, increasing the total quantity of produced sulfate. Moreover, the
production rate and the selectivity of S0 and SO4
2- are defined from the
results of the sulfur mass balance. The production (pS-S0) and the
consumption (-pS-S0) rate of S0 were calculated according to Equation 22
and Equation 23, considering the expression of the velocity of each
process related to the reactor’s volume.

8/17/2019 see page 29
http://slidepdf.com/reader/full/see-page-29 92/260
Aerobic biotrickling filtration for biogas desulfurization
62
pS-S0 = [(S-S0) produced / (V t)] [22]
Where:
pS-S0 = Production rate of S0 (g S-S0·m-3
·h-1)
(S-S0) produced = Amount of S0 produced (g S-S0)
V = Reactor’s bed volume (m3)
t = Time period of reported rate (h)
-pS-S0 = [(S-S0) consumed / (V t)] [23]
Where:
-pS-S0
= Consumption rate of S0
(g S-S0
·m
-3
·h
-1
)
(S-S0) consumed = Amount of S0 consumed (g S-S0)
V = Reactor’s bed volume (m3)
t = Time period of reported rate (h)
The production rate of SO42- (pS-SO4
2-) was calculated according to
Equation 24, also considering the velocity of production of SO42- related to
the reactor’s volume.
pS-SO42- = [(S-SO4
2-) produced / (V t)] [24]
Where:
pS-SO42- = Consumption rate of SO4
2- (g S-SO42-
·m-3
·h-1
)
(S-SO42-) produced = Amount of SO4
2- produced (g S-SO42-)
V = Reactor’s bed volume (m3)
t = Time period of reported rate (h)
The sulfate selectivity is defined as the quantity of produced sulfate
referred to the total H2S removed (S-SO42-/S-H2S removed), expressed as a
percentage (Fortuny et al., 2008; Montebello et al., 2010). This parameter
represents the SO42- production capacity of the system, which is
complementary to the S0 production capacity, also calculated and defined
as the sulfur selectivity (S-S0/S-H
2S
removed). Sulfate and sulfur selectivity
were calculated according to Equation 25 and Equation 26, respectively.

8/17/2019 see page 29
http://slidepdf.com/reader/full/see-page-29 93/260
4. General materials and methods
63
S-SO42-/S-H2S removed = (S-SO4
2-) produced / (S-H2S) removed [25]
Where:
S-SO42-/S-H2S removed = Sulfate selectivity (%)
(S-SO42-) produced = Amount of SO4
2- produced (g S-SO42-)
(S-H2S) removed = Amount of H2S removed (g S-H2S)
S-S0/S-H2Sremoved = (S-S0) produced / (S-H2S) removed [26]
Where:
S-S0/S-H2S removed = Sulfur selectivity (%)
(S-S0
) produced = Amount of S0
produced (g S-S0
)(S-H2S) removed = Amount of H2S removed (g S-H2S)
4.4 Construction of tubular electrodes
Two different kind of tubular electrodes were constructed: of crystalline
membrane for H2S/TDS determination (Chapter 5) and of polymeric liquid
membrane for SO42- determination (Chapter 6). Electrodes were integrated
like detectors in two different analyzers based on FIA technique.
4.4.1 Tubular electrodes of crystalline membrane
Tubular electrodes of homogeneous crystalline membrane were
constructed as previously described (Ruzicka and Lamm, 1971; Barquero,
2001; Baeza, 2004). The membrane was shaped in tablets of 5 mm
diameter and 0.6 mm thickness. Tablets were obtained by agglutination of
precisely weighted powdered Ag2S (0.09 g) applying a constant pressure of
4 ton·cm-2 for 2 minutes. The manual tablet press machine was used by
courtesy of Adasa Sistemas S.A. Ag2S was prepared by precipitation of
AgNO3 (0.1 mol·L-1) (Panreac, Spain) with Na2S (0.1 mol·L-1) (Sigma
Aldrich, Germany) and further separation. The procedure for construction of
tubular electrodes of crystalline membrane is schematized in Figure 4.6.

8/17/2019 see page 29
http://slidepdf.com/reader/full/see-page-29 94/260
Aerobic biotrickling filtration for biogas desulfurization
64
Figure 4.6 Construction of tubular electrodes of crystalline membrane (Ag2S) for
S2- analysis (dimensions in millimeters)
Electrode body consisted in a cylindrical element of methacrylate of 7
mm width, 12 mm external diameter and 8 mm internal diameter, with an
orifice of 2 mm in which the electrical connector was inserted through. Once
positioned, the membrane tablet was securely fixed to the electrical
connector metallic extremity by welding with an electrically conductive
silver-epoxy resin (EPO-TEK® H20E-PFC – Epoxy Technology, Inc., USA).
Silver welding was carefully performed avoiding the paste to spread over
the membrane. Silver-epoxy resin was cured at 80 ºC during 3 h. After that,
both sides of the electrode body were replenished with an insulating non-
conductive solvent-free modified bisphenol-A epoxy resin (Araldite®
RenlamM/REN HY5162 – Huntsman Advanced Materials, Switzerland).
Epoxy resin was cured during 1 h at room temperature and afterwards
during 24 h at 40 ºC after each side application. Finally, electrodes were
perforated perpendicularly to the membrane, opening an orifice of 0.8 mm
diameter across the electrode body, which allows the contact of the analyte
with the sensing membrane when electrodes are installed in analytical
systems based on FIA technique. Pictures of constructed crystalline-
membrane tubular electrodes are shown in Figure 4.7.
Electrode body Crystalline membrane fixation
Epoxyresin
40 ºC 24 h
12
8
7 2
Welding(Ag)5 0.6
Insulating layerMechanical drilling
0.8
80 ºC
3 h
2 x
1 h room temperature+

8/17/2019 see page 29
http://slidepdf.com/reader/full/see-page-29 95/260
4. General materials and methods
65
Figure 4.7 Images of constructed tubular electrodes of crystalline membrane(Ag2S) for S2- analysis
Mechanical drilling was carefully done to completely positioning the
orifice over the membrane tablet, without reaching the silver epoxy resin
welding point. Perforation of electrodes was executed by courtesy of the
Institute of Textile Research and Industrial Cooperation of Terrassa, at the
Universitat Politècnica de Catalunya, UPC. After perforation, each electrode
was wet polished by inserting an ultra-fine abrasive paper inside the
membrane orifice, to clean out any trace of particles from the mechanical
drilling; then, the orifice surface was thoroughly smoothed with a wet
alumina-polishing strip. Before use, electrodes were conditioned during 12
hours in a S2- solution (0.001 M S2-), prepared according specified in
Section 5.3.1. For storage, electrodes were cleaned with distilled water and
kept dried, covered with an aluminum sheet, to protect them from the light.
4.4.2 Tubular electrodes of polymeric liquid membrane
Tubular electrodes of polymeric liquid membrane were constructed
according to previously described (Barquero, 2001), as schematized in
Figure 4.8. The liquid sensing cocktail (Section 6.3.2) is deposited bydropping it over an epoxy-graphite conducting composite surface.

8/17/2019 see page 29
http://slidepdf.com/reader/full/see-page-29 96/260
Aerobic biotrickling filtration for biogas desulfurization
66
Figure 4.8 Construction of tubular electrodes of polymeric liquid membrane for
SO42- analysis (dimensions in millimeters)
Similarly to crystalline membrane tubular electrodes, for polymeric liquid
membrane, electrode body also consisted in a cylindrical element of
methacrylate with 7 mm width, 12 mm external diameter and 8 mm internal
diameter with an orifice of 2 mm in which the electrical connector will be
inserted through. The electrode body was completely replenished with the
epoxy-graphite conducting composite freshly prepared. The epoxy-graphite
composite was prepared in a proportion of 1:1 epoxy:graphite while the
epoxy resin was prepared in a proportion of 1:0.4 Araldit® M/5490:HR
hardener resin (Huntsman Advanced Materials, Switzerland). This
composite paste was thoroughly mixed and air bubbles were eliminated.
Epoxy-graphite composite was cured at 40 ºC during 24 h. After that, an
insulating layer of a non-conductive epoxy resin was applied for both sides
of the electrode. Epoxy resin was prepared as described for tubular
electrodes of crystalline membrane. After each side application, the resin
was cured during 1 hour at room temperature and then during 24 h at
40 ºC. Excess of resin was cleaned off from the edges of the electrode
body. Pictures of constructed liquid-membrane tubular electrodes of
polymeric liquid membrane are shown in Figure 4.9.
Electrode body Electrical connector
Epoxyresin
12
7
8
2
Insulating layerMechanical drilling
40 ºC
24 h
2 x
Epoxy-graphite resin
40 ºC 24 h
1 h room temperature+
Liquidmembrane
application
0.8

8/17/2019 see page 29
http://slidepdf.com/reader/full/see-page-29 97/260
4. General materials and methods
67
Figure 4.9 Images of constructed tubular electrodes of polymeric liquid membranefor SO4
2- analysis
Finally, constructed electrodes were perforated, opening an orifice of 0.8
mm diameter across the electrode body in which the liquid sensing cocktail
was deposited. The internal orifice surface was wet polished by inserting an
ultra-fine abrasive paper inside the orifice. The membrane cocktail was
applied, in a gas fume hood, by gently depositing 1 drop of the freshly
prepared cocktail right inside the orifice of the electrode each 60 to 90
minutes, up to approximately 5 drops, allowing the membrane to dry. In this
type of electrodes, the internal solid reference is the potential generated
when epoxy-graphite is in contact with O2/H2O spread across the
membrane, due to the permeability of the PVC to O2 and water. Before use,
electrodes were dried at room temperature for 48 h and conditioned in
Na2SO4 solution (1.0×10⁻³ mol S-SO42-·L-1) (Panreac, Spain) during 15 h.
4.5 Construction of conventional electrodes
Conventional electrodes were constructed according to previously
described (Barquero, 2001), for batch measurement of SO42-, as presented
in Chapter 6. The procedure adopted for construction of conventionalelectrodes is schematized in Figure 4.10.

8/17/2019 see page 29
http://slidepdf.com/reader/full/see-page-29 98/260
Aerobic biotrickling filtration for biogas desulfurization
68
Figure 4.10 Construction of conventional electrodes of polymeric liquid membranefor batch measure of SO4
2- (dimensions in millimeters)
Firstly, a plastic-covered electrical wire was gently pilled off in one of its
extremities, leaving an exposed portion of the internal copper wire of
approximately 5 mm. Then, the electrical wire was welded to a circular
copper plate of 5 mm diameter and 1 mm thickness. The copper plate was
previously immersed in a 5% HNO3 (Panreac, Spain) solution for 2 min and
then rinsed with water, for oxide cleaning. Finished electrical connection
was then inserted inside a methacrylate cylindrical body of 8 mm internal
diameter, 12 mm external diameter and 120 mm length. Also, two PVC
rings were tightly fixed in the internal wall of the electrode body applying a
general purpose cyanoacrylate instant adhesive. One PVC ring was fixed at
approximately 5 mm from the top of the electrode body and served to
support the copper plate previously prepared. The other PVC ring was used
to secure the electrical wire at the end of the electrode body. Then, the
empty space between the upper PVC ring and the top of the electrode was
replenished with the epoxy-graphite conducting composite freshly prepared,
as described in Section 4.4.2. Pictures of constructed conventional
electrodes of liquid membrane are shown in Figure 4.11.
Copper plate weldingto electrical wire
Electrodebody
Hot-meltadhesive
sealing
Manualwet
polishing
Electrical wire insertion
Liquidmembrane
application
12
8
120
8
5
8
/ /
/ /
2 xPVC ring
/ /
/ /
/ /
/ / Epoxy-graphite
resin
40 ºC 24 h
/
/
/
/
/ /
/ /
/ / / /
5
1

8/17/2019 see page 29
http://slidepdf.com/reader/full/see-page-29 99/260
4. General materials and methods
69
Figure 4.11 Images of constructed conventional electrodes of polymeric liquidmembrane for SO4
2- batch measure
The epoxy-graphite composite was cured at 40 ºC during 24 h. Excess of
resin was immediately wiped of the electrode edges. The electrical wire was
securely fixed to the electrode body extremity using a holt-melt adhesive
based on ethylene vinyl acetate (3764Q-Clear – 3M, USA). Then, manual
wet polishing with fine sand paper was carried out until obtaining a
maximum cavity of 0.3 mm in the epoxy-graphite composite surface, where
the liquid sensing cocktail will be dropped in. After cleaning the polished
surface with neutral soap and water, polishing with a wet alumina-polishing
strip was done until obtaining a smoothed and regular surface. The liquid
membrane cocktail, freshly prepared as described in Section 6.3.2, was
applied over the epoxy-graphite polished surface by gently depositing 1drop each 30 – 45 minutes, up to 8 – 10 drops. The membrane application
was performed inside a gas fume hood. Subsequently, electrodes with fresh
applied membrane were completely dried at room temperature during 48 h.
Some electrodes were recycled when the liquid membrane was deteriorated
by eliminating liquid membrane residues and, after cleaning and polishing
procedures, applying new layers of a new freshly prepared membrane
cocktail. Pictures of the polymeric liquid membrane during and after
application on conventional electrodes are shown in Figure 4.12.
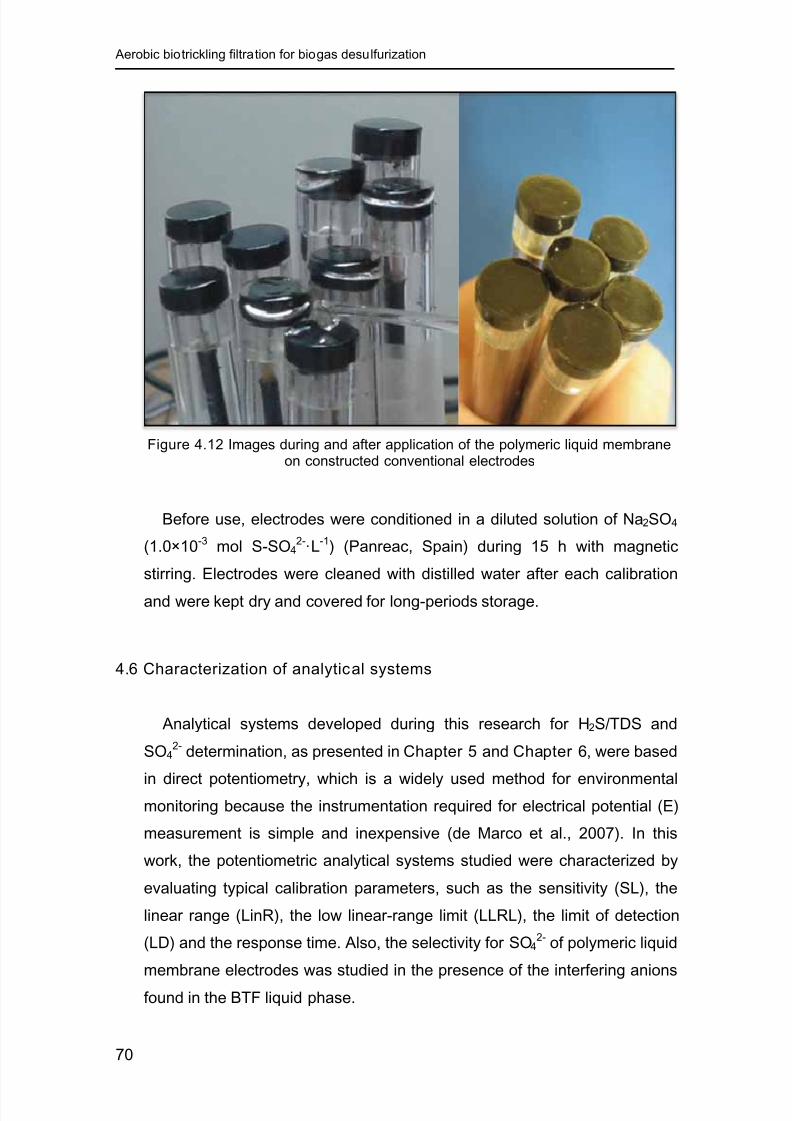
8/17/2019 see page 29
http://slidepdf.com/reader/full/see-page-29 100/260
Aerobic biotrickling filtration for biogas desulfurization
70
Figure 4.12 Images during and after application of the polymeric liquid membraneon constructed conventional electrodes
Before use, electrodes were conditioned in a diluted solution of Na2SO4
(1.0×10⁻³ mol S-SO42-·L-1) (Panreac, Spain) during 15 h with magnetic
stirring. Electrodes were cleaned with distilled water after each calibration
and were kept dry and covered for long-periods storage.
4.6 Characterization of analytical systems
Analytical systems developed during this research for H2S/TDS and
SO42-
determination, as presented in Chapter 5 and Chapter 6, were based
in direct potentiometry, which is a widely used method for environmentalmonitoring because the instrumentation required for electrical potential (E)
measurement is simple and inexpensive (de Marco et al., 2007). In this
work, the potentiometric analytical systems studied were characterized by
evaluating typical calibration parameters, such as the sensitivity (SL), the
linear range (LinR), the low linear-range limit (LLRL), the limit of detection
(LD) and the response time. Also, the selectivity for SO42- of polymeric liquid
membrane electrodes was studied in the presence of the interfering anions
found in the BTF liquid phase.
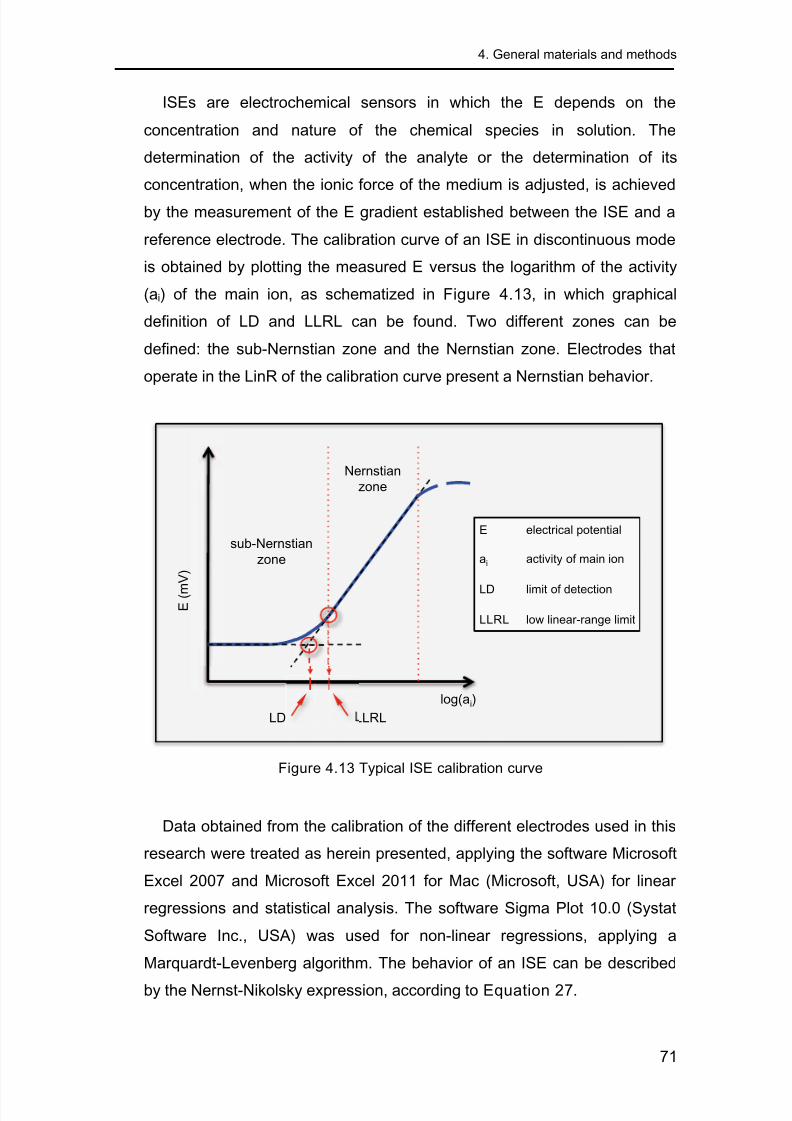
8/17/2019 see page 29
http://slidepdf.com/reader/full/see-page-29 101/260
4. General materials and methods
71
ISEs are electrochemical sensors in which the E depends on the
concentration and nature of the chemical species in solution. The
determination of the activity of the analyte or the determination of its
concentration, when the ionic force of the medium is adjusted, is achieved
by the measurement of the E gradient established between the ISE and a
reference electrode. The calibration curve of an ISE in discontinuous mode
is obtained by plotting the measured E versus the logarithm of the activity
(ai) of the main ion, as schematized in Figure 4.13, in which graphical
definition of LD and LLRL can be found. Two different zones can be
defined: the sub-Nernstian zone and the Nernstian zone. Electrodes that
operate in the LinR of the calibration curve present a Nernstian behavior.
Figure 4.13 Typical ISE calibration curve
Data obtained from the calibration of the different electrodes used in this
research were treated as herein presented, applying the software Microsoft
Excel 2007 and Microsoft Excel 2011 for Mac (Microsoft, USA) for linear
regressions and statistical analysis. The software Sigma Plot 10.0 (Systat
Software Inc., USA) was used for non-linear regressions, applying a
Marquardt-Levenberg algorithm. The behavior of an ISE can be described
by the Nernst-Nikolsky expression, according to Equation 27.
log(ai)
E ( m
V )
Nernstian
zone
sub-Nernstian
zone
LLRLLD
E electrical potential
ai activity of main ion
LD limit of detection
LLRL low linear-range limit

8/17/2019 see page 29
http://slidepdf.com/reader/full/see-page-29 102/260
Aerobic biotrickling filtration for biogas desulfurization
72
E = K + [SL1 log(ai)] [27]
Where:
E = Electrical potential (mV)
K = Electrode calibration constant (mV)
SL1 = Sensitivity in the Nernstian zone (mV·dec-1)
ai = Activity of the main ion
The coefficients of the Nernst-Nikolsky equation are obtained by linear
regression fitting. The slope (SL1) of the linear regression is positive when
the electrode is sensible to a cation and negative when it is sensible to an
anion. Also, non-linear regressions were applied to characterize the
response of the electrodes in the complete calibration curve range,
including linear and non-linear zones. Non-linear regression calculations
were performed based on the Nikolsky-Eisenman expression, an extension
to the Nernst equation, according to Equation 28 and Equation 29.
E = K + [SL2 log(ai + ((Kpot i,j aj zi/zj) + LDap)] [28]
E = K + [SL2 log(ai + C)] [29]
Where:
E = Electrical potential (mV)
K = Electrode calibration constant (mV)
SL2 = Sensitivity in the entire calibration range (mV·dec-1)
ai = Activity of the main ion
zi = Ionic charge of the main ion (z = 2 for S2- and SO42-)
Kpot i,j = Potentiometric selectivity coefficient of the main ion (i) in the
presence of the interfering ion (j)
LDap = Apparent limit of detection (mol·L-1)
a j = Activity of the interfering ion
z j = Ionic charge of the interfering ion
The term “C” in the Equation 29 is defined as the sum of an apparent
limit of detection (LDap) and the Kpot. LDap is an empirical constant obtained

8/17/2019 see page 29
http://slidepdf.com/reader/full/see-page-29 103/260
4. General materials and methods
73
during the regression fittings. In the presence of an ionic background, the
value of the Kpot is considered to be sufficiently higher than the value of the
LDap, so the LDap was not consider in the calculation expressed by the
Equation 28, applied when interfering ions are present in the solution.
The characterization of tubular electrodes integrated to flow-based
analytical systems was done, similarly to the case of conventional
electrodes in batch systems, by performing serial calibrations with
standards of exact known concentration. Standards were injected into the
flow system in ascending concentration order, avoiding the saturation of the
sensing membranes. The typical analytical response of an ISE in a
potentiometric FIA system is a transitory signal like a peak, obtained by the
difference between the electrode response signal and the base line. The
base line is the electrode response in the presence of a low concentration
of the analyte, normally lower than the LD (S2- or SO42- background).
The calibration curve of flow-based systems was obtained by plotting the
peak height (H) versus the log(ai), where ai= γ ci, analogously to the
calculation described by the Equation 27. However, a high-ionic strength
solution is used in flow systems, allowing considering that activity coefficient
(γ) is constant. Then, consistently log(γ) is also constant and can be
comprised by the calibration curve constant (K’). This assumption lead to a
modification of the Nernst-Nikolsky expression, according to Equation 30,
where the potentiometric response variation depends on the logarithm of
the concentration of the main ion (ci). Calibration curves resulted thus in the
representation of the H versus the log(ci).
H = K’ + [SL1 log(c i)] [30]
Where:
H = Peak height (mV)
K’ = Electrode calibration constant, including the activity coefficient (mV)
SL1 = Sensitivity in the Nernstian zone (mV·
dec
-1
)ci = Concentration of the main ion (mol·L-1)
8/17/2019 see page 29
http://slidepdf.com/reader/full/see-page-29 104/260
Aerobic biotrickling filtration for biogas desulfurization
74
Finally, when the response of the electrodes was investigated in the non-
linear zone of the calibration curve. Calculations were performed according
to Equation 31.
H = K’ + [SL2 log(c i + C)] [31]
Where:
H = Peak height (mV)
K’ = Electrode calibration constant, including the activity coefficient (mV)
SL2 = Sensitivity in the non-linear zone (mV·dec-1)
ci = Concentration of the main ion (mol·L-1)
C = Term related to the LDap (mol·L
-1
)
4.6.1 Defin ition of performance parameters of ISEs
The performance of the electrodes constructed during this research was
evaluated by the calculation and analysis of the SL, the LLRL and the LD
for TDS and SO42- electrodes (Chapter 5 and Chapter 6). The
characterization of the constructed ISEs for SO42- determination also
comprised the study of the lifetime and the response time of the electrodes.
Furthermore, the selectivity to SO42- of the constructed electrodes was
studied for the anions commonly present in the liquid phase of the BTF,
applying the matched potential method (MPM), a widely used method for
the calculation of interferences for ISEs (Umezawa et al., 1995).
The FIA/GD-CFA system developed for TDS/H2S analysis (Chapter 5)
has been already characterized (Redondo et al., 2008) and no further
studies in this sense were performed during this research. Nevertheless,
the system previously developed for on-line biogas analysis and non-
continuous S2-
analysis was modified and optimized in order to perform the
on-line monitoring of TDS at the BTF liquid phase. Other than that, it was
not necessary to study the effect of interferences for TDS determination due
to the lack of interfering ions in the solution. However, the lifetime of theconstructed ISEs for TDS was assessed during this work.

8/17/2019 see page 29
http://slidepdf.com/reader/full/see-page-29 105/260
4. General materials and methods
75
Sensitivity
The sensitivity (SL) of an ISE is a parameter commonly applied to easily
compare the behavior of different electrodes and it gives an indication of the
performance of the electrode. The IUPAC defines the SL of an ISE as the
slope of the calibration curve. The SL of an electrode is an important
parameter and its study allows assessing the lifetime of the sensor,
applying a discriminatory criterion based on the SL.
The theoretical or ideal value of SL for monovalent ions in the linear zone
of the calibration curve is 59.16 mV·dec-1 for cations and -59.16 mV·dec-1
for anions. For divalent ions, the ideal value of SL in the linear zone is 29.58
mV·dec-1 for cations and -29.58 mV·dec-1 for anions, as is the case of S2-
and SO42-. When the slope of the linear regression fitting resulted in a value
lower than -29.58 mV·dec-1, the SL of the electrodes was considered to
exhibit a sub-Nernstian response. Analogously, when the linear slope
resulted in a value higher than -29.58 mV·dec-1, it was considered that the
electrodes presented a super-Nernstian response.
Low linear-range limit
The low linear-range limit (LLRL) is defined as the minimum value of the
activity of the main ion, from which the electrode presents a Nernstian
behavior. This parameter was calculated as previously described (Hara et
al., 1994), applying a statistical procedure based on the determination of the
Pearson’s correlation coefficient.
The calculation of the LLRL for calibrations performed on analytical flow
systems consisted on a least-squares fitting approach, using the complete
data set of the linear regression results, until obtaining a regression
coefficient as close to 1 as possible (> 0.99). The LLRL is widely applied for
comparing electrodes performance and, jointly with the LinR, defines the
applicability of the electrodes in terms of a reliable response interval.

8/17/2019 see page 29
http://slidepdf.com/reader/full/see-page-29 106/260
Aerobic biotrickling filtration for biogas desulfurization
76
Limit of detection
A wide variety of criteria can be adopted to define the limit of detection
(LD) in potentiometric analyses. By analogy to other fields, the LD can be
defined as the concentration of the analyte from which the E suffers a
deviation of an arbitrary multiple from the standard error of the average E
that corresponds to the operational region of low concentrations (sub-
Nernstian zone). The IUPAC defines the LD for potentiometric
determinations as the activity (or the concentration) of the main ion
corresponding to the intersection point between the extrapolation of the line
with Nernstian behavior and the initial segment of low concentrations,
usually horizontal, as showed in Figure 4.13. In this work, another accepted
definition of the LD was considered, which is derived from the application of
non-linear fitting methods to the complete experimental data set, including
those values below the LLRL. Calculations were performed according to
Equation 29, in which the term “C” comprises two factors, the LDap and the
effect of interfering ions, as described by Equation 32, in the case of SO42-
as the main ion (Chapter 6).
C = LDap + (Kpot SO42-
,j aj 2/zj) [32]
Where:
C = Term related to the LD (mV)
LDap = Apparent LD (mol·L-1)
Kpot SO42-
, j = Kpot of SO42- in the presence of the interfering ion (j)
a j = Activity of the interfering ionz j = Ionic charge of the interfering ion
In the case of TDS determination (Chapter 5), the calculation of the LD
corresponded directly to the value of the term “C” (LDap = C), since the
system operated in absence of interferences (Martinez-Barrachina et al.,
1999). This definition was assumed because the only interfering ion for a
homogeneous crystalline membrane electrode of Ag2S is Hg2+ (Olenic et
al., 1997), which was not present in the BTF liquid phase.
8/17/2019 see page 29
http://slidepdf.com/reader/full/see-page-29 107/260
4. General materials and methods
77
Potentiometric selectivity coefficient (Kpot)
ISEs are selective but not specific to the analyte. In this sense, the E
response depends not only on the main ion activity, but also on the Kpot of
all the interfering ions present in the solution, according to the Nikolsky-
Eisenman expression (Equation 28). Selectivity is one of the most
important characteristics of an ISE. The applicability of an electrode in any
analytical system depends in a great extend on the selectivity of its sensing
element. The Kpot is defined as the capacity of an ISE of distinguishing an
ionic species from others present in the solution (Umezawa et al., 2000).
The lower the value of Kpot, the higher the preference of the ISE for the
main ion. The determination of the Kpot for SO42- was performed in both
FIA and batch modes, as specified in Section 6.3.3. The method applied
was the MPM (Alegret et al., 1985), which presents the advantage of being
applicable for ions of different ionic charge, because it is independent of the
Nernst equation (Gadzekpo and Christian, 1984). This methodology
consisted in the measurement of the E variation between the ISE and the
reference electrode produced by the progressive addition of increasing
concentration of SO42- while the concentration of the interfering ion was
kept constant at a known value. Since interference studies considered the
presence of a single interfering ion, for overcoming crossed effects, the
calculation of the Kpot was performed according to the Equation 33,
derived from the Nikolsky-Eisenman expression, taking into account that the
value of the LDap is sufficiently lower than the Kpot in the presence of
interferences. Normally, resulting LDap in the presence of the interfering ion
is higher than when no interfering ions are present in the sample.
Kpot SO42-
, j = C / cj 2/zj [33]
Where:
Kpot SO42-
, j = Kpot of SO42- in the presence of the interfering ion (j)
C = LD (mV)
c j = Concentration of the interfering ion (mol·L-1)
zi = Ionic charge of the interfering ion

8/17/2019 see page 29
http://slidepdf.com/reader/full/see-page-29 108/260
Aerobic biotrickling filtration for biogas desulfurization
78
Lifetime and response time
The lifetime of the constructed ISEs was evaluated by performing
successive calibrations over the time, covering the LinR of the electrode.
The slope and the parameters of the linear regression fitting were
calculated and the stability of the obtained E of each ISE was assessed.
Lifetime of ISEs is lower for polymeric liquid membrane than for crystalline
membrane electrodes, because of the potential lost of active ionophore
from the polymeric matrix, beside other related factors, such as ionophore
leaching (Buhlmann and Umezawa, 2000) or the irreversibility of the
interaction between the ionophore and the analyte. Electrodes were
considered non-operative when the obtained response was irreversibly
affected, even after recovering procedures, which was verified by either the
lost of SL (> -29.58 mV·dec-1) or the increment of the LLRL. Also, the
stability of the obtained E acted as an indication of the proper operation of
the electrodes; the response was classified as unstable when the E
variation was above 2 mV. When the first signs of performance impairment
were noticed, the electrodes were subjected to a recovering procedure in
order to improve their response and to extending their lifetime. Electrodes of
crystalline membrane were recovered by polishing and cleaning their
membrane orifice. In the case of ISEs of polymeric liquid membrane,
electrodes recovering consisted in a recycling procedure including first the
removal of the deteriorated membrane and then, after fine wet polishing and
cleaning, in the application of a new sensing cocktail.
The response time of an ISE is as a critical factor for the application of
the electrode, in both FIA and batch mode analytical systems. It was
investigated by measuring the speed of the response obtained at the
detection system after producing a variation in the activity of the main ion.
The response time (t95) was considered as the time required by the system
to reach 95% of the total variation of the signal after the injection of a
standard. The response time of the ISEs characterized during this research
was evaluated considering both low and high concentrations of the mainion, covering the complete LinR of the electrode.
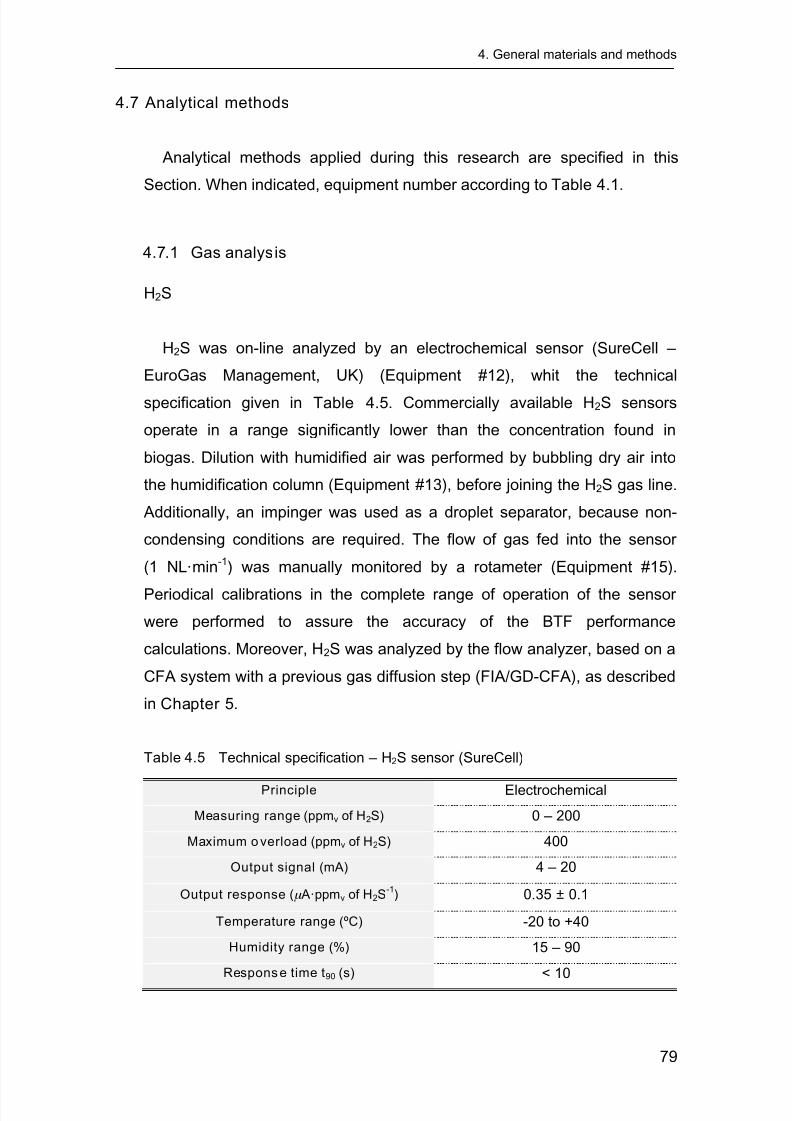
8/17/2019 see page 29
http://slidepdf.com/reader/full/see-page-29 109/260
4. General materials and methods
79
4.7 Analytical methods
Analytical methods applied during this research are specified in this
Section. When indicated, equipment number according to Table 4.1.
4.7.1 Gas analysis
H2S
H2S was on-line analyzed by an electrochemical sensor (SureCell –
EuroGas Management, UK) (Equipment #12), whit the technical
specification given in Table 4.5. Commercially available H2S sensors
operate in a range significantly lower than the concentration found in
biogas. Dilution with humidified air was performed by bubbling dry air into
the humidification column (Equipment #13), before joining the H2S gas line.
Additionally, an impinger was used as a droplet separator, because non-
condensing conditions are required. The flow of gas fed into the sensor
(1 NL·min-1) was manually monitored by a rotameter (Equipment #15).
Periodical calibrations in the complete range of operation of the sensor
were performed to assure the accuracy of the BTF performance
calculations. Moreover, H2S was analyzed by the flow analyzer, based on a
CFA system with a previous gas diffusion step (FIA/GD-CFA), as described
in Chapter 5.
Table 4.5 Technical specification – H2S sensor (SureCell)
Principle Electrochemical
Measuring range (ppmv of H2S) 0 – 200
Maximum o verload (ppmv of H2S) 400
Output signal (mA) 4 – 20
Output response (μ A·ppmv of H2S-1
) 0.35 0.1
Temperature range (ºC) -20 to +40
Humidity range (%) 15 – 90
Response time t90 (s) < 10

8/17/2019 see page 29
http://slidepdf.com/reader/full/see-page-29 110/260
Aerobic biotrickling filtration for biogas desulfurization
80
CH3SH
CH3SH was off-line analyzed using a gas chromatograph (6890N –
Hewlett Packard, USA), equipped with a fused silica capillary column
(Supel-Q PLOT – Supelco, USA) of 30 m length, 0.53 mm inner diameter
and 40 μm film thickness. GC is a separation technique in which the
analytes contained in a mobile gas phase are dispersed and separated
through a stationary phase and then directed to a detector by a carrier gas,
where an electrical signal is generated proportionally to the quantity of each
analyte eluted. The chromatogram is the graphical record of the obtained
signal versus the time; each separated compound appears as a separated
peak. Areas under the peaks are proportional to the concentration of the
analyte, allowing its quantification. The chromatograph was equipped with a
flame ionization detector (FID). Main chromatographic conditions adopted
for CH3SH analysis are summarized in Table 4.6.
Table 4.6 Chromatographic conditions for CH3SH analysis
Mode Constant flow
Carrier gas fl ow (mL·min-1
) 3 (He)
Make-up gas flow (mL·min-1
) 25 (N2)
Injector temperature (ºC) 230
Oven temperature (ºC) 80 (isotermic)
Detector temperature (ºC) 260
Split ratio 1:2
Run time (min) 15
Retention time (min)
8.1
Standards and samples were manually injected (1 mL) using a glass
precision-syringe (Hamilton, USA). Standards were prepared by a DMFC
dedicated to CH3SH (Equipment #10) and covered the concentration range
studied in Chapter 8. Calibrations with 6 points were daily performed,
assuring the reliability of the obtained results. Samples taken during
experiments were analyzed within 12 h after collection, which warranted theintegrity of the sample, as verified during analytical method adjustment.

8/17/2019 see page 29
http://slidepdf.com/reader/full/see-page-29 111/260
4. General materials and methods
81
4.7.2 Liqu id analysis
pH
On-line pH measurement at the recirculation line of the BTF was
performed using a sensitive glass-membrane combined electrode with
temperature sensor and electrolyte gel (5334 – Crison Instruments, Spain)
(Equipment #18). Technical specification of this sensor is presented in
Table 4.7. Periodical calibrations were performed with pH buffers of 4.01
and 7.00 pH units (Crison Instruments, Spain), assuring the proper
operation of the probe. This sensor was connected to a pH controller (PH28
– Crison Instruments, Spain), allowing the actuation on the NaOH pump
(Equipment #5) or the HCl pump (Equipment #6), depending on the
operational pH setpoint. The electrode was installed into a PVC insertion
housing (Crison Instruments, Spain), connected to the recirculation pipe
through fast-type connections, which easily allowed executing cleaning and
calibration procedures.
Table 4.7 Technical specification – pH sensor (5334)
Measuring range (pH) 0 – 14
Temperature range (ºC) 0 – 100
Maximum pressure (bar) 5
Reference element Sleeved Ag wire coated with AgCl
Diaphragm Ring of porous PTFE
Temperature sensorPt 1000, with automatic
temperature compensation (ATC)
Response time (pH 4 – 7) (s) < 20
Moreover, the measurement of pH during the SO42-
determination studies
(Chapter 6) was performed using a pH bench meter (EL20 – Mettler
Toledo, Switzerland) equipped with an electrode arm and a pH glass-
membrane combined electrode (U405 – Mettler Toledo, Switzerland),
according to the technical specification presented in Table 4.8.

8/17/2019 see page 29
http://slidepdf.com/reader/full/see-page-29 112/260
Aerobic biotrickling filtration for biogas desulfurization
82
Table 4.8 Technical specification – pH sensor (U405)
Measuring range (pH) 0 – 12
Temperature range (ºC) 0 – 100
Reference system
ARGENTHAL™ (AgCl granulate-
filled cartridge with Ag+ trap)
Diaphragm Triple ceramic
Reference electrolyte FRISCOLYT-B® (glycerol / KCl)
Temperature comp ensation ATC
Potential measurement and control of FIA/GD-CFA system
The measurement of the E in the flow system described in Chapter 5 for
the on-line monitoring of H2S and TDS was performed with a potentiometer-
voltmeter specially designed for this application (UAB-IQ-11003 – TMI S.L.,
Spain). This instrument presented 2 potentiometric sensor inputs with their
respective references and proportional E signal output (0 – 10 V).
Measuring range was -1,999 to +1,999 mV, with a resolution of 0.5 mV.
Additionally, this instrument controlled the 6-way injection valve
(EASI1215/342 – Easi Technologies, Spain) installed in the flow system. E
measurement executed during the determination of SO42-, as described in
Chapter 6, was performed with a potentiometer (micropH2002 – Crison
Instruments, Spain) connected to a digital commutator (TMI-6017CONM16
– TMI S.L., Spain), which allowed the measurement of E for 16 electrodes
simultaneously. For practical reason, calibrations were performed for a
maximum of 6 simultaneous electrodes. This instrument is a pHmeter
controller operated in E continuous mode. Measuring range was -1,999 to
+1,999 mV, with a resolution of 1 mV. Both potentiometric analytical
systems operated with a double-junction reference electrode (ORION
900200 – Thermo Fisher Scientific, USA), a sleeve-type refillable Ag/AgCl
electrode. A solution of KNO3 saturated in AgCl, provided by the same
manufacturer, was used as internal reference electrolyte. External reference
electrolyte consisted in a solution of KNO3 (10%) (Panreac, Spain).
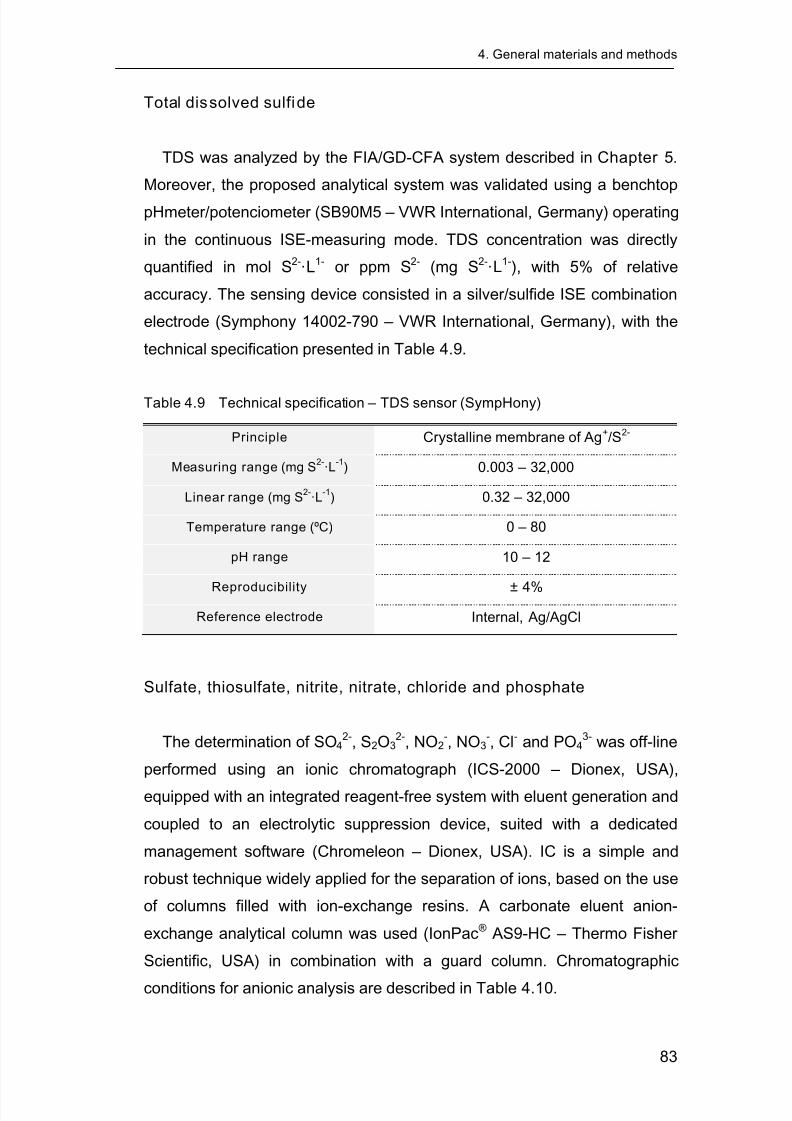
8/17/2019 see page 29
http://slidepdf.com/reader/full/see-page-29 113/260
4. General materials and methods
83
Total dissolved sulfide
TDS was analyzed by the FIA/GD-CFA system described in Chapter 5.
Moreover, the proposed analytical system was validated using a benchtop
pHmeter/potenciometer (SB90M5 – VWR International, Germany) operating
in the continuous ISE-measuring mode. TDS concentration was directly
quantified in mol S2-·L1- or ppm S2- (mg S2-
·L1-), with 5% of relative
accuracy. The sensing device consisted in a silver/sulfide ISE combination
electrode (Symphony 14002-790 – VWR International, Germany), with the
technical specification presented in Table 4.9.
Table 4.9 Technical specification – TDS sensor (SympHony)
Principle Crystalline membrane of Ag+/S2-
Measuring range (mg S2-·L
-1) 0.003 – 32,000
Linear range (mg S2-·L
-1) 0.32 – 32,000
Temperature range (ºC) 0 – 80
pH range 10 – 12
Reproducibility 4%
Reference electrode Internal, Ag/AgCl
Sulfate, thiosulfate, nitrite, nitrate, chloride and phosphate
The determination of SO42-, S2O3
2-, NO2-, NO3
-, Cl- and PO43- was off-line
performed using an ionic chromatograph (ICS-2000 – Dionex, USA),
equipped with an integrated reagent-free system with eluent generation and
coupled to an electrolytic suppression device, suited with a dedicated
management software (Chromeleon – Dionex, USA). IC is a simple and
robust technique widely applied for the separation of ions, based on the use
of columns filled with ion-exchange resins. A carbonate eluent anion-
exchange analytical column was used (IonPac® AS9-HC – Thermo Fisher
Scientific, USA) in combination with a guard column. Chromatographic
conditions for anionic analysis are described in Table 4.10.

8/17/2019 see page 29
http://slidepdf.com/reader/full/see-page-29 114/260
Aerobic biotrickling filtration for biogas desulfurization
84
Table 4.10 Chromatographic conditions for anionic analysis
Column IonPac® AS9-HC (analytical + guard)
Column length (mm) Analytical: maximum 250
Guard: maximum 50
Column temperature (ºC) 30
Eluent KOH
Eluent gradient18 – 50 mM KOH from 0 – 10 min
50 – 18 mM KOH from 10 – 15 min
Eluent flow rate (mL·min-1) 1.6
Au to -samp ler AS40
Injection volume (μ L) 25.00
Suppressor Self-regenerating SRS®
300 (H2CO3)
Periodical calibrations, according to the manufacturer recommendation,
were performed by the preparation of 5 standards by serial dilution from
standard stock solutions of each compound (Merck, Germany).
Total inorganic carbon
TIC was off-line analyzed using an automated system for carbon analysis
(TOC 1020A – OI Analytical, USA). The detector consisted in a
nondispersive infrared (NDIR) cell, which allows the efficient selective
detection of carbon in a wide range of matrices. When carbon compounds
are combusted in an O2-rich environment, the complete conversion of
carbon to CO2 is obtained. TIC is determined by measuring the CO2
released following sample acidification.
Samples of 25 mL were automatically injected by duplicate by a vial
auto-sampler of 53 positions for 40-mL vials. The high-efficiency
combustion of the injected samples was made with Pt-catalyst at 680 ºC,
with an O2 flow rate of 550 mL·min-1. Also N2 was consumed at a flow rate
of 70 mL·min-1. The measuring range for TIC was 5 – 1,000 mg C·L-1, with
a precision of 2%. The instrument was suited with a dedicated managementsoftware (WinTOC™, OI Analytical, USA).

8/17/2019 see page 29
http://slidepdf.com/reader/full/see-page-29 115/260
4. General materials and methods
85
4.7.3 Solid analysis
Total suspended solids and volatile suspended solids
TSS and VSS analysis were performed according to the Standard
Methods (APHA, 2006b). TSS calculation allowed the quantification of the
amount of organic and inorganic matter in suspension in the sample.
Basically, for the determination of TSS, a homogeneous sample was filtered
through a weighed standard glass microfiber filter of 0.7 μm (GF/F grade –
Whatman, USA). The residue left on the filter after filtration was dried to a
constant weight at a temperature between 103 – 105 ºC. The increase in
weight of the filter represents the TSS of the sample. VSS calculation
allowed the quantification of the amount of volatile matter in the sample,
which can be related to the quantity of biomass. Basically, the filter used for
TSS analysis was ignited at 550 50 ºC for 30 minutes. The weight lost on
ignition of the solids represents the VSS of the sample. Both TSS and VSS
analysis were performed by triplicate.
Cellular nitrogen
Ncell analysis was performed using commercial kits for total nitrogen
(LCK238 – Hach Lange, UK), based on a colorimetric detection on a
portable split beam spectrophotometer (DR2800 – Hach Lange, UK), after
the digestion of the sample. Inorganically and organically bonded nitrogen
is oxidized to NO3
-
by digestion with peroxodisulfate. NO3
-
ions react with2,6-dimethylphenol in a solution of H2SO4 and H3PO4 to form nitrophenol.
The measurement range was 5 – 40 mg N·L-1
. Kits are commercialized with
all necessary reagents. The spectrophotometer was suited with a tungsten
lamp and operated within a wavelength range of 340 to 900 nm. Kits were
measured at 345 nm, after aeration. The photometric measuring range was
3 of Abs and the photometric accuracy was 5.5×10⁻³
of Abs. Operational
temperature range of the spectrophotometer was 10 – 40 ºC.

8/17/2019 see page 29
http://slidepdf.com/reader/full/see-page-29 116/260
Aerobic biotrickling filtration for biogas desulfurization
86
Elemental analysis (C, N, H, P and S)
Elemental analysis was performed by combustion at 1,000 °C under pure
O2 atmosphere in a bomb calorimeter (CPH330 – IKA, Germany) with an
aliquot of 20 mg of dry solid sample and subsequent IC analysis (Alliance
HPLC – Waters, USA). The calorimeter maximum measurement range was
40,000 J with a measuring time of approximately 8 minutes. The
reproducibility was 0.1% and the temperature measurement resolution was
1.0×10⁻⁵ K. The decomposition vessel of the calorimeter was filled with a
weighed sample and with pure O2 at an operating pressure of 30 bar, to
optimize the combustion process. The cooling medium used was tap water.
Metal trace analysis
Metal trace analysis (Fe, Zn, Cu, Cr, Ni, Pb, Mo, Na and K) was
performed by ICP-OES (Optima8000, Perkin Elmer, USA). Dry
homogenous powdered sample, prepared as shown in Figure 4.5 (Dry-
FSS), was first microwave digested (StartD – Milestone, USA). Microwavedigestion is used to mineralize solid samples, so they became into liquid
ones. The sample containing biomass and solids (0.500 g) was heated
inside the microwave vessels with a mixture of HCl:HNO3 9:3 (v·v-1) at a
working temperature of 180 – 220 ºC. At this temperature, degradation of
the sample is produced. After digestion, an acid solution was obtained,
which was analyzed by ICP-OES, with a flat plate system. The spectral
range was 165 – 900 nm, with a resolution < 9.0×10⁻³
nm. Sample was
sprayed into flowing Ar (20 L·min-1) and passed into a torch, which was
inductively heated to 10,000 ºC. At this temperature, gas is atomized and
ionized, forming a plasma. Detection of almost the entire periodic table with
LD < 0.1 mg·L-1
can be obtained by the identification of the mass spectrum
of the plasma.

8/17/2019 see page 29
http://slidepdf.com/reader/full/see-page-29 117/260
5on-line monitoring of H2S
and sulf ide by a flow analyzer

8/17/2019 see page 29
http://slidepdf.com/reader/full/see-page-29 118/260
Aerobic biotrickling filtration for biogas desulfurization
88
A writer should have the precision of a poet
and t he imagin at i on of a sci ent i st .
V l a d i m i r V N a bok ov
Saint Petersburg, 1899 M ont r eux, 1977
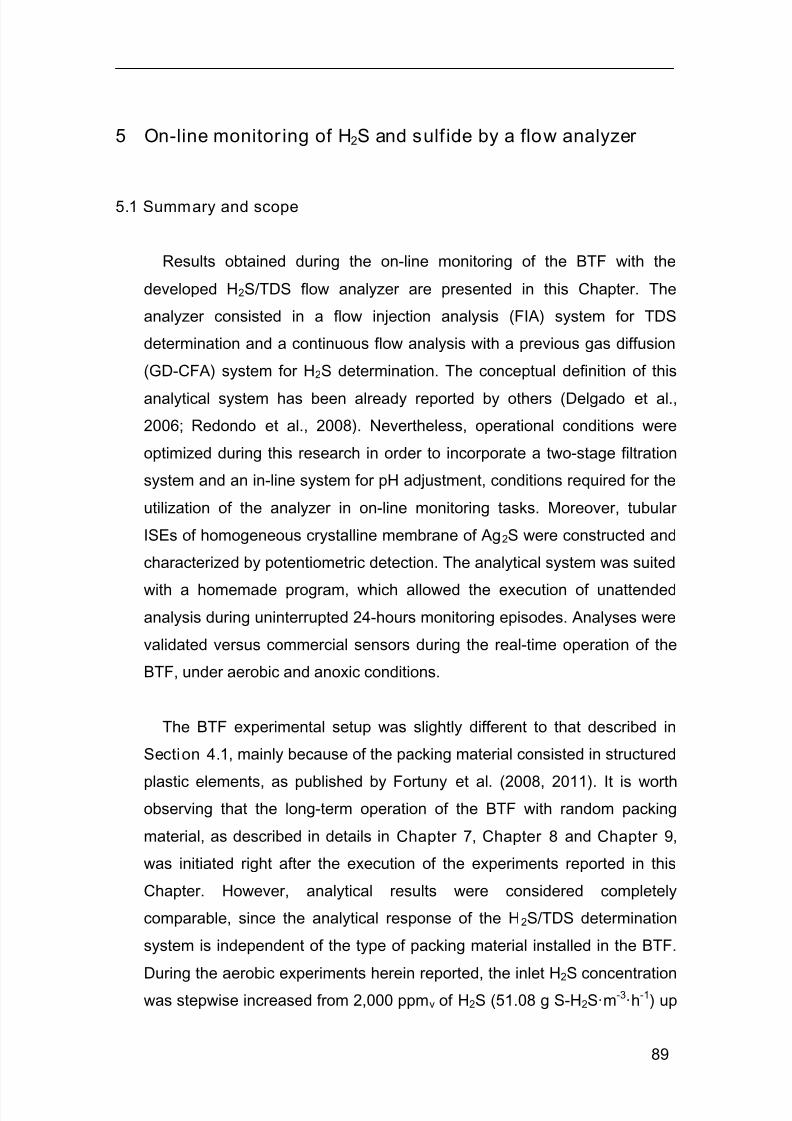
8/17/2019 see page 29
http://slidepdf.com/reader/full/see-page-29 119/260
89
5 On-line monitor ing of H2S and sulf ide by a flow analyzer
5.1 Summary and scope
Results obtained during the on-line monitoring of the BTF with the
developed H2S/TDS flow analyzer are presented in this Chapter. The
analyzer consisted in a flow injection analysis (FIA) system for TDS
determination and a continuous flow analysis with a previous gas diffusion
(GD-CFA) system for H2S determination. The conceptual definition of this
analytical system has been already reported by others (Delgado et al.,
2006; Redondo et al., 2008). Nevertheless, operational conditions were
optimized during this research in order to incorporate a two-stage filtration
system and an in-line system for pH adjustment, conditions required for the
utilization of the analyzer in on-line monitoring tasks. Moreover, tubular
ISEs of homogeneous crystalline membrane of Ag2S were constructed and
characterized by potentiometric detection. The analytical system was suited
with a homemade program, which allowed the execution of unattended
analysis during uninterrupted 24-hours monitoring episodes. Analyses were
validated versus commercial sensors during the real-time operation of the
BTF, under aerobic and anoxic conditions.
The BTF experimental setup was slightly different to that described in
Section 4.1, mainly because of the packing material consisted in structured
plastic elements, as published by Fortuny et al. (2008, 2011). It is worthobserving that the long-term operation of the BTF with random packing
material, as described in details in Chapter 7, Chapter 8 and Chapter 9,
was initiated right after the execution of the experiments reported in this
Chapter. However, analytical results were considered completely
comparable, since the analytical response of the H2S/TDS determination
system is independent of the type of packing material installed in the BTF.
During the aerobic experiments herein reported, the inlet H2S concentration
was stepwise increased from 2,000 ppmv of H2S (51.08 g S-H2S·m-3·h-1) up

8/17/2019 see page 29
http://slidepdf.com/reader/full/see-page-29 120/260
Aerobic biotrickling filtration for biogas desulfurization
90
to 8,000 ppmv of H2S (215.30 g S-H2S·m-3·h-1). Sulfur mass balance results
indicated that S0 production proportionally increased with the O2/H2S
volumetric ratio decrease, as expected from the stoichiometric ratio.
Maximum TDS detected in the liquid phase was 3.08 mg S-S2-·L-1 while the
ECmax was 201 g S-H2S·m-3·h-1. Furthermore, the proposed analyzer was
consistently applied during experiments reported in Chapter 7, Chapter 8
and Chapter 9, allowing the investigation of the analytical stability of the
system under different operational conditions over the time. Moreover,
different samples from other experimental desulfurizing BTF setup
(Hernandez, 2012) were analyzed as well with the presented analytical
system, for TDS quantification.
The objectives of the work presented in this Chapter were to integrate
the FIA/GD-CFA system to the BTF for on-line monitoring of TDS and H2S
and to validate the equipment under continuous operation, as a tool for
describing the BTF performance. To this aim, tubular electrodes of
crystalline membrane of Ag2S were constructed and characterized. Then,
controlled experiments were performed in the BTF by increasing the inlet
H2S concentration, in order to force TDS accumulation in the liquid phase.
On-line values obtained by the FIA/GD-CFA analyzer were validated with
conventional commercial sensors in both liquid (S2- analysis) and gas (H2S
analysis) phases. Overall results demonstrated that the proposed analytical
system is reliable for on-line monitoring applications and can serve as a
valuable tool to understand the complex mechanism of biological
desulfurization in BTFs.
A slightly modified version of this chapter has been published as:
Montebello AM, Baeza M, Lafuente J, Gabriel D (2010) Monitoring and
performance of a desulfurizing biotrickling filter with an integrated continuousgas/liquid flow analyzer. Chemical Engineering Journal, 165, 500-507.

8/17/2019 see page 29
http://slidepdf.com/reader/full/see-page-29 121/260
5. On-line monitoring of H2S and sulfide by a flow analyzer
91
5.2 Introduct ion
Flow injection systems are based in the automation of standard,
conventional analytical process. Advantages of automated flow injection
systems with respect to off-line processes are the speed, robustness and
versatility, in addition to the low samples and reagents consumption and the
low cost per analysis (Ferrer et al., 2007). Flow injection systems are widely
used for on-line process monitoring in water and waste water treatment, as
well as in fermentation process, pharmaceutical, food industry and clinical
analysis, among other applications (Gabriel et al., 1998; Yuan and
Kuriyama, 2000; Baeza, 2004; Santos and Korn, 2006; Zayed and Issa,2010; Piano et al., 2010). In general, the outstanding improvement of the
LD and the selectivity enhancement of ISEs analytical systems have
promoted a huge increment on potentiometric analysis investigation in
different application fields. Over the last decade, a spectacular improvement
on the overall ISEs capabilities has been reported, with an improvement
factor of up to 1 million for LD determination of a wide variety of analytes
and up to 1 billion for interferences coefficient discrimination (Egorovet al
.,2004; Pretsch, 2007; Zuliani and Diamond, 2012), resulting in more
selective electrodes with lower detection limits.
The determination of sulfur species by FIA systems have been
intensively used, resulting in the development of reliable systems for the
direct determination of SO42-, SO3
2- and S2- (Miro et al., 2004; Santos and
Korn, 2006). However, water containing dissolved sulfides readily loses
H2S, especially at acidic pH, as assumed from the value of the second
dissociation constant of H2S, as presented in Table 2.2. Consequently, the
on-line determination of S2- in real monitoring tasks requires the pH
adjustment of the sample to values higher than pH = 12 before entering the
analytical system, which allows the representative quantification of the TDS
content of the studied sample.

8/17/2019 see page 29
http://slidepdf.com/reader/full/see-page-29 122/260
Aerobic biotrickling filtration for biogas desulfurization
92
Moreover, particularly for the application studied in this research, a
complementary on-line filtration of the sample was required to ensure the
proper analytical system response under continuous operation with real
samples, avoiding the contamination of the analytical system internals by
biomass colonization.
The utilization of gas diffusion cells in continuous flow analyzers is done
for the separation of volatile compounds from the sample solution, or donor
stream, through a gas-permeable microporous membrane into a receiver
liquid solution, or acceptor stream (Miro and Frenzel, 2004). A typical gas
diffusion cell in counter-current flow configuration is shown in Figure 5.1.
Gas diffusion takes place in the PVDF membrane inside the diffusion cell, in
which the acceptor solution flows in counter-current with the gas flow.
Figure 5.1 Typical gas diffusion cell with a PVDF membrane
Mass transfer is based on the diffusion of the analyte (in gaseous form)
across the gas layer separating the two phases. The acceptor solution, also
called carrier solution, flows counter-currently with gas stream for
maximizing the diffusion phenomena and convert the H2S into detectable
species (TDS).
(a) Inlet donor stream
(b)
Outlet retentate
(c) Inlet acceptor
stream
(d) Outlet analyte into
the acceptor stream
to the detector
a b
cd
PVDF
membrane

8/17/2019 see page 29
http://slidepdf.com/reader/full/see-page-29 123/260
5. On-line monitoring of H2S and sulfide by a flow analyzer
93
5.3 Materials and methods
5.3.1 Standards and reagents
All aqueous solutions were prepared with deionized Milli-Q water
(18 MΩ·cm-1). Reagents employed were of analytical grade. A sulfide
antioxidant buffer solution (SAOB, pH = 14) was used as pH-adjustment
solution, converting all dissolved H2S and HS- to S2- (Card, 2001). The
SAOB solution was daily prepared with 40 g·L-1 of NaOH (Panreac, Spain)
and 10.1 g·L-1 of L-(+)ascorbic acid (Panreac, Spain), for avoiding S2-
oxidation (Garcia-Calzada et al., 1999). The stock solution of S2-
, withapproximate concentration of around 1 mol S-S2-
·L-1, was prepared with
60.05 g of Na2S·9H2O (Sigma Aldrich, Germany) dissolved in 250 mL of
NaOH 1×10⁻² mol·L-1 (Panreac, Spain). Carrier was prepared by doping
SAOB solution with background concentration of S2- (2×10⁻⁵ mol S-S2-·L-1).
The analyte background is added to the SAOB solution in order to stabilize
the baseline and to contribute to the fast recovery of the base line signal
after sample analysis (Baeza, 2004).
The determination of the real concentration of the stock solution of
sulfide was performed applying an iodometric method, according to the
Standard Methods (APHA, 2006a). Briefly, the method is based on the
reaction of S2- with excess of iodide (Panreac, Spain) in acid solution; the
produced iodine is then determined by titration with standardized
Na2S2O3·5H2O (Panreac, Spain) using soluble starch (Sigma Aldrich,
Germany) as indicator, which forms an intense blue-black complex with
iodine, present as I3- (Kolthoff et al., 1969). S2- is then calculated from the
difference between the volume of S2O32- required for the titration of the
blank and the volume used for the sample. The standardization of the
S2O32- solution was performed by triplicated titration with KIO3 (Panreac,
Spain) as primary standard. Standard solutions of S2- were daily prepared
as previously described (Sekerka and Lechner, 1977), by serial dilution of
the concentrated stock solution with SAOB, in order to avoid S2- oxidation to
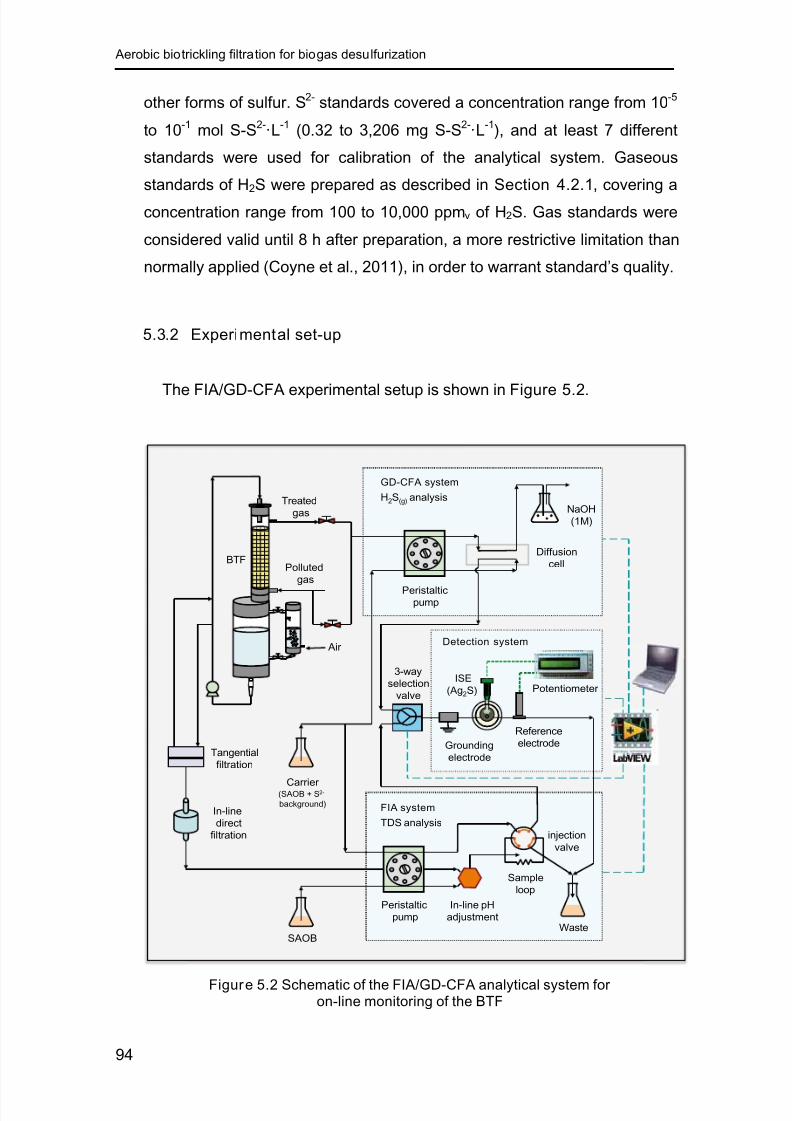
8/17/2019 see page 29
http://slidepdf.com/reader/full/see-page-29 124/260
Aerobic biotrickling filtration for biogas desulfurization
94
other forms of sulfur. S2- standards covered a concentration range from 10-5
to 10-1
mol S-S2-
·L-1
(0.32 to 3,206 mg S-S2-
·L-1
), and at least 7 different
standards were used for calibration of the analytical system. Gaseous
standards of H2S were prepared as described in Section 4.2.1, covering a
concentration range from 100 to 10,000 ppmv of H2S. Gas standards were
considered valid until 8 h after preparation, a more restrictive limitation than
normally applied (Coyne et al., 2011), in order to warrant standard’s quality.
5.3.2 Experimental set-up
The FIA/GD-CFA experimental setup is shown in Figure 5.2.
Figure 5.2 Schematic of the FIA/GD-CFA analytical system foron-line monitoring of the BTF
Grounding
electrode
ISE
(Ag2S)
Reference
electrode
Potentiometer
3-way
selection
valve
In-line
direct
filtration injection
valve
Waste
Carrier (SAOB + S2-
background)
SAOB
In-line pH
adjustment
BTFDiffusion
cell
GD-CFA system
H2S(g) analysisNaOH
(1M)
Peristalticpump
Air
Sample
loop
Tangential
filtration
Polluted
gas
Treated
gas
Peristaltic
pump
FIA system
TDS analysis
Detection system

8/17/2019 see page 29
http://slidepdf.com/reader/full/see-page-29 125/260
5. On-line monitoring of H2S and sulfide by a flow analyzer
95
Liquid samples were processed by the FIA system, while gas samples
were processed by the CFA system, suited with a gas diffusion cell for
selective H2S-absorption. Both systems are connected to a single detection
unit based on an ISE of crystalline membrane (Ag2S), constructed as
described in Section 4.4, for TDS detection (Redondo et al., 2008).
However, since the analyzer described by Redondo et al. (2008) was not
prepared for on-line sampling, an in-line sampling filtration system and a
continuous sample pH adjustment step were developed during this work.
Connection of all system units was done with PTFE tubing of 0.8 mm
internal diameter and 1.6 mm external diameter. The entire system was
controlled and supervised by a tailor-made application previously developed
by others (Redondo et al., 2008), adapted during the work presented in this
Chapter to on-line monitoring applications, using the software Labview 10.1
(National Instruments, USA). The data transfer was automatically done by a
data acquisition module NI-USB-6008 (National Instrument, USA). The
selection between FIA or GD/CFA operation mode was performed by the
operator prior to the analyzer operation, using a friendly interface in the
control software; physically it is made by a three-way electrovalve
(NResearch 161T031; NResearch Inc., USA), installed right before the
detection system. The custom-made program for data acquisition and for
controlling the selection valve was adapted for any gas or liquid phase
sampling frequency configuration including continuous, full-time gas phase
or liquid phase on-line monitoring.
For the FIA system operation under continuous mode, liquid samples
from the recirculation line of the BTF were pumped to the detection system
by a peristaltic pump (Minipuls – Wilson, France). Samples were previously
in-line filtered using a combination of tangential and direct flow filtration
devices. Filtration is required for prevent any solid particle to enter the
analytical system; filtration until 0.22 µm grade also avoid any undesirable
biomass microfilm formation in electrode surface or any other place of the
system internals. A combination of a primary filtration unit of a tangentialflow type filter (Mini-Ultrasette™; Pall Corporation, USA) with 3 µm pore

8/17/2019 see page 29
http://slidepdf.com/reader/full/see-page-29 126/260
Aerobic biotrickling filtration for biogas desulfurization
96
size, followed by a secondary filtration unit of a disposable direct flow type
filter (DIF-MN-40; Headline Filters, UK) with 0.22 µm pore size was installed
before the liquid sampling peristaltic pump. Permeate from tangential flow
type filter was returned to the BTF recirculation line (Figure 5.2). Injection
cycles were executed by a six-way valve (EASI 1215/342; EASI
Technologies, Spain). Each injection volume tested was measured with a
specific sample loop. FIA system sampling time was 90 seconds, with the
injection pulse being initiated after 60 seconds of each analytical cycle.
The proposed analytical system was equipped with an in-line pH
adjustment step for liquid samples, to provide robustness to the FIA system
because desulfurizing bioreactors may operate in a wide range of pH (van
Langenhove and De Heyder, 2001; Abatzoglou and Boivin, 2009) and
experiment important pH changes during operation if pH is not controlled
(Sublette et al., 1998; Gonzalez-Sanchez et al., 2008). Since the optimal pH
for the ISE is 14 (Redondo et al., 2008), the sample stream was mixed with
a metered flow of SAOB before the injection valve, previously to injection
and detection steps. The optimal flow rate, and consequently the dilution
ratio, was selected based on the lowest pH value allowed by the biotrickling
filter pH control system (pH = 6). Different tubing combinations were tested,
resulting in a minimum SAOB/sample flow rate ratio of 0.13, which
corresponded to a pH adjusting solution flow rate of 0.26 mL·min-1. The
sample pH adjustment unit comprised a mixture T-shaped connection
device (Omnifit, UK), in which the sample flow was mixed with the fixed
SAOB solution flow. The pH adjustment unit was installed after the sample
peristaltic pump, right before the injection valve (Figure 5.2).
For the CFA system operation coupled to on-line monitoring tasks,
samples taken from the outlet gas line of BTF were automatically pumped
by a peristaltic pump (Perimax 12; Spetec, Germany) to the gas diffusion
cell, which was made of two Perspex pieces that support the diffusion
membrane, a PVDF membrane (Millipore GVHP 142 50) with pore diameter
of 0.22 µm and 7.2 × 0.25 cm2
exchange area. Diffusion cell can be easilyopened and the membrane replaced. For safety reasons, a trap deposit with

8/17/2019 see page 29
http://slidepdf.com/reader/full/see-page-29 127/260
5. On-line monitoring of H2S and sulfide by a flow analyzer
97
NaOH solution (1 mol·L-1) was installed after the gas cell diffusion. For the
operation of the CFA system in off-line mode, or during calibration
procedures, samples (or standards) were conditioned 1 L Tedlar® bags
(SKC, USA), as described in Section 4.2.1, and then were inserted into the
analytical system applying the same above-mentioned peristaltic pump.
Finally, the detection system consisted of a stainless steel grounding
electrode (33 mm × 0.8 mm internal diameter), an ISE of homogeneous
crystalline Ag2S membrane used as an indicator electrode and a reference
electrode of a double liquid junction of Ag/AgCl (Thermo Orion 900200;
Orion, USA). The indicator electrode construction was made according to
the procedure developed by the Sensors and Biosensors Group (UAB),
previously presented in Figure 4.6.
5.3.3 Experimental conditions and bioreactor monitoring
Reference operation of the BTF was adopted as detailed in Table 4.1.
Basically, an inlet H2S concentration of 2,000 ppmv of H2S (51.08 g S-H2S·m-3
·h-1) was fed to the BTF under neutral pH conditions (6.0 – 6.5). The
aeration flow was fixed at 150 mL·min-1 during the reference operation and
was kept unaltered during the experiments, thus reducing the O2/H2S supplied
ratio. The EBRT was 180 s and an average HRT of 51 ± 6 h were
maintained during reference operation.
Under such reference conditions, no TDS accumulation in the liquid
phase was noticed. Thus, different experiments under anoxic and aerobic
conditions were performed in which the synthetic biogas inlet H2S
concentration was increased and the HRT reduced, in order to force the
accumulation of significant amounts of TDS in the liquid phase.
Experimental conditions applied during the aerobic experiments reported in
this Chapter are shown in Table 5.1. Each transient condition was kept for
120 minutes, before resuming reference conditions at the end of the
experiment. Overall, experiments allowed measuring H2S concentrations in

8/17/2019 see page 29
http://slidepdf.com/reader/full/see-page-29 128/260
Aerobic biotrickling filtration for biogas desulfurization
98
the outlet gas phase up to 6,500 ppmv of H2S and TDS concentrations up to
37 mg S-S2-·L-1 in the liquid phase, thus covering the range of
concentrations of the FIA/GD-CFA analyzer. In the experiments under
aerobic conditions reported herein, the HRT was reduced to 9 h.
Table 5.1 Experimental conditions for TDS accumulation
[H2S]biogas
(ppmv of H2S)
[H2S] LR
(g S-H2S·m-3
·h-1
)
O2/H2S supplied
(v·v-1
)
1,999.79 51.08 23.60
4,001.78 107.65 11.20
6,001.33 161.48 7.47
8,000.00 215.30 5.60
The FIA system was validated by a commercially available sulfide ISE
combined with an Ag/AgCl electrode as reference (SympHony 14002-790;
VWR International, Germany), installed in the waste line right after the
constructed ISE electrode. The GD-CFA was validated by an
electrochemical commercial H2S(g) sensor (Sure-cell; Euro-Gas
Management Services LTD, UK) installed in the BTF outlet gas line.
Technical specification of employed sensors is presented in Section 4.7. In
addition to the FIA/GD-CFA analyses, liquid samples were taken every 20
minutes from the liquid phase during the experiments, for off-line SO42- and
S2O32- analyses by IC.
5.4 Results and discussion
5.4.1 On-line moni tor ing with FIA/GD-CFA system
Monitoring data of the complete experimental period under aerobic
conditions as acquired by the FIA/GD-CFA system are shown in Figure 5.3.
The electrode baseline presented a gradual increase along the monitored
period, as normally observed in flow injection analyzers when operating in

8/17/2019 see page 29
http://slidepdf.com/reader/full/see-page-29 129/260
5. On-line monitoring of H2S and sulfide by a flow analyzer
99
continuous mode (Baeza, 2004). Similar results were obtained also under
anoxic conditions (results not shown). Thus, the total peak (FIA
configuration) and plateau (GD-CFA configuration) heights were calculated
considering the correspondent baseline for each analytical cycle.
Figure 5.3 Experimental on-line monitoring data. Dotted line indicates inlet H2Sconcentration. Arrows show gas phase determinations.
Inset shows a detailed 25-minutes period data
During the experiment, the analytical system was programmed for
continuous on-line determination of TDS in the liquid phase and to sample
the gas phase twice per each inlet concentration step (at minute 70 and 110
of each interval of 120 minutes). The selection valve of the analytical
system was used for automatically switching from the FIA to the GD-CFA
configuration. As shown in Figure 5.3 inset, the selection valve change
produced a sharp increase in the system response, probably as a
consequence of a signal noise instant disturbance. Thus, an extended time
8/17/2019 see page 29
http://slidepdf.com/reader/full/see-page-29 130/260
Aerobic biotrickling filtration for biogas desulfurization
100
for the baseline stabilization is needed during gas samples analysis,
consequently leading to a decrease in the gas analysis frequency. Under
alternating operating conditions, the gas analysis time was 8 minutes on
average (4 minutes for baseline stabilization and 4 minutes for maximum
signal plateau stabilization), while only 90 seconds were required for liquid
samples analysis. The total analysis time for each system can be easily
configured using the control program.
The analyser was validated by comparing its results for gas and liquid
samples from the biotrickling filter with those obtained with commercial
sensors. Figure 5.4a for the FIA configuration and Figure 5.4b for the GD-
CFA configuration demonstrate, by the linear regression test, that no
significant differences were observed at 95% confidence level. In the linear
regression test for the FIA, a slope of 1.0 ± 0.0 and intercept of 0.0 ± 0.2
were obtained. For the GD-CFA, a slope of 1.0 ± 0.0 and intercept of 16.8 ±
36.4 were obtained. Thus, analytical results can be considered acceptable
for both liquid and gas phase measurements for the concentration range
studied. Calibrations performed in this study resulted in a detection limit of
1.5×10⁻⁵ ± 0.9×10⁻⁵ mol S-S2-·L-1 for the FIA system and 159 ± 57 ppmv of
H2S for the GD-CFA system. Moreover, electrodes presented a good
stability behavior over 3 years of discontinued use, requiring minimum
maintenance procedures, a clear evidence of the system robustness. It is
worth mentioning that the filtration step, with a first tangential filtration unit
plus a direct flow filter element was used for more than 80 h without
significant signs of clogging. Such configuration revealed enough in the
present case, for the filtration of 0.12 L·h-1 with a concentration of total
suspended solids < 2 mg·L-1. According to this and because liquid sample
pH was adjusted on-line to 14, the second filtration step (0.22 µm) could
have been avoided. However, SOB are known to grow in a wide range of
pH, from 1 to 11 (Islander et al., 1991, Devinny and Deshusses, 1999), thus
the second step filtration might be necessary in the long-run operation, to
protect the FIA/GD-CFA system against any contamination by biomass
colonization and to avoid undesirable episodes of system channelsobstruction, by the deposition of any solid particle coming from the BTF.

8/17/2019 see page 29
http://slidepdf.com/reader/full/see-page-29 131/260
5. On-line monitoring of H2S and sulfide by a flow analyzer
101
Figure 5.4 Linear regression test for (a) FIA system for TDS analysis and (b) GD-
CFA system for H2S analysis
According to the HRT in the present reactor during the experiment (9 h),
FIA data averages in periods of approximately 7.5 min (i.e. 5 analysis data)
were considered throughout the experiment as shown in Figure 5.5.
Figure 5.5 TDS and H2S profiles. Error bars of 95% confidenceinterval for n=3 analysis
TDS (mg S-S2-·L-1) {commercial sensor}
0 10 20 30 40
T D S ( m g S - S
2 - · L - 1 ) { F I A
}
0
10
20
30
40
a
[H2S] (ppmv of H2S) {commercial sensor}
0 1000 2000 3000 4000 5000 6000 7000
[ H 2 S ] ( p p m v o f H 2
S ) { G D - C
F A }
0
1000
2000
3000
4000
5000
6000
7000
b
TDS (mg S-S - L-1) {commercial sensor}
0 10 0 30 40
T D S ( m g S - S
- ·
- ) { F I A
}
0
10
20
30
40
a
[H S] (ppmv of H S) {commercial sensor}
0 1000 2000 3000 4000 000 000 7000
[ H
S ] ( p p m v o f H
S ) { G D - C
F A }
1000
2000
3000
4000
000
7000
b

8/17/2019 see page 29
http://slidepdf.com/reader/full/see-page-29 132/260
Aerobic biotrickling filtration for biogas desulfurization
102
Until minute 280, the TDS concentration was close to the FIA detection
limit. Major TDS accumulation was only detected during the 8,000 ppmv of
H2S step, in which TDS concentration experienced a significant gradual
increase until reaching a maximum average value of 2.8 mg S-S2-·L-1. Once
the inlet concentration of 2,000 ppmv of H2S was restored, TDS
concentration immediately decreased, reaching values below the FIA
detection limit after one hour of operation back at reference conditions.
Also, no significant response of the H2S outlet concentration was
obtained in the GD-CFA system during the 4,000 ppmv of H2S step, with
outlet H2S concentrations close to the GD-CFA detection limit ([H2S]out <
154 ppmv of H2S). Later, the outlet gas concentration gradually raised to a
maximum value of 3,074 ppmv of H2S. Similarly to TDS, H2S outlet
concentration sharply decreased once the reference operating conditions
were restored, reaching values close to zero after one hour.
5.4.2 Overall biotrickling fil ter performance
Results of the BTF performance assessment are shown in Figure 5.6a
and 5.6b for the BTF under study, in terms of the study of the EC and the
RE. LR ranged from 51.08 to 215.30 g S-H2S·m-3·h-1, generally considered
a high load. Since the FIA/GD-CFA system was programmed to mainly
analyze the liquid phase in the experiment presented herein, monitoring
results of the commercial sensor allow seeing the dynamics of EC and RE
during the experimental period.
Except for the step of 4,000 ppmv of H2S, each step lead to a decrease in
the RE, which was more significant once the reactor had reached the step
of 8,000 ppmv of H2S. Oppositely, the EC exhibited a marked increase right
after each inlet concentration increase. However, a progressive decrease of
the EC was found along the 6,000 ppmv of H2S step, and a sharp decrease
was found along the 8,000 ppmv of H2S step, the latter due to the quick
saturation of the sorption capacity of the liquid phase.

8/17/2019 see page 29
http://slidepdf.com/reader/full/see-page-29 133/260
5. On-line monitoring of H2S and sulfide by a flow analyzer
103
Figure 5.6 (a) Evolution of H2S EC and RE with data from commercial sensor.(b) Average H2S EC and RE versus LR with data from GD-CFA analyzer
When reference operational conditions resumed, the EC and RE
suddenly dropped to zero for a period of around 3 minutes, which
corresponds to the gas residence time of the reactor. Still, since some TDS
had accumulated in the liquid phase, 18 minutes were required to achieve
EC and RE values equivalent to the previous inlet concentration step. The
a
Time (minutes)
0 100 200 300 400
R E ( % )
0
20
40
60
80
100
E C ( g S - H 2 S ·
m - 3
·
h - 1 )
0
50
100
150
200
250
300
[ H 2 S ] i
n ( p p m v o f H 2
S )
0
2000
4000
6000
8000
10000
RE
EC[H2S]
in
Time minutes
0 100 200 300 400
E
%
80
100
E C ( g S - H 2 S ·
m -
·
h - )
1
200
250
300
i n
p p m
o 2
000
10000
S]in
LR (g S-H2S·m-3·h-1)
0 50 100 150 200 250
E C ( g S - H 2 S
·
m - 3 ·
h - 1 )
0
50
100
150
200
250
R E ( %
)
0
20
40
60
80
100
EC average {CFA}
RE average {CFA }
b

8/17/2019 see page 29
http://slidepdf.com/reader/full/see-page-29 134/260
Aerobic biotrickling filtration for biogas desulfurization
104
maximum instant EC registered was 201 g S-H2S·m-3·h-1 (Figure 5.6a),
while the maximum averaged EC was 150 g S-H2S·m-3
·h-1
(Figure 5.6b).
The RE was initially 100% and kept close to 98% during the 4,000 ppmv of
H2S step. During the 6,000 ppmv of H2S step, the RE was approximately
92% and dropped to a minimum average value of 68% during the highest
LR period. However, the RE quickly recovered to close to 95% as soon as
the 2,000 ppmv of H2S step resumed, indicating a fast recovery of the
biotrickling filter capacity, as already reported for this kind of reactors
(Fortuny et al., 2010) when submitted to transient operating conditions.
Overall, results indicate that such BTF configuration under the operating
conditions tested herein is able to handle high, transient H2S loads with
effective desulfurization of a wide range of concentrations. In terms of
monitoring, the FIA/GD-CFA system proved sufficient for assessing the
overall performance of the reactor during the performed experiments, even
if continuous monitoring of the gas phase is recommended for assessing
short transient periods dynamics.
5.4.3 Sulfur fate
Although desulfurization efficiencies and the reactor capacity can be
assessed with the FIA/GD-CFA analyzing system, the information provided
by the analyzer needs complementary data to understand the complex
behavior of the biotrickling filter in terms of sulfur fate.
On-line monitoring data of pH, DO and ORP during the experimental
period are shown in Figure 5.7. The DO profile, obtained from the DO
probe located at the recirculation line of the BTF, after the aeration unit
shown that the maximum oxygen consumption took place during the
highest H2S inlet concentration, as expected from the stoichiometric
relations described by Equation 8, Equation 9 and Equation 10.

8/17/2019 see page 29
http://slidepdf.com/reader/full/see-page-29 135/260
5. On-line monitoring of H2S and sulfide by a flow analyzer
105
Figure 5.7 On-line monitoring of pH, DO, ORP and [H2S]in
during experimental period
After reference conditions were restored, DO rapidly recovered the initial
value. It is worth mentioning that a DO sensor located in the sump of the
reactor showed a value of 0 mg O2·L-1 throughout the experimental period,
indicating that oxygen availability was limited at some point along the depth
of the reactor. Regarding the ORP profile, a gradual decrease for each
concentration step was encountered, from the initial value of -40 mV to -50
mV, -150 mV and -300 mV for inlet H2S concentrations of 4,000; 6,000 and
8,000 ppmv of H2S, respectively. The initial value of -40 mV is consistent
with the presence of SO42- as main product of the H2S oxidation. ORP
values between -250 and -400 mV indicate TDS accumulation and are in
the range usually reported for the incomplete S2-
oxidation to S0 (Fortuny et
al., 2008). At this point, one can speculate if the limitation in the
performance was due to mass transfer or to biological activity. Although
profiles in Figure 5.6 appeared to indicate a mass transfer limitation during
the steps of 4,000 and 6,000 ppmv of H2S, the ORP profile and the average
TDS concentrations of 0.90 ± 0.02 and 0.94 ± 0.02 mg S-S2-
·L
-1
along the
Time (minutes)
0 100 200 300 400
D O ( m
g L - 1 ) , p H
0
1
2
3
4
5
6
7
O R P ( m V )
-500
-400
-300
-200
-100
0
[ H 2 S ] ( p p m v )
0
2000
4000
6000
8000
10000
pHDO
ORP
[H2S]in
Time (minutes)
100 200 300 400
D O ( m
g L - 1 ) , p H
0
1
2
3
4
5
6
7
O R P ( m V )
-500
40
-300
-200
-100
0
[ H 2 S ] ( p p m v )
000
4000
000
000
10000
pHDO
RP
[H2S]in
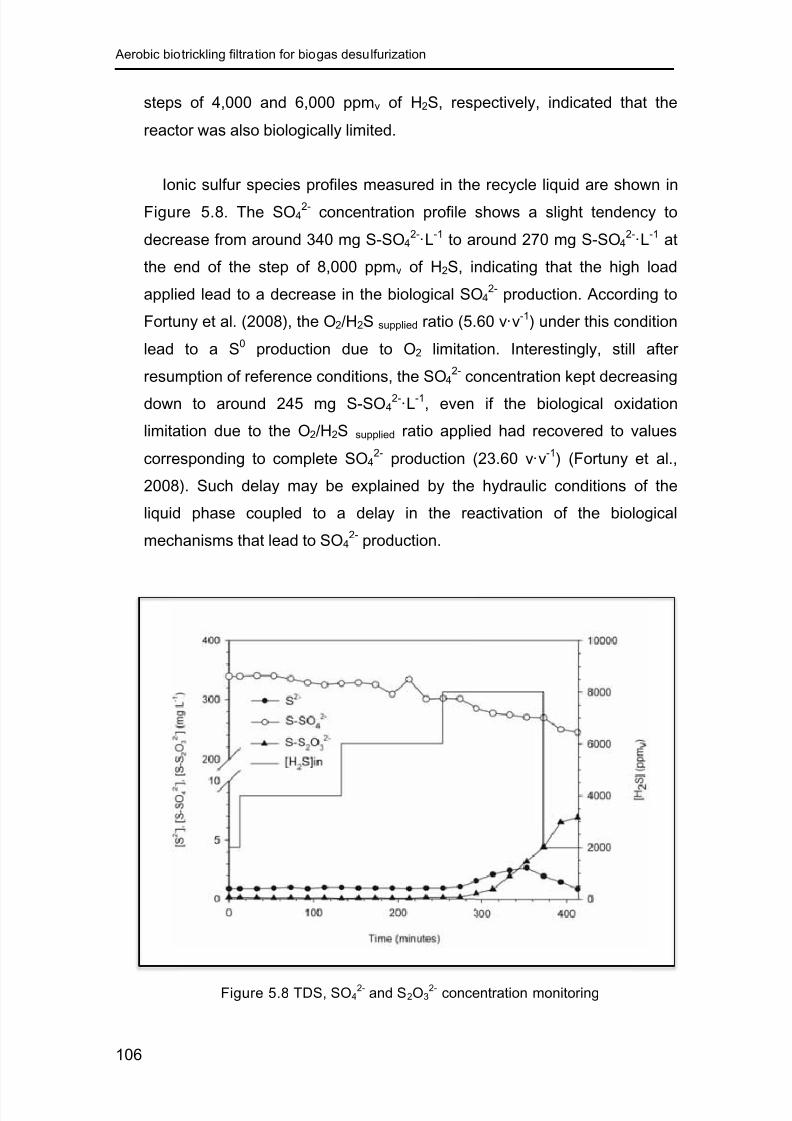
8/17/2019 see page 29
http://slidepdf.com/reader/full/see-page-29 136/260
Aerobic biotrickling filtration for biogas desulfurization
106
steps of 4,000 and 6,000 ppmv of H2S, respectively, indicated that the
reactor was also biologically limited.
Ionic sulfur species profiles measured in the recycle liquid are shown in
Figure 5.8. The SO42-
concentration profile shows a slight tendency to
decrease from around 340 mg S-SO42-
·L-1 to around 270 mg S-SO42-
·L-1 at
the end of the step of 8,000 ppmv of H2S, indicating that the high load
applied lead to a decrease in the biological SO42-
production. According to
Fortuny et al. (2008), the O2/H2S supplied ratio (5.60 v·v-1) under this condition
lead to a S0 production due to O2 limitation. Interestingly, still after
resumption of reference conditions, the SO42-
concentration kept decreasing
down to around 245 mg S-SO42-
·L-1, even if the biological oxidation
limitation due to the O2/H2S supplied ratio applied had recovered to values
corresponding to complete SO42-
production (23.60 v·v-1
) (Fortuny et al.,
2008). Such delay may be explained by the hydraulic conditions of the
liquid phase coupled to a delay in the reactivation of the biological
mechanisms that lead to SO42-
production.
Figure 5.8 TDS, SO42- and S2O3
2- concentration monitoring

8/17/2019 see page 29
http://slidepdf.com/reader/full/see-page-29 137/260
5. On-line monitoring of H2S and sulfide by a flow analyzer
107
The S2O32- concentration kept close to zero until minute 260 of the
experiment and then started to increase until 4 mg S-S2O32-
·L-1
at the end of
the step of 8,000 ppmv of H2S (215.30 g S-H2S·m-3·h-1), showing a
maximum value of 6.8 mg S-S2O32-
·L-1 at the end of the monitoring period.
Thiosulfate formation by chemical oxidation was driven by TDS
accumulation (Fortuny et al., 2010), not only during the maximum LR period
but also after resumption of the reference LR value (51.08 g S-H2S·m-3·h-1).
A sulfur mass balance was performed to calculate the S0 concentration
by subtraction, as previously described (Janssen et al., 1997). The amount
of sulfur as S-S0 and S-SO4
2- produced, as well as the total sulfur removed
by biological activity (S-H2S) are shown in Figure 5.9. The DO/S2- ratio in
the liquid phase was calculated, representing the DO available at the top of
the reactor, which could be related to the capability of the system to
produce either SO42- or S0, according to the stoichiometric relation obtained
from Equation 8 and Equation 9.
Figure 5.9 Sulfur mass balance and DO/S2-
ratio during experiments
Time (minutes)
0 100 200 300 400
S u
l f u r ( m g S - S
0 )
0
500
1000
1500
2000
2500
D O / S 2 -
( m g O 2 / m g S - S
2 - )
0
1
2
3
4
5
6
[ H 2 S ] ( p p m v o f H 2
S )
0
2000
4000
6000
8000
10000
12000
S-H2S removed (cumulative)
S-SO42-
produced (cumulative)
S-S0 produced (cumulative)
DO/S2-
[H2S]in
Time minutes)
0 100 200 300 400
S u
l f u r ( m g S - S
0 )
0
500
1000
1500
2000
2500
D O / S 2 -
( m g O 2 / m g S - S
2 - )
0
1
2
3
4
5
6
[ H 2 S ] ( p
m v o f H
S )
0
2000
4000
6000
8000
10000
12000
-H S removed (cumulative)
-SO4-
produced (cumulative)
-S0 produced (cumulative)
DO/S2-
[H S]in

8/17/2019 see page 29
http://slidepdf.com/reader/full/see-page-29 138/260
Aerobic biotrickling filtration for biogas desulfurization
108
Theoretically, a DO/S2- ratio lower than 0.5 indicates that S0 is the main
product while a value higher than 2 indicates that the main product is SO 42-
.
Interestingly, even when the calculated DO/S2- ratio reached values higher
than 2 mg O2·(mg S2-)-1, sulfur mass balance results suggested a
concomitant production of SO42-
and S0. These results confirm the
existence of an important DO gradient inside the filter bed, and perhaps in
the biofilm, leading to O2 depletion at the bottom of the reactor where,
probably, only S0 was being produced. Although not studied, gas circulation
in counter-current to the liquid phase circulation may increase the potential
of S0 production in the reactor compared to a co-current operation. In the
latter scenario, the oxygen availability would be larger at the entrance of the
reactor where the H2S concentration reaches its maximum value.
Sulfur mass balance results indicate that S0 production started from the
beginning of the step of 4,000 ppmv of H2S (107.65 g S-H2S·m-3·h-1), when
the O2/H2S supply ratio was 11.2. However, S0 accumulation suffered a
notable increase during steps of 6,000 and 8,000 ppmv of H2S (161.48 and
215.30 g S-H2S·m-3·h-1 respectively), when O2/H2S supplied ratio was 7.5 and
5.6, respectively, which is considered as a limiting value for aerobic
biological desulfurization (Fortuny et al., 2010). At the end of the highest LR
period, a total amount of 783 mg S-S0 was produced from 1,747 mg S-H2S
removed. It is worth mentioning that as soon as reference operating
condition was resumed (2,000 ppmv of H2S inlet concentration, O2/H2S
supply ratio of 23.6), the S0 production ratio instantly decreased while SO42-
production noticeable increased, confirming that during highest LR period,
the O2/H2S supplied ratio limited the complete biological S2- oxidation to sulfate
(Kelly, 1999).
Sulfate and elemental sulfur production can be expressed as a ratio to
the removed H2S, as shown in Table 5.2, resulting in the expression of the
SO42- selectivity (S-SO4
2-produced/S-H2Sremoved) or S0 selectivity (S-S0
produced /
S-H2Sremoved), calculated according to Equation 25 and Equation 26,
respectively. S0
production is clearly enhanced by oxygen limitation, asverified from obtained results.

8/17/2019 see page 29
http://slidepdf.com/reader/full/see-page-29 139/260
5. On-line monitoring of H2S and sulfide by a flow analyzer
109
Table 5.2 SO42- and S0 production as a function of the O2/H2S supplied ratio and
DO/S2- ratio
H2S biogas
(ppmv)
LR
(g S-H2S·
m
-3·
h
-1
)
O2/H2S
(v·
v
-1
)
S-SO42-
/S-
H2Sremoved
(%)
S-S0/S-
H2Sremoved
(%)
DO/S2-
(mg O2/mg S
2-
)
1,999.79 51.08 23.6 100 0 2.96 – 3.66
4,001.78 107.65 11.2 78 – 80 20 – 22 2.09 – 3.37
6,001.33 161.48 7.5 62 – 72 28 – 38 1.74 – 2.83
8,000.00 215.30 5.6 55 – 59 41 – 45 0.53 – 2.54
1999.79 51.08 23.6 56 – 57 43 – 44 0.68 – 3.01
Differently to the results obtained by Fortuny et al. (2008), SO42-
selectivity is higher than S0 selectivity for a equivalent LR, since the O2
supply system was improved from gas-phase air injection to an aeration
column previous to the BTF, enhancing the O2/H2S supplied ratio (Bailon,
2007). Also, the use of a random packing material was appointed as a
possible reason for the improvement of the oxygen spread to the internal
layers of the biofilm, which was probably compromised when the structured
packing material was applied, because of the impairment produced on the
liquid circulation through the packed bed.
As noticed in Figure 5.9, minimum and maximum values of the DO/S2-
ratio, as also shown in Table 5.2, confirmed that even when the calculated
O2 supplied in the top part of the reactor was higher than the stoichiometric
requirements for the production of SO42-, S0 was being produced in the
intermediate and bottom parts of the reactor. Results shown that the
optimization of the O2 supply in such kind of bioreactors configuration is
warranted for improving the desulfurization capacity of the system.

8/17/2019 see page 29
http://slidepdf.com/reader/full/see-page-29 140/260
Aerobic biotrickling filtration for biogas desulfurization
110
5.5 Conclusions
The proposed analytical system, based on a flow injection analysis
technique, was proven to be suitable for the on-line monitoring of the
studied desulfurizing BTF, treating high loads of biogas mimics. The
analyzer consisted on a FIA configuration for TDS analysis and a GD-CFA
configuration for H2S(g) analysis with a single ISE for S2- determination. The
constructed tubular electrodes of a homogeneous crystalline membrane of
Ag2S were characterized by direct potentiometry and the operational
characteristics of the flow system were optimized for the proposed
application. Moreover, electrodes were successfully validated by comparing
the obtained analytical response obtained during different operational
episodes to the response obtained with commercial sensors. Also, the
particularly high upper detection limit encountered for the GD-CFA sub-
system (up to 10,000 ppmv of H2S) offered a significantly important
application field for the on-line monitoring of high concentrations of H2S, as
in the case of biogas desulfurizing treatment plants.
The proposed filtration system showed sufficient to meet de required
needs for the continuous analytical system integrated to the BTF. Also, the
pH adjustment system was found to be effective for the studied conditions.
Nonetheless, the improvement of both pre-treatment steps is suggested in
order to expand the scope of application of the proposed analytical system
for the monitoring of diverse desulfurizing BTF systems.
In general, the BTF under study presented a fast recovery of their
treatment capacity after load increase perturbations. Although sulfur mass
balances results indicated that under oxygen limiting conditions the
formation of S0 is favored over SO42-, results demonstrated that direct
supply of oxygen into the liquid phase of the BTF system is an useful way to
improve the desulfurization capacity of the reactor.

8/17/2019 see page 29
http://slidepdf.com/reader/full/see-page-29 141/260
6preliminary study on the on-line
determination of sulfate
8/17/2019 see page 29
http://slidepdf.com/reader/full/see-page-29 142/260
Aerobic biotrickling filtration for biogas desulfurization
112
R eali st s do not fear t he r esu lt s of t hei r st udy .
F y odor M D ost oy ev sk y
M oscow, 182 1 Saint Pet er sbur g, 1881

8/17/2019 see page 29
http://slidepdf.com/reader/full/see-page-29 143/260
113
6 Preliminary study on the on-line determination of sulfate
6.1 Summary and scope
Results obtained during the preliminary study on the on-line
determination of SO42-
are presented in this Chapter. The accurate
monitoring of SO42- is crucial to assess the performance of sulfate-
producing systems, such as the desulfurizing BTF investigated during this
research. In this sense, the use of an ion-selective electrode (ISE) based on
liquid polymeric membrane sensible to SO42- was proposed as the initial
effort to develop an analytical system suitable to on-line monitoring of SO42-
under the operational conditions of the studied BTF.
The selection of the membrane active ionophore applied in this research
was made based on the commercial availability of the ionophore.
Electrodes response was characterized for both strategies batch mode
(conventional electrodes) and FIA system (tubular electrodes). Different
membrane compositions were tested aiming to investigate the effect of the
presence of the active ionophore, the effect of the lipophilic additive and the
effect of diverse plasticizer compounds over the response of the
constructed electrodes. Also, the effect of operating pH, the effect of the
concentration of the buffer solution and the effect of the analyte background
concentration in the buffer solution were studied. Additionally, the stability of
prepared membranes was tested in front of different operational conditions,such as washing procedures and variable conditioning time between
electrodes utilization.
Overall results indicated that constructed electrodes were applicable for
synthetic samples free of interferences. The best response was obtained
with a sensitivity of -22.8 3.5 mV·dec-1, limit of detection of 5.4×10⁻⁵
0.6×
10
-5
mol S-SO4
2-·
L
-1
(5.2
0.6 mg S-SO4
2-·
L
-1
) and a LinR between7.0×10
-6 to 2.0×10
-2 mol S-SO4
2-·L
-1 (0.7 to 1,920.0 mg S-SO4
2-·L
-1). The

8/17/2019 see page 29
http://slidepdf.com/reader/full/see-page-29 144/260
Aerobic biotrickling filtration for biogas desulfurization
114
presence of active ionophore and lipophilic additives was found crucial for
the electrode response. Operational pH between 4.5 and 7.5 resulted in
stable response of constructed electrodes. However, the investigation of the
electrodes behavior when interfering anions were present in the sample, at
concentrations normally found in real samples from the studied BTF,
suggested that the studied membrane composition and specially the
applied ionophore were not suitable for the monitoring of sulfate with the
proposed ISE during the operation of this kind of reactors, for both
conventional batch measures as well as detectors into automatic flow
analyzers for continuous determination.
The main objective of the work presented in this Chapter was to develop
a preliminary ISE implemented as a detector in an analyzer based on the
FIA technique for the on-line determination of SO42-, aiming the application
of this analytical system on the studied BTF. For this purpose, conventional
and tubular ISEs of polymeric liquid membrane were constructed,
characterized and their response was investigated in front of relevant
operational conditions.
Experiments herein reported were partially performed with the collaboration of:
Carrion R (2013) Desarrollo de un analizador de ión sulfato para la monitorización
de procesos medioambientales. Proyecto Final de Carrera. Co-directed by
Baeza M, Arasa E and Montebello AM. UAB, School of Engineering.

8/17/2019 see page 29
http://slidepdf.com/reader/full/see-page-29 145/260
6. Preliminary study on the on-line determination of sulfate
115
6.2 Introduct ion
The assessment of SO42- production in desulfurizing BTFs is one of the
crucial analytical procedures for the monitoring of the system performance.
Several analytical methods are applied for SO42- determination, such as
gravimetry, nephelometry, capillary electrophoresis and the turbidimetric
method recommended in water analysis (APHA, 1980). However, major
drawbacks of these techniques are related to the extended analytical time,
system complexity and elevated investment and operating costs. Besides
offering the opportunity of obtaining real-time information, the
implementation of an on-line analytical system based on an ISE for sulfatedetection implies in several advantages related to the analysis speed, low
sampling volumes and general low cost (Miro et al., 2004; Vlasov et al.,
2010; Zuliani et al., 2012; Firouzabadi et al., 2013). ISEs of polymeric liquid
membrane have been intensively used for the detection of a wide quantity
of analytes (Pretsch, 2007). One of the normally studied characteristics of
this kind of electrodes is the composition and stability of the sensing liquid
cocktail, which includes the investigation of the ionophore origin andquantity, as well as the lipophilic additive, which promotes the formation of
active ionic sites in the polymeric membrane, to facilitate the transference
and extraction of the analyte from the liquid (Buhlmann et al., 2000; Egorov
et al., 2004).
A comprehensive literature review of available reported studies on the
direct detection of sulfate with ISEs is provided in Table 6.1. Other
membrane components such as the polymeric matrix, plasticizer, ionophore
and lipophilic additives are reported for each study. Finally, operational
characterization of electrodes in terms of sensitivity (SL), linear range (LinR)
and limit of detection (LD) are shown, as well as the response time and
stability, the interference study method, the selectivity coefficient for nitrate
(NO3-), nitrite (NO2
-) and chloride (Cl-), and the operational reported pH
range. It is worth noticing that the selection of the studied interfering anions
was made upon the typical composition of the BTF liquid samples.
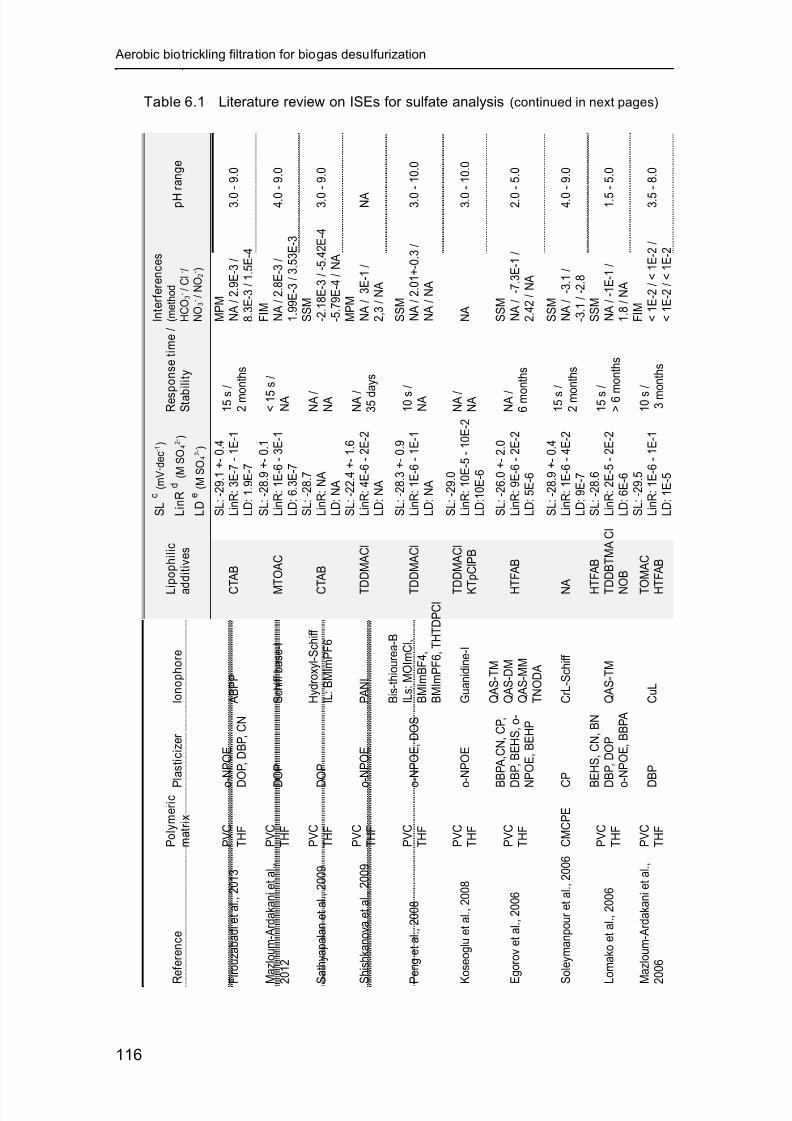
8/17/2019 see page 29
http://slidepdf.com/reader/full/see-page-29 146/260
Aerobic biotrickling filtration for biogas desulfurization
116
Table 6.1 Literature review on ISEs for sulfate analysis (continued in next pages)
R
e f e r e n c e
P o l y m e r i c
m a t r i x
P
l a s t i c i z e r
I o n o p h o r e
L i p o p h i l i c
a d d i t i v e s
S L c (
m V ·
d e c - 1 )
L i n R
d (
M S
O 4
2 - )
L D
e (
M S
O 4
2 - )
R e s p o n s e t i m e /
S t a b
i l i t y
I n t e r f e r e n c e s
( m e t h o d
H C O 3
- / C l - /
N O 3
- / N O 2
- )
p H
r a n g e
F
i r o u z a b a d i e t a l . ,
2 0 1 3
P V C
T H F
o
- N P O E
D
O P , D B P , C N
A B P P
C
T A B
S L : - 2 9 . 1 + - 0 . 4
L i n R : 3 E - 7 - 1 E - 1
L D : 1 . 9 E - 7
1 5 s
/
2 m o
n t h s
M P M
N A / 2 . 9 E - 3 /
8 . 3 E - 3 / 1 . 5 E - 4
3 . 0
- 9 . 0
M
a z l o u m - A r d a k a n i e t a l . ,
2
0 1 2
P V C
T H F
D
O P
S c h i f f b a s e - I
M
T O A C
S L : - 2 8 . 9 + - 0 . 1
L i n R : 1 E - 6 - 3 E - 1
L D : 6 . 3 E - 7
< 1 5
s /
N A
F I M
N A / 2 . 8 E - 3 /
1 . 9 9 E - 3 / 3 . 5 3 E - 3
4 . 0
- 9 . 0
S
a t h y a p a l a n e t a l . ,
2 0 0 9
P V C
T H F
D
O P
H y d r o x y l - S c h i f f
I L : B M I m P F 6
C
T A B
S L : - 2 8 . 7
L i n R : N A
L D : N A
N A /
N A
S S M
- 2 . 1 8 E - 3 / - 5 . 4 2 E - 4
- 5 . 7 9 E - 4 / N A
3 . 0
- 9 . 0
S
h i s h k a n o v a e t a l . ,
2 0 0 9
P V C
T H F
o
- N P O E
P A N I
T D D M A C l
S L : - 2 2 . 4 + - 1 . 6
L i n R : 4 E - 6 - 2 E - 2
L D : N A
N A /
3 5 d a y s
M P M
N A / 3 E - 1 /
2 , 3 / N A
N A
P
e n g e t a l . ,
2 0 0 8
P V C
T H F
o
- N P O E , D O S
B i s - t h i o u r e a - B
I L s : M O I m C l ,
B M I m B F 4 ,
B M I m P F 6 , T H T D P C l
T D D M A C l
S L : - 2 8 . 3 + - 0 . 9
L i n R : 1 E - 6 - 1 E - 1
L D : N A
1 0 s
/
N A
S S M
N A / 2 . 0 1 + - 0 . 3 /
N A / N A
3 . 0
- 1 0 . 0
K
o s e o g l u e t a l . ,
2 0 0 8
P V C
T H F
o
- N P O E
G u a n i d i n e - I
T D D M A C l
K
T p C l P B
S L : - 2 9 . 0
L i n R : 1 0 E - 5 - 1 0 E - 2
L D : 1 0 E - 6
N A /
N A
N A
3 . 0
- 1 0 . 0
E
g o r o v e t a l . ,
2 0 0 6
P V C
T H F
B
B P A , C N , C P ,
D
B P , B E H S , o -
N
P O E , B E H P
Q A S - T M
Q A S - D M
Q A S - M M
T N O D A
H
T F A B
S L : - 2 6 . 0 + - 2 . 0
L i n R : 9 E - 6 - 2 E - 2
L D : 5 E - 6
N A /
6 m o
n t h s
S S M
N A / - 7 . 3 E - 1 /
2 . 4 2 / N A
2 . 0
- 5 . 0
S
o l e y m a n p o u r e t a l . ,
2 0 0 6
C M C P E
C
P
C r L - S c h i f f
N
A
S L : - 2 8 . 9 + - 0 . 4
L i n R : 1 E - 6 - 4 E - 2
L D : 9 E - 7
1 5 s
/
2 m o
n t h s
S S M
N A / - 3 . 1 /
- 3 . 1 / - 2 . 8
4 . 0
- 9 . 0
L
o m a k o e t a l . ,
2 0 0 6
P V C
T H F
B
E H S , C N , B N
D
B P , D O P
o
- N P O E , B B P A
Q A S - T M
H
T F A B
T D D B T M A C l
N
O B
S L : - 2 8 . 6
L i n R : 2 E - 5 - 2 E - 2
L D : 6 E - 6
1 5 s
/
> 6 m
o n t h s
S S M
N A / - 1 E - 1 /
1 . 8 / N A
1 . 5
- 5 . 0
M
a z l o u m - A r d a k a n i e t a l . ,
2
0 0 6
P V C
T H F
D
B P
C u L
T O M A C
H
T F A B
S L : - 2 9 . 5
L i n R : 1 E - 6 - 1 E - 1
L D : 1 E - 5
1 0 s
/
3 m
o n t h s
F I M < 1 E - 2 / < 1 E - 2 /
< 1 E - 2 / < 1 E - 2
3 . 5
- 8 . 0
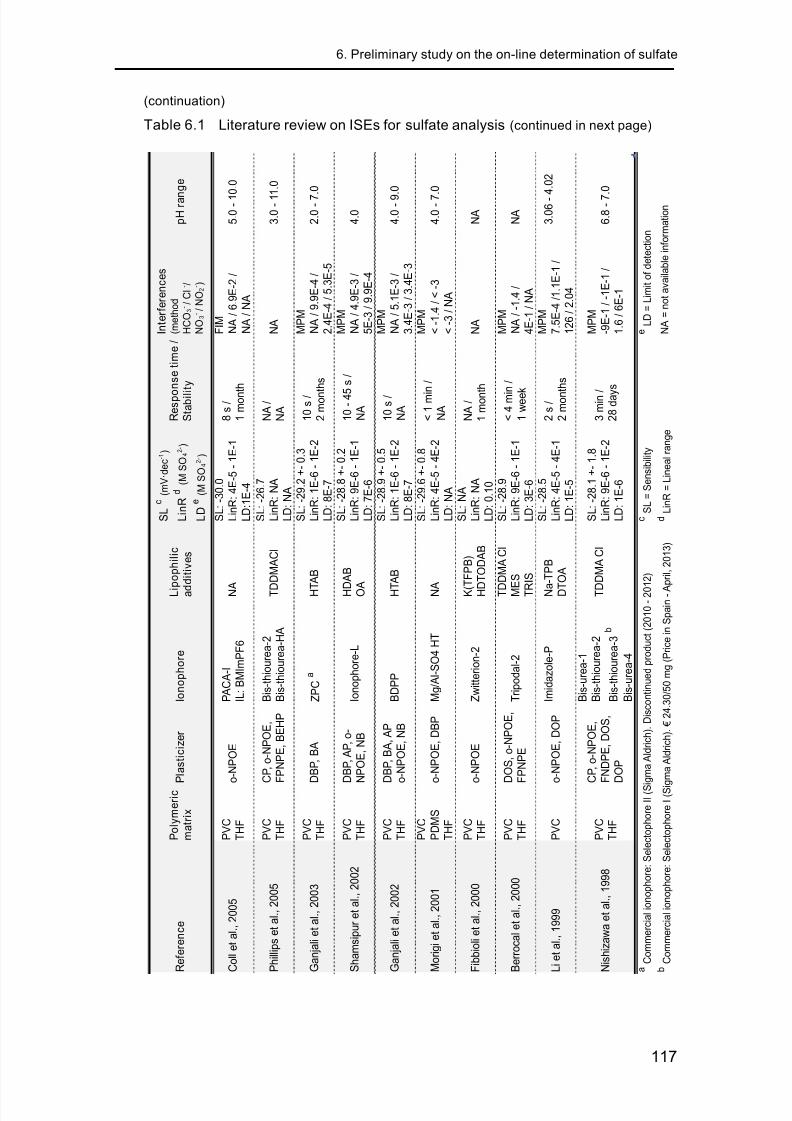
8/17/2019 see page 29
http://slidepdf.com/reader/full/see-page-29 147/260
6. Preliminary study on the on-line determination of sulfate
117
(continuation)
Table 6.1 Literature review on ISEs for sulfate analysis (continued in next page)
R e f e r e n c e
P o l y m e r i c
m a t r i x
P l a s t i c i z e r
I o n o p h o r e
L i p o p h i l i c
a d
d i t i v e s
S L
c ( m
V ·
d e c
- 1 )
L i n R
d ( M S
O 4
2 - )
L D
e ( M S
O 4
2 - )
R e s p o
n s e t i m e /
S t a b i l i t y
I n t e r f e r e n c e s
( m e
t h o
d
H C O
3 - / C l - /
N O
3 - / N O
2 - )
p H
r a n
g e
C o
l l e
t a
l . ,
2 0 0 5
P V C
T H F
o - N P O E
P A C A - I
I L : B M I m P F 6
N A
S L : - 3 0 . 0
L i n R : 4 E - 5 - 1 E - 1
L D : 1 E - 4
8 s /
1 m o n t h
F I M
N A / 6 . 9 E - 2 /
N A / N A
5 . 0 - 1 0 . 0
P h i l l i p s e
t a
l . ,
2 0 0 5
P V C
T H F
C P , o - N P O E ,
F P N P E , B E H P
B i s - t h i o u r e a - 2
B i s - t h i o u r e a - H A
T D
D M A C l
S L : - 2 6 . 7
L i n R :
N A
L D :
N A
N A /
N A
N A
3 . 0 - 1 1 . 0
G a n
j a l i e
t a
l . ,
2 0 0 3
P V C
T H F
D B P , B A
Z P C
a
H T A B
S L : - 2 9 . 2 + - 0 . 3
L i n R : 1 E - 6 - 1 E - 2
L D : 8 E - 7
1 0 s /
2 m o n t h s
M P M
N A / 9 . 9 E - 4 /
2 . 4 E - 4 / 5 . 3 E - 5
2 . 0 - 7 . 0
S h a m s
i p u r e
t a
l . ,
2 0 0 2
P V C
T H F
D B P , A P , o -
N P O E , N B
I o n o p h o r e - L
H D A B
O A
S L : - 2 8 . 8 + - 0 . 2
L i n R : 9 E - 6 - 1 E - 1
L D : 7 E - 6
1 0 - 4 5
s /
N A
M P M
N A / 4 . 9 E - 3 /
5 E - 3 / 9 . 9 E - 4
4 . 0
G a n
j a l i e
t a
l . ,
2 0 0 2
P V C
T H F
D B P , B A , A P
o - N P O E , N B
B D P P
H T A B
S L : - 2 8 . 9 + - 0 . 5
L i n R : 1 E - 6 - 1 E - 2
L D : 8 E - 7
1 0 s /
N A
M P M
N A / 5 . 1 E - 3 /
3 . 4 E - 3 / 3 . 4 E - 3
4 . 0 - 9 . 0
M o r i g
i e
t a
l . ,
2 0 0 1
P V C
P D M S
T H F
o - N P O E , D B P
M g / A l - S O 4 H T
N A
S L : - 2 9 . 6 + - 0 . 8
L i n R : 4 E - 5 - 4 E - 2
L D :
N A
< 1 m i n /
N A
M P M
< - 1 . 4 / < - 3
< - 3 / N A
4 . 0 - 7 . 0
F i b b i o l i e t a l . ,
2 0 0 0
P V C
T H F
o - N P O E
Z w i t t e r i o n - 2
K (
T F P B )
H D T O D A B
S L : N A
L i n R : N A
L D : 0 . 1 0
N A
/
1 m o n t h
N A
N A
B e r r o c a l e t a l . ,
2 0 0 0
P V C
T H F
D O S , o - N P O E ,
F P N P E
T r i p o d a l - 2
T D
D M A C l
M E S
T R
I S
S L : - 2 8 . 9
L i n R : 9 E - 6 - 1 E - 1
L D : 3 E - 6
< 4 m i n /
1 w e e k
M P M
N A
/ - 1 . 4 /
4 E - 1 / N A
N A
L i e t a l . ,
1 9 9 9
P V C
o - N P O E , D O P
I m i d a z o l e - P
N a - T P B
D T O A
S L : - 2 8 . 5
L i n R : 4 E - 5 - 4 E - 1
L D : 1 E - 5
2 s /
2 m o n t h s
M P M
7 . 5 E - 4 / 1 . 1 E - 1 /
1 2 6 / 2 . 0 4
3 . 0 6 - 4 . 0 2
N i s h i z a w a e t a l . ,
1 9 9 8
P V C
T H F
C P , o - N P O E ,
F N D P E , D O S ,
D O P
B i s - u r e a - 1
B i s - t h i o u r e a - 2
B i s - t h i o u r e a - 3
b
B i s - u r e a - 4
T D
D M A C l
S L : - 2 8 . 1 + - 1 . 8
L i n R : 9 E - 6 - 1 E - 2
L D : 1 E - 6
3 m i n /
2 8 d a y
s
M P M
- 9 E - 1 / - 1 E - 1 /
1 . 6 / 6 E - 1
6 . 8 - 7 . 0
a C o m m e r c i a l i o n o p h o r e : S e l e c t o p h o r e I I ( S i g m a A l d r i c h ) . D i s c o n t i n u e d p r o d u c t ( 2 0 1 0 - 2 0
1 2 )
c S L = S e n s i b i l i t y
e L D
= L i m i t o f d e t e c t i o n
b C o m m e r c i a l i o n o p h o r e : S e l e c t o p h o r e I ( S i g m a A l d r i c h ) . € 2 4 . 3 0 / 5 0 m g ( P r i c e i n S p a i n - A
p r i l , 2 0 1 3 )
d L i n R
= L i n e a l r a n g e
N A = n o t a v a i l a b l e i n f o r m a t i o n

8/17/2019 see page 29
http://slidepdf.com/reader/full/see-page-29 148/260

8/17/2019 see page 29
http://slidepdf.com/reader/full/see-page-29 149/260
6. Preliminary study on the on-line determination of sulfate
119
6.3 Materials and methods
6.3.1 Reagents and standards
Reagents employed were of analytical grade and were used without
further purification. Epoxy-graphite conducting composite was prepared with
powdered graphite 50 μm of particle size (Merck, Germany), epoxy resin
Araldite® M/5490 (Ciba Geigy, Germany) and hardener resin HR (Ciba
Geigy, Germany). Plasticizer compounds studied, which act as mediating
solvents, were o-nitrophenyl octyl ether (o-NPOE), bis(2-ethylhexyl)
sebacate (DOS), dioctylphthalate (DOP) and 2-nitrodiphenyl ether (NDPE);
all plasticizers were from Fluka brand (Sigma Aldrich, Spain). The polymeric
matrix was prepared with polyvinylchloride of high molecular weight (PVC-
HMW) (Sigma Aldrich, Spain) and homogenized with tetrahydrofuran (THF)
(Sigma Aldrich, Spain). The lipophilic additive employed was
tridodecylmethylammonium chloride (TDDMA Cl) (Sigma Aldrich, Spain).
The ionophore used was the Sulfate-Ionophore I – Selectophore™ (Sigma
Aldrich, Germany). Main ionophore properties are specified in Table 6.2. Bythe time of this study, the selected ionophore was the only commercially
available product, synthetized as described by Buhlmann et al. (1997). The
preparation of other ionophore formulation would require the synthesis of a
different active compound, which was not the aim of this investigation.
All aqueous solutions were prepared with deionized Milli-Q water
(18 MΩ·cm-1). Sulfate standards were daily prepared from a stock standard
Na2SO4 solution (Panreac, Spain) of 1×10⁻¹ mol S-SO42-·L-1 (9,606.3 mg S-
SO42-·L-1) and covered a concentration range from 5×10⁻⁶ to 1×10⁻¹ mol S-
SO42-·L-1 (0.5 to 9,606.3 mg S-SO4
2-·L-1). An organic buffering solution was
prepared from 2-(4,2-hydroxyethyl-1-piperazinyl) ethanesulfonic acid
(HEPES) (Sigma Aldrich, Spain). Adjustment of pH was done with NaOH 1
mol·L-1 (Panreac, Spain) and CH3COOH glacial (Sigma Aldrich, Germany),
as needed. Standards of interfering anions were prepared by covering the
concentration range of each compound found in the real liquid samples

8/17/2019 see page 29
http://slidepdf.com/reader/full/see-page-29 150/260
Aerobic biotrickling filtration for biogas desulfurization
120
from the BTF. Reagents employed for interfering anions standards
preparation were: NaNO3 (Panreac, Spain), NaNO2 (Panreac, Spain) and
NaCl (Quimivita, Spain).
Table 6.2 Properties of Sulfate-Ionophore I – Selectophore™
Product name Sulfate-Ionophore I – Selectophore™
Product number 17892
Brand / Manufacturer Fluka / Sigma Aldrich (Germany)
CAS number 37042-63-0
Ac tive comp ound α,α-bis(N-phenylthioureylene)-m-xylene
Appearance White powder
Formula C22H22N4S2
Molecular weight (g·mol-1
) 406.57
Molecular representation
Technical application *
Assay of SO42- activity with solvent
polymeric membrane electrode
Recommended membrane
composition (% wt) *
Ionophore: 1.0 / TDDMA Cl: 0.7 /
o-NPOE: 65.5 / PVC: 32.8
* Technical application and membrane composition recommended by manufacturer are
in agreement with best results reported by Nishizawa et al. (1998).
6.3.2 Sensing membrane cocktail composit ion
Liquid membrane composition was investigated and optimized, starting
from the best membrane reported by Nishizawa et al. (1998), by the
preparation of eight different sensing cocktail compositions, as detailed in
Table 6.3. All membranes were prepared with Sulfate-Ionophore I –
Selectophore™ as ionophore (Table 6.2). The polymeric matrix composite
was prepared in all cases with PVC-HMW (60 mg) and all components were
dissolved with THF (3 mL).

8/17/2019 see page 29
http://slidepdf.com/reader/full/see-page-29 151/260
6. Preliminary study on the on-line determination of sulfate
121
Table 6.3 Sensing membrane cocktail composition
MembranePlasticizer
(% w)
Ionophorea
(% w)
Lipophilic additiveb
(% mol)
M1
o-NPOE, 66
1.050
M2
100M3 1.0 c
M4 0 100 d
M5
1.0
0
M6 NDPE, 66
100M7 DOS, 66
M8 DOP, 66
a Sulfate-Ionophore I – Selectophore™ (Sigma Aldrich, Germany)
b Lipophilic additive: tridodecylmethylammonium chloride (TDDMA Cl). Quantity
calculated in respect to the ionophore, in molar percentual units.c Same composition for M2 and M3, but M3 was prepared with ionophore from a new
industrial batch. Membranes M3 to M8 were prepared with the same industrial batch.d Lipophilic additive quantity is kept unaltered, referred to an hypothetic 1.0% of
ionophore composition in the membrane.
6.3.3 Sensor response characterization
Electrodes calibration in batch mode was performed by measuring the
response of electrical potential (E) obtained for each sensor when put into
contact with sulfate solutions of increasing concentration. The time between
standards addition varied between 1 and 2 minutes, depending on the
quantity of simultaneously calibrated electrodes. Calibrations with
decreasing concentration standards were also performed in order to verify
the stability of the electrode and the recovery of the analytical signal under
the possible effect of the membrane saturation. Electrodes calibration in
flow mode, applying a FIA system, was performed by the temporized
injection of each standard in triplicate, with a sample throughput of 40 h -1.
Calibrations were executed with freshly prepared 24 standard-points of
precisely calculated SO42- concentration. The characterization of the

8/17/2019 see page 29
http://slidepdf.com/reader/full/see-page-29 152/260
Aerobic biotrickling filtration for biogas desulfurization
122
analytical response of the constructed electrodes was performed by direct
potentiometry, as described in Section 4.6. Instruments specification is
presented in Section 4.7. Electrodes were constructed according the
procedure described in Figure 4.8 (tubular electrodes for FIA system) and
Figure 4.9 (conventional electrodes for batch mode operation).
Moreover, the effect of different operational conditions over the
electrodes response was investigated. Electrodes response in front of the
operating pH was studied in a pH range from 3.5 to 9.5, by the addition of
controlled amounts of saturated NaOH solution (Panreac, Spain) to a
sample solution with initial pH value of 3.5, previously adjusted by the
addition of acetic acid glacial (Panreac, Spain). Also, the concentration of
the buffer solution (HEPES + NaOH) was tested, as well as the
concentration of SO42- background in the buffer solution. Finally, the effect
of the cleaning procedure of the electrodes between calibrations was
studied by testing distilled water and BaCl2 (1×10⁻³ mol·L-1) (Panreac,
Spain) as cleaning solutions.
6.3.4 Study of interferences
Real liquid samples from the studied BTF were taken during neutral and
acidic pH operation (Chapter 7, Chapter 8 and Chapter 9) at the purge line
of the system and SO42- and S2O3
2- were analyzed by IC, under the
conditions specified in Section 4.7.2. Main interfering anions, according to
the selectivity potentiometric coefficients (Kpot) reported by Nishizawa et al.
(1998) and, correspondingly, with the anionic species found in the liquid
phase of the BTF were: nitrate (NO3-), nitrite (NO2
-), chloride (Cl-) and
dihydrogen-phosphate (H2PO4-). The calculation of Kpot for each interfering
anion was performed applying the matched potential method (MPM), as
defined in Section 4.6. This methodology was considered as the most
appropriate, because represents the actual dynamic encountered in the
liquid phase of the BTF, in which interfering anions are normally present at
a pseudo-constant value, while SO42- concentration is markedly variable,

8/17/2019 see page 29
http://slidepdf.com/reader/full/see-page-29 153/260
6. Preliminary study on the on-line determination of sulfate
123
depending on the operational conditions of the system. Also, for the
investigation of the effect of interfering ions whit different electrical charge,
the MPM method is widely accepted since first presented by Gadzekpo and
Christian (1984) and recommended by Umezawa et al. (1995). Moreover, a
preliminary investigation on the potential interfering effect of the anions
present in the studied BTF was performed applying a FIA system, for the
ionic composition normally found under neutral pH. For this purpose, a FIA
system with potentiometric detection was optimized. Also, the interference
study in batch mode was conducted for the ionic composition normally
found in the BTF liquid phase, but in this case under acidic pH operation.
6.4 Results and discussion
6.4.1 Membrane composition opt imization
The obtained effects of the membrane composition formulation
(according to Table 6.3) over electrodes response are shown in Table 6.4.
A qualitative evaluation of electrodes response was performed, in terms of
SL and LD, after a series of systematic calibration procedures.
Table 6.4 Sensing membrane optimization results
Membrane Studied condi tionEffect over electrode
response
M1 Initial composition Reference formulation *
M2 > Lipophilic additive
M3 Ionophore industrial batch
M4 Absence of ionophore
M5 Absence of lipophilic additive
M6 Plasticizer: NDPE
M7 Plasticizer: DOS
M8 Plasticizer: DOP
* According to Nishizawa et al., 1998
: Positive effect / : Irrelevant effect / : Negative effect

8/17/2019 see page 29
http://slidepdf.com/reader/full/see-page-29 154/260
Aerobic biotrickling filtration for biogas desulfurization
124
The best membrane composition corresponded to the formulation of
membrane M2, which represented an increment on the quantity of the
lipophilic additive applied up to 100% molar referred to the ionophore.
Obtained SL and LD evolution over the time for consecutive calibration of 6
electrodes of M1 and 6 electrodes of M2 are shown in Figure 6.1.
Figure 6.1 SL and LD evolution for (a) membrane M1 and (b) membrane M2, withn=24 points for each electrode calibration curve. Dashed line indicates theoreticalsensitivity for divalent anions (SL = -29.6 mV·dec-1)
Consecutive calibration (n=24)
0 20 40 60 80 100
S L
( m V ·
d e c - 1 )
-40
-35
-30
-25
-20
-15
-10
-5
L D ( m
o l S - S O 4
2 - · L - 1 )
0.0000
0.0002
0.0004
0.0006
0.0008
SL (membrane M2)
LD (membrane M2)
Theoretical SL
Consecutive calibration (n=24)
0 20 40 60 80 100
S L ( m V ·
d e c - 1 )
-40
-35
-30
-25
-20
-15
-10
-5
L D
( m o l S - S O 4
2 -
·
L
- 1 )
0.0000
0.0002
0.0004
0.0006
0.0008
SL (membrane M1)
LD (membrane M1)
Theoretical SL
a
b

8/17/2019 see page 29
http://slidepdf.com/reader/full/see-page-29 155/260
6. Preliminary study on the on-line determination of sulfate
125
Calibrations in batch mode were performed with buffer HEPES, with pH
adjusted to 6.99 with NaOH (1.0 mol·L-1). Time between standards injection
was 1 minute. Before the first use and after each cleaning procedure,
electrodes were conditioned in a HEPES solution (1×10⁻¹ mol·L-1) doped
with SO42- background concentration of 1.0×10⁻⁶ mol S-SO4
2-·L-1 (1×10⁻¹ mg
S-SO42-·L-1). Electrodes were cleaned by washing with distilled water for 15
minutes with magnetic stirring after each calibration, in order to minimize
the memory effect between successive calibration processes. Results
obtained after consecutive calibrations (n>100) of six different electrodes
prepared with membrane M2, with 24 points each calibration, indicated that
electrodes presented a sub-Nernstian behavior, with an SL average value
for M2 of -22.8 3.5 mV·dec-1 and LD average of 5.4×10⁻⁵ 0.6×10⁻⁵ mol
S-SO42-·L-1 (5.2 0.6 mg S-SO4
2-·L-1). Experimental data were adjusted
according to Equation 30 to obtain the calibration curve and the analytical
response parameters. A cyclic-type behavior can be delineated, more
clearly for M2, in correspondence with cleaning and conditioning
procedures; it appeared to represent a lost in sensitivity, resulting in
decreasing values up to the next cleaning and conditioning procedure
(approximately each 12 to 16 consecutive calibration), after which SL
recovered initial values closer to the theoretical sensitivity (-29.6 mV·dec-1).
Interestingly, the behavior of the LD presented the opposite tendency,
rising after cleaning and conditioning procedures. However, results were not
conclusive and no direct relations can be stated regarding to this particular
behavior. The response time of the electrodes was found at 20-30 s for
calibrations of increasing SO42- concentration. For decreasing SO42-
concentration calibrations, the response time was found at 50-60 s, a higher
value, as expected for the memory effect of higher analyte concentrations
(Vlasov et al., 2010), but still lower than the reported response time by
Nishizawa et al. (1998) (3 minutes). The lifetime of prepared membranes
was around 1 – 2 months. Both response time and lifetime were found at
normal range for this kind of electrodes, as verified in Table 6.1. Moreover,
the markedly negative effect obtained by the absence of lipophilic additive(M5) corroborated the necessity of this kind of compound for hydrophilic

8/17/2019 see page 29
http://slidepdf.com/reader/full/see-page-29 156/260
Aerobic biotrickling filtration for biogas desulfurization
126
anions such as SO42-, positioned at the end of the Hofmeister’s affinity
series (Wojciechowski et al., 2010), as commented in Section 2.4.3. The
effect of the nature of the plasticizer was found of a less extent, even when
the best results were clearly obtained for o-NPOE, in accordance with most
of the reported ISEs for SO42- sensing (Table 6.1).
6.4.2 Effect of operational conditions
The effect of the operational pH was tested for the best membrane
composition (M2) over a range from 3.50 < pH < 9.50, in both ascending
and descending modes. In this range, the response of the electrodes, interms of electrical potential, was constant for a fixed SO4
2- concentration in
front of the pH variation. The pH was adjusted with CH3COOH or NaOH
solutions, as required, by the controlled addition directly on the buffer
solution, with SO42- concentration of 1.0×10⁻⁴ to
1.0×10⁻² mol S-SO42-·L-1
(9.6 to 960.6 mg S-SO42-·L-1), in which electrodes were submersed. The
study of the electrodes response was performed for n=16 to n=42 points,
with 1 minute between acid or base solutions addition. Overall resultsindicated that the optimum pH range was 4.50 < pH < 7.50. Contrary to the
behavior described by Nishizawa et al. (1998) for the same active
ionophore, electrodes presented a slight loss in sensitivity when operating
at pH close to neutrality, and a discreet improvement when acidic pH was
investigated, with the optimal value around pH = 5.00.
The effect of the buffer solution (HEPES) concentration was tested for
1.0×10⁻¹ mol·L-1 (as recommended by Nishizawa et al., 1998) and 1.0×10⁻²
mol·L-1. However, no significant differences were obtained over the
electrodes performance in terms of SL and LD. Also, the effect of SO42-
background concentration in the buffer solution was investigated at 1×10⁻⁶
and 2.5×10⁻⁶ mol S-SO42-·L-1 (0.1 and 0.24 mg S-SO4
2-·L-1). As expected,
results indicated that the analyte background concentration in the buffer
solution helped obtaining a lower response time. For further experiments,
the background concentration was kept at 1×10⁻⁶ mol S-SO42-·L-1 (0.1 mg

8/17/2019 see page 29
http://slidepdf.com/reader/full/see-page-29 157/260
6. Preliminary study on the on-line determination of sulfate
127
S-SO42-·L-1), which allowed obtaining lower values of LD. Finally, the effect
of the cleaning procedure was tested by comparing the sensitivity obtained
by the electrodes after a series of cleaning events conducted with distilled
water and with BaCl2 (1.0×10⁻³ mol·L-1). The cleaning time was kept
unaltered in 15 minutes, with continuous magnetic stirring. Calibrations for
cleaning procedure evaluation were performed with n=16 points. Overall
sensitivity results were not conclusive regarding the cleaning solution
applied; however, electrodes submitted to BaCl2-washing presented earlier
signs of membrane deterioration, which represents an important drawback
when facing real analytical applications, because of the reduction of the
electrodes lifetime.
6.4.3 Sensor response to interferences
The effect of interfering anions over the electrodes response was
preliminarily studied applying a FIA system. This configuration was selected
in order to facilitate the experiments execution and to obtain an initial
selectivity indication in a reliable, fast procedure. Previously to theinterferences study, the proposed FIA system was optimized for this
application. The carrier composition used was HEPES (1×10⁻² mol·L-1) with
background concentration of 1.0×10⁻⁶ mol S-SO42-·L-1 (0.1 mg S-SO4
2-·L-1).
The sample injection volume was evaluated between 50 to 250 μL and the
carrier flow rate within a range of 0.5 to 2.5 ml·min-1.
Results of the optimization of injection volume and carrier flow rate are
presented in Figure 6.2. The increase on the injection volume produced an
rise on the analytical signal until reaching a maximum value. The increase
of the carrier flow rate resulted in an improvement of the analytical signal
and the frequency of analysis, while the decrease of the flow rate caused a
reduction of the analytical signal, due to the greater dispersion. Optimal
values obtained were 100 μL for the sample injection volume and 1.0
mL·min-1 for the carrier flow rate, respectively. These conditions ensured
both an adequate analytical signal and an optimal analytical frequency.
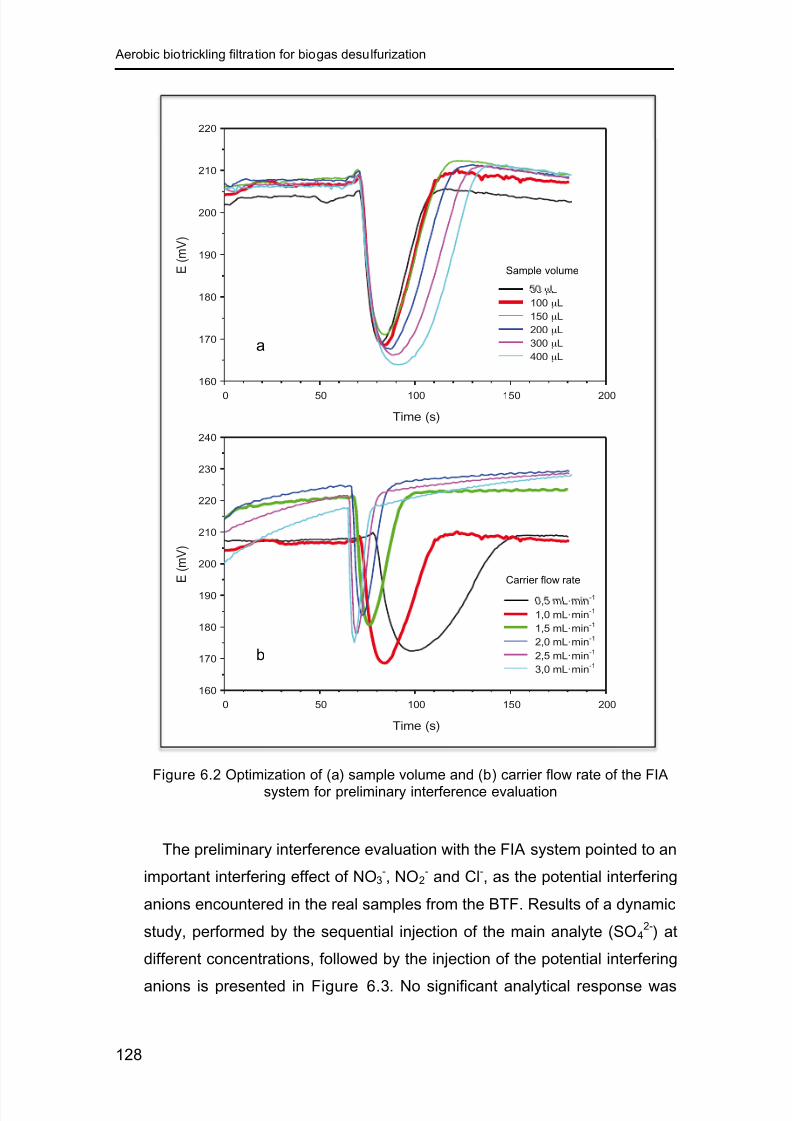
8/17/2019 see page 29
http://slidepdf.com/reader/full/see-page-29 158/260
Aerobic biotrickling filtration for biogas desulfurization
128
Figure 6.2 Optimization of (a) sample volume and (b) carrier flow rate of the FIAsystem for preliminary interference evaluation
The preliminary interference evaluation with the FIA system pointed to an
important interfering effect of NO3-, NO2
- and Cl-, as the potential interfering
anions encountered in the real samples from the BTF. Results of a dynamic
study, performed by the sequential injection of the main analyte (SO42-) at
different concentrations, followed by the injection of the potential interfering
anions is presented in Figure 6.3. No significant analytical response was
Time (s)
0 50 100 150 200
E ( m V )
160
170
180
190
200
210
220
230
240
0,5 mL·min-1
1,0 mL·min-1
1,5 mL·min-1
2,0 mL·min-1
2,5 mL·min-1
3,0 mL·min-1
Time (s)
0 50 100 150 200
E ( m V )
160
170
180
190
200
210
220
50 μL
100 μL
150 μL
200 μL
300 μL
400 μLa
b
Sample volume
-
Carrier flow rate

8/17/2019 see page 29
http://slidepdf.com/reader/full/see-page-29 159/260
6. Preliminary study on the on-line determination of sulfate
129
obtained by the injection of HEPES and bicarbonate. However, a markedly
strong response to NO3- and Cl- suggested that electrodes selectivity should
be further investigated for both anions in order to evaluate the feasibility of
the constructed electrodes for real analytical applications. The interfering
effect of NO2- was not further investigated because the concentration of this
compound was negligible in comparison with the others interfering anions in
the liquid phase of the BTF.
Figure 6.3 Preliminary verification of interfering anions with a FIA system,evaluated at optimal operational conditions
The calculation of the potentiometric selectivity coefficients (Kpot) was
performed according to Equation 33, following the methodology described
by Umezawa et al. (1995). Results are presented in Table 6.5, with the
expression of the common logarithm of Kpot [log(Kpot)] for analysis
simplification. The theoretical selectivity coefficients reported by Nishizawa
et al. (1998) are also presented. Interferences were studied for a fixed
interfering ion concentration and variable SO42-
concentration, covering a
concentration range from 5.0×10⁻⁵ to 1.0×10⁻¹ mol S-SO42-·L-1 (4.8 to
Time (s)
0 200 400 600 800 1000 1200 1400 1600 1800
E ( m V )
0
20
40
60
80
100
120
140
160
180
200
SO4
2-
(1E-3 M)
SO4
2- (1E-2 M)
HEPES(1E-1 M) HCO3
-
(1E-2 M)
Cl- (1E-2 M)
NO2
- (1E-2 M)
NO3
- (1E-2 M)
SO4
2- (5E-3 M)
Time (s)
0 200 400 600 800 1000 1200 1400 1600 1800
E ( m V )
0
20
40
60
80
00
120
40
60
80
200
SO4
2-
(1E-3 M)
SO4
2-(1E-2 M)
HEPES(1E-1 M) HCO3
-
(1E-2 M)
Cl- (1E-2 M)
NO2
- (1E-2 M)
NO3
-(1E-2 M)
SO4
2- (5E-3 M)

8/17/2019 see page 29
http://slidepdf.com/reader/full/see-page-29 160/260
Aerobic biotrickling filtration for biogas desulfurization
130
9,606.3 mg S-SO42-·L-1), as defined by the MPM calculation method. The
interferences study during this work was performed by serial 12 calibrations
for each condition, with n=7 points for the FIA system and n=24 points for
the batch mode system, using HEPES (1×10⁻² mol·L-1) as carrier/buffer
solution with pH adjusted to 7.08. Nitrate interference was investigated at
concentrations normally found during BTF operation, specifically at 4.0×10⁻⁴
and 8.0×10⁻⁴ mol N-NO3-·L-1 (24.8 and 49.6 mg N-NO3
-·L-1), as encountered
under neutral pH operation and at 8.0×10⁻⁵ mol N-NO3-·L-1 (5.0 mg
N-NO3-·L-1), as found under acidic pH operation. As chloride concentration
remained stable during both pH conditions, Cl- was otherwise investigated
at 1.0×10⁻² and 1.7×10⁻² mol Cl-Cl-·L-1 (354.3 and 602.7 mg Cl-Cl-·L-1),
representing the lower and higher concentration during total BTF operation.
Table 6.5 Interference study in flow and batch modes (n=12)
Interfering
anion
Interference
concentration
(mol·L-1
)
log(Kpot)
(this study)
log(Kpot)
(Nishizawa et al.,
1998)
Nitrate
4.0×10⁻⁴(FIA) 3.3 0.2
1.68.0×10-4(FIA) 3.9 0.4
8.0×10⁻⁵(batch) 5.9 0.3
Chloride
1.0×10⁻²(batch) 1.4 0.1
0.11.7×10-2
(batch) 1.4 0.2
Since the calculation of the selectivity coefficients depends in a great
extent on the operational conditions applied during its determination, results
obtained in the work presented in this Chapter are not directly comparable
to those reported by Nishizawa et al. (1998). The interfering effect of NO3-
was proportional to the concentration evaluated with the FIA system, while
a significant increment in the selectivity for nitrate was observed during the
study performed in batch mode, at neutral pH, probably because of the
membrane saturation commonly found in batch systems. Surprisingly, the
obtained values of logKpot for chloride as interfering ion showed to be
independent to the ion concentration. In general, the poor selectivity results

8/17/2019 see page 29
http://slidepdf.com/reader/full/see-page-29 161/260
6. Preliminary study on the on-line determination of sulfate
131
obtained for the determination of SO42- in the presence of interfering anions
was considered as a limiting condition for the utilization of the constructed
electrodes in real systems. Further investigation is required in other to
elucidate the origin of the obtained results, which are not in agreement with
the reported performance for the same active ionophore (Nishizawa et al.,
1998). Likewise, the application of polymeric matrix ISEs for the direct
determination of SO42-, as investigated during this work, is not
recommended because of the significant unfavorable effect of interferences.
Research recommendations are given in Chapter 10 in order to overcome
the main difficulties faced during this study.
6.5 Conclusions
The proposed analytical system for sulfate determination, based on an
ISE of polymeric liquid membrane was found not applicable for real
monitoring tasks, since the high level of interfering anions encountered in
the liquid phase of the studied BTF resulted in low selectivity for SO42-. In
general, constructed electrodes were characterized by direct potentiometryin both batch and flow systems. Electrodes shown a sub-Nernstian
behavior, with sensitivity lower than -29.5 mV·dec-1. The best sensitivity
obtained in all studied cases was -27.70 mV·dec-1, with an average value
around -23 mV·dec-1
. The linear range and limit of detection were found at
normal values for this kind of analytical systems. On the other hand,
electrodes response indicated that the studied analytical system could be
suitable for on-line monitoring of processes without interferences.
Regarding to the composition of the liquid sensing cocktail, the use of
lipophilic additives was proven to be essential for the correct functioning of
the electrode. The presence of lipophilic additives in the composition of the
membrane turns out to be indispensable for neutral ionophores, allowing
the exchange of ions throughout the membrane. Also, the presence of the
active ionophore was found crucial for the electrode response. The nature
of the plasticizer compound was considered as less influencing in the

8/17/2019 see page 29
http://slidepdf.com/reader/full/see-page-29 162/260
Aerobic biotrickling filtration for biogas desulfurization
132
overall analytical response, even when best results were obtained for o-
NPOE, a commonly used plasticizing compound. The best membrane
composition was found for 1% (wt) of ionophore, 66% (wt) of plasticizer and
100% (molar) of lipophilic additive, a formulation slightly different from the
reported results for the same commercially available ionophore. For
overcoming the limitations encountered during this word, further
investigation is suggested on the development of a microanalyzer based on
low temperature cofired ceramics (LTCC) device and non-potentiometric
detection strategy.

8/17/2019 see page 29
http://slidepdf.com/reader/full/see-page-29 163/260
7neutral H2S biotrickling fil tration
and transit ion to acidic pH

8/17/2019 see page 29
http://slidepdf.com/reader/full/see-page-29 164/260
Aerobic biotrickling filtration for biogas desulfurization
134
I agree with no one s opinion.
I have some of my own.
I v an S T u r genev
Oryol, 1818 Bougival, 1883

8/17/2019 see page 29
http://slidepdf.com/reader/full/see-page-29 165/260
135
7 Neutral H2S biotr ickling filtration and transition to acidic pH
7.1 Summary and scope
A research conducted previously at the Gas Research Group (UAB) by
Dr. Marc Fortuny resulted in the construction of the initial configuration of
the BTF system herein studied. During that operation, neutral pH was
maintained and a structured plastic packing material was used. Before of
the long-term operation reported in this thesis, a refurbishment was
performed in the BTF in collaboration with Dr. Roger Rovira, for improving
biomass sampling procedures and for the integration of the H2S/TDS flow
analyzer described in Chapter 5. The selection of the new random packing
material, the decision of performing the transition to acidic pH and operating
under acidic pH conditions (Chapter 9) were done at comparable
circumstances as in the case of a real-scale biotrickling filter (Rodriguez et
al., 2012; 2013).
In comparison with previous studies with PU foam and a plastic
structured packing material obtained by others (Fortuny et al., 2008; 2010),
the studied random packing material showed similar performance results, in
terms of H2S removal capacity under reference conditions, indicating that
under both neutral (6.0 to 6.50) and acidic (2.50 to 2.75) pH conditions, the
studied BTF is able to treat synthetic biogas containing 2,000 ppmv of H2S
(51.48 g S-H2S·m
-3
·h
-1
), with RE values above 99% at EBRT of 131 s.However, the study of the EC under performed experiments revealed
values slightly lower of critical EC (100 g S-H2S·m-3·h-1) and maximum EC
(135 g S-H2S·m-3·h-1), when compared with previous studies at similar
conditions. In spite of no significant differences being found in terms of H2S
removal performance, a persistent accumulation of elemental sulfur was
verified (8.49% of the total oxidized sulfide) during acidic pH operation.
8/17/2019 see page 29
http://slidepdf.com/reader/full/see-page-29 166/260
Aerobic biotrickling filtration for biogas desulfurization
136
The aim of the work presented in this Chapter was to study the effect of
the used random packing material in a BTF during the desulfurization of
high H2S-loaded biogas. Start-up period and operational optimization were
studied at neutral pH. Controlled and gradual transition to acidic pH was
performed, fulfilling a total uninterrupted 600-days operation period. During
the optimization period, operational parameters such as aeration rate, TLV
and HRT were optimized, in order to minimize the production of elemental
sulfur. During the neutral steady-state operation, the performance of the
reactor was studied as a function of the gas contact time. During the pH
transition period and during the operation at acid pH (until day 600 of
operation), the reactor performance was assessed in terms of elemental
sulfur production. Moreover, the effect of the simultaneous removal of
methylmercaptan and H2S was investigated during the neutral pH steady-
state operation, as reported in Chapter 8. Also, on-line and off-line samples
from the studied BTF were employed for sensing and monitoring studies,
according to results presented in Chapter 5 and Chapter 6, for H2S/TDS
and sulfate, respectively. Results obtained at acidic pH condition until the
end of the operation (990 days) are reported later in Chapter 9.
A modified version of this chapter has been submitted for publication as:
Montebello AM, Bezerra T, Rovira R, Rago L, Lafuente J, Gamisans X, Campoy S,
Baeza M, Gabriel D (2013). Operational aspects, pH transition and microbial
shifts of a H2S desulfurizing biotrickling filter with random packing material.Chemosphere.

8/17/2019 see page 29
http://slidepdf.com/reader/full/see-page-29 167/260
7. Neutral H2S biotrickling filtration and transition to acidic pH
137
7.2 Introduct ion
The use of structured packing material has been previously proven to be
effective in the desulfurization of high loads of H2S (Fortuny et al., 2008;
Montebello et al., 2010; Fortuny et al., 2011). Maximum ECs of 210 – 280 g
S-H2S·m-3·h-1, with a RE of 80 – 90% were encountered for PU foam and
HD-QPac, a structured plastic packing material in Fortuny et al. (2008),
treating H2S concentrations up to 12,000 ppmv of H2S. Air was directly
supplied to the biogas flow in both reported operations with the different
packing material (PU and HD-QPac). Maximum ECs of 201 g S-H2S·m-3
·h-1
at a RE of around 90% was found by Montebello et al. (2010), treating H2Sconcentrations up to 8,000 ppmv of H2S, with the same structured packing
material previously studied by Fortuny et al. (2008). In this case (Montebello
et al., 2010), air was supplied both to the biogas flow and to the liquid phase
through an auxiliary aeration unit. Moreover, mass transfer limitations are
commonly reported during the treatment of high loads of H2S caused by
reduced gas contact times (Dorado et al., 2009). Also with the same
structured packing material and with the same aeration system as reportedby Montebello et al. (2010), maximum ECs of 130 – 145 g S-H2S·m
-3·h
-1
were found by Fortuny et al. (2011) by decreasing the gas contact time
down to 30 seconds.
Although random packing material is frequently used in industrial
applications involving packed bed towers, some problems has been
reported in industrial scale, by the excessive accumulation of elemental
sulfur (Tomas et al., 2009). Even so, the use of random packing material in
this kind of reactors is recommended for maintenance activities, since the
reposition of a portion of the packed bed can be easily performed with
random packing material, during a quick, non-disturbing procedure that
must not affect the overall performance of the system. Contrarily, when
structured rigid elements are applied, the complete stop-operation of the
reactor is required and the replacement of packing material elements
requires a time consuming actuation.

8/17/2019 see page 29
http://slidepdf.com/reader/full/see-page-29 168/260
Aerobic biotrickling filtration for biogas desulfurization
138
7.3 Materials and methods
7.3.1 Inoculation and operational conditions
Aerobic sludge from a local municipal wastewater treatment plant
(Manresa, Barcelona) was used for the unspecific inoculation of the reactor.
Fresh sludge was diluted 1:1 with mineral medium, thus having a final
volatile suspended solids concentration of 2.4 g·L-1. The inoculum was
recirculated along the packing material for 24 hours without gas feeding or
liquid renewing. Next, the inlet H2S concentration was set to 1,500 ppmv of
H2S (38 g S-H2S·m
-3
·h
-1
) during 20 hours and was adjusted after that to2,000 ppmv of H2S (51.48 g S-H2S·m-3
·h-1) as the reference value. The pH
control was set at the original inoculum pH value (6.0 – 6.5). During start-up
period, the flow air supplied ensured an O2/H2S ratio of 23.60 (v·v-1), which
is the optimal value found by Fortuny et al., (2010) for the complete
oxidation of H2S to sulfate, in the same experimental setup but with a
structured packing material. Also, the HRT was kept at 70 ± 7 h and the
TLV was of 3.8 m·
h
-1
(255 mL·
min
-1
).
Three main operational periods are differenced:
I. Start-up and optimization (from day 1 to 140),
II. Steady neutral pH operation (from day 140 to 440) and
III. Acidic pH transition and operation (from day 440 to 600).
Start-up period, covering the first 15 to 21 operation days is followed by a
4-months-period of operational optimization which refers to the adjustment
of some operation parameters, in order to minimize the accumulation of
extra-cellular elemental sulfur, improving this way the results of biomass
sampling and processing for biological characterization. Optimization period
extends up to day 140 of operation. The supplied O2/H2S ratio was tested at
the following values (v·v-1): 23.60; 29.50 and 49.17, with the strategy
showed in Table 7.1, concomitantly with the adjustment of the TLV and
HRT values.
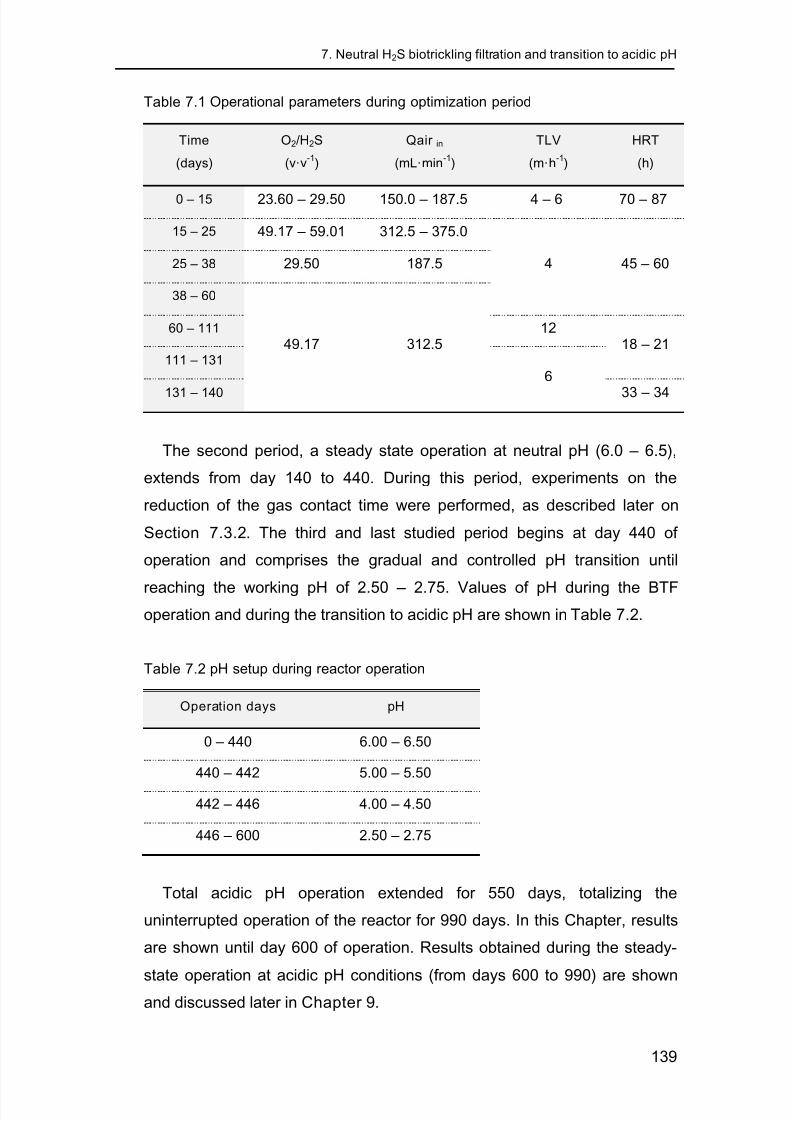
8/17/2019 see page 29
http://slidepdf.com/reader/full/see-page-29 169/260
7. Neutral H2S biotrickling filtration and transition to acidic pH
139
Table 7.1 Operational parameters during optimization period
Time
(days)
O2/H2S
(v·v-1
)
Qair in
(mL·min-1
)
TLV
(m·h-1
)
HRT
(h)
0 – 15 23.60 – 29.50 150.0 – 187.5 4 – 6 70 – 87
15 – 25 49.17 – 59.01 312.5 – 375.0
4 45 – 6025 – 38 29.50 187.5
38 – 60
49.17 312.560 – 111 12
18 – 21111 – 131
6
131 – 140 33 – 34
The second period, a steady state operation at neutral pH (6.0 – 6.5),
extends from day 140 to 440. During this period, experiments on the
reduction of the gas contact time were performed, as described later on
Section 7.3.2. The third and last studied period begins at day 440 of
operation and comprises the gradual and controlled pH transition until
reaching the working pH of 2.50 – 2.75. Values of pH during the BTF
operation and during the transition to acidic pH are shown in Table 7.2.
Table 7.2 pH setup during reactor operation
Operation days pH
0 – 440 6.00 – 6.50
440 – 442 5.00 – 5.50
442 – 446 4.00 – 4.50
446 – 600 2.50 – 2.75
Total acidic pH operation extended for 550 days, totalizing the
uninterrupted operation of the reactor for 990 days. In this Chapter, results
are shown until day 600 of operation. Results obtained during the steady-
state operation at acidic pH conditions (from days 600 to 990) are shownand discussed later in Chapter 9.

8/17/2019 see page 29
http://slidepdf.com/reader/full/see-page-29 170/260
Aerobic biotrickling filtration for biogas desulfurization
140
7.3.2 Experimental conditions
During the steady neutral pH operation period, after 430 days of neutral
pH operation, two experiments were performed to investigate the effect of
the gas contact time reduction on the performance of the reactor, at
constant and at variable increasing LR of H2S. Detailed experimental
conditions adopted during experiments E1 and E2 are given in Table 7.3.
The duration of each EBRT value step was of 1.5 h in both experiments.
Table 7.3 Experimental conditions at neutral pH
Experiment [H2S]biogas (ppmv)
H2S LR(gS·m
-3·h
-1)
O2/H2S(v·v
-1)
EBRT(s)
E1
2,002.59
51.48 39.49
131
1,002.30 76
666.49 53
501.40 41
342.51 29
E22,002.65
± 0.29
51.48 39.49 131
102.98 19.74 76
154.92 13.12 53
203.95 9.97 42
301.12 8.44 29
Firstly, during experiment E1, the EBRT was stepwise decreased from
the reference operation value of 131 s until a minimum value of 29 s,
keeping constant the load of H2S entering the BTF (51.48 g S-H2S·m-3·h-1).
Finally, during experiment E2, the EBRT was also stepwise decreased, at
identical hydraulic conditions as for E1 experiment, but at increasing H2S
inlet load, as a consequence of keeping constant the H2S concentration of
the synthetic biogas (around 2,000 ppmv of H2S). As the air inlet flow to the
aeration unit was kept constant during experiments (250 mL·min-1
), except
for the last step in experiment E2 (312.50 mL·min-1), the ratio O2/H2S (v·v-1)

8/17/2019 see page 29
http://slidepdf.com/reader/full/see-page-29 171/260
7. Neutral H2S biotrickling filtration and transition to acidic pH
141
entering the reactor was kept constant during experiment E1 at 39.49 while
decreases from 39.49 to 8.44 at the end of experiment E2. During
experiments, a TLV of 7 m·h-1 and a HRT of 9 h were maintained, in order
to assure the representativeness of liquid phase samples in front of the
short time experimental changes performed. Liquid and gas samples were
analysed at the end of each experimental change to assess the EC and the
RE, as well as the sulfur mass balance.
7.4 Results and discussion
7.4.1 Start-up and operational optimization
After the inoculation of the reactor, the H2S inlet concentration was
established at 1,500 ppmv of H2S. Rapidly, within one hour of operation,
H2S was already detected in the outlet gas stream from the biofilter. This
illustrates the low sorption capacity of the system, even working at
controlled pH between 6.0 – 6.5. The RE evolution during the start-up
period is shown in Figure 7.1.
Figure 7.1 RE evolution during the start-up period
Time (days)
0 1 2 3 4 5 6 7 8 9 10 11 12 13 14 15
R E ( % )
0
10
20
30
40
50
60
70
80
90
100
[ H 2
S ] ( p p m
v )
0
200
400
600
800
1000
1200
1400
1600
1800
2000
RE
[H2S]in
[H2S]out
Time days
0 1 2 3 4 5 6 7 8 9 10 11 2 13 14 15
E
%
0
10
20
30
40
50
60
70
80
90
00
p p m
v
0
200
400
600
800
000
1200
1400
600
1800
000
RE
[H S]in
[H S]out

8/17/2019 see page 29
http://slidepdf.com/reader/full/see-page-29 172/260
Aerobic biotrickling filtration for biogas desulfurization
142
Even at the beginning of the operation, incipient biological activity
coupled to absorption of H2S into fresh mineral medium and NaHCO3
solution allowed obtaining RE values of 20 – 40% during the first day of
operation. Subsequently, the H2S inlet concentration was rose to 2,000
ppmv of H2S and, after 50 hours of operation, RE values higher than 90%
were achieved (Figure 7.1), resulting in an apparent fast start-up of the
system. However from the third day of operation, H2S outlet concentration
increased up to 400 ppmv of H2S, denoting a longer start-up phase in
comparison with previous operations (Fortuny et al., 2008; 2011).
The RE fluctuations and system instability during start-up period are
usual in this kind of bioprocess (Gabriel and Deshusses, 2003b), basically
due to the lack of stable microbial populations in the bioreactor. Also, the
increase in the aeration ratio performed on day 4, as showed in detail in
Figure 7.2 and discussed later on, not only did not result in the expected
diminution of the produced S0 but instead resulted in the observed lost of
performance, probably because of a negative effect produced by the extra
stripping phenomena when the microbial activity was not yet stable. In spite
of the RE oscillation during this period, the BTF performance evolved until
the sixth day of operation achieving a RE value higher than 95%. The
significance of the consolidation of the microbial community can be inferred
by the performance stability observed on day 12 and following, when once
again the aeration ratio was increased, but not negative effect related to a
stripping increment was observed. The developed set of operational
parameters optimization is shown in detail in Figure 7.2, along with the
accumulative mass balance of sulfur species calculated from the oxidation
of H2S (Janssen et al., 1997).
Starting with the BTF inoculation and during the first 4 days of operation,
TDS was on-line monitored in the BTF liquid recirculation phase by the
FIA/GD-CFA configuration system described in Chapter 5 (Montebello et
al., 2010) under continuous operation, to assess the performance of the
BTF during the start-up period.

8/17/2019 see page 29
http://slidepdf.com/reader/full/see-page-29 173/260
7. Neutral H2S biotrickling filtration and transition to acidic pH
143
Figure 7.2 Sulfur mass balance during optimization period. Vertical dashed linesindicate operational changes
TDS monitoring data demonstrated a slight accumulation of TDS in the
liquid phase during the first 40 hours of operation, when values of TDS were
close to the limit of detection of the analyzer (1.5×10⁻⁵
± 0.9×10⁻⁵
mol S-S2-
;
0.48 ± 0.29 mg S-S2-·L-1). From that point on, no TDS accumulation was
detected. Thereafter ORP values monitored ranged from -90 mV to 100 mV,
being these values relatable to sulfate production situations, without sulfur
accumulation in the liquid phase (Fortuny et al., 2011) at neutral pH.
Despite achieving a RE of H2S above 95% in less than a week, a
significant production of S0 was promptly observed, easily noticeable along
the reactor bed. The S0 production rate (pS-S0) was calculated according to
Equation 22. During the first 4 days of operation, the calculated pS-S0 was
40.4 g S-S0·m-3
·h-1, totalizing 7.76 g of biologically produced elemental
sulfur (biosulfur), which corresponded to approximately 77% of the total
removed sulfur. In order to minimize the S0 production and to lead the
operation to the complete oxidation to SO4
2-
, a set of actions based on theexperimentation of the load of oxygen (LO2) supplied to the system was
Time (days)
0 20 40 60 80 100 120 140
S u l f u r ( g )
0
200
400
600
800
1000
1200
1400
S-H2Sremoved
(cumulative)
S-SO42-
produced
(cumulative)
S-S0
produced
(cumulative)
T L V : 4 m h
- 1
O 2 / H 2 S : 2 3 . 6 - 2 9 . 5
T L V : 4 m ∑ h - 1
O 2 / H 2 S : 4 9 . 2
T L V : 4 m ∑ h - 1
O 2 / H 2 S : 2 9 . 5
T L V : 4 m ∑ h - 1
O 2 / H 2 S : 4 9 . 2
T L V : 1 1 . 7 m ∑ h - 1
O 2 / H 2 S : 4 9 . 2
T L V : 6 m ∑ h - 1
O 2 / H 2 S : 4 9 . 2
a)
Time (days)
4 1 1 14
u l u r g
400
00
00
1000
1200
140
S-H2Sremoved
(cumulative)
S-SO4-
produced (cumulative)
- 0
produced
(cumulative)
T L V : 4 m
- 1
O 2 /
2 S : 2 3 . 6 - 2 9 . 5
T L V : 4 m
- 1
O 2 / H 2 S : 4 9 . 2
T L V : 4 m ∑
- 1
O 2 / H 2 S : 2 9 . 5
T L V : 4 m
- 1
O 2 / H 2 S : 4 9 . 2
T L V : 1 1 . 7 m
- 1
2 /
2 S : 4 9 . 2
T L V : 6 m
- 1
2 /
2 S : 4 9 . 2
a)

8/17/2019 see page 29
http://slidepdf.com/reader/full/see-page-29 174/260
Aerobic biotrickling filtration for biogas desulfurization
144
performed. LO2 was calculated according to Equation 19. Specifically,
experiencing different TLV and O2/H2S ratios during the biofilter
optimization period enabled to drive the bioprocess to new stationary
conditions with minimal S0 production.
A constant TLV of 4 m·h-1 was kept over the first 60 days of operation.
Oppositely, during the same period, several changes in the air inlet flow
were performed resulting in different O2/H2S supplied ratios. After 4 days of
operation, the air inlet flow was increased in 25%, from 150.00 to 187.50
mL·min-1, in an attempt to minimize the excessive observed biosulfur
production. This air inlet flow (187.50 mL·min-1
) corresponded to a LO2 of
0.95 mg O2·min-1, which resulted in a pS-S0 of 17.4 g S-S0·m-3
·h-1.
However, a noteworthy decrease on the production of biosulfur only
occurred after day 12 of operation, when the air inlet flow was increased to
312.5 mL·min-1 (49.17 O2/H2S v·v-1), which corresponded to a LO2 of 1.51
mg O2·min-1, resulting in a pS-S0 of 6.6 g S-S0·m-3
·h-1. The LO2 was
maintained unaltered between days 12 to 25 of operation. Then, from days
25 to 38, the air inlet flow was reduced back to 187.5 mL·min-1 (29.5 O2/H2S
v·v-1) with the intention to confirm the biofilter response and discard
possible causes related to start-up and adaptation phenomena. This latest
change corresponded to a LO2 of 1.33 mg O2·min-1, which produced an
increment on the pS-S0 resulting in 10.3 g S-S0·m-3
·h-1. In order to allow the
biofilter to operates at minimum S0 accumulation conditions and to warrant
the quality of biomass samples for further microbiological analysis
procedures, at day 38 the air inlet flow was increased once again back to
312.5 mL·min-1 (49.17 O2/H2S v
·v-1), corresponding to an LO2 of 1.27 mg
O2·min-1. This configuration was kept until day 60 of operation and the air
inlet flow was maintained as the reference value.
Even with this last increment in the aeration rate of the system, the
biosulfur production rate was only slightly reduced, resulting in pS-S0 of 9.8
g S-S0·m-3
·h-1 during this period (days 38 to 60), a value significantly higher
than the expected from the previous tested condition between days 12 to 25of operation (pS-S0 of 6.6 g S-S0
·m-3·h-1). Taking into account the obtained
8/17/2019 see page 29
http://slidepdf.com/reader/full/see-page-29 175/260
7. Neutral H2S biotrickling filtration and transition to acidic pH
145
data up to this point, the accumulation of biosulfur as well as biomass
massive colonization of the packing material were appointed as an
impairment for the effective penetration of oxygen into the biofilm. In this
way, at day 60, the TLV was significantly incremented (11.7 m·h-1), in order
to spread the penetration of O2 along the filter bed. This high TLV,
maintained up to day 111 of operation, resulted in an LO2 of 2.83 mg
O2·min-1, stimulating from day 65 and on a clear change on the behavior of
the BTF. Not only the increase on the value of SO42-
produced was
observed, but also a dramatically decline of the S0 accumulated was
corroborated, due to the activity of certain bacteria, which have the capacity
of biologically oxidizes S0 to SO4
2-, according to Equation 10. This
condition led to a negative value of the biosulfur production rate during this
period, indicating that biosulfur was been consumed instead of produced.
The biosulfur consumption rate (-pS-S0) was calculated according to
Equation 23. Consequently, the calculated -pS-S0 was -9.2 g S-S0·m-3
·h-1,
which was in good agreement with the visual verification of the consumption
of the accumulated biosulfur inside the filter bed.
Thus, after approximately 115 days after the inoculation, the S0
accumulated had been minimized and the biofilter was operating primarily
producing SO42-. At this point, the TLV was reduced back to 6 m·h-1 in order
to assimilate to the typical values encountered for this kind of bioprocess
(Fortuny et al., 2010), resulting in a LO2 of 1.48 mg O2·min-1
and a -pS-S0 of
-2.4 g S-S0·m-3
·h-1. Therefore it can be stated that the different configuration
changes of TLV and air inlet flow carried out over the first 140 days of
operation allowed consolidating a stable operation with the characteristics
pursued of minimum S0 production and maximum SO42- production from
overall performance. Moreover, produced biosulfur accumulated inside the
filter bed was effectively oxidized to SO42-
.
The performance of the reactor was satisfactorily supported during the
operation at neutral pH, until day 440 of operation, with minimum S0
production, as confirmed by the sulfur mass balance calculation. Once thepH transition was implemented and during the total acidic operation period
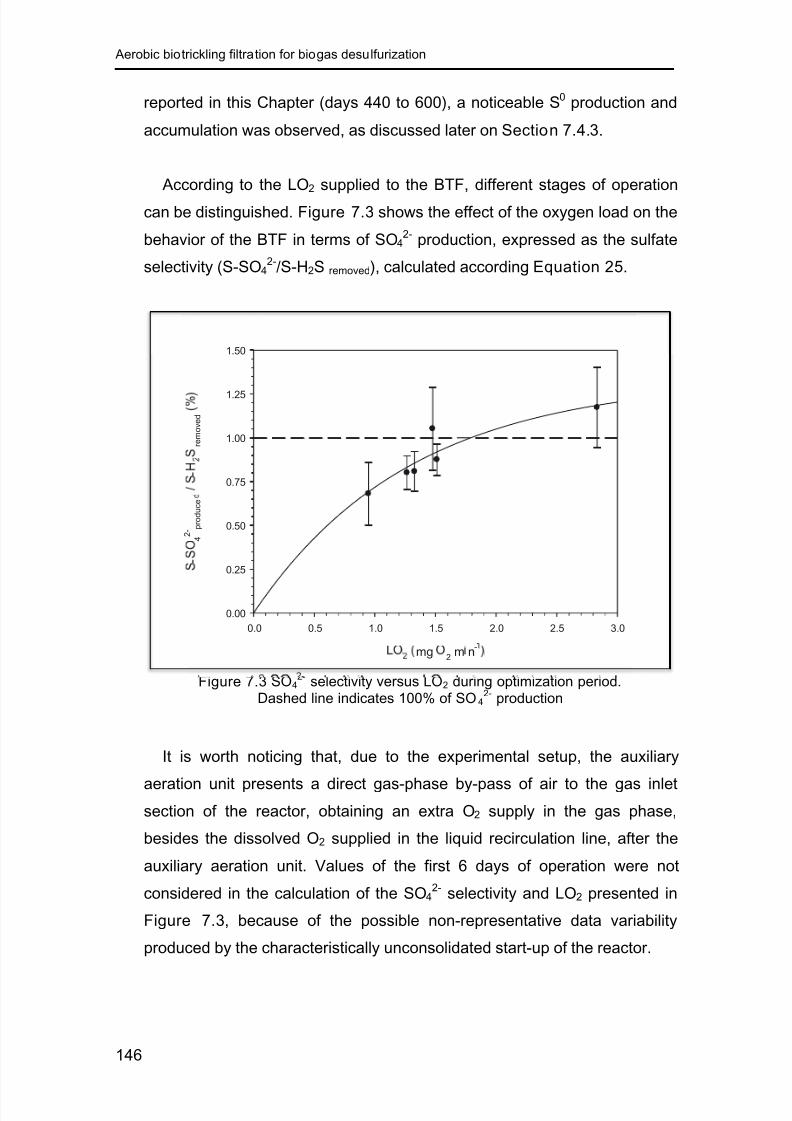
8/17/2019 see page 29
http://slidepdf.com/reader/full/see-page-29 176/260
Aerobic biotrickling filtration for biogas desulfurization
146
reported in this Chapter (days 440 to 600), a noticeable S0 production and
accumulation was observed, as discussed later on Section 7.4.3.
According to the LO2 supplied to the BTF, different stages of operation
can be distinguished. Figure 7.3 shows the effect of the oxygen load on the
behavior of the BTF in terms of SO42- production, expressed as the sulfate
selectivity (S-SO42-/S-H2S removed), calculated according Equation 25.
Figure 7.3 SO42- selectivity versus LO2 during optimization period.
Dashed line indicates 100% of SO42- production
It is worth noticing that, due to the experimental setup, the auxiliary
aeration unit presents a direct gas-phase by-pass of air to the gas inlet
section of the reactor, obtaining an extra O2 supply in the gas phase,
besides the dissolved O2 supplied in the liquid recirculation line, after the
auxiliary aeration unit. Values of the first 6 days of operation were not
considered in the calculation of the SO42-
selectivity and LO2 presented in
Figure 7.3, because of the possible non-representative data variability
produced by the characteristically unconsolidated start-up of the reactor.
LO2 (mg O
2 min
-1)
0.0 0.5 1.0 1.5 2.0 2.5 3.0
S - S O 4
2 - p
r o d u c e d
/ S - H 2
S r e m o v e d
( % )
0.00
0.25
0.50
0.75
1.00
1.25
1.50
mg2 m n
-
0.0 0.5 1.0 1.5 2.0 2.5 3.0
-
4 2 - p
r o d u c e
-
r e m o v e d
0.00
0.25
0.50
0.75
1.00
1.25
1.50

8/17/2019 see page 29
http://slidepdf.com/reader/full/see-page-29 177/260
7. Neutral H2S biotrickling filtration and transition to acidic pH
147
From the SO42- production yields based on the LO2 provided, it was
possible to delimit the optimum BTF operation with Pall rings as packing
material to avoid S0 generation. The appropriate LO2 that lead to complete
SO42- production corresponded to around 1.7 mg O2·min-1 (Figure 7.3).
Underneath this LO2 value, even with H2S RE above 98%, only part of the
H2S removed was completely oxidized to SO42-. Interestingly, this optimal
LO2 supplied through the liquid phase corresponded to a molar ratio of 0.83
mol of O2 supplied per mol of H2S removed, which is lower than 2, the
stoichiometric ratio according to Equation 9. Although such molar ratio is
reduced to 1.6 when a typical biomass growth stoichiometry is considered
(Gabriel et al., 2013), we can infer that the apparently insufficient O2 supply
was complemented by the extra O2 obtained by the direct gas by-pass from
the auxiliary aeration unit to the BTF. However, further research is needed
with proper O2 mass balances calculations to precisely elucidate the
contribution of excess air by-pass through the BTF to H2S removal.
7.4.2 Effect of the gas contact time
The effect of EBRT was studied at constant (E1) and variable (E2) H2S
LRs, by gradually decreasing the EBRT from the reference value of 131 s
down to 29 s. Data of monitored DO and ORP during experiment E1 are
shown in Figure 7.4, alongside with the calculated RE for each applied
EBRT. ORP kept at a stable range between 0 and 40 mV, considered as a
normal value under the studied conditions, for the production of SO42-
(Montebello et al., 2010). However, since ORP monitoring is performed in
the liquid phase, no direct correlation with the gas phase dynamics can be
established in this kind of reactors, because of the difference between the
gas and liquid residence time in the system. Also, because of the relative
short duration of the performed experiments (90 minutes for each
experimental change) in front of the applied HRT (9 hours), no steady state
is reached after each experimental change, even when stable values of RE
were obtained at the gas phase.
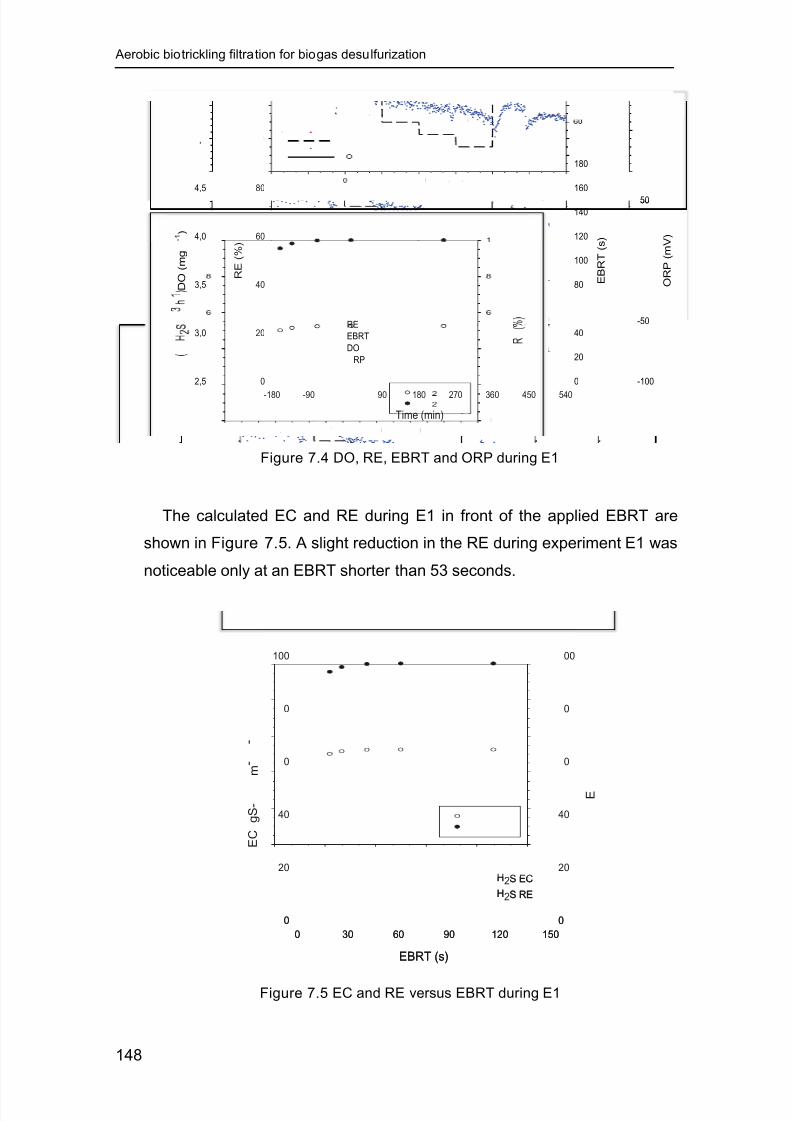
8/17/2019 see page 29
http://slidepdf.com/reader/full/see-page-29 178/260
Aerobic biotrickling filtration for biogas desulfurization
148
Figure 7.4 DO, RE, EBRT and ORP during E1
The calculated EC and RE during E1 in front of the applied EBRT are
shown in Figure 7.5. A slight reduction in the RE during experiment E1 was
noticeable only at an EBRT shorter than 53 seconds.
Figure 7.5 EC and RE versus EBRT during E1
EBRT (s)
0 30 60 90 120 150
E C ( g S - H 2 S
m - 3 h
- 1 )
0
20
40
60
80
100
R E ( % )
0
20
40
60
80
100
H2S EC
H2S RE
a)
Time (min)
-180 -90 0 90 180 270 360 450 540
R E ( % )
0
20
40
60
80
100
E B R T ( s )
0
20
40
60
80
100
120
140
160
180
200
D O
( m g L - 1 )
2,5
3,0
3,5
4,0
4,5
5,0
O R P ( m V )
-100
-50
0
50
100
RE
EBRT
DO
ORP
Time (min)
-180 -90 90 180 270 360 450 540
R E ( % )
0
20
40
60
80
E B R T ( s )
0
20
40
80
100
120
140
160
180
D O
( m g
- 1 )
2,5
3,0
3,5
4,0
4,5
,
O R P ( m V )
-100
-50
50
RE
EBRT
DO
RP
EBRT (s)
0 30 60 90 120 150
E C
g S -
m -
-
0
20
40
0
0
100
E
0
20
40
0
0
00
H S EC
H S RE

8/17/2019 see page 29
http://slidepdf.com/reader/full/see-page-29 179/260
7. Neutral H2S biotrickling filtration and transition to acidic pH
149
Results obtained during experiment E1 indicated a high performance in
H2S removal even at the most restrictive gas contact time studied (29 s),
presenting a slight reduction in RE values from 100% to 95%. Critical EBRT
was found around 55 s (Figure 7.5), considered as an ordinary value for
biotrickling filtration at high H2S loads (Sercu et al., 2005; Datta et al., 2007;
Fortuny et al., 2008; Montebello et al., 2010; Fortuny et al., 2011;
Chaiprapat et al., 2011). Moreover, the possibility of treating biologically
almost 700 ppmv of H2S, keeping and RE around 99% for a gas contact
time as low as 55 s, suggests a wide applicability potential for energetically
rich gas desulfurization processes.
As expected, it was verified that the effect of the EBRT reduction on the
H2S RE was significantly higher under variable H2S LR (E2). Monitoring
data of during E2 are shown in Figure 7.6, alongside with calculated RE for
each experimental step. Once more, it is worth noticing that parameters
calculated from liquid phase are not directly relatable to the gas phase
behavior, because of the dissimilar residence time for each phase.
However, the integrated assessment of monitored parameter aids in the
understanding of the biological desulfurization process.
Figure 7.6 DO, RE, EBRT and ORP during experiment E2
Time (min)
-180 -90 0 90 180 270 360 450 540
R E ( % )
0
20
40
60
80
100
E B R T ( s )
0
20
40
60
80
100
120
140
160
180
200
D O
( m g L - 1 )
0,5
1,0
1,5
2,0
2,5
3,0
3,5
4,0
4,5
O R P ( m V )
-150
-100
-50
0
50
100
RE
EBRT
DO
ORP
Time (min)
-180 -90 0 0 180 270 360 450 540
R E ( % )
40
60
80
100
E B R T ( s )
0
20
60
80
100
120
140
160
180
200
D O
( m g L - 1 )
0,5
1,0
1,5
2,0
,
3,0
3,5
,
4,5
O R P ( m V )
-150
-
-50
50
100
RE
EBRT
DO
ORP

8/17/2019 see page 29
http://slidepdf.com/reader/full/see-page-29 180/260

8/17/2019 see page 29
http://slidepdf.com/reader/full/see-page-29 181/260
7. Neutral H2S biotrickling filtration and transition to acidic pH
151
The critical EBRT for the removal of H2S during experiment E2 was
found around 75 s, a value higher than that obtained during E1 experiment,
due to the considerably higher H2S LR applied during experiment E2.
Critical and maximum ECs were found at 100 and 135 g S-H2S·m-3·h-1,
respectively, comparable to the results obtained previously by Fortuny et al.
(2011), under similar experimental conditions but with a different packing
material. It can be supposed that the extent of mass transfer limitation was
comparable for the two different packing because of the similarity between
specific surface values for each material: 433 m2·m-3 in the case of the
HDQPac elements (Fortuny et al., 2008) and 515 m2·m-3 for the Pall rings
applied in this study. Once the experimental period was concluded,
reference operation conditions were resumed and RE of H2S fast recovered
to around 99%, confirming the high recovery capacity of the system. It is
worth noticing that at the last EBRT period studied (29 s), data obtained
from the on-line monitoring of DO (data not shown) indicated that the
system was at limiting oxygen conditions, so the air supply was increased
from 250.00 mL·min-1
to 312.50 mL·min-1
, as an attempt to improve the H2S
removal, as showed by the increment in the observed EC and RE values at
the lowest EBRT (29 s). However, no significant changes were observed in
terms of RE, probably because of the difference between gas and liquid
residence time in the system, e.g. EBRT of 131 – 29 s and HRT of 9 h.
7.4.3 Transition to acidic pH conditions
After 440 days of neutral pH conditions operation (6.0 < pH < 6.5), the
transition to acidic pH was performed, applying the pH set-up control values
shown in Table 7.2, up to the final value of 2.50 < pH < 2.75. Surprisingly,
after the six-days period that lasted the gradual pH transition, the system
was efficiently performing on the desulfurization of 2,000 ppmv of H2S at
acidic pH conditions, after more than one year under neutral pH operation
and without any re-inoculation of the reactor. In spite of the sustained
removal of H2S, it is worth noticing that a meaningful quantity of S0
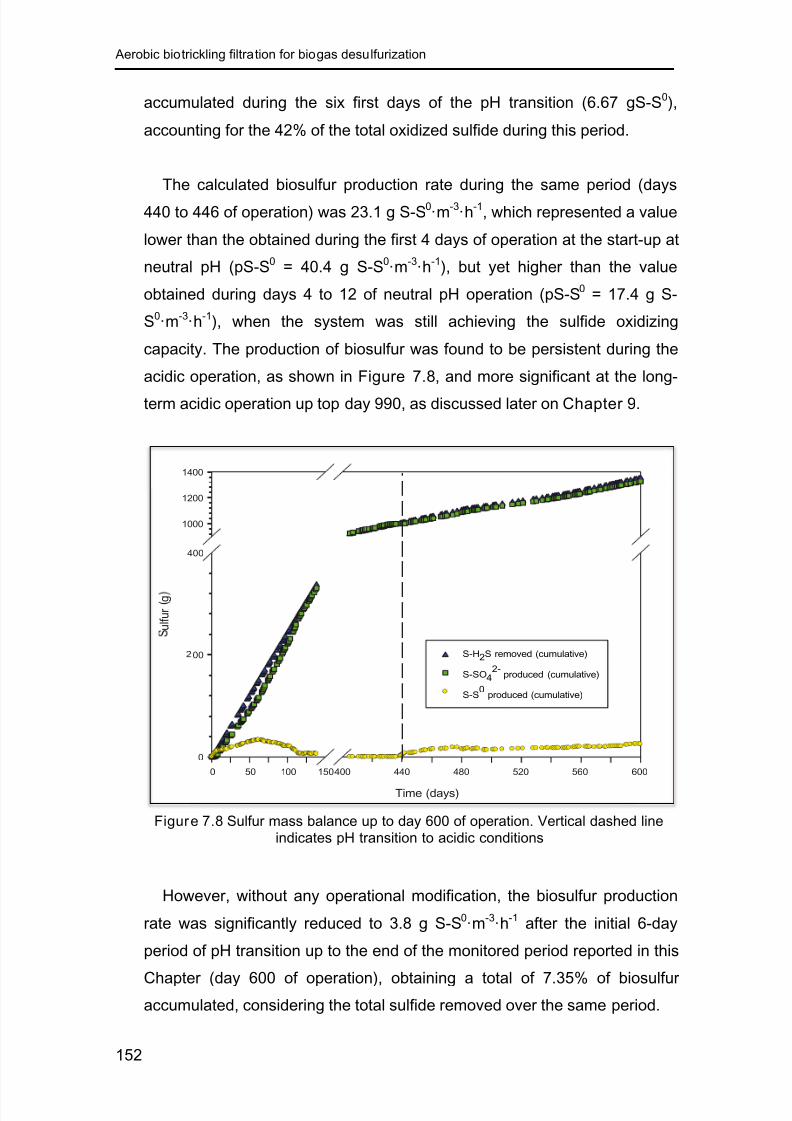
8/17/2019 see page 29
http://slidepdf.com/reader/full/see-page-29 182/260
Aerobic biotrickling filtration for biogas desulfurization
152
accumulated during the six first days of the pH transition (6.67 gS-S0),
accounting for the 42% of the total oxidized sulfide during this period.
The calculated biosulfur production rate during the same period (days
440 to 446 of operation) was 23.1 g S-S0·m
-3·h
-1, which represented a value
lower than the obtained during the first 4 days of operation at the start-up at
neutral pH (pS-S0 = 40.4 g S-S0·m-3
·h-1), but yet higher than the value
obtained during days 4 to 12 of neutral pH operation (pS-S0 = 17.4 g S-
S0·m-3
·h-1), when the system was still achieving the sulfide oxidizing
capacity. The production of biosulfur was found to be persistent during the
acidic operation, as shown in Figure 7.8, and more significant at the long-
term acidic operation up top day 990, as discussed later on Chapter 9.
Figure 7.8 Sulfur mass balance up to day 600 of operation. Vertical dashed lineindicates pH transition to acidic conditions
However, without any operational modification, the biosulfur production
rate was significantly reduced to 3.8 g S-S0·m-3
·h-1 after the initial 6-day
period of pH transition up to the end of the monitored period reported in this
Chapter (day 600 of operation), obtaining a total of 7.35% of biosulfuraccumulated, considering the total sulfide removed over the same period.
Time (days)
0 50 100 150400 440 480 520 560 600
S u l f u r ( g )
0
200
400
1000
1200
1400
S-H2S removed (cumulative)
S-SO42-
produced (cumulative)
S-S0 produced (cumulative)
b)
Time (days)
0 50 100 150400 440 480 520 560 600
u l f u r
g
0
00
400
1000
1200
1400
S-H2S removed (cumulative)
S-SO42-
produced (cumulative)
S-S0 produced (cumulative)
b)

8/17/2019 see page 29
http://slidepdf.com/reader/full/see-page-29 183/260
7. Neutral H2S biotrickling filtration and transition to acidic pH
153
These results revealed an exceptional biological desulfurization capacity
and suggested that the microbial consortium already present in the filter bed
rapidly evolved to a community able to subsist at acidic pH conditions,
without any re-inoculation procedure. Dynamics of the microbial community
diversity of the BTF was studied by others, before and after the performed
pH transition from neutral to acidic conditions (Bezerra et al., 2013). The
obtained data of relative abundance denoted a large complexity of the
bacterial community under neutral pH. Most abundant families found at
neutral pH were Xanthomonadaceae (γ-Proteobacteria), with 35% of
abundance and Nitrosomonadaceae (β-Proteobacteria), with 22.5% of
abundance. However, a dramatic diversity reduction occurred at acidic pH,
even when the desulfurizing capacity of the reactor remained unaffected.
Results of relative abundance indicated the complete disappearance of the
phylum β-Proteobacteria at acidic pH, while phyla γ-Proteobacteria (86%)
and α-Proteobacteria (12%) prevailed. At acidic pH, the most abundant
species were Acidithiobacillus thiooxidans (47%), Acidiphillum sp. (12%)
and Acidithiobacillus sp. (10%) (Bezerra et al., 2013).
Overall, since no reduction on the H2S removal capacity was observed
after pH transition, no substantial differences were found, at macroscopic
level, in the performance of the BTF at neutral and acidic pH conditions.
Differently, Kim and Deshusses (2005) have found that the biodegradation
activity was significantly increased when the operational pH rose from 2 to
near neutral, which in turn was in disagreement with the results obtained by
Gabriel and Deshusses (2003b), who reported better activity at low pH.
Furthermore, it is not possible to elucidate the reason of so conflictive
results since different operational conditions and acclimatization strategies
have been applied in each study.
The effect of short-term pH variations on the overall reactor performance
has been already studied in comparable conditions with the present study,
but with a rigid, structured packing material at near neutral pH values
(Fortuny et al., 2011). In that study, they found that the overall system

8/17/2019 see page 29
http://slidepdf.com/reader/full/see-page-29 184/260
Aerobic biotrickling filtration for biogas desulfurization
154
response was quite insensitive to a pH drop from 6 – 6.5 to 2.5, but was
markedly affected by a pH increase from 6 – 6.5 to 9.5. To the author’s
knowledge, no literature is available regarding to the effect of a permanent
pH change over the biogas biological desulfurization. In the treatment of
VOCs and H2S at odor level by biotrickling filtration with PU foam, Gabriel
and Deshusses (2003b) reported a severe lost of performance when the
operational pH was instantly changed from acidic to neutral condition,
attributed to the possible culture inhibition during pH transition; the effect of
extra chlorine supply was also appointed as a possible explanation.
Probably, a similar behavior would be obtained with the BTF studied in this
thesis if the pH transition were suddenly performed; contrary, the gradual
pH transition executed apparently helped in the adaptation of the
indigenous microbial consortium, as inferred by the obtained results.
Moreover, the applied packing material shown to be effective at both pH
conditions studied, for the period of operation reported. Also, the adopted
gradual pH transition strategy showed appropriate to ensure the continuous
BTF operation without the necessity of re-inoculating the reactor. However,
further investigation is required in order to compare the overall reactor
performance under neutral and acidic pH condition operation, when a
steady-state acidic operation has been achieved (Chapter 9).
7.5 Conclusions
Highly H2S-loaded (51.48 g S-H2S·m-3
·h-1
) biogas desulfurization in the
studied aerobic biotrickling filter was proven to be effective for both neutral
and acidic pH operation with an inert random packing material. The
performed unspecific inoculation was considered acceptable, resulting in
high H2S removal after a short start-up period.
The optimization of operational parameters, such as the aeration rate,
the liquid trickling velocity and the hydraulic residence time resulted in an
optimal O2/H2S supplied ratio for the achievement of the minimum elemental
8/17/2019 see page 29
http://slidepdf.com/reader/full/see-page-29 185/260
7. Neutral H2S biotrickling filtration and transition to acidic pH
155
sulfur production, defined as the targeted reactor performance for the
parallel study (by others) of the microbiological community developed in the
filter bed. The oxygen load was enhanced by the concomitant optimization
of the aeration rate and the liquid recirculation rate, resulting in the
maximum sulfate selectivity under the investigated conditions. Oxygen load
was confirmed as a key driven parameter of the H2S oxidation products
control. The study of the hydrodynamic characteristics of the system, as
well as the investigation on the reactor performance in front of the pollutant
load and the gas contact time confirmed that, under the studied conditions,
mass transfer was the main limiting process.
The operational pH transition of the BTF was successfully executed by
gradually reducing the pH down to 2.50 – 2.75. This strategy shown
effective and sufficient for the adaptation of the microbial community to
perform at such acidic environment, even with no re-inoculation of the filter
bed. An important simplification was encountered in the microbiological
ecology of the reactor, indicating than the selective pressure imposed by th
operational pH resulted in a fast, dynamic microbiological adaptation, with
outstanding H2S removal capacitiy. Results obtained confirmed the high
adaptability capacity and the robustness of this kind of reactors. Moreover,
the packing material employed, AISI 304 Pall rings, shown suitable for
operation under neutral operation and acidic condition for the studied period
reported in this Chapter (600 days), even when deterioration of packing
elements was verified over the long-term acidic operation (Chapter 9).

8/17/2019 see page 29
http://slidepdf.com/reader/full/see-page-29 186/260
Aerobic biotrickling filtration for biogas desulfurization
156

8/17/2019 see page 29
http://slidepdf.com/reader/full/see-page-29 187/260
8simultaneous removal of
methylmercaptan and H2S

8/17/2019 see page 29
http://slidepdf.com/reader/full/see-page-29 188/260
Aerobic biotrickling filtration for biogas desulfurization
158
W hat for cen t u r i es r ai sed m an above t he beast i s not t he cudgel
but t he i r r esi st i ble power of u nar med t r ut h.
B or i s L P ast er nak
M oscow, 189 0 Peredelkino, 1960

8/17/2019 see page 29
http://slidepdf.com/reader/full/see-page-29 189/260
159
8 Simultaneous removal of methylmercaptan and H2S
8.1 Summary and scope
During the stable long-term operation of the reactor at neutral pH
conditions, different experiments were conducted in order to study the effect
of the presence of CH3SH in the inlet biogas stream over the desulfurizing
capacity of the reactor. Experiments were conducted, at comparable
technical conditions, jointly with the Biological and Enzymatic Reactors
Group, from the University of Cadiz, responsible for the operation of a BTF
under anoxic conditions. However, only results obtained from the aerobic
BTF studied in this thesis are presented in this Chapter. Further information
about the performance of the anoxic reactor can be found elsewhere
(Montebello et al., 2012).
The studied BTF was run for more than one year treating H2S as the
unique S-contaminant, at a concentration of 2,000 ppmv of H2S. Then,
without any re-inoculation of the reactor, the effect of the presence of
CH3SH on the H2S and CH3SH removal capacity of the system was
investigated maintaining a constant load of H2S (52 g S-H2S·m-3·h-1).
Initially, CH3SH concentration was stepwise increased from 0 to 75 ppmv of
CH3SH. Maximum EC of around 1.8 g S-CH3SH·m-3·h-1 was found. After
that, CH3SH LR was indirectly increased by testing different EBRTs
between 180 and 30 seconds. Significantly lower ECs were found at shortEBRTs, indicating that the system was mostly mass transfer limited.
Finally, EBRT was reduced from 180 to 30 seconds at variable CH3SH
and H2S loads. Maximum H2S EC found was 100 gS-H2S·m-3·h-1. A
negative influence was found on the removal of CH3SH by the presence of
high H2S loads. However, sulfur mass balance and batch tests showed that
CH3SH chemically reacts with S0 at neutral pH, enhancing the overall
reactors performance, by reducing the impact of sulfur accumulation inside

8/17/2019 see page 29
http://slidepdf.com/reader/full/see-page-29 190/260
Aerobic biotrickling filtration for biogas desulfurization
160
the packed bed. Also, the reactor was able to treat CH3SH without prior
inoculation because of the already existing SOB consortium grown during
H2S treatment exhibited a high CH3SH elimination capacity. Co-treatment of
H2S and CH3SH under aerobic conditions was considered as a feasible
operation for concentrations commonly found in biogas (2,000 ppmv of H2S
and below 20 ppmv of CH3SH).
The aim of the work presented in this Chapter was to investigate the
impact of the presence of CH3SH and H2S and the effect of the gas contact
time reduction on the overall desulfurizing performance of a well-
established BTF operated under aerobic condition during the co-treatment
of typical loads of H2S and CH3SH in biogas.
A modified version of this chapter has been published as:
Montebello AM, Fernandez M, Almenglo F, Ramirez M, Cantero D, Baeza M,
Gabriel D (2012) Simultaneous methylmercaptan and hydrogen sulfide
removal in the desulfurization of biogas in aerobic and anoxic biotricklingfilters. Chemical Engineering Journal, 200-202, 237-246.

8/17/2019 see page 29
http://slidepdf.com/reader/full/see-page-29 191/260
8. Simultaneous removal of methylmercaptan and H2S
161
8.2 Introduct ion
In terms of process performance impact, van den Bosch et al. (2009)
reported that CH3SH severely inhibits biological sulfide oxidation (50%
reduction of the biological oxidation rate) at concentrations above 0.05 mM
of CH3SH under natron-alkaline-aerobic conditions. Complete inhibition was
found at concentrations of 0.65 mM of CH3SH. However, no previous
studies of simultaneous H2S and CH3SH are available at high H2S loading
rates in bioreactors operating at neutral pH, neither under aerobic nor
anoxic conditions. Thus, potential accumulation of CH3SH in BTFs may
hinder H2S removal to a certain extent.
The biological oxidation of CH3SH under aerobic conditions produces as
intermediary products formaldehyde and H2S (Bentley and Chasteen,
2004). The overall reaction can be expressed according to Equation 34
(Sipma et al., 2004):
2 CH3SH + 7 O2 2 CO2 + 2 H2SO4 + 2 H2O [34]
Even if the oxidation of CH3SH with molecular oxygen have also been
described to happen in strongly alkaline solutions in presence of metal ion
catalysts while the oxidation rates in the absence of catalytic materials are
extremely low (Harkness and Murray, 1970). Also chemical oxidation of
CH3SH to DMDS in an aerobic reactor has been reported to occur
according to Equation 5 (van Leerdam et al., 2008). Recently, van
Leerdam et al. (2011) have found that CH3SH also reacts chemically with
biosulfur particles at pH 8.7 to form DMDS and other polysulfides according
to Equation 35 and Equation 36:
2 CH3S- + H
+ + 1/8 S8 HS
- + CH3SSCH3 [35]
2 CH3S- + S8 Sy
2- + CH3SxCH3 (with x + y = 10) [36]

8/17/2019 see page 29
http://slidepdf.com/reader/full/see-page-29 192/260
Aerobic biotrickling filtration for biogas desulfurization
162
These reactions depend on the CH3SH and biosulfur concentration,
temperature and nature of biosulfur particles (van Leerdam et al., 2011).
Main products are dimethyl disulfide (DMDS), and dimethyl trisulfide
(DMTS) and some longer-chain dimethyl polysulfides ((CH3)2S4-7). DMDS
and DMTS are less inhibitory than CH3SH on biological (poly)sulfide
oxidation (van den Bosch et al., 2009). However, further research is needed
in order to elucidate the complex chemical and biological CH3SH reaction
mechanisms under neutral pH conditions.
8.3 Materials and methods
8.3.1 Experimental conditions
Three different experiments were performed to face potential crossed
effects during CH3SH and H2S simultaneous treatment, under the
conditions detailed in Table 8.1.
Table 8.1 Experimental conditions for CH3SH and H2S co-treatment
Experiment[H2S] in (ppmv)
H2S LR(gS-H2S·m
-3·h
-1)
[CH3SH] in (ppmv)
CH3SH LR(gS-CH3SH·m
-3·h
-1)
EBRT(s)
E1 2,000 52.5
10 0.26
180
20 0.53
40 1.05
60 1.58
75 2.00
E2
2,000
52.4 13
0.34 180
1,001 0.68 90
666 1.02 60
501 1.36 45
342 1.99 30
E3 2,000
52
13
0.34 180
105 0.68 90
158 1.02 60
207 1.36 45
306 1.99 30

8/17/2019 see page 29
http://slidepdf.com/reader/full/see-page-29 193/260
8. Simultaneous removal of methylmercaptan and H2S
163
First, a CH3SH inlet concentration increase experiment (E1) was
performed at constant H2S LR, in order to verify the possible effect of
CH3SH over the already existing H2S desulfurization capacity of the reactor.
Secondly, an EBRT decreasing experiment at constant H2S LR (E2) was
performed and, finally, an EBRT decreasing experiment at variable H2S LR
(E3) was executed. Experiments E2 and E3 were designed to investigate
the operational limit and potential mass transfer limitation effects for both
investigated pollutant.
In E1, the H2S inlet concentration was kept constant at around 2,000
ppmv while the CH3SH concentration was stepwise increased from 10 to 75
ppmv of CH3SH. Concentration steps were kept constant during 24 h, that
corresponded to almost three liquid residence times, if compared to the
HRT of 9 h of the liquid phase during experimental period. Then, a pseudo-
steady-state condition after each concentration step was considered to be
reached. The EBRT was kept unaltered at 180 s during E1.
In E2, a constant H2S LR was maintained to verify the single effect of the
increasing CH3SH LR produced by the reduction in the gas contact time
down to 30 seconds. The EBRT was stepwise decreased, being each
EBRT step kept for 1.5 h.
In E3, both H2S and CH3SH concentrations were kept constant, leading
to an indirect increase in both pollutants LRs, due to the reduction of the
gas contact time. Similarly to E2, the EBRT was stepwise decreased in E3,
being each EBRT step kept for 1.5 h. In all cases, liquid and gas samples
were analyzed at the end of each step to assess the EC and RE of each
pollutant as well as the sulfur mass balance. The oxygen supplied to the
aeration unit and the inlet H2S ratio (O2/H2S supplied), calculated according to
Equation 18, corresponded to a molar ratio of 43 mol O2·(mol S-H2S)-1
during experiments E1 and E2, and from 43 to 7.4 mol O2·(mol S-H2S) -1
during experiment E3.

8/17/2019 see page 29
http://slidepdf.com/reader/full/see-page-29 194/260
Aerobic biotrickling filtration for biogas desulfurization
164
8.4 Results and discussion
8.4.1 Effect of CH3SH in biogas desulfur ization
The calculation of the EC at the end of each pseudo steady-state period
(Figure 8.1) during stepwise concentration increases along E1 showed that
the critical CH3SH EC was 0.51 g S-CH3SH·m-3·h-1. Maximum EC of 1.68 g
S-CH3SH·m-3·h-1 was reached. Maximum ECs in the range of 3 to 25.6 g S-
CH3SH·m-3·h-1 previously reported (Ruokojarvi et al., 2001; Hartikainen et
al., 2002; Caceres et al., 2010), indicated that a larger microbiological
activity could be still developed, with greater adaptation to CH3SH removal.
Figure 8.1 EC and RE versus CH3SH LR during E1
No detrimental effect over the desulfurization of H2S was observed by the
presence of CH3SH since the H2S RE was kept around 99% during the
complete E1 experiment. Furthermore, a beneficial effect on H2S
desulfurization was found by the presence of CH3SH at the studied
concentration range that led to a clear reduction on the accumulated
biosulfur inside the reactor bed, as discussed later on Section 8.4.3.
LR (gS-CH3SH m
-3h
-1)
0,0 0,2 0,4 0,6 0,8 1,0 1,2 1,4 1,6 1,8 2,0 2,2
E C ( g S - C H 3
S H
m - 3 h
- 1 )
0,0
0,2
0,4
0,6
0,8
1,0
1,2
1,4
1,6
1,8
2,0
2,2
R E ( %
)
0
20
40
60
80
100
CH3SH EC
CH3SH RE
LR gS-C H m-3 -1
0,0 0,2 0,4 0,6 0,8 1,0 1,2 1,4 1,6 1,8 2,0 2,2
E C ( g S - C H 3
S H
m - h
- 1 )
0,0
0,2
0,4
0,6
0,8
,0
,2
,4
,6
,8
,0
,2
R E ( %
)
0
20
40
60
80
100
CH3SH EC
CH3SH RE
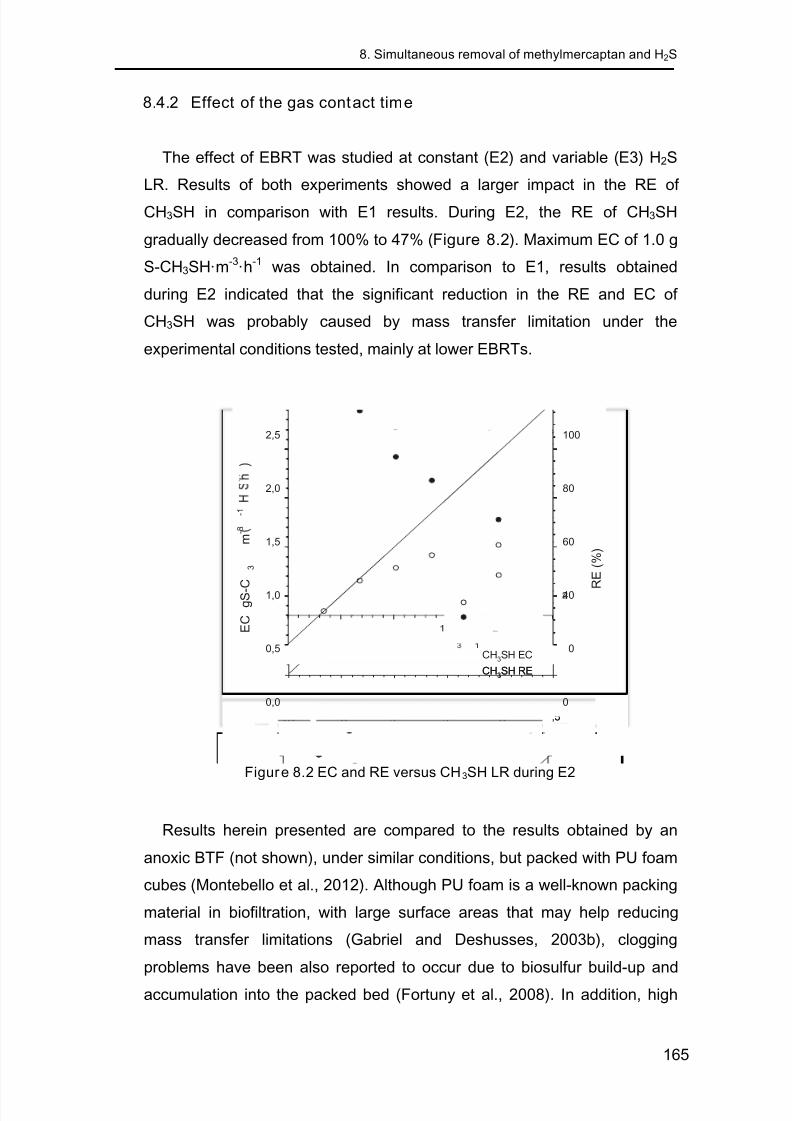
8/17/2019 see page 29
http://slidepdf.com/reader/full/see-page-29 195/260
8. Simultaneous removal of methylmercaptan and H2S
165
8.4.2 Effect of the gas contact time
The effect of EBRT was studied at constant (E2) and variable (E3) H2S
LR. Results of both experiments showed a larger impact in the RE of
CH3SH in comparison with E1 results. During E2, the RE of CH3SH
gradually decreased from 100% to 47% (Figure 8.2). Maximum EC of 1.0 g
S-CH3SH·m-3·h-1 was obtained. In comparison to E1, results obtained
during E2 indicated that the significant reduction in the RE and EC of
CH3SH was probably caused by mass transfer limitation under the
experimental conditions tested, mainly at lower EBRTs.
Figure 8.2 EC and RE versus CH3SH LR during E2
Results herein presented are compared to the results obtained by an
anoxic BTF (not shown), under similar conditions, but packed with PU foam
cubes (Montebello et al., 2012). Although PU foam is a well-known packing
material in biofiltration, with large surface areas that may help reducing
mass transfer limitations (Gabriel and Deshusses, 2003b), clogging
problems have been also reported to occur due to biosulfur build-up and
accumulation into the packed bed (Fortuny et al., 2008). In addition, high
LR (gS-CH3SH m
-3 h
-1)
0,0 0,5 1,0 1,5 2,0 2,5
E C ( g S - C H 3
S H m - 3 h
- 1 )
0,0
0,5
1,0
1,5
2,0
2,5
R E ( % )
0
20
40
60
80
100
CH3SH EC
CH3SH RE
LR (gS-CH3SH m
- h
-)
0,0 0,5 1,0 ,5 ,0 2,5
E C
g S - C
3
m - 3
- 1
0,0
0,5
1,0
1,5
2,0
2,5
R E ( % )
0
0
40
60
80
100
CH3SH EC
CH3SH RE

8/17/2019 see page 29
http://slidepdf.com/reader/full/see-page-29 196/260
Aerobic biotrickling filtration for biogas desulfurization
166
gas velocities of around 6,000 m·h-1 were found to contribute to reducing
H2S mass transfer limitations (Gabriel and Deshusses, 2003). In this sense,
Kim and Deshusses, (2005) studied, among other parameters, the TLV in a
BTF packed with PU foam and concluded that under low gas flow rates
(under 4,000 m·h-1
), mass transfer from the gas phase to the liquid phase
was the limiting factor and the recirculation rate had no effect on H2S EC.
Thus, results obtained during E2 indicated that no special advantage was
found for PU foam in the anoxic reactor (Montebello et al., 2012) in front of
Pall rings, used in the aerobic BTF described in this thesis, in terms of mass
transfer improvement for CH3SH removal, confirming that the specific
surface area of the packing material is not that important in terms of mass
transfer in desulfurizing BTFs because they are commonly operated at
much larger EBRTs if compared to BTFs for odor removal. During E2, the
H2S EC was less affected than the CH3SH EC by the reduction of EBRT
(Figure 8.3), because of the progressive decrease of the H2S inlet
concentration and the reduced solubility reported for CH3SH in comparison
to H2S (Sander, 1999). RE of H2S decreased from 100% to 95% during E2.
Figure 8.3 EC of H2S and CH3SH versus EBRT during E2
EBRT (s)
0 20 40 60 80 100 120 140 160 180 200
R E
( % )
0
20
40
60
80
100
H2S
CH3SH
EBRT s
0 20 40 0 80 100 120 140 60 180 00
R E
( % )
0
20
40
0
0
100
H2S
CH SH

8/17/2019 see page 29
http://slidepdf.com/reader/full/see-page-29 197/260
8. Simultaneous removal of methylmercaptan and H2S
167
It is interesting to notice that such H2S RE above 95% achieved at the
lowest EBRT studied (30 s) corresponded to the inlet H2S concentration of
342 ppmv of H2S, a commonly found H2S concentration in some reported
biogas streams (Table 2.5). In addition, critical EBRT was found at 60 s.
Therefore, almost 700 ppmv of H2S can be treated efficiently (RE > 98%)
under the studied conditions at 60 s of gas contact time.
Few references exist on the co-treatment of H2S and CH3SH in BTFs.
Co-treatment of these compounds has been carried out for odor treatment
(65 – 220 ppmv of H2S and 26 – 47 ppmv of CH3SH) in two-stage BTFs
connected in series (Ruokojarvi et al., 2001; Ramirez et al., 2011).
Generally, the first stage at acidic pH removes most of the H2S, small
amounts of CH3SH and other VOSCs. The second step, at neutral pH,
removes the rest of VOSCs. Maximum ECs of 47.9 g S-H2S·m-3·h-1 and
2.75 g S-CH3SH·m-3·h-1 were reported by Ruokojarvi et al. (2001) at EBRTs
of 61 and 118 s per stage. Ramírez et al. (2011) obtained maximum ECs of
70.6 g S-H2S·m-3·h-1 and 9.8 g S-CH3SH·m-3
·h-1 at EBRT of 60 s. Same
authors (Ramírez et al., 2011) also tested the co-treatment of H2S, CH3SH
and other VOSC at neutral pH and found a decrease in the RE of CH3SH
from 83 to 33% when the H2S inlet concentration was increased from 23 to
376 ppmv of H2S, for a CH3SH inlet load of 2.4 g S-CH3SH·m-3·h-1. It is
known that H2S is removed preferentially than other RSCs under aerobic
conditions (Wani et al., 1999).
During E3, the effect of a variable H2S LR due to the decrease of the
EBRT was clearly noticed by the impact on the EC of CH3SH encountered,
if compared to E2 , as shown in Figure 8.4. The RE of CH3SH was reduced
from 100% to 16%. Interestingly, the EC-LR profile did not follow the profile
typically reported in which the EC reaches a plateau at high pollutant loads
(Devinny et al., 1999). Instead, a maximum is observed close to the critical
EC value. Later, a progressive decrease of the EC was found as the LRs of
both pollutants increased. A similar behaviour was observed by Ramírez et
al. (2011), with a decreasing in the RE of CH3SH from 83% to 33% when
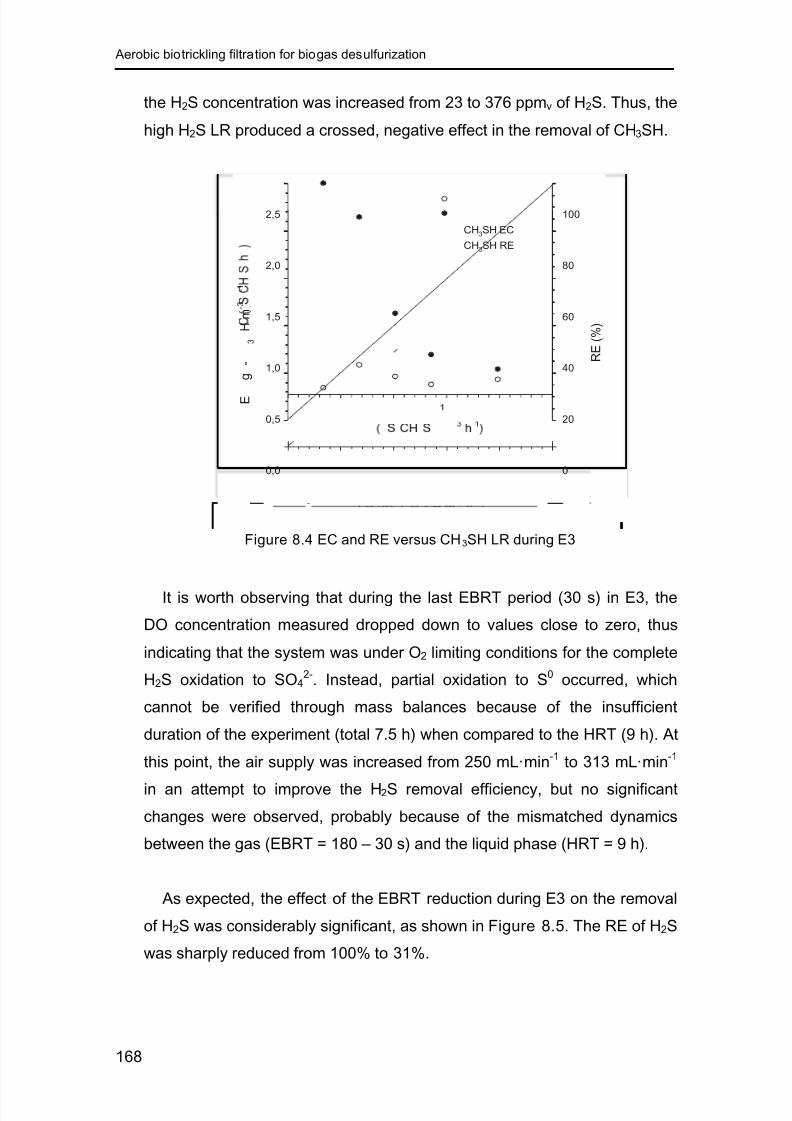
8/17/2019 see page 29
http://slidepdf.com/reader/full/see-page-29 198/260
Aerobic biotrickling filtration for biogas desulfurization
168
the H2S concentration was increased from 23 to 376 ppmv of H2S. Thus, the
high H2S LR produced a crossed, negative effect in the removal of CH3SH.
Figure 8.4 EC and RE versus CH3SH LR during E3
It is worth observing that during the last EBRT period (30 s) in E3, the
DO concentration measured dropped down to values close to zero, thus
indicating that the system was under O2 limiting conditions for the complete
H2S oxidation to SO42-. Instead, partial oxidation to S0 occurred, which
cannot be verified through mass balances because of the insufficient
duration of the experiment (total 7.5 h) when compared to the HRT (9 h). At
this point, the air supply was increased from 250 mL ·min-1
to 313 mL·min-1
in an attempt to improve the H2S removal efficiency, but no significant
changes were observed, probably because of the mismatched dynamics
between the gas (EBRT = 180 – 30 s) and the liquid phase (HRT = 9 h).
As expected, the effect of the EBRT reduction during E3 on the removal
of H2S was considerably significant, as shown in Figure 8.5. The RE of H2S
was sharply reduced from 100% to 31%.
LR (gS-CH3SH m
-3 h
-1)
0,0 0,5 1,0 1,5 2,0 2,5
E C
( g S - C H 3
S H m - 3 h
- 1 )
0,0
0,5
1,0
1,5
2,0
2,5
R E ( % )
0
20
40
60
80
100
CH3SH EC
CH3SH RE
LR g -3
H m-
-
0,0 0,5 1,0 ,5 2,0 2,5
E
g
-
3
H m - 3
- 1
0,0
0,5
1,0
1,5
2,0
2,5
R E ( % )
0
20
40
60
80
100
CH3SH EC
CH3SH RE

8/17/2019 see page 29
http://slidepdf.com/reader/full/see-page-29 199/260
8. Simultaneous removal of methylmercaptan and H2S
169
Figure 8.5 EC and RE versus H2S LR during E3
Despite of the differences between the HRT and the duration of the
experiment, data obtained from ORP monitoring indicated a reduction in
ORP from 30 mV (at 180 s, LR of 53 g S-H2S·m-3·h-1) to -80 mV (at 30 s, LR
of 306 g S-H2S·m-3·h
-1). According to Montebello at al. (2010) and Fortuny
et al. (2011), such final ORP value suggests almost no TDS accumulation in
the liquid phase and, thus, that mass transfer was the main limiting process.
Monitoring of TDS indicated concentrations below the limit of detection
(1.5×10⁻⁵ ± 0.9×10⁻⁵ mol S-S2-·L-1 ; 0.48 ± 0.29 mg S-S2-
·L-1). The critical
and maximum EC of H2S during E3 was found around 100 g S-H2S·m-3·h
-1.
The EC and RE of H2S are comparable to the results obtained previously by
Fortuny et al. (2011) under similar experimental conditions with a different
packing material, confirming that CH3SH did not have any detrimental effect
on the removal of H2S under the range of conditions tested. After the
experimental period, normal operating conditions were resumed and the RE
of H2S quickly recovered normal values (around 99%), confirming the high
recovery capacity of the BTF (Fortuny et al., 2008; Montebello et al., 2010).
LR (gS-H2S m
-3 h
-1)
0 50 100 150 200 250 300 350
E C ( g S - H 2 S m - 3 h
- 1 )
0
50
100
150
200
250
300
350
R E ( % )
0
20
40
60
80
100
H2S EC
H2S RE
b)
LR gS-2
m-
0 50 100 150 200 250 300 350
E
g
-
2
m - 3
- 1
0
50
100
150
200
250
300
350
E
0
20
40
60
80
100
H2S EC
H2S RE

8/17/2019 see page 29
http://slidepdf.com/reader/full/see-page-29 200/260
Aerobic biotrickling filtration for biogas desulfurization
170
At this point, it is difficult to confirm the cause of such negative effect in
the EC of CH3SH due to the H2S LR increase. Since H2S is an intermediate
product of the biological CH3SH oxidation (Smet et al., 1998; Bentley and
Chasteen, 2004), the biological oxidation of H2S is preferred by
microorganisms over CH3SH. However, the higher O2 requirements for the
biological oxidation of CH3SH (Equation 34) in comparison with the O2
requirement for H2S biological aerobic oxidation (Equation 9) may have
also influenced the results under aerobic conditions and, probably, also
under anoxic conditions (Montebello et al., 2012). Since microorganisms
involved in CH3SH and H2S removal are not totally identical, further
research is needed to identify the microbial populations in the reactor as
well as their degradation activities, to understand the underlying
mechanisms observed. The reactor was at some point limited by the
electron acceptor availability to end up with SO42-
as the final product of H2S
oxidation. Thus, improving the electron acceptor supply is warranted to
reduce biosulfur accumulation in the packed bed (Rodriguez et al., 2013).
Critical EBRT for the removal of H2S during E3 was found around 120 s,
as shown in Figure 8.6, which is significantly higher than during E2.
Figure 8.6 RE of H2S and CH3SH versus EBRT during E3
EBRT (s)
0 50 100 150 200
R E ( % )
0
20
40
60
80
100
H2S
CH3SH
EBRT (s)
0 50 100 150 200
R E ( % )
0
20
40
60
80
100
H2S
CH3SH

8/17/2019 see page 29
http://slidepdf.com/reader/full/see-page-29 201/260
8. Simultaneous removal of methylmercaptan and H2S
171
Overall, results obtained during EBRT reduction experiments indicated
that the reactor was capable of treating H2S at a LR as high as 100
g S-H2S·m-3·h-1 at a gas contact time of around 120 s. The obtained EC of
around 100 g S-H2S·m-3·h-1 at EBRT of 90 s corresponded to a slight
reduction in the RE of H2S to approximately 95%, suggesting that for EBRT
values lower than 90 s, mass transfer limitation is the main restriction for the
simultaneous removal of CH3SH and H2S at the tested conditions.
However, such high H2S LR had a detrimental effect over CH3SH removal.
8.4.3 Sulfur mass balance
A sulfur mass balance was performed by substraction (Janssen et al.,
1997), allowing estimating the quantity of biosulfur produced. Sulfur mass
balance during E1 is shown in Figure 8.7. For mass balances calculation, it
was assumed that the only final products were S0 and SO42-, since DMDS,
the sole by-product formed by the chemical reaction between CH3SH and
biosulfur particles at neutral pH, is further biologically oxidized to SO42-.
Figure 8.7 Sulfur mass balance during E1
Time (h)
-48 -24 0 24 48 72 96 120 144 168
S u l f u r ( g )
0
5
10
15
20
25
[ C H
3 S H ] ( p p m v
)
0
20
40
60
80
100
S(gas) removed (cumulative)
S-SO4
2- produced (cumulative)
S-S0 produced (cumulative)
[CH3SH]in (ppmv)
Time (h)
-48 -24 0 24 48 72 96 120 144 168
S u l f u r ( g )
0
5
10
15
20
25
[ C
3 S H ] ( p p m v
)
0
20
40
60
80
100
S(gas) removed (cumulative)
S-SO4
2-produced (cumulative)
S-S0 produced (cumulative)
[CH3SH]in (ppmv)

8/17/2019 see page 29
http://slidepdf.com/reader/full/see-page-29 202/260
Aerobic biotrickling filtration for biogas desulfurization
172
Sulfur mass balance calculation was performed as described by
Equation 21. Results during E1 shown that the pS-S0 was kept almost
stable during the first three CH3SH concentration steps (around 1.86 g S-
S0·m-3
·h-1), resulting in a SO42- selectivity of around 80% (Figure 8.7).
Interestingly, the pS-S0 was reduced to 1.55 g S-S
0·m
-3·h
-1 during the last
steps, leading to an increase in the SO42- selectivity up to 90%. Such results
indicated that during the higher CH3SH LR periods the consumption of
biosulfur by chemical reaction with CH3SH probably occurred according to
the batch tests performed under neutral pH (6.8 – 7.0) (Montebello et al.,
2012). It can be deduced that the biological oxidation of DMDS, produced
by the chemical reaction between CH3SH and biosulfur (Equation 35) was
the reason for the increase on the SO42- production observed at the end of
experiment E1. After the experimental period, the production rate of
biosulfur was restored to the initial values.
Also, the visual evidence of the reduction of accumulated biosulfur inside
the reactor confirmed the consumption of biosulfur by chemical reaction
with CH3SH. Such observations indicated that the presence of CH3SH
favours the reduction of the amount of biosulfur that generally accumulates
in highly-loaded H2S desulfurizing systems, even if artificial feeding of
CH3SH cannot be considered as an economically viable alternative to
prevent clogging of the filter bed. Results from a full-scale BTF (Tomas et
al., 2009) treating a biogas flowrate of around 80 m3·h
-1 under the same
conditions studied herein, indicated that the annual cost of externally added
CH3SH is as high as three times the initial investment cost of the BTF.
Nonetheless, the natural presence of CH3SH in biogas could be considered
as a technical advantage during the biogas desulfurization in BTFs. Finally,
it is worth noticing that no CH3SH or other mercaptans and polysulfides
were fed to the reactor prior to the experiment, which confirms that SOB
developed in the studied BTF were capable of degrading CH3SH or any of
the chemical reaction by-products and that no further inoculation of the
system was needed.

8/17/2019 see page 29
http://slidepdf.com/reader/full/see-page-29 203/260
8. Simultaneous removal of methylmercaptan and H2S
173
8.5 Conclusions
Overall, results showed that the co-treatment of H2S and CH3SH is
feasible in aerobic biotrickling filters, with no detrimental effects in H2S
removal under the typical concentrations of CH3SH found in biogas.
Oppositely, a beneficial effect was found on the performance of the reactor
due to the chemical reaction of CH3SH with elemental sulfur, enhancing the
overall reactor performance, by minimization of the effects of sulfur
accumulation inside the filter bed.
The reactor was able to treat CH3SH without prior inoculation because of
the already existing sulfide-oxidizing microorganisms grown during H2S
treatment. However, H2S LR above 100 g S-H2S·m-3·h-1 has a negative
impact in the CH3SH treatment capacity mainly caused by substrate
competition. The EBRT was parameterized either for H2S and CH3SH as
main pollutants in biogas desulfurization. According to the results, the EBRT
at which the H2S-desulfurizing aerobic BTF was sized (180 s) provided
adequate results in terms of CH3SH and H2S treatment. Moreover, results
obtained during the experiments presented in this Chapter were compared
to an anoxic biotrickling filter, similarly operated by others (results not
shown), according to Montebello et al. (2012), indicating that also under
anoxic conditions, BTFs are capable to cope with the desulfurization of
biogas. Overall, no significant differences were found in terms of global
desulfurizing capacity between the two systems (aerobic and anoxic BTFs)
because of the different applied packing material – PU foam in the case of
the anoxic BTF.

8/17/2019 see page 29
http://slidepdf.com/reader/full/see-page-29 204/260
Aerobic biotrickling filtration for biogas desulfurization
174

8/17/2019 see page 29
http://slidepdf.com/reader/full/see-page-29 205/260
9acidic H2S biotrickling filtration

8/17/2019 see page 29
http://slidepdf.com/reader/full/see-page-29 206/260
Aerobic biotrickling filtration for biogas desulfurization
176
I t s the most righteous, which of course
is not the same thing as the most profitable.
N i k ol a i V Gogol
Sorochyntsi, 1809 M oscow, 1852

8/17/2019 see page 29
http://slidepdf.com/reader/full/see-page-29 207/260
177
9 Acidic H2S biotrickling filt ration
9.1 Summary and scope
The complete long-term operation of the studied BTF under acidic pH
conditions (2.50 < pH < 2.75), from day 600 to 990 of operation is presented
in this Chapter. Previous operation at acidic pH, from day 440 to 600 of
operation was reported in Chapter 7, as well as the initial 440-days period
at neutral pH conditions (6.0 < pH < 6.5) and the performed gradual,
uninterrupted transition to acidic pH. The effect of the EBRT reduction and
the effect of the increase of the H2S LR were investigated under steady-
state at acidic pH conditions.
The EBRT was gradually reduced down to 33 s. The critical EBRT was
found at 75 s, corresponding to a critical EC of 100 g S-H2S·m-3
·h-1
. The
maximum EC, obtained during the LR increasing experiment, was 220 g S-
H2S·m-3
·h-1. Additionally, the oxidation rate of biologically produced
elemental sulfur (biosulfur) accumulated inside the filter bed was assessed
by discontinuing the H2S gas feeding, during periodical H2S starvation
episodes. Moreover, the H2S removal profile along the filter bed was also
assessed at 1/3, 2/3 and 3/3 of the filter bed height. Results indicated that
the first third of the filter bed (bottom section) was responsible for 70 to 80%
of the total H2S removal. Biosulfur oxidation to sulfate was suggested as
interesting sulfur clogging control strategy under acidic operating conditions.Overall, biotrickling filter performance under acidic pH conditions was
comparable to that under neutral pH conditions, in terms of overall
desulfurizing capacity of the system, even if a significant quantity of
biosulfur was produced under acidic pH.
The aim of the work presented in this Chapter was to investigate the
impact of the H2S load and the gas contact time in the performance of a
well-established aerobic biotrickling filter, operated at long-term under acidic

8/17/2019 see page 29
http://slidepdf.com/reader/full/see-page-29 208/260
Aerobic biotrickling filtration for biogas desulfurization
178
pH conditions, during the desulfurization of synthetic biogas. The effect of
H2S periodical starvation was also investigated as a simulated real-
operation episode and as possible sulfur clogging control strategy. Also, the
H2S removal profile along the filter bed height was studied. Results were
compared to previously reported studies under neutral pH conditions.
A slightly modified version of this chapter has been submitted for publication as:
Montebello AM, Gamisans X, Lafuente J, Baeza M, Gabriel D (2013) Aerobic
desulfurization of biogas by acidic biotrickling filtration. Environmental
Technology.
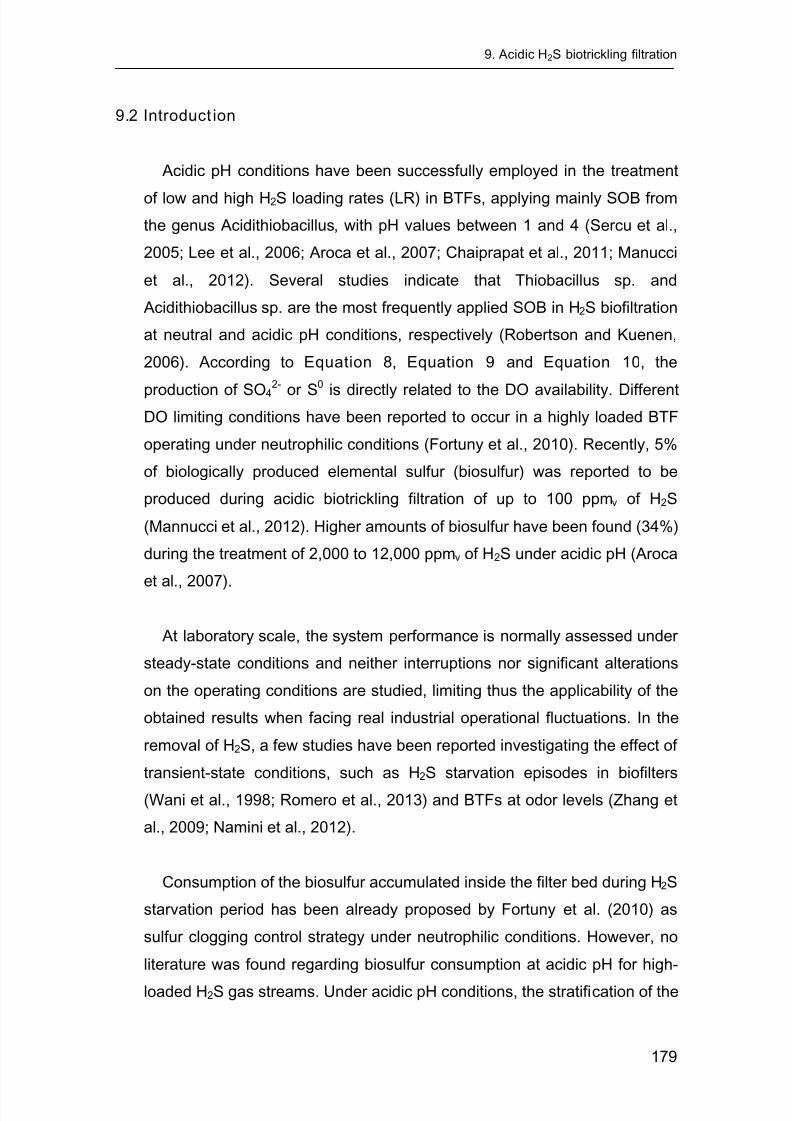
8/17/2019 see page 29
http://slidepdf.com/reader/full/see-page-29 209/260
9. Acidic H2S biotrickling filtration
179
9.2 Introduct ion
Acidic pH conditions have been successfully employed in the treatment
of low and high H2S loading rates (LR) in BTFs, applying mainly SOB from
the genus Acidithiobacillus, with pH values between 1 and 4 (Sercu et al.,
2005; Lee et al., 2006; Aroca et al., 2007; Chaiprapat et al., 2011; Manucci
et al., 2012). Several studies indicate that Thiobacillus sp. and
Acidithiobacillus sp. are the most frequently applied SOB in H2S biofiltration
at neutral and acidic pH conditions, respectively (Robertson and Kuenen,
2006). According to Equation 8, Equation 9 and Equation 10, the
production of SO4
2-
or S0
is directly related to the DO availability. DifferentDO limiting conditions have been reported to occur in a highly loaded BTF
operating under neutrophilic conditions (Fortuny et al., 2010). Recently, 5%
of biologically produced elemental sulfur (biosulfur) was reported to be
produced during acidic biotrickling filtration of up to 100 ppmv of H2S
(Mannucci et al., 2012). Higher amounts of biosulfur have been found (34%)
during the treatment of 2,000 to 12,000 ppmv of H2S under acidic pH (Aroca
et al., 2007).
At laboratory scale, the system performance is normally assessed under
steady-state conditions and neither interruptions nor significant alterations
on the operating conditions are studied, limiting thus the applicability of the
obtained results when facing real industrial operational fluctuations. In the
removal of H2S, a few studies have been reported investigating the effect of
transient-state conditions, such as H2S starvation episodes in biofilters
(Wani et al., 1998; Romero et al., 2013) and BTFs at odor levels (Zhang et
al., 2009; Namini et al., 2012).
Consumption of the biosulfur accumulated inside the filter bed during H2S
starvation period has been already proposed by Fortuny et al. (2010) as
sulfur clogging control strategy under neutrophilic conditions. However, no
literature was found regarding biosulfur consumption at acidic pH for high-
loaded H2S gas streams. Under acidic pH conditions, the stratification of the

8/17/2019 see page 29
http://slidepdf.com/reader/full/see-page-29 210/260
Aerobic biotrickling filtration for biogas desulfurization
180
filter bed has been studied during H2S removal at odor level (Lafita et al.,
2012). Moreover, the H2S removal profile along the filter bed was studied by
Ramirez et al. (2009b) for low to moderate H2S LRs. However, no literature
is available regarding the removal profile of H2S at high H2S LR, as in the
present study.
9.3 Materials and methods
9.3.1 Operational and experimental conditions
Reference operating conditions in the long-run operation were adopted
according to Table 4.1, which corresponded to an EBRT of 130 s and H2S
LR of 52.28 g S-H2S·m-3·h-1, at 2,000 ppmv of H2S in the inlet synthetic
biogas. The pH was controlled in the range of 2.50 to 2.75. After 249 days
of steady operation under acidic pH, corresponding to 689 days of the total
reactor operation, three experiments were performed (E1, E2 and E3), as
shown in Table 9.1. During the experiments herein reported, a TLV of
7 m·h-1 and a HRT of 9 h were applied.
During experiment E1, the EBRT was stepwise decreased from 130 to
33 s, keeping each EBRT value for 1 h, while the inlet H2S concentration in
the synthetic biogas was kept unaltered (2,000 ppmv of H2S). Thus, the H2S
LR indirectly increased from 52.28 up to 262.54 g S-H2S·m-3·h-1 as a
consequence of the EBRT reduction. During experiment E2, at a constant
EBRT of 130 s, the inlet H2S concentration in the biogas was stepwise
increased from 2,000 to 10,000 ppmv of H2S, resulting in H2S LRs from
52.28 to 262.54 g S-H2S·m-3
·h-1
. Each concentration step was kept for 24 h.
Besides the normal continuous outlet H2S monitoring at the G 3/3 gas outlet
port (top section), periodic determination of H2S at G 1/3 (bottom section)
and G 2/3 (middle section) of the filter bed height was also performed to
assess the EC and RE as well as the sulfur mass balance in the reactor
during each experiment, to discern the H2S removal profile along the filterbed height.

8/17/2019 see page 29
http://slidepdf.com/reader/full/see-page-29 211/260
9. Acidic H2S biotrickling filtration
181
Table 9.1 Experimental conditions at acidic pH
Exp[H2S]biogas
(ppmv)H2S LR
(gS·m-3
·h-1
)O2/H2S
a
(v·v-1
) EBRT
(s) Duration
(h)
Previous
operationb
(day)
E11,999.99
± 0.31
52.28 41.20 130 1
249
104.44 20.62 76 1
155.39 13.86 54 1
206.39 10.44 42 1
263.09 8.19 33 1
E2
1,999.53 52.28 41.20
130
24
250
4,000.44 104.80 20.55 24
6,000.34 157.51 13.67 24
7,999.91 209.93 10.26 24
10,000.02 262.54 8.20 24
E3-1 0 – – – 168 256
E3-2 0 – – – 192 385
E3-3 0 – – – 336 453
E3-4 0 – – – 192 491
E3-56,000.34 157.51 13.67 130 168 521
10,000.02 262.54 8.20 130 96 529
E3-6 0 – – – 408 533
a Aeration flow was kept unaltered during H2S starvation experiments (312.50 mL·min
-1).
b Days from the beginning of the operation at acidic pH (after 440 days at neutral pH).
Experiment E3 was subdivided into 6 different experiments. E3-1,
initiated immediately after the end of E2, consisted in the interruption of the
H2S feeding during 7 days, while keeping other operational conditions
unaltered. Similar experimental conditions were applied during E3-2, E3-3,
E3-4 and E3-6, with duration of 8, 14, 8 and 17 days, respectively.
Differently, E3-5 consisted in the simulation of a sudden increase in the inlet
biogas concentration from 2,000 to 6,000 and 10,000 ppmv of H2S during atotal 10-days period. Applied H2S LR was 157.51 g S-H2S·m-3
·h-1 during 6

8/17/2019 see page 29
http://slidepdf.com/reader/full/see-page-29 212/260
Aerobic biotrickling filtration for biogas desulfurization
182
days (6,000 ppmv of H2S) followed by 262.54 g S-H2S·m-3·h-1 during the
next 4 days (10,000 ppmv of H2S). Experiment E3-6, the last starvation
period studied, was initiated immediately after E3-5. The frequency of
starvation experiments, which represents the time period between
experiments, varied from 23 to 122 days, as can be deduced from the
diverse previous operation period detailed in Table 9.1 for each experiment.
9.4 Results and discussion
9.4.1 Effect of the gas contact time
The effect of the EBRT reduction over the reactor performance is
commonly studied in BTFs (Sercu et al., 2005; Lee et al., 2006; Ramirez et
al., 2009; Chaiprapat et al., 2011; Fortuny et al., 2011; Montebello et al.,
2012). In this study, the EBRT was gradually reduced from the reference
value of 130 s down to 33 s during E1.
Data of on-line monitoring of DO and ORP during E1 are shown in
Figure 9.1, alongside with the calculated H2S RE. Also, a discontinuous DO
measure was performed in the liquid purge line of the main reactor. The
comparison between available DO at the recirculation line (DO in) and the
DO present at the purge line (DOout) allowed estimating the consumed DO
as a consequence of the microbial activity inside the filter bed. However, the
observed consumed DO must be considered as a qualitative figure,
because steady state is not reached after each operational alteration. The
estimated consumption of O2 during experiment E1 was found to be around
3 mg O2·L-1
, (0.15 mg O2·L-1
·min-1
) for each experimental step, suggesting
that microbial activity was not a limiting process. Instead, O2 transfer was
found to be the main limiting process, which is in agreement with other
reported studies at comparable experimental conditions (Montebello et al.,
2010; Fortuny et al., 2011).

8/17/2019 see page 29
http://slidepdf.com/reader/full/see-page-29 213/260
9. Acidic H2S biotrickling filtration
183
Figure 9.1 DO, RE, EBRT and ORP during E1
The monitored ORP profile during E1 shown a gradual decline from the
reference value of 430 mV (at EBRT of 130 s) down to 350 mV (at EBRT of
33 s). Once the reference conditions were resumed, after E1, values of
ORP monitoring rapidly recovered the normal reference operating value.
The H2S RE during E1 gradually dropped from 100%, at the reference
EBRT of 130 s, to 55% at 33 s.
The assessment of the maximum EC as well as the critical EBRT
provides interesting data for bioreactor design, operation and modeling.
Both parameters were assessed during experiments E1 and E2. Results
indicated that during E1, critical and maximum ECs were around 100 and
140 g S-H2S·m-3
·h-1
, respectively, as shown in Figure 9.2. The critical
EBRT, at which the critical EC is found, was around 75 s. Recently,
Chaiprapat et al. (2011) reported a reduction of the H2S RE from 80 – 90%
to 30 – 40% when the EBRT was reduced from 313 to 78 s in a full-scale
biotrickling filter at acidic pH (1 < pH < 4.5) treating biogas containing
around 2,000 ppmv of H2S. The negative effect of the reduction of EBRT
was related to the low solubility of both H2S and specially O2 under the
studied conditions.
Time (min)
-60 0 60 120 180 240 300 360 420
R E ( % )
0
20
40
60
80
100
E B R T ( s )
0
20
40
60
80
100
120
140
D O
( m g L - 1 )
0
1
2
3
4
5
6
7
O R P ( m V )
300
350
400
450
500
RE
EBRT
DO in
DO out
ORP
Time min
60 60 120 180 240 300 360 420
R E ( % )
0
20
40
60
80
100
E
R T ( s )
0
20
40
60
80
100
120
140
D O
( m g L - 1 )
0
1
2
3
4
5
6
7
O R P ( m V )
300
350
400
450
500
RE
EBRT
DO in
out
ORP
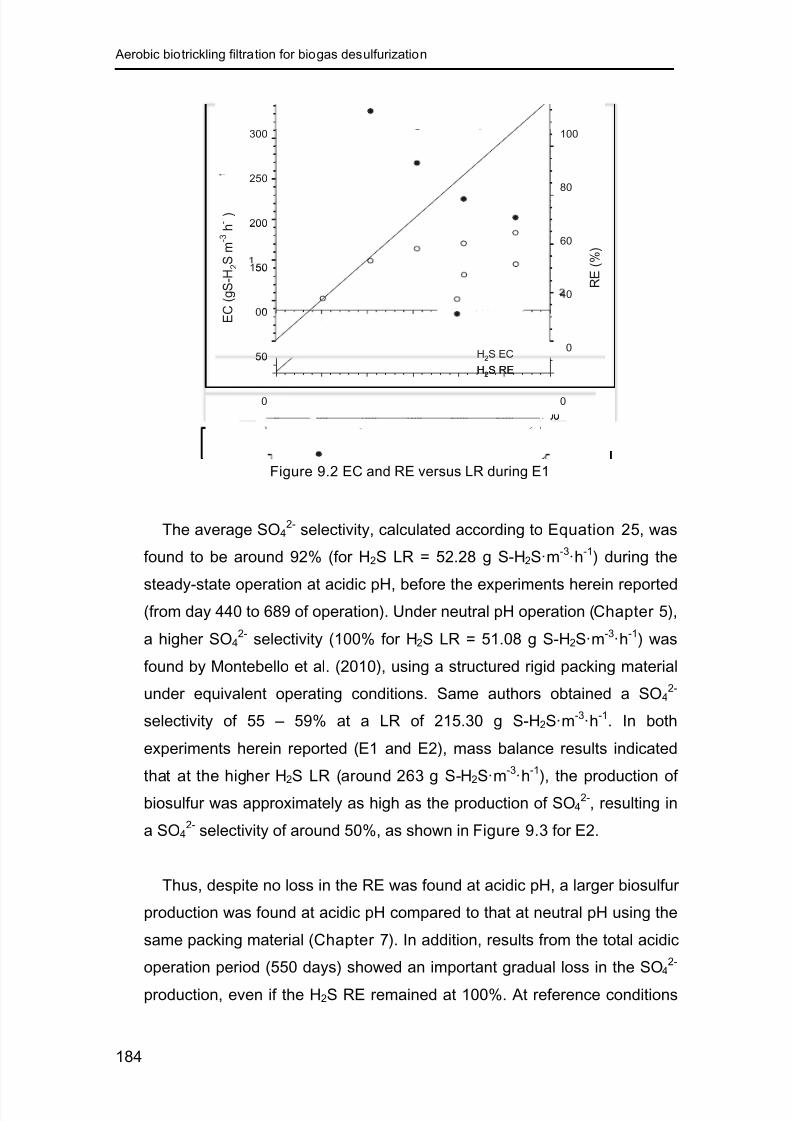
8/17/2019 see page 29
http://slidepdf.com/reader/full/see-page-29 214/260
Aerobic biotrickling filtration for biogas desulfurization
184
Figure 9.2 EC and RE versus LR during E1
The average SO42- selectivity, calculated according to Equation 25, was
found to be around 92% (for H2S LR = 52.28 g S-H2S·m-3·h-1) during the
steady-state operation at acidic pH, before the experiments herein reported(from day 440 to 689 of operation). Under neutral pH operation (Chapter 5),
a higher SO42- selectivity (100% for H2S LR = 51.08 g S-H2S·m-3
·h-1) was
found by Montebello et al. (2010), using a structured rigid packing material
under equivalent operating conditions. Same authors obtained a SO42-
selectivity of 55 – 59% at a LR of 215.30 g S-H2S·m-3·h-1. In both
experiments herein reported (E1 and E2), mass balance results indicated
that at the higher H2S LR (around 263 g S-H2S·m-3
·h-1
), the production of
biosulfur was approximately as high as the production of SO42-, resulting in
a SO42-
selectivity of around 50%, as shown in Figure 9.3 for E2.
Thus, despite no loss in the RE was found at acidic pH, a larger biosulfur
production was found at acidic pH compared to that at neutral pH using the
same packing material (Chapter 7). In addition, results from the total acidic
operation period (550 days) showed an important gradual loss in the SO42-
production, even if the H2S RE remained at 100%. At reference conditions
LR (gS-H2S m
-3 h
-1)
0 50 100 150 200 250 300
E C ( g S - H 2
S m - 3 h
- 1 )
0
50
100
150
200
250
300
R E ( % )
0
20
40
60
80
100
H2S EC
H2S RE
LR (gS-H2S m
-3 h
-1)
0 50 100 150 200 250 300
E C ( g S - H 2
S m - 3 h - )
0
50
00
150
200
250
300
R E ( % )
0
0
40
60
80
100
H2S EC
H2S RE

8/17/2019 see page 29
http://slidepdf.com/reader/full/see-page-29 215/260
9. Acidic H2S biotrickling filtration
185
under acidic pH, the average SO42- selectivity ranged from 84 to 55% during
the long-term operation. Reasons behind such loss of SO42-
production
capacity remained unknown and need of further research. Probably one of
the reasons for such high biosulfur production found at acidic pH is the
deterioration of the packing material elements, as visually verified during
biomass sampling procedures, as commented later on Section 9.4.4. Also,
it must be considered that the SO42- selectivity calculation, according to
Equation 25, does not take into account the presence of biomass and other
solids than S0, such as metallic salts formed by leached minerals from
oxidized packing elements, which certainly incremented the observed
biosulfur accumulated inside the reactor bed.
9.4.2 Effect of the H2S loading rate
The RE during experiment E2 dropped from 100% at the reference LR
(52.28 g S-H2S·m-3
·h-1
) to 85% at the highest LR experimented (262.54 g S-
H2S·m-3·h-1) as shown in Figure 9.3.
Figure 9.3 EC, RE and SO42- selectivity versus LR during E2
LR (gS-H2S m
-3h
-1)
0 50 100 150 200 250 300
E C ( g S - H 2
S m - 3 h
- 1 )
0
50
100
150
200
250
300
R E ,
S - S O 4
2 - / S - H 2
S r e m o v e d
( % )
0
20
40
60
80
100
H2S EC
H2S RE
S-SO4
2-/S-H
2S
removed
LR g -2 m
-3 -1
0 50 00 150 200 250 300
g
-
2
m -
-
0
50
100
150
200
250
300
E ,
S - S
4 2 -
-
2
r e m o v e
%
0
0
40
0
0
100
H2S EC
H2S RE
S-SO4
2-/S-H
2S
removed

8/17/2019 see page 29
http://slidepdf.com/reader/full/see-page-29 216/260
Aerobic biotrickling filtration for biogas desulfurization
186
During E2, critical and maximum ECs were around 160 and 220 g S-
H2S·m-3
·h-1
, respectively. EC is considerably higher than the obtained in
experiment E1, probably because of the mass transfer limitation at reduced
EBRTs. SO42- selectivity was of around 95% at the beginning of the E2 and
was gradually decreased down to around 50% at the end of the experiment.
The maximum EC obtained in the present study (220 g S-H2S·m-3·h-1) is
comparable to that reported by Chaiprapat et al. (2011), who obtained a
maximum EC of 256 g S-H2S·m-3·h-1, using coconut fiber as packing
material. Comparable results were also published by Tomás et al. (2009),
who obtained a maximum EC of 170 g S-H2S·m-3
·h-1
, using plastic Pall
rings as packing material in a full-scale biotrickling filter under comparable
operational conditions. The highest value of maximum EC reported for
acidic biotrickling filtration of high loads of H2S is 370 g S-H2S·m-3
·h-1
(Aroca et al., 2007) treating inlet H2S concentrations ranging from 2,000 to
12,000 ppmv of H2S at an EBRT of 45 s, with a pH from 1.8 to 2.5 and using
polyethylene rings as packing material.
Critical ECs as obtained in the present study (160 g S-H2S·m-3
·h-1) have
been previously reported by others (Lee et al., 2006) in a BTF inoculated
with Acidithiobacillus thiooxidans over a porous ceramic packing material.
Desulfurization of 200 to 2,200 ppmv of H2S at 18 to 6 s of EBRT indicated
that the gas contact time is more influential than the inlet concentration.
Also, O2 transport from gas to liquid phase was considered the main limiting
process.
Overall results obtained during the long-term operation at acidic pH and
herein presented were comparable to those obtained during the previous
operation of the same reactor at neutral pH conditions (Chapter 7), as
reported by Fortuny et al. (2011) and Montebello et al. (2012). No significant
differences were found in terms of desulfurizing capacity of high loads of
H2S (2,000 to 10,000 ppmv of H2S / 50 to 260 g S-H2S·m-3·h-1) at neutral
and acidic pH under the studied conditions.

8/17/2019 see page 29
http://slidepdf.com/reader/full/see-page-29 217/260
9. Acidic H2S biotrickling filtration
187
9.4.3 H2S removal profile throughout the bed
The H2S elimination profile along the filter bed height during E1 is shown
in Figure 9.4. The RE was calculated at three filter bed heights (gas ports
G1/3, G2/3 and G3/3), corresponding to the bottom, middle and top
sections of the filter bed. During E1, the RE was suddenly reduced at
EBRTs lower than 70 s, which corresponded to a H2S loading rate of 100 g
S-H2S·m-3
·h-1
. As expected, results indicated that the most significant
elimination of H2S was obtained at the bottom section of the reactor (G 1/3),
close to the gas inlet section, where a higher H2S/O2 gradient probably
exists due to the counter-current flow mode of the liquid and the gas
phases. However, the feeding of exhaust air from the aeration unit directly
to the gas inlet section of the BTF certainly played an important role in the
dynamic of SO42-
production along the BTF bed height, enhancing the SO42-
selectivity at the bottom of the reactor by the extra O2 supply. Further
research focused on the oxygen balance along the filter bed is suggested
as a tool to elucidate the mechanism of the observed H2S removal
stratification.
Figure 9.4 RE as a function of the filter bed height during E1
0
20
40
60
80
100
0.0
0.1
0.2
0.3
0.4
0.5
0.6
40
60
80
100
120
R E ( % )
B e d
H e i g h t
( m )
E B R T ( s )
0
20
40
0
80
100
0.0
0.1
0.2
0.3
0.4
0.5
0.6
40
60
0
100
120
R E ( % )
B e d
H e i g h t
( m )
B R T ( s )
8/17/2019 see page 29
http://slidepdf.com/reader/full/see-page-29 218/260
Aerobic biotrickling filtration for biogas desulfurization
188
The H2S elimination profile along the filter bed height during experiment
E2 is shown in Figure 9.5. Around 90% of RE at H2S LR as high as 120 g
S-H2S·m-3·h-1 was obtained at the bottom section of the reactor.
Figure 9.5 RE as a function of the filter bed height during E2
Such high performance was attributed to the extra aeration obtained by
described the aeration system. Ramirez et al. (2009b) also reported a
similar behavior for H2S LR ranging from 4 to 59 g S-H2S·m-3·h-1. Thus,
assessment of the SO42-
and/or DO concentrations along the BTF bed
height is necessary in future research on this topic.
9.4.4 Biosulfur to sulfate oxidation
Results from experiment E3-1 showed that the biosulfur previously
accumulated inside the filter bed during experiments E1 and E2
(approximately 23 g S-S0) was effectively oxidized, resulting in the
continuous production of SO42-
, in agreement with the Equation 10, even
under H2S starvation, as shown in Figure 9.6.
0
20
40
60
80
100
0.0
0.1
0.2
0.3
0.4
0.5
0.6
50
100
150
200
250
R E ( % )
B e d
H e i g h t
( m )
H 2 S LR ( g S - H
2 S m - 3 h - 1 )
0
20
40
0
80
100
0.0
0.1
0.2
0.3
0.4
0.5
0.6
50
100
150
200
250
R E ( % )
B e d
H e i g h t
( m )
2 S LR ( g S - H 2 S m - 3 - 1

8/17/2019 see page 29
http://slidepdf.com/reader/full/see-page-29 219/260
9. Acidic H2S biotrickling filtration
189
Figure 9.6 Sulfur mass balance during E2 and E3
After 7 days of H2S starvation (E3-1), almost 80% of all accumulated S0
was consumed (18 g S-S0), indicating that the microbial consortium was
able to utilize biosulfur as the only substrate under aerobic conditions.Values of the initial and the average -pS-S
0 were -100.6 g S-S
0·m
-3·h
-1 and
-43.6 g S-S0·m-3
·h-1 during E3-1. Fortuny et al. (2010) reported the oxidation
of 57% of the accumulated biosulfur after 6 days of H2S starvation at neutral
pH conditions. However, experimental conditions were not totally
comparable to the present study and differences are not conclusive. To the
author knowledge, no literature is available on the S0 oxidation at acidic pH.
Results from sulfur mass balances during E3-1 to E3-6 are shown in
Figure 9.7. Biosulfur production was notably increased after 840 days of
total operation (400 days at acidic pH), which occurs after experiment E3-2.
Probably, sulfur clogging started at some point inside the filter bed, even
when pressure drop monitoring showed no significant pressure drop
increases. Also, accumulation of biomass and biosulfur hindered the O2
availability through the inner layers of the biofilm, producing the observed
increment in the production of S0.
Time (h)
0 24 48 72 96 120 144 168 192 216 240 264 288
S u l f u r ( g ) ( c u m u l a t i v e )
0
20
40
60
80
100
[ H 2
S ] ( p p m v
)
0
2000
4000
6000
8000
10000
12000
14000
16000
p S -
S 0 , - p S - S 0 , p S - S O 4
2 - ( g S - S
0 ·
m - 3
·
h - 1 , g S - S O 4
2 - · m
- 3 ·
h - 1 )
-150
-100
-50
0
50
100
150
200
250
S-H2S removed
S-SO4
2- produced
S-S0 produced
[H2S]in (ppmv)
pS-S0; -pS-S
0
pS-SO4
2-
Time (h)
0 4 48 72 6 120 144 168 192 16 40 64 88
S u l f u r ( g ) ( c u m u l a t i v e )
0
20
40
60
80
100
[ H 2
S ] ( p p m v
)
0
2000
4000
000
8000
10000
12000
14000
16000
p S -
S
, - p S - S 0 , p S - S O 4
2 - ( g S - S
·
m - ·
h - 1 , g S - S O 4
2 - · m
- ·
h - )
-150
-100
-50
0
50
100
150
200
250
S-H S removed
S-SO- produced
S-S0 produced
[H2S]in (ppmv)
pS-S0; -pS-S
0
pS-SO2-

8/17/2019 see page 29
http://slidepdf.com/reader/full/see-page-29 220/260
Aerobic biotrickling filtration for biogas desulfurization
190
Figure 9.7 Sulfur mass balance from days 660 to 990 of operation.
Results obtained during starvation experiments (E3-1 to E3-4 and E3-6)
are detailed in Table 9.2. The average and the initial value of the biosulfur
consumption rate (-pS-S0) were calculated for each experiment according to
Equation 23.
Table 9.2 Biosulfur consumption during starvation experiments
EXP Days of
operation (*)
-pS-S0 average
(g S-S0·m
-3·h
-1)
-pS-S0 initial
(g S-S0·m
-3·h
-1)
S0 consumed
(g S-S0)
C1 256 – 263 -43.6 -100.6 17.58
C2 385 – 393 -22.2 -192.9 10.22
C3 453 – 467 -13.3 -36.35 10.72
C4 491 – 498 -7.5 -27.9 2.59
C6 533 – 550 -66.0 -99.6 30.41
* at acidic pH (after 440 days at neutral pH operation).
Time (days)
660 690 720 750 780 810 840 870 900 930 960 990
S u l p h u r ( g )
0
100
200
300
1000
1500
2000
2500
[ H 2 S ] i n ( p p m v
)
0
2000
4000
6000
8000
10000
12000
S-H2S removed (cumulative)
S-SO42-
produced (cumulative)
S-S0
produced (cumulative)
H2S in
Time (days)
660 690 720 750 780 10 840 870 900 930 60 990
S u l p h u r ( g )
0
100
200
300
1000
1500
000
2500
[ H 2 S ] i n ( p p m v
0
2000
4000
6000
8000
10000
12000
S-H2S removed (cumulative)
S-SO42-
produced (cumulative)
S-S produced (cumulative)
H2S in

8/17/2019 see page 29
http://slidepdf.com/reader/full/see-page-29 221/260
9. Acidic H2S biotrickling filtration
191
Results of experiment E3-5 are not shown because no starvation regime
was performed during this experiment. Instead, a sudden increase in the
biogas inlet H2S concentration was performed, as indicated in Table 9.1. A
total production of 69 g S-S0 was obtained during the complete experiment
E3-5, with average pS-S0 of 82.1 g S-S
0·m
-3·h
-1 for 6,000 ppmv of H2S
(157.51 g S-H2S·m-3·h-1) and 160.1 g S-S0
·m-3·h-1 for 10,000 ppmv of H2S
(262.54 g S-H2S·m-3·h-1).
Looking at the starvation experiments results (E3-1 to E3-4), it can be
inferred that the capacity of oxidation of the accumulated biosulfur inside
the bed decreased during the long-term operation, as a consequence of the
effect of the sulfur accumulation inside the bed, as shown in Figure 9.8.
Figure 9.8 Biosulfur consumption rate during starvation experiments
It has been reported that the accumulation of biomass inside biofilters
and BTFs leads to a lost in performance because the related undesired
effects produced mainly by the porosity and tortuosity changes inside the
packed bed (Dorado et al., 2009; Dumont et al., 2012). Also, biomass and
solids accumulation are related to the increase of the pressure drop and tothe diminishing of the O2 spread inside the biofilm (Dorado et al, 2010;
S
0
cumulative (g S-S
0
)
0 50 100 150 200 250
- p S - S
0 ( g
S - S
0 ·
m -
3 ·
h - 1 )
-50
-40
-30
-20
-10
0
10
20
30
40
50
cumulative g S-S )
0 50 100 50 200 250
- p S -
g S - S
·
-
·
- )
-50
-40
-30
-20
-10
0
10
20
30
40
50

8/17/2019 see page 29
http://slidepdf.com/reader/full/see-page-29 222/260
Aerobic biotrickling filtration for biogas desulfurization
192
Mannuci et al., 2012; Andreasen et al., 2012). Except for the high initial
velocity of S0 consumption obtained during E3-2, this parameter also tends
to decrease along the reactor operation. High values of initial and average
biosulfur consumption rate were obtained during experiment E3-6 because
of the increment in the bacterial community produced by the high loads of
H2S treated. In this way, the biosulfur oxidation capacity of the reactor was
improved, reaching values comparable to those obtained during experiment
E3-1, performed more than 9 months before. Visual verification of biosulfur
accumulation inside the filter bed was obtained during biomass sampling
procedures, as shown in Figure 9.9.
Figure 9.9 Images of biomass and solids sampling after 317 days at acidic pH
b o t t o m s e c t i o n
m i d d l e s e c t i o n
t o p s e c t i o n

8/17/2019 see page 29
http://slidepdf.com/reader/full/see-page-29 223/260
9. Acidic H2S biotrickling filtration
193
Also, evidence of corrosion of the packing material was observed during
biomass sampling procedures (Figure 9.10), since 317 days after the
transition to acidic pH (757 days of total operation).
Figure 9.10 Image of packing material after 317 days at acidic pH
The applied metallic packing material (AISI 304) is not recommended for
acidic operation in corrosive environments as in the case of the studied
operation, even when RE values during the long-term performance kept at
values higher than 99% for the reference conditions. Instead, plastic
material is supposed to avoid all corrosion problems inside the filter bed,
even when biomass sampling procedure must be improved for recovering
viable samples from the plastic surface. Overall, obtained results from
starvation experiments indicated that real-operation situations like biogas
feeding interruption can be beneficial for the system operation because of
the consumption of the accumulated biosulfur, as suggested previously for
neutrophilic pH conditions for comparable conditions as in this study
(Fortuny et al., 2010). However further research is needed to asses the
system behavior under starvation periods considering also the interruption
of the aeration supply system.
gas inlet section

8/17/2019 see page 29
http://slidepdf.com/reader/full/see-page-29 224/260
Aerobic biotrickling filtration for biogas desulfurization
194
Adittionaly, the study of the solids sample obtained at the end of the BTF
operation is being performed by X-ray diffraction analysis, in order to
identify the composition of the solid phase accumulated inside the filter bed.
9.5 Conclusions
Overall, results showed that the desulfurization of high loaded H2S
biogas under acidic pH conditions is feasible in aerobic biotrickling filters
and its performance comparable to that at neutral pH. The reactor
performance was successfully sustained after the pH transition reported in
Chapter 7. Moreover, the study of the H2S elimination profile along the filterbed indicated that the elimination of H2S was done mostly at the first third of
the filter bed, close to the gas inlet, even when the counter-current
operation mode of the studied BTF suggested an unfavorable O2/H2S ratio
at this point. The aeration system characteristic of the experimental setup
herein studied was suggested as the probable reason for such high
desulfurizing capacity at the bottom part of the filter bed.
Also, H2S starvation periodical regime was showed as an interesting S0
clogging control strategy. Further research is recommended in order to
establish a relationship between total accumulated elemental sulfur inside
the filter bed and the elemental sulfur oxidation to sulfate under H2S
restriction in gas feeding. Moreover, the studied metallic (AISI 304) Pall
rings is not recommended for acidic H2S biotrickling filtration at long-term
operation under high loads of H2S, because of the deterioration of the
packing elements after corrosion. Instead, plastic random packing material
is recommended for further applications.

8/17/2019 see page 29
http://slidepdf.com/reader/full/see-page-29 225/260
10
conclusions and future work

8/17/2019 see page 29
http://slidepdf.com/reader/full/see-page-29 226/260
Aerobic biotrickling filtration for biogas desulfurization
196
W hen ever y t hi ng i s easy , one qui ckly get s st upi d.
M ax i m or k y
N izhny N ovgor od, 1868 Gor ki -L eni nskiy e, 1936

8/17/2019 see page 29
http://slidepdf.com/reader/full/see-page-29 227/260
197
10 Conclusions and future work
10.1 General conclusions
An analytical system based on a flow injection analysis technique, was
successfully validated for the on-line monitoring of the studied BTF, by the
real-time determination of total dissolved sulfide (in liquid phase) and H2S
(in gas phase). The analytical system, based on an ISE of Ag2S sensible to
sulfide, exhibited the advantages of flow-based analyzers, such as
reliability, repetitivity and stability of the analytical response, high analytical
frequency with low sampling requirements, wide analytical range and
overall low cost for the long-run operation. The lifetime of the constructed
tubular electrodes showed exceptionally high and, together with the
robustness of the tubular-type electrodes, represents a significant
competitive advantage when facing the application of chemical sensors in
real monitoring systems. Moreover, the pre-treatment steps proposed for
sulfide monitoring, comprising an in-line filtration system and a pH
adjustment system ensured the operation of the analyzer for continuous,
non-stop operation, during the on-line monitoring of diverse experimental
conditions, simulating in a good extent the real necessities of such kind of
systems at industrial scale. Regarding the on-line determination of H2S(g),
the proposed analytical system showed suitable for systems operating at
high H2S concentrations, such as biogas desulfurization, with the advantage
of presenting a wide operating range of analysis (
200 to 10,000 ppmv ofH2S). Also, the control system developed for this application resulted in a
convenient, user-friendly interface that offered the possibility of the
unattended operation of the analytical system, a highly valuable feature for
the use of the analyzer in real monitoring applications. Moreover, the
proposed analytical system for H2S/sulfide determination was consistently
applied during real monitoring episodes during the execution of the
experiments at both neutral and acidic pH operation of the studied BTF.

8/17/2019 see page 29
http://slidepdf.com/reader/full/see-page-29 228/260
Aerobic biotrickling filtration for biogas desulfurization
198
The preliminary study on the on-line determination of SO42- shown that
the proposed analytical system was not suitable for real samples
monitoring, because of the extremely high response to interfering anions,
specifically for the species encountered in the liquid phase of the BTF,
mainly nitrate and chloride. However, developed electrodes were
considered applicable for synthetic samples containing sulfate as the only
analyte. Overall, conventional and tubular electrodes of polymeric liquid
membrane were constructed and characterized by direct potentiometry,
resulting in a simple, economic and fast analytical approach to the
preliminary study performed in this research. Different liquid sensing
cocktail formulations were studied, resulting in the best response for a
membrane composition slightly different to that recommended in literature.
Lipophilic additive was found to be crucial to electrode response, as well as
the presence of an active ionophore. The used ionophore (Sulfate-
Ionophore I – Selectophore™) is not recommended for the application
proposed, because of the mentioned low selectivity to the main analyte.
Instead, an alternative analytical method is proposed as future research
line, consisting in the optical detection of the precipitate formed by the
reaction of SO42- and BaCl2, based on the standard analytical procedure for
sulfate determination, implemented into a microfluidic platform.
Several important findings must be highlighted concerning the long-term
operation of the studied BTF. Overall, the selected random packing material
was found applicable for the desulfurization of synthetic high-loaded biogas
for both neutral and acidic pH, in terms of desulfurizing capacity of the
system. However, the metallic nature of the packing elements represented
a drawback, especially under acidic pH conditions, because of the related
negative effects of the packing material corrosion and the possible
detrimental effects of iron lixiviation over the biological activity. The start-up
of the system with unspecific inoculation was successfully conducted at
neutral pH (6.0 < pH < 6.50), applying a high H2S loading rate (51.48 g S-
H2S·m-3·h-1), at a reference gas contact time of around 130 s. Furthermore,
the manipulation of crucial operational parameters allowed the optimizationof the sulfate-producing capacity of the system, resulting in minimum

8/17/2019 see page 29
http://slidepdf.com/reader/full/see-page-29 229/260
199
elemental sulfur production, as required for the studies on the microbial
ecology of the system, performed concomitantly by others (Rovira et al.,
2010; Bezerra et al., 2013). Also, the oxygen load, representing the
biologically available oxygen, was confirmed as a key parameter for the
control of the sulfate/elemental sulfur production in this kind of reactors. The
neutral pH operation was successfully conducted up to 440 days of
operation, with H2S removal capacity close to 100% for the reference
conditions. Also, experiments performed to investigate the system behavior
in front of the H2S load and the gas contact time confirmed that the main
limiting proces in this kind of systems is related to mass transfer limitations.
During the steady-state operation at neutral pH, the execution of
experiments on the co-treatment of H2S and CH3SH shown that the
simultaneous removal of both pollutants was feasible in aerobic BTFs, with
no detrimental effects in the removal of H2S by the presence of CH3SH at
concentrations normally found in biogas. In contrary, an interesting
beneficial effect of filter bed unclogging was found by the chemical reaction
of CH3SH with elemental sulfur accumulated inside the reactor. Results
suggested a wider application field for this kind of systems performing in
real biogas treatment plants in which the natural presence of CH3SH could
represent an operational advantage.
The gradual, uninterrupted operational transition to acidic pH (2.50 < pH
< 2.75) was performed after 440 days of operation at neutral pH. Overall
results demonstrated a high adaptation of the system, with almost no
reduction on the desulfurizing capacity of the BTF under reference
conditions. The robustness of the BTF system was also verified by the high
recovery capacity after transitory changes on the load and gas contact time.
Overall, results showed that the desulfurization of high loaded H2S biogas
under acidic pH conditions is feasible in aerobic biotrickling filters, with a
global performance comparable to that previously obtained at neutral pH.
The H2S elimination profile investigation along the filter bed height indicated
that almost 70 – 80% of the H2S removal took place at the first third of thefilter bed, close to the gas inlet. Also, during the steady-state operation at

8/17/2019 see page 29
http://slidepdf.com/reader/full/see-page-29 230/260
Aerobic biotrickling filtration for biogas desulfurization
200
acidic pH, the execution of periodical H2S starvation experiments over an
extended period, suggested that the consumption of the accumulated
biosulfur inside the filter bed should be considered as a control strategy
against sulfur-clogging episodes, by the biological S0 oxidation. Finally,
even when no desulfurizing capacity loss was verified over the extended
990-days operation of the BTF, the applied metallic (AISI 304) Pall rings is
not recommended for acidic H2S biotrickling filtration at long-term operation,
especially under high loads of H2S, because of the deterioration of the
packing elements after corrosion. Instead, plastic random packing material
is recommended for further applications.
10.2 Future research recommendations
After the execution of the experiments reported in this work and after the
assessment of the long-term operation of the studied BTF, some future
research recommendations are suggested, dividing the proposed actions in
two main categories: Monitoring and Performance, in accordance with the
main objectives of this work.
Monitoring
The improvement of the proposed monitoring systems, for H2S/sulfide
on-line determination and for sulfate determination, should focus on the
following issues:
• Improvement of the pre-treatment filtration step used for the continuous
operation of the FIA/GD-CFA system, in order to facilitate the
integration of the analytical system to different BTFs configurations. A
self-cleaning filtration device should be applied, including a preventive
trap for solids separation before entering the filtration device itself.
• Optimization of the gas diffusion cell is suggested for diminishing the
analytical frequency of the CFA system. Also, other diffusion membrane

8/17/2019 see page 29
http://slidepdf.com/reader/full/see-page-29 231/260
201
composition and configuration should be experimented for stabilizing
the required conditioning time before analysis.
• Enhancement of the gas-phase automatic sampling procedure under
continuous operation by the inclusion of an automated valve. This
feature offers an extended unattended period operation, besides
representing a safer operation.
• Further research oriented to the miniaturization of the analytical system
for H2S/TDS determination is highly recommended, including the
possibility of developing a commercial prototype of the complete
analytical system. Interest on the modularization of the proposed
system has been already showed by few technical consults coming
from real industrial applications.
• For overcoming the significant drawbacks faced during the development
of the proposed analytical system for sulfate determination, a low
temperature cofired ceramics (LTCC) miniaturized device is suggested
as an alternative analytical system. This strategy is based on the optical
determination of BaSO4 obtained by the standard analytical procedure
based on SO42- precipitation by reaction with BaCl2.
• The preliminary study on the application of the LTCC device was
already started during this research, in collaboration with the Sensors
and Biosensors Research Group (Department of Chemistry of this
University), including the design of a first prototype. Further research is
needed for the optimization of the optical detection system and the
operational conditions of such analyzer.
Performance
The amelioration of the BTF performance as well as the better
understanding of the biological aerobic desulfurization process should be
obtained from the research intensification on the following proposed topics:
• Optimization of the oxygen supply to the system, including the
betterment of the O2 transfer device. Also, for overcoming the

8/17/2019 see page 29
http://slidepdf.com/reader/full/see-page-29 232/260
Aerobic biotrickling filtration for biogas desulfurization
202
limitations faced during this study, the measurement of O2
concentration in gas phase is suggested as an improvement, which
could allow the precise calculation of mass balances.
• Intensification on the study of the biological desulfurization process,
performed with reliable mass balance calculations, with the objective of
implementing an automated O2/H2S control system.
• Upgrading of the preliminary study on the calculation of the proton
production rate (HPR), initiated during this research (results not shown).
The implementation of automated HPR calculations should be possible
once O2 and CO2 mass balance were accurately performed.
• Further investigation is suggested on the effect of the gas/liquid
circulation mode inside the BTF. In this sense, the operation of the BTF
in co-current mode (both gas and liquid phase in down-flow mode)
could help understanding the mass transfer limitation effect identified
under counter-current operation.
• Continuation of the initiated studies on the effect of the long-term pH
changes is required to establishing the microbial community sensitivity
to such operational conditions. Also, the effect of short-term pH
variation is suggested to investigate the operational limits of the system.
• Further research focused on the oxygen balance along the filter bed
height is suggested as a tool to elucidate the mechanism of the
observed H2S removal stratification.
• The application of a random packing material is highly recommended to
overcoming the problems found with metallic material related to
corrosion and trace metal lixiviation. Plastic PP 5/8” Pall rings were
selected at the end of this research as the suggested alternative
packing material for future operation.
• Intensification on the study of the effect of starvation regimes is
recommended under different conditions, to elucidate the biosulfur
consumption mechanism and to promote the optimal conditions for
obtaining the filter bed unclogging.

8/17/2019 see page 29
http://slidepdf.com/reader/full/see-page-29 233/260
11
references

8/17/2019 see page 29
http://slidepdf.com/reader/full/see-page-29 234/260
Aerobic biotrickling filtration for biogas desulfurization
204
I t hi nk li ke a geni us, I wr it e li ke a
di st i ngui shed aut hor and I speak li ke a chi ld.
V l a d i m i r V N a bok ov
Saint Petersburg, 1899 M ont r eux, 1977
8/17/2019 see page 29
http://slidepdf.com/reader/full/see-page-29 235/260
205
11 References
batzoglou N, Boivin S (2009) A review of biogas purification processes.Biofuels, Bioproducts and Biorefining, 3, 42-71.
ACGIH – American Conference of Governmental Industrial Hygienists. (1996)
TLV® / BEI® Introduction – Last updated 21.Aug.2012.
(http://www.acgih.org/Products/tlv_bei_intro.htm, 19.Dec.2012).
Alegret S, Alonso J, Bartroli J, Lima JLFC, Machado AASC, Paulis JM (1985)
Flow-through sandwich PVC matrix membrane electrode for flow injection
analysis. Analytical Letters, 18, 2291-2303.
Andreasen RR, Nicolai RE, Poulsen TG (2012) Pressure drop in biofilters as
related to dust and biomass accumulation. Journal of Chemical Technology
and Biotechnology, 87, 806-816.
APHA – American Public Health Association (1980) Standard methods for the
examination of water and wastewater, 15th Ed. Method 426C – Sulfate.
Washington, DC, USA.
APHA (2006a) Standard methods for the examination of water and wastewater,
21st Ed. Method 4500-S2- – Sulfide. Washington, DC, USA.
APHA (2006b) Standard methods for the examination of water and wastewater,
21st Ed. Method 2540 - Solids. Washington, DC, USA.
Arellano-Garcia L, Gonzalez-Sanchez A, Baquerizo G, Hernandez-Jimenez S,
Revah S (2009) Treatment of carbon disulfide and ethanethiol vapors in
alkaline biotrickling filters using an alkaliphilic sulfo-oxidizing bacterial
consortium. Journal of Chemical Technology and Biotechnology, 85, 328-335.
Aroca G, Urrutia H, Nuñez D, Oyarzun P, Arancibia A, Guerrero K (2007)
Comparison on the removal of hydrogen sulfide in biotrickling filters inoculated
with Thiobacillus thioparus and Acidithiobacillus thiooxidans. Electronic
Journal of Biotechnology, 10(4), 514-520.
ATSDR – Agency for Toxic Substances and Disease Registry (1992) Toxicological
Profile for Methyl Mercaptan. US Department of Health and Human Services,
Atlanta, USA.
(http://www.atsdr.cdc.gov/toxprofiles/tp139.pdf, 18.Jan.2013).
ATSDR (2006) Toxicological Profile for H2S. US Department of Health and Human
Services, Atlanta, USA.(http://www.atsdr.cdc.gov/toxprofiles/tp114.pdf, 18.Jan.2013).
aeza M (2004) Novel approach for automated flow analyzers applied to
environmental analysis. PhD Thesis, UAB, Spain.
(available at: http://hdl.handle.net/10803/3284).
Bailon LA (2007) An innovative biotrickling filter for H2S removal from biogas. In
Proceedings of the II International Congress on Biotechniques for Air Pollution
Control, A Coruña, Spain, 215-224.
Bakker E, Buhlmann P, Pretsch E (1999) Polymer membrane ion-selective
electrodes – What are the limits? Electroanalysis, 11(13), 915-933.
A
B

8/17/2019 see page 29
http://slidepdf.com/reader/full/see-page-29 236/260
Aerobic biotrickling filtration for biogas desulfurization
206
Barbosa V, Hobbs P, Sneath R, Burgess J, Callan J, Stuetz R (2006) Investigating
the capacity of an activated sludge process to reduce volatile organic
compounds and odor emissions. Water Environment Research, 78(8),
842-851.
Barquero EJ (2001) Design, construction and evaluation of analyzers for
environmental monitoring. PhD Thesis, UAB, Spain.(available at: http://hdl.handle.net/10803/3179).
Benschop A, Ghonim Z, Wolschlag L, van Heeringen G (2004) Biological process
removes sulfur from three refinery streams. Proceedings of the ERTC 9th
Annual Meeting. Prague, Czech Republic, 1-17.
Bentley R, Chasteen TG (2004) Environmental VOSCs – formation and
degradation of dimethyl sulfide, methanethiol and related materials.
Chemosphere, 55, 291-317.
Berrocal MJ, Cruz A, Badr IHA, Bachas LG (2000) Tripodal ionophore with sulfate
recognition properties for anion-selective electrodes. Analytical Chemistry, 72,
5295-5299.Bezerra T, Rovira R, Montebello AM, Llagostera M, Lafuente J, Campoy S, Gabriel
D (2013) Metagenomics and metatranscriptomics of a H2S desulfurizing
biotrickling filter. Proceedings of the 5th IWA Conference on Odours and Air
Emissions, March 4-7, San Francisco, California, USA.
Bruser T, Lens PNL, Truper HG (2004) The biological sulfur cycle. In:
Environmental technologies to treat sulfur pollution. Principles and
engineering. Lens P, Hulshoff Pol L, Eds. IWA Publishing, London, UK.
Buhlmann P, Nishizawa S, Xiao KP, Umezawa Y (1997) Strong hydrogen bond-
mediated complexation of H2PO4- by neutral bis-thiourea hosts. Tetrahedron,
53(5) 1647-1654.
Buhlmann P, Umezawa Y, Rondinini S, Vertova A, Pigliucci A, Bertesago L (2000)
Lifetime of ion-selective electrodes based on charged ionophores. Analyticial
Chemistry, 72, 1843-1852.
Burgess JE, Parsons SA, Stuetz RM (2001) Developments in odour control and
waste gas treatment biotechnology: a review. Biotechnology Advances, 19,
35-63.
Busca G, Pistarino C (2003) Technologies for the abatement of sulfide compounds
from gaseous streams: a comparative overview. Journal of Loss Prevention in
the Process Industries, 16, 363-371.
aceres M, Morales M, Martin RS, Urrutia H, Aroca G (2010) Oxidation of
volatile reduced sulfur compounds in biotrickling filter inoculated with
Thiobacillus thioparus. Electronic Journal of Biotechnology, 13, 5, DOI:
10.2225/vol13-issue5-fulltext-9.
Card T (2001) Chemical odour scrubbing systems. In: Odours in wastewater
treatment: measurement, modeling and control. Stuetz R and Frechen FB
(Editors) – 1st Edition, IWA Publishing, London, UK.
Catalan LJJ, Liang V, Jia CQ (2006) Comparison of various detection limit
estimates for volatile sulfur compounds by gas chromatography with pulsed
flame photometric detection. Journal of Chromatography A, 1136, 89-98.
Cerda V, Estela JM, Forteza R, Cladera A, Becerra E, Altimira P, Sitjar P (1999)Flow techniques in water analysis. Talanta, 50, 695-705.
C
8/17/2019 see page 29
http://slidepdf.com/reader/full/see-page-29 237/260
11. References
207
Cesario MT, Beverloo WA, Tramper J, Beeftink HH (1997) Enhancement of gas-
liquid mass transfer rate of apolar pollutants in the biological waste gas
treatment by a dispersed organic solvent. Enzyme and Microbial Technology,
21, 578-588.
Chaiprapat S, Mardthing R, Kantachote D, Karnchanawong S (2011) Removal of
hydrogen sulfide by complete aerobic oxidation in acidic biofiltration. ProcessBiochemistry, 46, 344-352.
Cho KS, Ryu HW, Lee NY (2000) Biological deodorization of hydrogen sulfide
using porous lava as a carrier of Thiobacillus thiooxidans. Journal of
Bioscience and Bioengineering, 90(1), 25-31.
Ciccoli R, Cigolotti V, Lo Presti R, Massi E, McPhail SJ, Monteleone G, Moreno A,
Naticchioni V, Paoletti C, Simonetti E, Zaza F (2010) Molten carbonate fuel
cells fed with biogas: combating H2S. Waste Management, 30, 1018-1024.
Coll C, Labrador RH, Martinez-Mañez R, Soto J, Sancenon F, Segui MJ, Sanchez
E (2005) Ionic liquids promote selective responses towards the highly
hydrophilic anion sulfate in PVC membrane ion-selective electrodes. ChemicalCommunications, 24, 3033-3035.
Cox HHJ, Deshusses MA (2002) Co-treatment of H2S and toluene in a biotrickling
filter. Chemical Engineering Journal, 87, 101-110.
Coyne L, Kuhlman C, Zovack N (2011) The stability of sulfur compounds, low
molecular weight gases and VOCs in five air sample bag materials. SKC Inc.,
Publication 1805REV1208.
(www.skcinc.com/instructions/1805.pdf, 16.Apr.2013).
atta I, Fulthorpe RR, Sharma S, Allen DG (2007) High-temperature biotrickling
filtration of hydrogen sulfide. Applied Microbiology and Biotechnology, 74,
708-716.
de Angelis A (2012) Natural gas removal of hydrogen sulfide and mercaptans.
Applied Catalysis B: Environmental, 113-114, 37-42.
de Bo I, van Langenhove H, Heyman J (2002) Removal of dimethyl sulfide from
waste air in a membrane bioreactor. Desalination, 148, 281-287.
de Marco R, Clarke G, Pejcic B (2007) Ion-selective electrode potentiometry in
environmental analysis. Electroanalysis, 19(19-20), 1987-2001.
Dehouk E, Chevrier V, Gaudin A, Mangold N, Mathe PE, Rochette P (2012)
Evaluating the role of sulfide-weathering in the formation of sulfates or
carbonates on Mars. Geochimica et Cosmochimica Acta, 90, 47-63.
Delgado L, Masana M, Baeza M, Gabriel D, Alonso J (2006) New approach for on-
line simultaneous monitoring of hydrogen sulfide and sulfide in gas-phase
bioreactors for biogas treatment. In: Proceedings of the Flow Analysis 10th
International Conference, Porto, Portugal, p.148.
Detchanamurthy S, Gostomski PA (2012) Biofiltration for treating VOCs: an
overview. Reviews in Environmental Science and Biotechnology, 11, 231-241.
Deublein D, Steinhauser A (2008) Biogas from waste and renewable resources,
Wiley-VCH Verlag GmbH & Co. KGaA, Weinheim, Germany.
Devinny JS, Deshusses MA, Webster TS (1999) Biofiltration for air pollution
control. CRC-Lewis Publishers, Boca Raton, Florida, USA.
Devinny JS, Ramesh J (2005) A phenomenological review of biofilter models.Chemical Engineering Journal, 113, 187-196.
D

8/17/2019 see page 29
http://slidepdf.com/reader/full/see-page-29 238/260
Aerobic biotrickling filtration for biogas desulfurization
208
Dilgin Y, Canarslan S, Ayyildiz O, Ertek B, Nisli G (2012) Flow injection analysis of
sulfide based on its photoelectrocatalytic oxidation at poly-methylene blue
modified glassy carbon electrode. Electrochimica Acta, 66, 173-179.
Dorado AD, Rodriguez G, Ribera G, Bonsfills A, Gabriel D, Lafuente J, Gamisans
X (2009) Evaluation of mass transfer coefficients in biotrickling filters:
experimental determination and comparison to correlations. ChemicalEngineering and Technology, 32(12), 1941-1950.
Dorado AD, Lafuente J, Gabriel D, Gamisans X (2010) The role of water in the
performance of biofilters: Parameterization of pressure drop and sorption
capacities for common packing materials. Journal of Hazardous Materials,
180, 693-702.
Duan HQ, Yan R, Koe LCC (2005) Investigation on the mechanism of H2S removal
by biological activated carbon in a horizontal biotrickling filter. Applied
Microbiology and Biotechnology, 69 (3), 350-357.
Duic N, Guzovic Z, Kafarov V, Klemes JJ, van Mathiessen B (2013) Sustainable
development of energy, water and environment systems. Applied Energy,101, 3-5.
Dumont E, Andres Y (2010) Evaluation of innovative packing materials for the
biodegradation of H2S: a comparative study. Journal of Chemical Technology
and Biotechnology, 85, 429-434.
Dumont E, Ayala-Guzman LM, Rodriguez-Susa MS, Andres Y (2012a) H2S
biofiltration using expanded schist as packing material: performance
evaluation and packed-bed tortuosity assessment. Journal of Chemical
Technology and Biotechnology, 87, 725-731.
Dumont D, Darracq G, Couvert A, Couriol C, Amrane A, Thomas D, Andres Y, Le
Cloirec P (2012b
) Hydrophobic VOC absorption in two-phase partitioningbioreactors; influence of silicone oil volume fraction on absorber diameter.
Chemical Engineering Science, 71, 146-152.
gorov V, Rakhman’ko E, Okaev E, Nazarov V, Pomelyenok E, Pavlova T
(2004) Novel anion exchangers for electrodes with improved selectivity to
divalent anions. Electroanalysis , 16(17), 1459-1461.
Egorov VV, Nazarov VA, Okaev EB, Pavlova TE (2006) A new sulfate-selective
electrode and its use in analysis. Journal of Analytical Chemistry, 61(4),
382-388.
Elias A, Barona A, Arreguy A, Rios J, Aranguiz I, Peñas J (2002) Evaluation of a
packing material for the biodegradation of H2S and product analysis. Process
Biochemistry, 37, 813-820.
Epelman S, Tang WHW (2012) H2S – The newest gaseous messenger on the
block. Journal of Cardiac Failure, 18(8), 597-599.
Ertek B, Vu DL, Cervenka L, Dilgin Y (2012) Flow injection amperometric detection
of sulfide using a prussian blue modified glassy carbon electrode. Analytical
Sciences, 28, 1075-1080.
Estrada JM, Kraakman NJR, Lebrero R, Muñoz R (2012) A sensitivity analysis of
process design parameters, commodity prices and robustness on the
economics of odour abatement technologies. Biotechnology Advances, 30,
1354-1363.
E
8/17/2019 see page 29
http://slidepdf.com/reader/full/see-page-29 239/260
11. References
209
European Commission (2011) Communication from the Commission to the
European Parliament, the Council, the European Economic and Social
Committee and the Committee of the Regions. Energy Roadmap 2050.
Brussels, 15.12.2011. COM(2011) 885 final.
(http://ec.europa.eu/energy/energy2020/roadmap/index_en.htm, 6.Jan.2013).
Evgenev MI, Garmonov SY, Shakirova LS (2001) Flow-Injection analysis ofpharmaceuticals. Journal of Analytical Chemistry, 56(4), 313-323.
aridbod F, Ganjali MR, Dinarvand R, Norouzi P (2008) Developments in the
field of conducting and non-conducting polymer based potentiometric
membrane sensors for ions over the past decade. Sensors, 8, 2331-2412.
Felix FS, Angnes L (2010) Fast and accurate analysis of drugs using amperometry
associated with flow injection analysis – Review. Journal of Pharmaceutical
Sciences, 99(12), 4784-4804.
Ferrer L, Miro M, Estela JM, Cerda V (2007) Analytical methodologies for reliable
sulfide determinations in aqueous matrices exploiting flow-based approaches.Trends in Analytical Chemistry, 26(5), 413-422.
Fibbioli M, Berger M, Schmidtchen FP, Pretsch E (2000) Polymeric membrane
electrodes for monohydrogen phosphate and sulfate. Analytical Chemistry, 72,
156-160.
Fine GF, Cavanagh LM, Afonja A, Binions R (2010) Metal oxide semi-conductor
gas sensors in environmental monitoring. Sensors, 10, 5469-5502.
Firouzabadi S, Razavipanah I, Zhiani R, Ghanei-Motlagh M, Reza-Salavati M
(2013) Sulfate-selective electrode based on a bis-thiourea ionophore.
Monatshefte für Chemie – Chemical Monthly, 144, 113-120.
Fortuny M, Baeza JA, Gamisans X, Casas C, Lafuente J, Deshusses MA, Gabriel
D (2008) Biological sweetening of energy gases mimics in biotrickling filters.
Chemosphere, 71, 10-17.
Fortuny M, Guisasola A, Casas C, Gamisans X, Lafuente J, Gabriel D (2010)
Oxidation of biologically produced elemental sulfur under neutrophilic
conditions. Journal of Chemical Technology and Biotechnology, 85, 378-386.
Fortuny, M, Gamisans X, Deshusses MA, Lafuente J, Casas C, Gabriel D (2011)
Operational aspects of the desulfurization process of energy gases mimics in
biotrickling filters. Water Research, 45, 5665-5674.
abriel D, Baeza J, Valero F, Lafuente J (1998) A novel FIA configuration for
the simultaneous determination of nitrate and nitrite and its use for monitoring
an urban waste water treatment plant based on N/D criteria. Analytica Chimica
Acta, 359, 173-183.
Gabriel D, Deshusses MA (2003a) Performance of a full-scale biotrickling filter
treating H2S at a gas contact time of 1.6 to 2.2 seconds. Environmental
Progress, 22, 111-118.
Gabriel D, Deshusses MA (2003b) Retrofitting existing chemical scrubbers to
biotrickling filters for H2S emission control, Proceedings of the National
Academy of Sciences USA, 100, 6308-6312.
Gabriel D, Deshusses MA (2004) Technical and economical analysis of the
conversion of a full-scale scrubber to a biotrickling filter for odor control. WaterScience and Technology, 50(4), 309-318.
F
G

8/17/2019 see page 29
http://slidepdf.com/reader/full/see-page-29 240/260
Aerobic biotrickling filtration for biogas desulfurization
210
Gabriel D, Deshusses MA, Gamisans X (2013) Desulfurization of biogas in
biotrickling filters. In: Air Pollution Prevention and Control: Bioreactors and
Bioenergy, John Wiley and Sons Ltd., 513-523.
Gadzekpo VPY, Christian GD (1984) Determination of selectivity coefficients of
ion-selective electrodes by a matched-potential method. Analytical Chimica
Acta, 164, 279-282.Ganjali MR, Naji L, Poursaberi T, Taghizadeh M, Pirelahi H, Yousefi M, Yeganeh-
Faal A, Shamsipur M (2002) Novel sulfate ion-selective polymeric membrane
electrode based on a derivative of pyrilium perchlorate. Talanta, 58, 359-366.
Ganjali MR, Pourjavid MR, Shamsipur M, Poursaeri T, Rezapour M, Javanbakht
M, Sharghi H (2003) Novel membrane potentiometric sulfate ion sensor based
on zinc-phthalocyanine for the quick determination of trace amounts of sulfate.
Analytical Sciences, 19, 995-999.
Garcia-Calzada M, Marban G, Fuertes AB (1999) Potentiometric determination of
sulfur in solid samples. Analytica Chimica Acta, 380, 39-45.
Gonzalez-Sanchez A, Revah S, Deshusses MA (2008) Alkaline biofiltration of H2Sodors. Environmental Science and Technology, 42, 7398-7404.
Gracia A, Barreiro-Hurle J, Perez y Perez L (2012) Can renewable energy by
financed with higher electricity prices? Evidence from a Spanish region.
Energy Policy, 50, 784-794.
ansen EH (1996) Principles and applications of flow injection analysis in
biosensors – Critical review. Journal of Molecular Recognition, 9, 316-325.
Hara H, Takahashi K, Ohkubo H (1994) Nitrate ion-selective field effect transistor
based on bis(bathocuproin)-copper(I) nitrate dissolved in solid solvents.
Analytical Chimica Acta, 290(3), 329-333.
Harkness AC, Murray FE (1970) Oxidation of methylmercaptan with molecular
oxygen in aqueous solution. Atmospheric Environment, 4(4), 417-424.
Hartikainen T, Martikainen PJ, Olkkonen M, Ruuskanen J (2002) Peat biofilters in
long-term experiments for removing odorous sulfur compounds. Water, Air
and Soil Pollution, 133(1-4), 335-348.
Hennig C, Gawor M (2012) Bioenergy production and use: Comparative analysis
of the economic and environmental effects. Energy Conversion and
Management, 63, 130-137.
Hernandez J (2012) Study on bioreactors configurations and packing materials for
the treatment of complex mixtures of organic and inorganic volatile
compounds. PhD Thesis, UAB, Spain.
(available at: http://hdl.handle.net/10803/42292).
Hernandez SC, Kakoullis JJ, Lim JH, Mubeen S, Hangarter CM, Mulchandani A,
Myung NV (2012) Hybrid ZnO/SWNT nanostructures based gas sensor.
Electroanalysis, 24(7), 1613-1620.
Hirai M, Ohtake M, Shoda M (1990) Removal kinetics of hydrogen sulfide,
methanethiol and dimethyl sulfide by peat biofilters. Journal of Fermentation
and Bioengineering, 70(5), 334-339.
Horikawa MS, Rossi F, Gimenes ML, Costa CMM, da Silva MGC (2004) Chemical
absorption of H2S for biogas purification. Brazilian Journal of Chemical
Engineering, 21(3), 415-422.
H

8/17/2019 see page 29
http://slidepdf.com/reader/full/see-page-29 241/260
11. References
211
HSDB – Hazardous Substances Databank, Methyl Mercaptan (2003) National
Library of Medicine, Bethesda, MD, USA.
(http://toxnet.nlm.nih.gov/cgibin/sis/search/hsdb:term+DOCNO+813, 18.Jan.2013).
HSDB, Hydrogen sulfide (2012) National Library of Medicine, Bethesda, MD, USA.
(http://toxnet.nlm.nih.gov/cgi-bin/sis/search/f?./temp/SGTglh:1, 18.Jan.2013).
NSHT – Instituto Nacional de Seguridad e Higiene en el Trabajo (2012)
Límites de Exposición Profesional para Agentes Químicos en España.
Ministerio de Empleo y Seguridad Social, Madrid, España.
Iranpour R, Cox HHJ, Deshusses MA, Schroeder ED (2005) Literature review of
air pollution control biofilters and biotrickling filters for odor and volatile organic
compound removal. Environmental Progress, 24(3), 254-267.
Islander RL, Devinny JS, Mansfeld F, Postyn A, Hong S (1991) Microbial ecology
of crown corrosion in sewers. Journal of Environmental Engineering, 117,
751-771.
anssen AJH, Sleyster R, van der Kaa C, Jochemsen A, Bontsema J, Lettinga
G (1995) Biological sulphide oxidation in a fed-batch reactor. Biotechnology
and Bioengineering, 47, 327-333.
Janssen AJH, Ma SC, Lens P, Lettinga G (1997) Performance of a sulfide-
oxidizing expanded-bed reactor supplied with dissolved oxygen.
Biotechnology and Bioengineering, 53, 32-40.
Janssen AJH, Lens PNL, Stams AJM, Plugge CM, Sorokin DY, Muyzer G, Dijkman
H, van Zessen E, Luimes P, Buisman CJN (2008) Application of bacteria
involved in the biological sulfur cycle for paper mill effluent purification.
Science of the Total Environment, 407, 1333-1343.
Jensen HS, Lens PNL, Nielsen JL, Bester K, Nielsen AH, Hvitved-Jacobsen T,
Vollertsen J (2011) Growth kinetics of hydrogen sulfide oxidizing bacteria in
corroded concrete from sewers. Journal of Hazardous Materials, 189,
685-691.
Jia C, Wu B, Li S, Huang X, Yang XJ (2010) Tetraureas versus triureas in sulfate
binding. Organic Letters, 12(24), 5612-5615.
Jin Y, Veiga MC, Kennes C (2007) Co-treatment of hydrogen sulfide and methanol
in a single-stage biotrickling filter under acidic conditions. Chemosphere, 68,
1186-1193.
Johnston DT (2011) Multiple sulfur isotopes and the evolution of Earth’s surface
sulfur cycle. Earth-Science Reviews, 106, 161-183.
elly DP (1999) Thermodynamic aspects of energy conservation by
chemolithotrophic sulfur bacteria in relation to the sulfur oxidation pathways.
Archives Microbiology, 171, 219-229.
Kennes C, Veiga MC (2004) Fungal biocatalysts in the biofiltration of VOC-polluted
air. Journal of Biotechnology, 113, 305-319.
Kennes C, Rene ER, Veiga MC (2009) Bioprocesses for air pollution control.
Journal of Chemical Technology and Biotechnology, 84, 1419-1436.
Khalid A, Arshad M, Anjum M, Mahmood T, Dawson L (2011) The anaerobic
digestion of solid organic waste. Waste Management, 31, 1737-1744.
I
J
K

8/17/2019 see page 29
http://slidepdf.com/reader/full/see-page-29 242/260
Aerobic biotrickling filtration for biogas desulfurization
212
Kim S, Deshusses MA (2005) Understanding the limits of H2S degrading
biotrickling filters using a differential biotrickling filter. Chemical Engineering
Journal, 113, 119-126.
Kim S, Deshusses MA (2008a) Determination of mass transfer coefficients for
packing materials used in biofilters and biotrickling filters for air pollution
control. 1. Experimental results. Chemical Engineering Science, 63, 841-855.Kim S, Deshusses MA (2008b) Determination of mass transfer coefficients for
packing materials used in biofilters and biotrickling filters for air pollution
control. 2. Development of mass transfer coefficients correlations. Chemical
Engineering Science, 63, 856-861.
King PL, McLennan SM (2010) Sulfur on Mars. Elements, 6, 107-112.
Kolthoff IM, Sandell EB, Meehan EJ, Bruckenstein S (1969) Quantitative chemical
analysis, 4th Ed. Macmillan, New York, USA, p. 857.
Koseoglu S, Lai C, Ferguson C, Buhlmann P (2008) Response mechanism of ion-
selective electrodes based on a guanidine ionophore: an apparently “two-
thirds Nernstian” response slope. Electroanalysis, 20(3), 331-339.Kuenen JG (1975) Colourless sulphur bacteria and their role in the sulfur cycle.
Plant and Soil, 43, 49-76.
Kumar A, Dewulf J, van Langenhove H (2008) Membrane-based biological waste
gas treatment. Chemical Engineering Journal, 136, 82-91.
Kymalainen M, Lahde K, Arnold M, Kurola JM, Romantschuk M, Kautola H (2012)
Biogasification of biowaste and sewage sludge – Measurement of biogas
quality. Journal of Environmental Management, 95, 5122-5127.
afita C, Penya-Roja JM, Sempere F, Waalkens A, Gabaldon C (2012)
Hydrogen sulfide and odor removal by field-scale biotrickling filters: Influenceof seasonal variations of load and temperature. Journal of Environmental
Science and Health, Part A, 47, 970-978.
Lastella G, Testa C, Cornacchia G, Notornicola M, Voltasio F, Sharma VK (2002)
Anaerobic digestion of semi-solid organic waste: biogas production and its
purification. Energy Conversion and Management, 43, 63-75.
Lebrero R, Rodriguez E, Garcia-Encina PA, Muñoz R (2011) A comparative
assessment of biofiltration and activated sludge diffusion for odour abatement.
Journal of Hazardous Materials, 190, 622-630.
Lee EY, Lee NY, Cho KS, Ryu HW (2006) Removal of hydrogen sulfide by sulfate-
resistant Acidithiobacillus thiooxidans AZ11. Journal of Bioscience and
Bioengineering, 101(4), 309-314.
Li ZQ, Liu GD, Duan LM, Shen GL, Yub RQ (1999) Sulfate-selective PVC
membrane electrodes based on a derivative of imidazole as a neutral carrier.
Analytical Chimica Acta, 382, 165-170.
Liu C, Hayashi K, Toko K (2012) Au nanoparticles decorated polyaniline nanofiber
sensor for detecting volatile sulfur compounds in expired breath. Sensors and
Actuators B: Chemical, 161, 504-509.
Liu D, Feilberg A, Nielsen AM, Adamsen APS (2013) PTR-MS measurement of
partition coefficients of reduced volatile sulfur compounds in liquids from
biotrickling filters. Chemosphere, 90, 1396-1403.
Lomako SV, Astapovich RI, Nozdrin-Plotniskaya OV, Pavlova TE, Lei S, Nazarov
VA, Okaev EB, Rakhman'ko EM, Egorov VV (2006) Sulfate-selective
L

8/17/2019 see page 29
http://slidepdf.com/reader/full/see-page-29 243/260
11. References
213
electrode and its application for sulfate determination in aqueous solutions.
Analytical Chimica Acta, 562, 216-222.
ackowiak J (2011) Model for the prediction of liquid phase mass transfer of
random packed columns for gas-liquid systems. Chemical Engineering
Research and Design, 89, 1308-1320.Maestre JP, Rovira R, Alvarez-Hornos FJ, Fortuny M, Lafuente J, Gamisans X,
Gabriel D (2010) Bacterial community analysis of a gas-phase biotrickling filter
for biogas mimics desulfurization through the rRNA approach. Chemosphere,
80, 872-880.
Malhautier L, Gracian C, Roux JC, Fanlo JL, Le Cloirec P (2003) Biological
treatment process of air loaded with an ammonia and hydrogen sulfide
mixture. Chemosphere, 50, 145-153.
Manconi I, Carucci A, Lens P, Rossetti S (2006) Simultaneous biological removal
of sulfide and nitrate by autotrophic denitrification in an activated sludge
system. Water Science and Technology, 53, 91-99.Mannucci A, Munz G, Mori G, Lubello C (2012) Biomass accumulation modelling in
a highly loaded biotrickling filter for hydrogen sulphide removal. Chemosphere,
88, 712-717.
Martelli A, Testai L, Breschi MC, Blandizzi C, Virdis A, Taddei S, Calderone V
(2012) Hydrogen sulfide: novel opportunity for drug discovery. Medicinal
Research Reviews, 32(6), 1093-1130.
Martinez-Barrachina S, Alonso J, Matia Ll, Prats R, del Valle M (1999)
Determination of trace levels of anionic surfactants in river wáter and
wastewater by a flow injection analysis system with on-line preconcentration
and potentiometric detection. Analytical Chemistry, 71, 3684-3691.Mazloum-Ardakani M, Akrami Z, Mansournia M, Zare H (2006) Sulfate-selective
electrode based on a complex of copper. Analytical Science, 22, 673-678.
Mazloum-Ardakani M, Dehghan-Manshadi A, Bagherzadeh M, Kargar H (2012)
Impedimetric and potentiometric investigation of a sulfate anion-selective
electrode: experiment and simulation. Analytical Chemistry, 84, 2614-2621.
Melchert WR, Reis BF, Rocha FRP (2012) Green chemistry and the evolution of
flow analysis. A review. Analytica Cimica Acta, 714, 8-19.
Migdisov AA, Williams-Jones AE, Lakshtanov LZ, Alekhin YV (2002) Estimates of
the second dissociation constant of H2S from the surface sulfidation of
crystalline sulfur. Geochimica et Cosmochimica Acta, 66(10), 1713-1725.
Miro M, Frenzel W (2004) Automated membrane-based sampling and sample
preparation exploiting flow-injection analysis, TrAC, Trends in Analytical
Chemistry, 23, 624-636.
Miro M, Estela JM, Cerda V (2004) Application of flowing-stream techniques to
water analysis. Part II. General quality parameters and anionic compounds:
halogenated, sulfur and metalloid species. Talanta, 62, 1-15.
Miro M, Hansen EH (2012) Recent advances and future prospects of mesofluidic
Lab-on-a-Valve platforms in analytical sciences – A critical review. Analytica
Chimica Acta, 750, 3-15.
Mohammadzadeh F, Jahanshahi M, Rashidi AM (2012) Preparation of
nanosensors based on organic functionalized MWCNT for H2S detection.
Applied Surface Science, 259, 159-165.
M

8/17/2019 see page 29
http://slidepdf.com/reader/full/see-page-29 244/260
Aerobic biotrickling filtration for biogas desulfurization
214
Montebello AM, Baeza M, Lafuente J, Gabriel D (2010) Monitoring and
performance of a desulfurizing biotrickling filter with an integrated continuous
gas/liquid flow analyzer. Chemical Engineering Journal, 165, 500-507.
Montebello AM, Fernandez M, Almenglo F, Ramirez M, Cantero D, Baeza M,
Gabriel D (2012) Simultaneous methylmercaptan and hydrogen sulfide
removal in the desulfurization of biogas in aerobic and anoxic biotricklingfilters. Chemical Engineering Journal, 200-202, 237-246.
Morigi M, Scavetta E, Berrettoni M, Giorgetti M, Tonelli . (2001) Sulfate-selective
electrodes based on hydrotalcites. Analytical Chimica Acta, 439, 265-272.
Muñoz R, Daugulis AJ, Hernandez M, Quijano G (2012) Recent advances in two-
phase partitioning bioreactors for the treatment of volatile organic compounds.
Biotechnology Advances, 30, 1707-1720.
amini MT, Abdegagh N, Heydarian SM, Bonakdarpour B, Davood-Zare BK
(2012) Hydrogen sulfide removal performance of a bio-trickling filter
employing Thiobacillus thiparus immobilized on polyurethane foam undervarious starvation regimes. Biotechnology and Bioprocess Engineering, 17,
1278-1283.
National Academy of Science (2010) Acute Exposure Guideline Levels for
Selected Airborne Chemicals, Volume 9 – Last updated on 1 February 2012.
The National Academies Press, Washington, DC, USA.
(http://www.nap.edu/catalog/12978.html, 1.Feb.2013).
Nikeima J, Bibeua L, Lavoie J, Brzezinski R, Vigneux J, Heitz M (2005) Biofitration
of methane: an experimental study. Chemical Engineering Journal, 113,
111-117.
NIOSH – National Institute for Occupational Safety and Health (1994) Manual of
analytical methods (NMAM) – Mercaptans, Method 2542.
(http://www.cdc.gov/niosh/docs/2003-154/pdfs/2542.pdf, 1.Feb.2013).
NIOSH (2011a) Pocket Guide to Chemical Hazards, Hydrogen sulfide.
(http://www.cdc.gov/niosh/npg/npgd0337.html, 1.Feb.2013).
NIOSH (2011b) Pocket Guide to Chemical Hazards, Methyl mercaptan.
(http://www.cdc.gov/niosh/npg/npgd0425.html, 1.Feb.2013).
Nishizawa S, Buhlmann P, Xiao KP, Umezawa Y (1998) Application of a bis-
thiourea ionophore for an anion selective electrode with a remarkable sulfate
selectivity. Analytica Chimica Acta, 358, 35-44.
lenic L, Hopirtean E, Olenic L (1997) Potentiometric differential microdetectorwith interchange solid membranes used in flow injection analysis. Analyst,
122, 107-109.
OSHA – Occupational Safety and Health Administration (1981) Methyl mercaptan
analytical method – Method no. 26.
(http://www.osha.gov/dts/sltc/methods/organic/org026/org026.html, 1.Feb.2013).
OSHA (2005) Fact sheet of Hydrogen sulfide (H2S), DSG 10/2005.
(http://www.osha.gov/OshDoc//hydrogen_sulfide_fact.pdf, 1.Feb.2013).
OSHA (2006) Hydrogen sulfide analytical method – T-1008-FV-01-0609-M.
(http://www.osha.gov/dts/sltc/methods/validated/1008/1008.pdf, 1.Feb.2013).
N
O

8/17/2019 see page 29
http://slidepdf.com/reader/full/see-page-29 245/260
11. References
215
antoja-Filho JL, Sader LT, Damianovic MHRZ, Foresti E, Silva EL (2010)
Performance evaluation of packing materials in the removal of hydrogen
sulphide in gas-phase biofilters: Polyurethane foam, sugarcane bagasse and
coconut fibre. Chemical Engineering Journal, 158, 441-450.
Parker T, Dottridge J, Kelly S (2002) Investigation of the composition and
emissions of trace components in landfill gas. R&D Technical Report P1-438/TR Environment Agency, Bristol, UK.
Peng B, Zhu J, Liu X, Qin Y (2008) Potentiometric response of ion-selective
membranes with ionic liquids as ion-exchanger and plasticizer. Sensors and
Actuators B: Chemical, 133, 308-314.
Pfenning N, Widdel F, Truper HG (1981) The dissimilatory sulfate-reducing
bacteria. In: Starr MP, Stolp H, Truper HG, Balows A, Schlegel HG (Eds), The
Prokaryotes, Vol. 1. Springer Verlag, NY, USA, 926-940.
Phillips KN, Lantz C, Buhlmann P (2005) Visible and FTIR microscopic observation
of bisthiourea ionophore aggregates in ion-selective electrode membranes.
Electroanalysis, 17(22), 2019-2025.Piano M, Serban S, Biddle N, Pittson R, Drago GA, Hart JP (2010) A flow injection
system, comprising a biosensor based on a screen-printed carbon electrode
containing Meldola’s Blue-Reinecke salt coated with glucose dehydrogenase,
for the measurement of glucose. Analytical Biochemistry, 396, 269-274.
Pinjing H, Liming S, Zhiwen Y, Guojian L (2001) Removal of hydrogen sulfide and
methylmercaptan by a packed tower with immobilized micro-organism beads.
Water Science and Technology, 44(9), 327-333.
Prado OJ, Gabriel D, Lafuente J (2009) Economical assessment of the design,
construction and operation of open-bed biofilters for waste gas treatment.
Journal of Environmental Management, 90, 2515-2523.Predmore BL, Lefer DJ, Gojon G (2012) Hydrogen sulfide in biochemistry and
medicine. Antioxidants and Redox Signaling, 17(1), 119-140.
Pretsch E (2007) The new wave of ion-selective electrodes, Trends in Analytical
Chemistry, 26 (1), 46-51.
amirez M, Gomez JM, Aroca G, Cantero D (2009a) Removal of hydrogen
sulfide by immobilized Thiobacillus thioparus in a biotrickling filter packed with
polyurethane foam. Bioresource Technology, 100, 4989-4995.
Ramirez M, Gomez JM, Cantero D, Paca J, Halecky M, Kozliak EI, Sobotka M
(2009b) Hydrogen sulfide removal from air by Acidithiobacillus thiooxidans in a
trickle bed reactor. Folia Microbiologica, 54(5), 409-414.
Ramirez M, Fernandez M, Granada C, Le Borgne S, Gomez JM, Cantero D (2011)
Biofiltration of reduced sulfur compounds and community analysis of sulfur-
oxidizing bacteria. Bioresource Technology, 102(5), 4047-4053.
Rasi S, Veijanen J, Rintala J (2007) Trace compounds of biogas from different
biogas production plants. Energy, 32, 8, 1375-1380.
Rasi S, Lantela J, Rintala J (2011) Trace compounds affecting biogas energy
utilization – A review. Energy Conversion and Management, 52, 3369-3375.
Redondo R, Cunha-Machado V, Baeza M, Lafuente J, Gabriel D (2008) On-line
monitoring of gas-phase bioreactors for biogas treatment: hydrogen sulfide
and sulfide analysis by automated flow systems. Analytical and Bioanalytical
Chemistry, 391, 789-798.
P
R

8/17/2019 see page 29
http://slidepdf.com/reader/full/see-page-29 246/260
Aerobic biotrickling filtration for biogas desulfurization
216
Reij MW, Keurentjies JTF, Hartmans S (1998) Membrane bioreactors for waste
gas treatment. Journal of Biotechnology, 59, 155-167.
Rene ER, Veiga MC, Kennes C (2012) Combined biological and physicochemical
waste-gas cleaning techniques. Journal of Environmental Science and Health,
Part A, 47, 920-939.
Robertson LA, Kuenen JG (2006) The colorless sulfur bacteria. In: TheProkaryotes – A Handbook on the Biology of Bacteria. Dworkin M, Falkow S,
Rosenberg E, Schleifer KH and Stackebrandt E (Editors) – Third Edition,
Springer Science+Business Media, Inc., New York, USA.
Rocha-Rios J, Quijano G, Thalasso F, Revah S, Muñoz R (2011) Methane
biodegradation in a two-phase partition internal loop airlift reactor with gas
recirculation. Journal of Chemical Technology and Biotechnology, 86,
353-360.
Rodriguez G, Dorado AD, Bonsfills A, Sanahuja R, Gabriel D, Gamisans X (2012)
Optimization of oxygen transfer through venturi-based systems applied to the
biological sweetening of biogas. Journal of Chemical Technology andBiotechnology, 87, 854–860.
Rodriguez G, Dorado AD, Bonsfills A, Gabriel D, Gamisans X (2013) Optimization
of oxygen transfer through membrane diffusers for biological sweetening of
biogas. Chemical Engineering and Technology, 36(3), 513-518.
Rojo N, Muñoz R, Gallastegui G, Barona A, Gurtubay L, Prenafeta-Boldu FX, Elias
A (2012) Carbon disulfide biofiltration: Influence of the accumulation of
biodegradation products on biomass development. Journal of Chemical
Technology and Biotechnology, 87, 764-771.
Romero-Hernandez AC, Rodriguez-Susa MS, Andres Y, Dumont E (2013) Steady-
and transient-state H2S biofiltration using expanded schist as packingmaterial. New Biotechnology, 30(2), 210-218.
Rovira R, Montebello AM, Valle A, Gómez JM, Langostera M, Lafuente J, Campoy
S, Gabriel D (2010) Advanced tools in microbial characterization and gene
expression of a biotrickling filter treating high loads of H2S. In: Proceedings of
the 2010 Duke-UAM Conference on Biofiltration. Washington, DC, USA.
Rovira R (2012) Characterization of the operation and metatranscriptomic study of
a bioreactor for desulfurization of high loads of H2S. PhD Thesis, UAB, Spain.
(available at: http://hdl.handle.net/10803/96713).
Ruiz-Romero S, Colmenar-Santos A, Castro-Gil MA (2012) EU plans for
renewable energy. An application to the Spanish case. Renewable Energy,
43, 322-330.
Ruokojarvi A, Aatamila M, Hartikainen T, Olkkonen M, Salmi J, Ruuskanen J,
Martikainen PJ (2000) Removal of dimethyl sulfide from off-gas mixtures
containing hydrogen sulfide and methanethiol by a biotrickling filter.
Environmental Technology, 21(10), 1173-1180.
Ruokojarvi A, Ruuskanen J, Martikainen PJ, Olkkonen M (2001) Oxidation of gas
mixtures containing dimethyl sulfide, hydrogen sulfide and methanethiol using
a two-stage biotrickling filter. Journal of the Air and Waste Management
Association, 51(1), 11-16.
Ruzicka J, Lamm CG (1971) Selectrode TM – universal ion-selective solid-state
electrode. 1. Halides. Analytica Chimica Acta, 54(1), 1-12.

8/17/2019 see page 29
http://slidepdf.com/reader/full/see-page-29 247/260
11. References
217
Ruzicka J, Hansen EH (1975) Flow injection analysis. 1. New concept of fast
continuous-flow analysis. Analytica Chimica Acta, 78(1), 145-157.
Ruzicka J (1994) Discovering Flow Injection: journey from sample to a live cell and
from solution to suspension. Analyst, 119, 1925-1934.
an Miguel G, Servert J, Canoira L (2010) Analysis of the evolution in biomassto energy strategies and regulation in Spain. Global Nest Journal, 12(4),
374-383.
Sander R (1999) Compilation of Henry’s Law Constants for Inorganic and Organic
Species of Potential Importance in Environmental Chemistry, Version 3
(http://www.mpch-mainz.mpg.de/~sander/res/henry.html, 8 April 1999).
Santos JCC, Korn M (2006) Exploiting sulphide generation and gas diffusion
separation in a flow system for indirect sulphite determination in wines and
fruit juices. Microchimica Acta, 153, 87-94.
Sarma TVS, Tao S (2007) An active core fiber optic sensor for detecting trace H2S
at high temperature using cadmium oxide doped porous silica optical fiber asa transducer. Sensors and Actuators B, 127, 471-479.
Sathyapalan A, Zhou A, Kar T, Zhou F, Su H (2009) A novel approach for the
design of a highly selective sulfate-ion-selective electrode. Chemical
Communications, 3, 325-327.
Schieder D, Quicker P, Scheneider R, Winter H, Prechtl S, Faulstich M (2003)
Microbiological removal of hydrogen sulfide from biogas by means of a
separate biofilter system: experience with technical operation. Water Science
and Technology, 48(4), 209-212.
Schlegelmilch M, Streese J, Stegmann R (2005) Odour management and
treatment technologies: An overview. Waste Management, 25, 928-939.
Sekerka I, Lechner JF (1977) New zero-current chronopotentiometric technique
with ion-selective electrode. Analytica Chimica Acta, 93, 129-137.
Sercu B, Nuñez D, van Langenhove H, Aroca G, Verstraete W (2005) Operational
and microbiological aspects of a bioaugmented two-stage biotrickling filter
removing hydrogen sulfide and dimethyl sulfide. Biotechnology and
Bioengineering, 90(2), 259-269.
Sercu B, Boon N, Vander Beken S, Verstraete W, van Langenhove H (2007)
Performance and microbial analysis of defined and non-defined inocula for the
removal of dimethyl sulfide in a biotrickling filter. Biotechnology and
Bioengineering, 96(4), 661-672.
Shamsipur M, Yousefi M, Ganjali MR, Poursaberi T, Faal-Rastgar M (2002) Highly
selective sulfate PVC-membrane electrode based on 2,5-diphenyl-1,2,4,5-
tetraaza-bicyclo[2.2.1]heptane as a neutral carrier. Sensors and Actuators B,
82, 105-110
Shareefdeen Z (2012) A biofilter design tool for hydrogen sulfide removal
calculations. Clean Technologies and Environmental Policy, 14, 543-549.
Shishkanova TV, Sykora D, Vinsova H, Kral V, Mihai I, Gospodinova NP (2009) A
novel way to improve sulfate recognition. Electroanalysis, 21(17-18),
2010-2013.
Sigma Aldrich (2012) Sigma-Aldrich Quimica, S.L., Spain. Safety Data Sheet –
Sulfate-ionophore I. Version 5.0 Revision Date 24.07.2012.(http://www.sigmaaldrich.com/catalog/product/fluka/17892, 28.Mar.2013).
S
8/17/2019 see page 29
http://slidepdf.com/reader/full/see-page-29 248/260
Aerobic biotrickling filtration for biogas desulfurization
218
Sipma J, Svitelskaya A, van der Mark B, Hulstoff Pol LW, Lettinga G, Buisman
CJN, Janssen AJH (2004) Potentials of biological oxidation processes for the
treatment of spent sulfidic caustics containing thiols, Water Research, 38,
4331-4340.
Smet E, Lens P, van Langenhove H (1998a) Treatment of waste gases
contaminated with odorous sulfur compounds. Critical Reviews inEnvironmental Science and Technology, 28(1), 89-117.
Smet E, van Langenhove H (1998b) Abatement of volatile organic sulfur
compounds in odorous emissions from the bio-industry. Biodegradation, 9,
273-284.
Soleymanpour A, Hamidi-Asl E, Nasserib MA (2006) Chemically modified carbon
paste electrode for determination of sulfate ion by potentiometric method.
Electroanalysis, 18(16), 1598-1604.
Soreanu G, Beland M, Falletta P, Edmonson K, Seto P (2008) Laboratory pilot
scale study for H2S removal from biogas in an anoxic biotrickling filter. Water
Science and Technology, 57(2), 201-207.Steudel R (2004). The chemical sulfur cycle. In: Environmental technologies to
treat sulfur pollution. Principles and engineering, Lens,PNL, Hulshoff Pol L,
Eds. IWA Publishing, London, UK, 1-31.
Sublette KL, Kolhatkar R, Raterman K (1998) Technological aspects of the
microbial treatment of sulfide-rich wastewaters: A case study. Biodegradation,
9, 259-271.
Syed M, Soreanu G, Falletta P, Beland M (2006) Removal of hydrogen sulfide
from gas streams using biological processes – A review. Canadian
Biosystems Engineering, 48, 2.1-2.14.
ang K, Baskaran V, Nemati M (2009) Bacteria of the sulfur cycle: An overview
of microbiology, biokinetics and theis role in petroleum and mining industries.
Biochemical Engineering Journal, 44, 73-94.
Tangerman A (2009) Measurement and biological significance of the volatile sulfur
compounds hydrogen sulfide, methanethiol and dimethyl sulfide in various
biological matrices. Journal of Chromatography B, 877, 3366-3377.
Tomas M, Fortuny M, Lao C, Gabriel D, Lafuente D, Gamisans X (2009) Technical
and economical study of a full-scale biotrickling filter for H2S removal from
biogas. Water Practice and Technology, 4(2), doi:10.2166/WPT.2009.026.
Trojanowicz M (2009) Recent developments in electrochemical flow detections – A
review. Part I. Flow analysis and capillary electrophoresis. Analytica Chimica
Acta, 653, 36-58.
Tyurina LA, Tsodikov MV, Tarkhanova IG (2011) Field technology for
desulfurization of associated petroleum gas. Russian Journal of General
Chemistry, 81(12), 2611-2618.
mezawa Y, Umezawa K, Sato H (1995) Selectivity coefficients for ion-
selective electrodes: recommended methods for reporting Kpot A,B values
(Technical Report). Pure and Applied Chemistry, 67(3), 507-518.
Umezawa Y, Buhlmann P, Umezawa P, Tohda K, Amemiya S (2000)
Potentiometric selectivity coefficients of ion-selective electrodes. Part I.
T
U

8/17/2019 see page 29
http://slidepdf.com/reader/full/see-page-29 249/260
11. References
219
Inorganic cations (Technichal Report). Pure and Applied Chemistry, 72(10),
1851-2082.
US EPA – US Environmental Protection Agency (2003) Toxicological Review of
Hydrogen Sulfide, EPA/635/R-03/005, Washington, USA.
(http://www.epa.gov/iris/toxreviews/0061tr.pdf, 1.Feb.2013).
an den Bosch PLF, van Beusekom OC, Buisman CJS, Janssen AJH (2007)
Sulfide oxidation at halo-alkaline conditions in a fed batch bioreactor.
Biotechnology and Bioengineering, 97(5), 1053-1063.
van den Bosch PLF, de Graaf M, Fortuny-Picornell M, van Leerdam RC, Janssen
AJH (2009) Inhibition of microbiological sulfide oxidation by methanethiol and
dimethyl polysulfides at natron-alkaline conditions. Applied Microbiology and
Biotechnology, 83, 579-587.
van Groenestijn JW, Hesselink PGM (1993) Biotechniques for air pollution control.
Biodegradation, 4(4), 283-301.
van Groenestijn JW, van Heiningen WNM, Kraakman NJR (2001) Biofilters basedon the action of fungi. Water Science and Technology, 44(9), 227-232.
van Groenestijn JW, Kraakman NJR (2005) Recent developments in biological
waste gas purification in Europe. Chemical Engineering Journal, 113, 85-91.
van Langenhove H, De Heyder B (2001) Biotechnological treatment of sewage
odours. In: Stuetz R, Frechen FB (Eds.), Odours in Wastewater Treatment:
measurement, modelling and control, Int. Water Assoc. Publishing, London,
UK, 396-414.
van Leerdam RC, Bonilla-Salinas M, de Bok FAM, Bruning H, Lens PNL, Stams
AJM, Janssen AJH (2008) Anaerobic methanethiol degradation and
methanogenic community analysis in an alkaline (pH 10) biological process for
liquefied petroleum gas desulfurization, Biotechnology and Bioengineering,
101(4), 691-701.
van Leerdam RC, van den Bosch PLF, Lens PNL, Janssen AJH (2011) Reactions
between methanethiol and biologically produced sulfur particles.
Environmental Science and Technology, 45, 1320-1326.
Vandiver MS, Snyder SH (2012) Hydrogen sulfide: a gasotransmitter of clinical
relevance. Journal of Molecular Medicine, 90, 255-263.
Vergara-Fernandez A, Hernandez S, Muñoz R, Revah S (2012) Influence of the
inlet load, EBRT and mineral medium addition on spore emission by Fusarium
solani in the fungal biofiltration of hydrophobic VOCs. Journal of Chemical
Technology and Biotechnology, 87, 778-784.
Vitenberg AG, Kovalenko OG, Toma VI, Dobryakov YG (2007) Gas-
Chromatographic determination of volatile sulfur-containing impurities in
industrial emissions and aqueous solutions. Journal of Analytical Chemistry,
62(9). 857-867.
Vlasov YG, Ermolenko YE, Legin AV, Rudnitskaya AM, Kolodinov VV (2010)
Chemical sensors and their systems. Journal of Analytical Chemistry, 65(9),
880-898.
ani AH, Branion RMR, Lau AK (1998) Effects of periods of starvation and
fluctuating hydrogen sulfide concentration on biofilter dynamics andperformance. Journal of Hazardous Materials, 60, 287-303.
v
W

8/17/2019 see page 29
http://slidepdf.com/reader/full/see-page-29 250/260
Aerobic biotrickling filtration for biogas desulfurization
220
Wani AH, Lau AK, Branion MR (1999) Biofiltration control of pulping odors –
hydrogen sulphide: Performance, microkinetics and coexistence effects of
organo-sulfur species. Journal of Chemical Technology and Biotechnology,
74, 9-16.
Woodcock KE, Gottlieb M (2004) Natural gas. In: Kirk-Othmer Encyclopedia of
Chemical Technology, Wiley, 12, 377- 386.Wojciechowski K, Kucharek M, Wroblewski W, Warszynski P (2010) On the origin
of the Hofmeister effect in anion-selective potentiometric electrodes with
tetraalkylammonium salts. Journal of Electroanalytical Chemistry, 638,
204-211.
amasaki Y, Kanno M, Suzuki Y, Kaneko S (2013) Development of an engine
control system using city gas and biogas fuel mixture. Applied Energy, 101,
465-474.
Yang Y, Allen ER (1994) Biofiltration control of hydrogen sulfide. 1. Design and
operational parameters. Journal of the Air and Waste Management Association, 44, 863-868.
Young PG, Jolliffe KA (2012) Selective recognition of sulfate by tripodal cyclic
peptides functionalized with (thio)urea binding sites. Organic and Biomolecular
Chemistry, 10, 2664-2672.
Yuan YJ, Kuriyama H (2000) Determination of hydrogen sulfide in a yeast culture
solution by flow analysis utilizing methylene blue spectrophotometric
detection. Biotechnology Letters, 22, 795-799.
ayed SIM Issa YM (2010) Sibutramine selective electrodes for batch and flow
injection determinations in pharmaceutical preparations. Analytical Sciences,26, 45-49.
Zhang L, Meng X, Wang Y, Liu L (2009) Performance of biotrickling filters for
hydrogen sulfide removal under starvation and shock loads conditions. Journal
of Zhejiang University Science B, 10(8), 595-601.
Zuliani C, Diamond D (2012) Opportunities and challenges of using ion-selective
electrodes in environmental monitoring and wearable sensor. Electrochimica
Acta, 84, 29-34.
Y
Z

8/17/2019 see page 29
http://slidepdf.com/reader/full/see-page-29 251/260
annexes

8/17/2019 see page 29
http://slidepdf.com/reader/full/see-page-29 252/260
Aerobic biotrickling filtration for biogas desulfurization
222
A n u nu sual beginn in g mu st have an u nu sual end.
M i k h a i l Y L er m on t ov
M oscow, 1814 P y at igor sk, 184 1

8/17/2019 see page 29
http://slidepdf.com/reader/full/see-page-29 253/260
Annexes
223
COS
Carbonyl sulfide
DMDS (CH3SSCH3)
Dimethyl disulfide
DMS (CH3SCH3)
Dimethyl sulfide
DMTS (CH3SSSCH3) Dimethyl trisulfide
ET (CH3CH2SH) Ethylmercaptan
H2S Hydrogen sulfide
CH3SH Methylmercaptan
S80
Elemental sulfur(ortomolecular S8)
S2O32-
Thiosulfate
S2O62-
Dithionate
S3O62-
Trithionate
S4O62-
Tetrathionate
SO2 Sulfur dioxide
SO32-
Sulfite
SO42-
Sulfate
* Images free of copyright
Molecular representation of some sulfu r compounds *

8/17/2019 see page 29
http://slidepdf.com/reader/full/see-page-29 254/260
Aerobic biotrickling filtration for biogas desulfurization
224

8/17/2019 see page 29
http://slidepdf.com/reader/full/see-page-29 255/260
Annexes
225
Video “ 990 days in 3 minutes” – Description and comments
The file entitled 990 days in 3 minutes is a video file (990 days in 3
minutes.mov, 29.4 MB) edited using the software QuickTime (Apple Inc., USA).
It can be played using any software for movies watching. This document was
prepared and edited by Andrea M. Montebello, 2013. All information and
pictures showed are property of the author. A CD containing the video file
990 days in 3 minutes is included in the hard copy version of this Thesis, in the
internal back cover.
The author acknowledge the collaboration of all colleagues from Gas
Treatment Group - UAB, specially: Dr. Roger Rovira, during the operation and
biomass sampling under neutral pH; Luis Rafael López and Mabel Mora, during
acidic pH operation; Tércia Bezerra, during biomass sampling under acidic pH;
Margot Clariana for lab support during neutral pH operation and Lorena Ferrer
for lab support during the complete operation.
The video was conceived as a supporting tool for being played during internal
project meetings. The intention was to show the evolution of the physical
appearance of the reactor during the total operating time of 990 days. Selected
pictures of the reactor are shown, with special attention to the visual aspect of
the biofilm attached to packing material and to the quantity of elemental sulfur
accumulated inside the filter bed during the acidic pH operation. Also some
details of biomass sampling procedures are shown, including the evidence of
corrosion of packing material at the gas inlet section. The total duration of the
video is 3 minutes. Detailed information of the video content is presented in
Table A.1, including legend of each picture and the duration of each imageanimation, as played.

8/17/2019 see page 29
http://slidepdf.com/reader/full/see-page-29 256/260
Aerobic biotrickling filtration for biogas desulfurization
226
Table A.1 Video “990 days in 3 minutes” – Detailed content
# Title / LegendTime(mm:ss)
1990 days in 3 minutes
aerobic biotrickling filtration for biogas desulfurization00.00 – 00:10
2 START UP @ neutral pH / 11 march 2010 00:10 – 00:15
3 6 days @ neutral pH / 17 march 2010 00:15 – 00:20
4 15 days @ neutral pH / 26 march 2010 00:20 – 00:25
5 26 days @ neutral pH / 7 april 2010 00:25 – 00:29
6 26 days @ neutral pH / 7 april 2010 00.29 – 00:34
7 75 days @ neutral pH / 26 may 2010 00:34 – 00:39
8 416 days @ neutral pH / 7 may 2011 (EXPs H2S + CH3SH) 00:39 – 00:45
9 440 days @ neutral pH / 1 june 2011 – acidic pH transition 00:45 – 00:52
10 5 days @ acidic pH / 6 june 2011 00:52 – 00:58
11 8 days @ acidic pH / 9 june 2011 00:58 – 01:0312 13 days @ acidic pH / 14 june 2011 01:03 – 01:07
13 16 days @ acidic pH / 17 june 2011 01:08 – 01:12
14 26 days @ acidic pH / 27 june 2011 01:12 – 01:17
15 177 days @ acidic pH / 28 november 2011 – EXPs (2,000 ppmv H2S) 01:17 – 01:22
16 178 days @ acidic pH / 29 november 2011 – EXPs (4,000 ppmv H2S) 01:22 – 01:27
17 179 days @ acidic pH / 30 november 2011 – EXPs (6,000 ppmv H2S) 01:27 – 01:32
18 254 days @ acidic pH / 16 february 2012 – EXPs (10,000 ppmv H2S) 01:32 – 01:37
19 256 days @ acidic pH / 18 february 2012 – EXPs (0 ppmv H2S) 01:37 – 01:42
20 266 days @ acidic pH / 27 february 2012 – EXPs (2,000 ppmv H2S) 01:42 – 01:47
21 317 days @ acidic pH / 18 april 2012 01:47 – 01:52
22 317 days @ acidic pH / 18 april 2012 01:52 – 01:56
23 317 days @ acidic pH / 18 april 2012 01:57 – 02:02
24 317 days @ acidic pH / 18 april 2012 02:02 – 02:06
25 317 days @ acidic pH / 18 april 2012 02:06 – 02:11
26 401 days @ acidic pH / 12 july 2012 02:12 – 02:16
27 401 days @ acidic pH / 12 july 2012 02:16 – 02:21
28 401 days @ acidic pH / 12 july 2012 02:21 – 02:26
29 401 days @ acidic pH / 12 july 2012 02:26 – 02:31
30 401 days @ acidic pH / 12 july 2012 02:31 – 02:36
31 550 days @ acidic pH / 10 december 2012 02:36 – 02:41
32 550 days @ acidic pH / 10 december 2012 02:41 – 02:45
33 550 days @ acidic pH / 10 december 2012 02:46 – 02:50
34 550 days @ acidic pH / 10 december 2012 02:51 – 02:55
35990 days in 3 minutesaerobic biotrickling filtration for biogas desulfurization
02:56 – 03:01

8/17/2019 see page 29
http://slidepdf.com/reader/full/see-page-29 257/260
Annexes
227
Curriculum Vitae Académico
Andrea M. Montebello
Barcelona, Mayo 2013
Apellidos: MONZÓN MONTEBELLO Nombre: ANDREA D.N.I.: X8614988-Q Fecha de nacimiento: 16/04/1971
Situación profesional actual
Organismo: UNIVERSIDAD AUTÓNOMA DE BARCELONA Facultad, Escuela o Instituto: ESCUELA DE INGENIERÍA (EE) Depto./Secc./Unidad estr.: DEPARTAMENTO DE INGENIERÍA QUÍMICA Dirección postal: Campus de Bellaterra, 08193 Bellaterra (Barcelona)Teléfono: + 34 935814792 Fax: + 34 935812013Correo electrónico: [email protected]
Especialización (Códigos UNESCO): 330801, 330804, 330810, 330530Categoría profesional: BECARIA DOCTORAL (BECA PIF) Fecha inicio: 21/10/2009Dedicación: A tiempo completo
Líneas de investigación
Tratamiento de efluentes gaseosos, tratamiento de aguas residuales, monitorización
Formación académica
Titulación Superior Centro FechaDoctorado en Ciencia yTecnología Ambientales Universidad Autónoma de Barcelona 2013 (en curso)Máster en Estudios Ambientales Universidad Autónoma de Barcelona 2008Especialización en Ingenieríade Saneamiento Básico Universidade de São Paulo, Brasil 2000
Ingeniería Química Fundação Armando Alvares Penteado, Brasil 1999
Actividades anteriores de carácter científico profesional
Puesto Institución Fechas
Ingeniero Comercial Montebello Engenharia Ltda., São Paulo, Brasil 01/2007–08/2007
Ingeniero Comercial (Negocios) Degrémont Trat. Aguas Ltda., São Paulo, Brasil 11/2003–12/2006Ingeniero Comercial (Productos) Pieralisi do Brasil Ltda., São Paulo, Brasil 08/2000–08/2003Ingeniero Trainee Degrémont Trat. Aguas Ltda., São Paulo, Brasil 04/2000–08/2000
Idiomas(R = regular, B = bien, C = correctamente)
Idioma Habla Lee EscribeInglés B C CCastellano C C CPortugués C C C
Catalán B C B

8/17/2019 see page 29
http://slidepdf.com/reader/full/see-page-29 258/260
Aerobic biotrickling filtration for biogas desulfurization
228
Participación en proyectos de I+D financiados en convocatorias públicas(nacionales y/o internacionales)
Título del proyecto: Grupo de investigación de calidad. Pla de Recerca de Catalunya.
Entidad financiadora: CIRIT. Generalitat de Catalunya. 2009 SGR 815Entidades participantes: Grupo de tratamiento biológico de efluentes líquidos y gaseosos. Eliminación deNutrientes, Olores y Compuestos Orgánicos Volátiles (Departamento de
Ingeniería Química – UAB)Duración desde: Julio 2009 hasta: Julio 2014
Investigador principal: Javier Lafuente SanchoNúmero de investigadores participantes: 13
Título del proyecto: Desulfuración de gases ricos energéticamente mediante biofiltrospercoladores: desarrollo y optimización del proceso en condiciones
anóxicas y aerobias.
Entidad financiadora: CICYT nº CTM2009-14338-C03-01Entidades participantes: Dpt. d’Enginyeria Química (UAB) , Dpt. Enginyeria Minera Recursos Naturals
(UPC), Universidad de Cádiz (UCA)Duración desde: 1-1-2010 hasta: 31-12-2012
Investigador responsable: David Gabriel Buguña (UAB)Número de investigadores participantes: 13
Título del proyecto: Desulfuración sostenible de biogás mediante biorreactores para suaprovechamient o como fuente de energía alternativa.
Entidad financiadora: Ministerio de Asuntos Exteriores y cooperación – AECID ref: A2/037075/11Entidades participantes: Dpt. d’Enginyeria Química (UAB) , Dpt. Enginyeria Minera Recursos Naturals
(UPC), Universidad Autónoma Metropolitana - Iztapalapa(UAMI), Universidad Autónoma Metropolitana - Cuajimalpa(UAMC)
Duración desde: 1-1-2012 hasta: 31-12-2012Investigador responsable: David Gabriel Buguña (UAB)Número de investigadores participantes: 17
Publicaciones o Documentos Científico-Técnicos(CLAVE: L = libro completo, CL = capítulo de libro, A = artículo, R = “review”, E = editor,
S = Documento Científico-Técnico restringido)
Autores: Montebello AM, Gamisans X, Lafuente J, Baeza M, Gabriel DTítulo: Aer ob ic des ul fu ri zati on of bi ogas b y ac id ic bi ot ri ck li ng fi lt rat ion Ref. Revista: Accepted – Environmental Technology Clave: A Volumen: Páginas: Fecha: 2013
Autores: Montebello AM, Gamisans X, Lafuente J, Baeza M, Gabriel D
Título: Desulfurization of biogas by acidic bio trickling filtration Ref. Revista: Proceedings of the 5th IWA Conference on Odours and Air Emissions, San
Francisco, California, USA. Paper # 47
Clave: A Volumen: Páginas: 1-8 Fecha: 2013
8/17/2019 see page 29
http://slidepdf.com/reader/full/see-page-29 259/260
Annexes
229
Autores: Bezerra T, Rovira R, Montebello AM, Llagostera M, Lafuente J, Campoy S,
Gabriel DTítulo: Metagenomics and metatranscriptomics of a H2S desulfurizing biotri ckling
filter Ref. Revista: Proceedings of the 5th IWA Conference on Odours and Air Emissions, San
Francisco, California, USA. Paper # 48 Clave: A Volumen: Páginas: 1-8 Fecha: 2013
Autores: Montebello AM, Fernandez M, Almenglo F, Ramirez M, Cantero D, Baeza M,Gabriel D
Título: Simultaneous methylmercaptan and hydrogen sulfide removal in thedesulfurization of biogas in aerobic and anoxic biotrickling filters
Ref. Revista: Chemical Engineering Journal Clave: A Volumen: 200-202 Páginas: 237-246 Fecha: 2012
Autores: Montebello AM, Fernandez M, Almenglo F, Ramirez M, Cantero D, Baeza M,Gabriel D
Título: Simultaneous methylmercaptan and hydrogen sulfide removal in thedesulfurization of biogas in aerobic and anoxic biotrickling filters
Ref. Revista: Proceedings of the Congress on Biotechniques for Air Pollution Control.Biotechniques 2011
Clave: A Volumen: Páginas: 1-8 Fecha: 2011
Autores: Montebello AM, Baeza M, Lafuente J, Gabriel DTítulo: Monitoring and performance of a desulfurizing biotrickling filter with an
integrated conti nuous gas/liquid flow analyser Ref. Revista: Chemical Engineering Journal Clave: A Volumen: 165 Páginas: 500-507 Fecha: 2010
Autores: Rovira R, Montebello AM, Valle A, Gomez JM, Llagostera M, Lafuente J,
Campoy S, Gabriel DTítulo: Advanced tool s in microb ial characterizat ion and gene exp ress ion of a
biotrickling filter treating high loads of H2S Ref. Revista: Proceedings of the 2010 Duke – UAM Conference on Biofiltration for Air
Pollution Control, Washington, DC, USA.
Clave: A Volumen: Páginas: 155-162 Fecha: 2010
Contribuciones a Congresos
Autores: Montebello AM, Gamisans X, Lafuente J, Baeza M, Gabriel DTítulo: Desulfurization of biogas by acidic bio trickling filtration
Participación: Presentación oralCongreso: 2013 5th IWA Conference on Odours and Air EmissionsLugar de celebración: San Francisco, Estados Unidos Fecha: Marzo 2013

8/17/2019 see page 29
http://slidepdf.com/reader/full/see-page-29 260/260
Aerobic biotrickling filtration for biogas desulfurization
Autores: Montebello AM, Fernandez M, Almenglo F, Ramirez M, Cantero D, Baeza M,Gabriel D
Título: Simultaneous methylmercaptan and hydrogen sulphide removal in thedesulphurization of biogas in aerobic and anoxic biotrickling filters
Tipo de participación: Presentación oralCongreso: Congress on Biotechniques for Air Pollution Control. Biotechniques 2011