See more with hyperspectral imaging
38
See more with hyperspectral imaging
Transcript of See more with hyperspectral imaging

See more with hyperspectral
imaging
SPECIM, Spectral Imaging Ltd.
World leading manufacturer and suppplier for
hyperspectral imaging technology and solutions
Hundreds of customers worldwide.
Distributor and integrator network covers more
than 40 countries
We make hyperspectral imaging possible
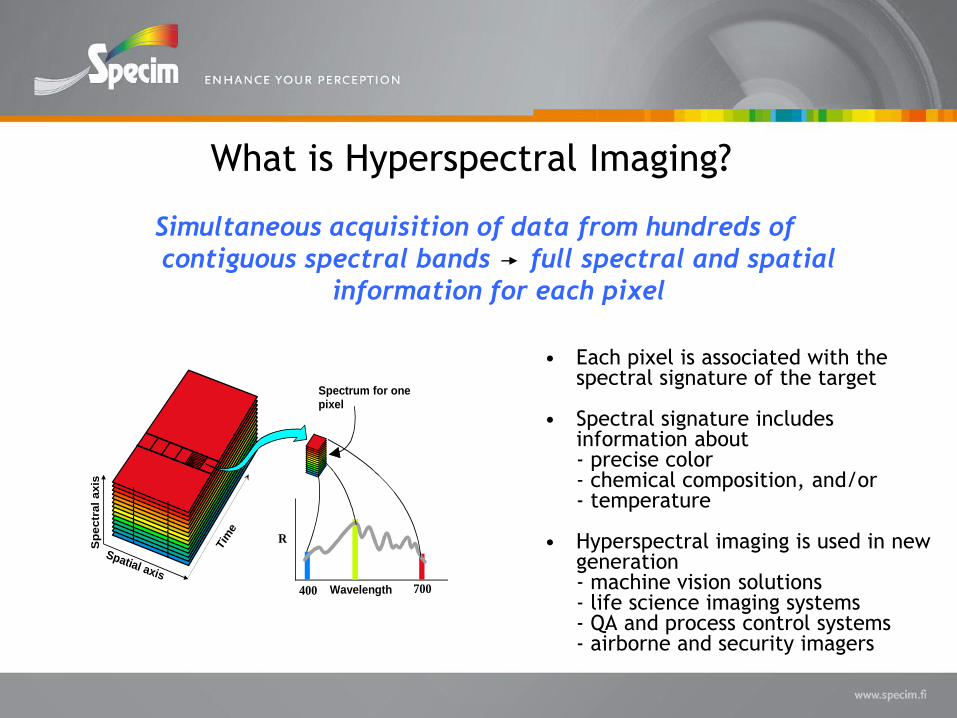
What is Hyperspectral Imaging?
• Each pixel is associated with the spectral signature of the target
• Spectral signature includes information about - precise color- chemical composition, and/or- temperature
• Hyperspectral imaging is used in new generation- machine vision solutions- life science imaging systems- QA and process control systems- airborne and security imagers
R
400 700
Sp
ectr
al
axis
Spatial axis
Tim
e
Wavelength
Spectrum for one pixel
Simultaneous acquisition of data from hundreds of
contiguous spectral bands full spectral and spatial
information for each pixel
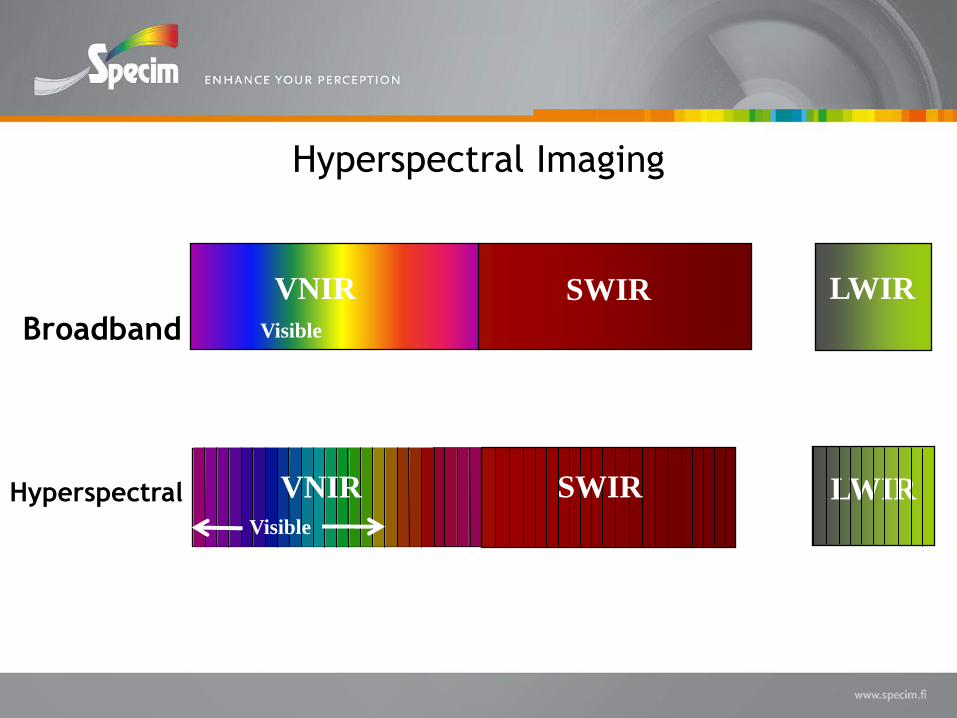
Visible
SWIR LWIR
Broadband
Hyperspectral
Hyperspectral Imaging
LWIR
VNIR
Visible
VNIR
SWIR
SWIR
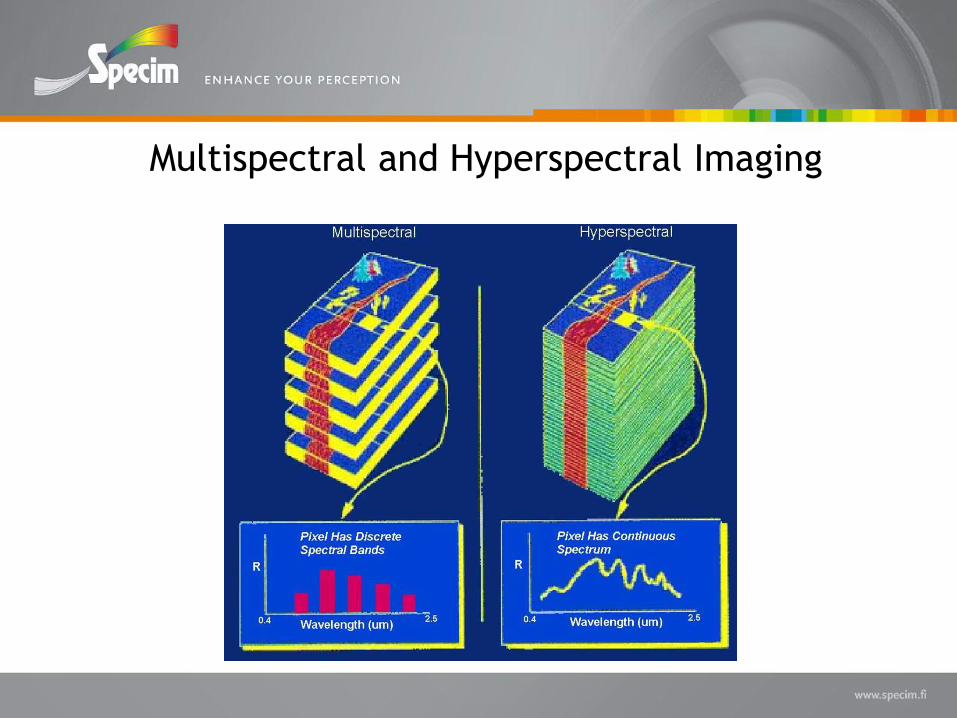
Multispectral and Hyperspectral Imaging
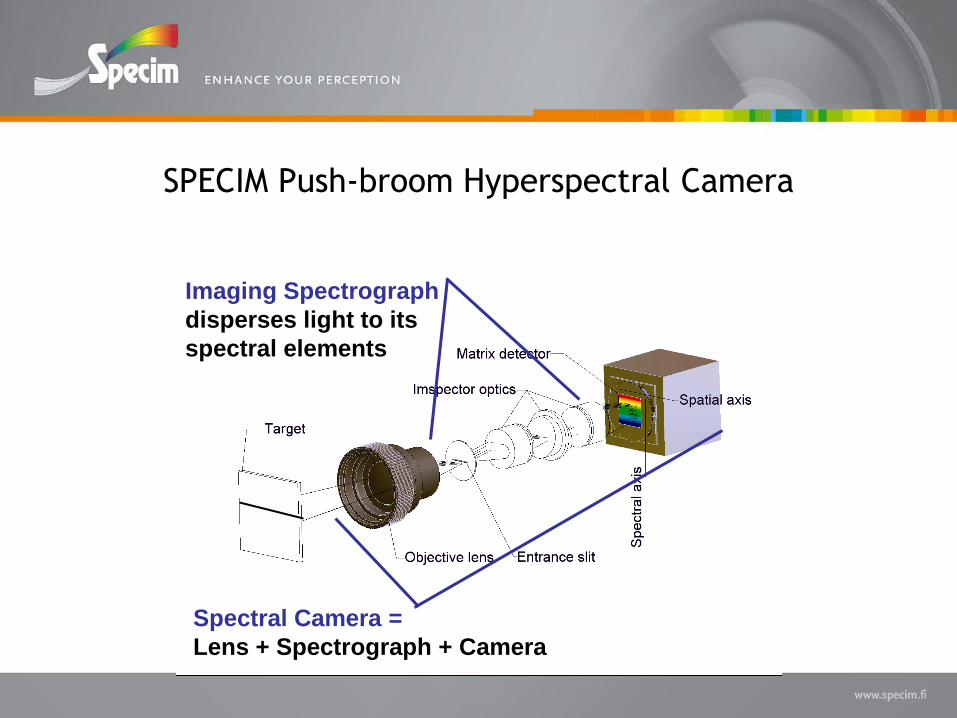
SPECIM Push-broom Hyperspectral Camera
Imaging Spectrograph
disperses light to its
spectral elements
Spectral Camera =
Lens + Spectrograph + Camera
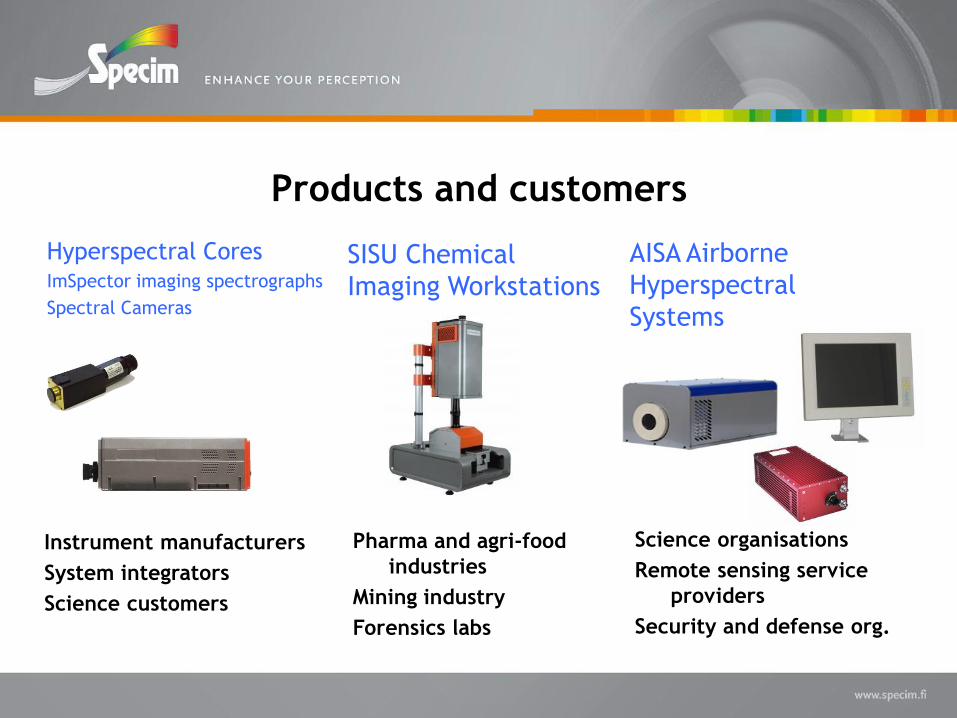
Products and customers
Hyperspectral CoresImSpector imaging spectrographs
Spectral Cameras
SISU Chemical
Imaging Workstations
AISA Airborne
Hyperspectral
Systems
Instrument manufacturers
System integrators
Science customers
Pharma and agri-food
industries
Mining industry
Forensics labs
Science organisations
Remote sensing service
providers
Security and defense org.
AISA
Airborne Hyperspectral Systems
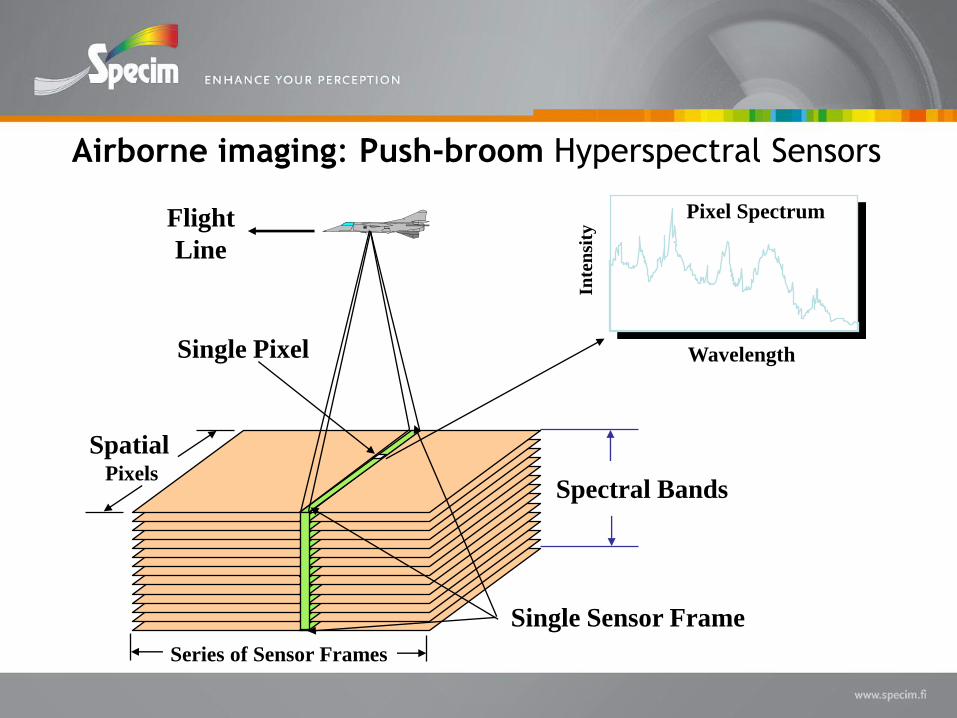
Single Pixel
Spectral Bands
SpatialPixels
Flight
Line
Wavelength
Inte
nsi
ty
Pixel Spectrum
Single Sensor Frame
Series of Sensor Frames
Airborne imaging: Push-broom Hyperspectral Sensors
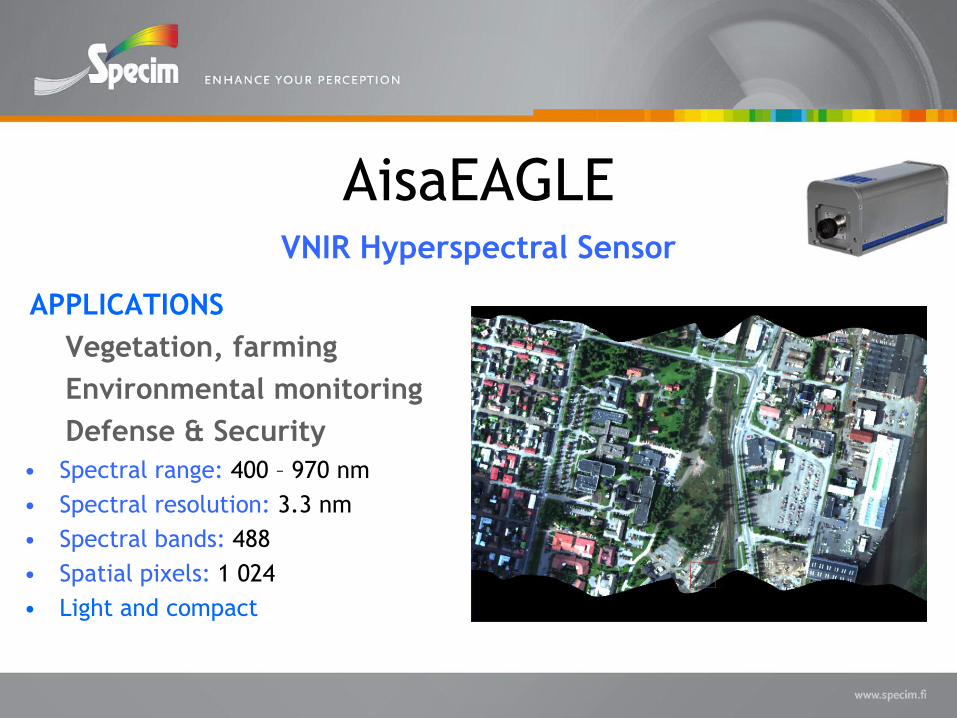
AisaEAGLE
• Spectral range: 400 – 970 nm
• Spectral resolution: 3.3 nm
• Spectral bands: 488
• Spatial pixels: 1 024
• Light and compact
VNIR Hyperspectral Sensor
APPLICATIONS
Vegetation, farming
Environmental monitoring
Defense & Security
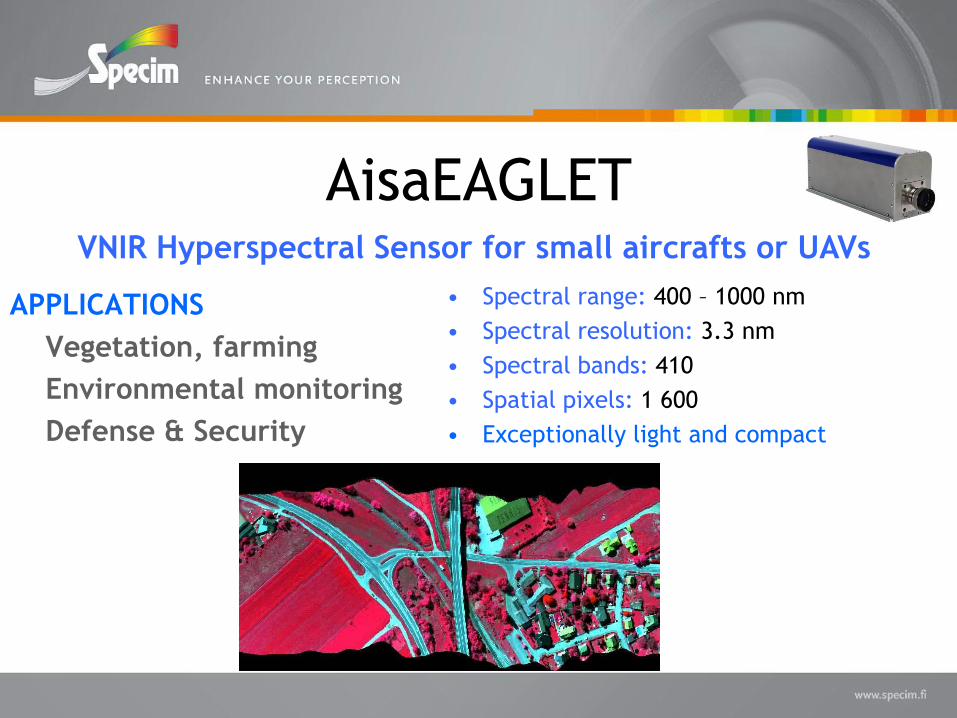
AisaEAGLET
• Spectral range: 400 – 1000 nm
• Spectral resolution: 3.3 nm
• Spectral bands: 410
• Spatial pixels: 1 600
• Exceptionally light and compact
VNIR Hyperspectral Sensor for small aircrafts or UAVs
APPLICATIONS
Vegetation, farming
Environmental monitoring
Defense & Security
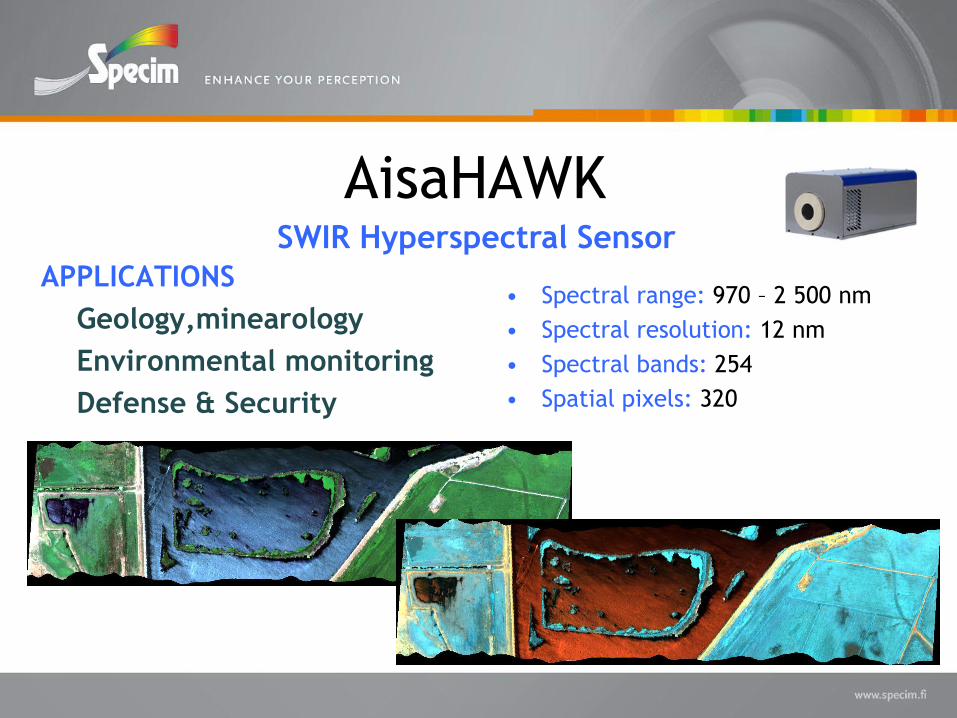
AisaHAWK
• Spectral range: 970 – 2 500 nm
• Spectral resolution: 12 nm
• Spectral bands: 254
• Spatial pixels: 320
SWIR Hyperspectral Sensor
APPLICATIONS
Geology,minearology
Environmental monitoring
Defense & Security
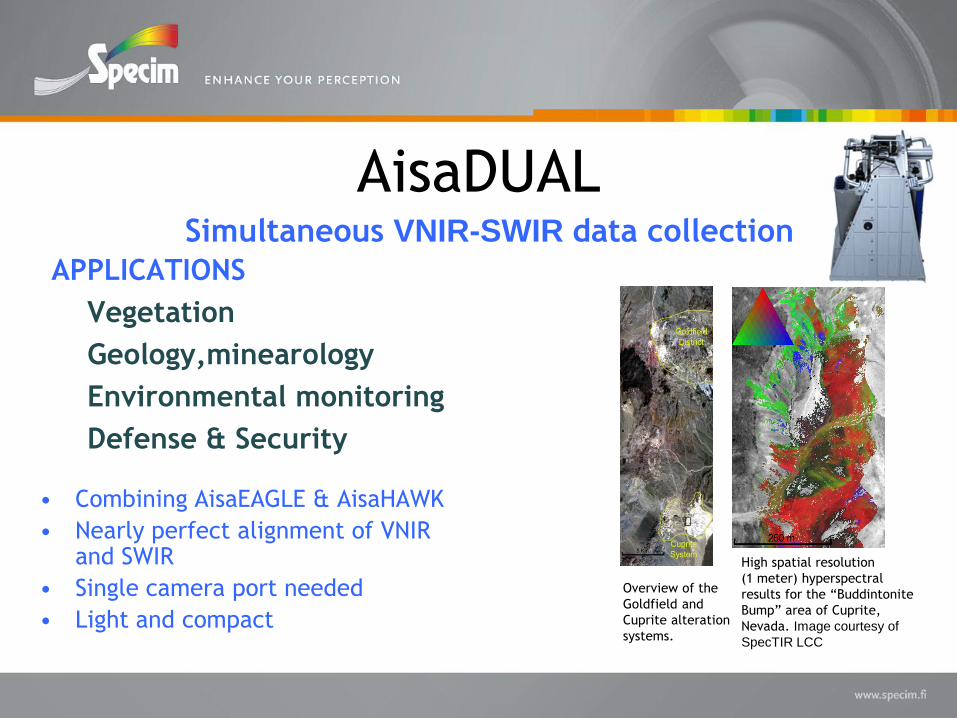
AisaDUAL
APPLICATIONS
Vegetation
Geology,minearology
Environmental monitoring
Defense & Security
Simultaneous VNIR-SWIR data collection
Overview of the
Goldfield and
Cuprite alteration
systems.
High spatial resolution
(1 meter) hyperspectral
results for the “Buddintonite
Bump” area of Cuprite,
Nevada. Image courtesy of
SpecTIR LCC
• Combining AisaEAGLE & AisaHAWK
• Nearly perfect alignment of VNIR and SWIR
• Single camera port needed
• Light and compact
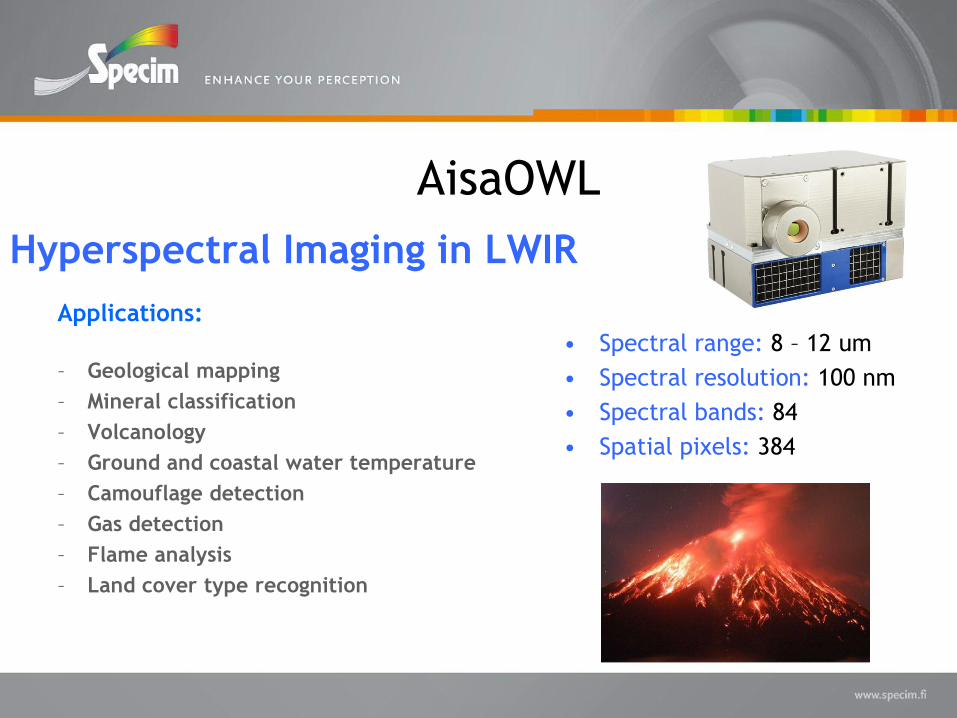
AisaOWL
Hyperspectral Imaging in LWIR
Applications:
– Geological mapping
– Mineral classification
– Volcanology
– Ground and coastal water temperature
– Camouflage detection
– Gas detection
– Flame analysis
– Land cover type recognition
• Spectral range: 8 – 12 um
• Spectral resolution: 100 nm
• Spectral bands: 84
• Spatial pixels: 384
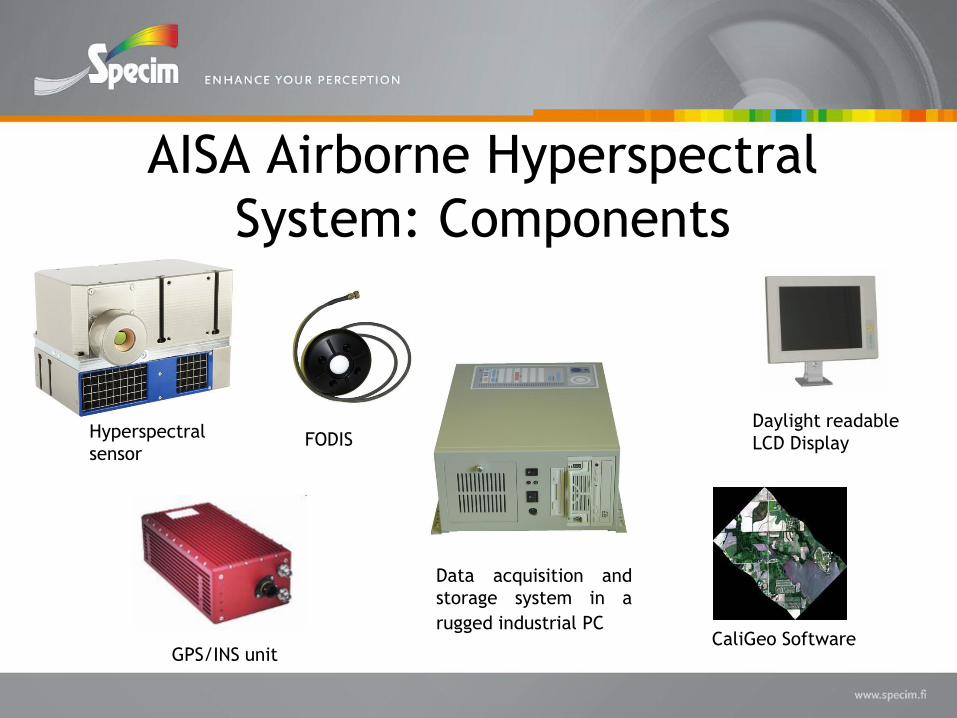
AISA Airborne Hyperspectral
System: Components
Data acquisition and
storage system in a
rugged industrial PC
Hyperspectral
sensor
GPS/INS unit
Daylight readable
LCD DisplayFODIS
CaliGeo Software
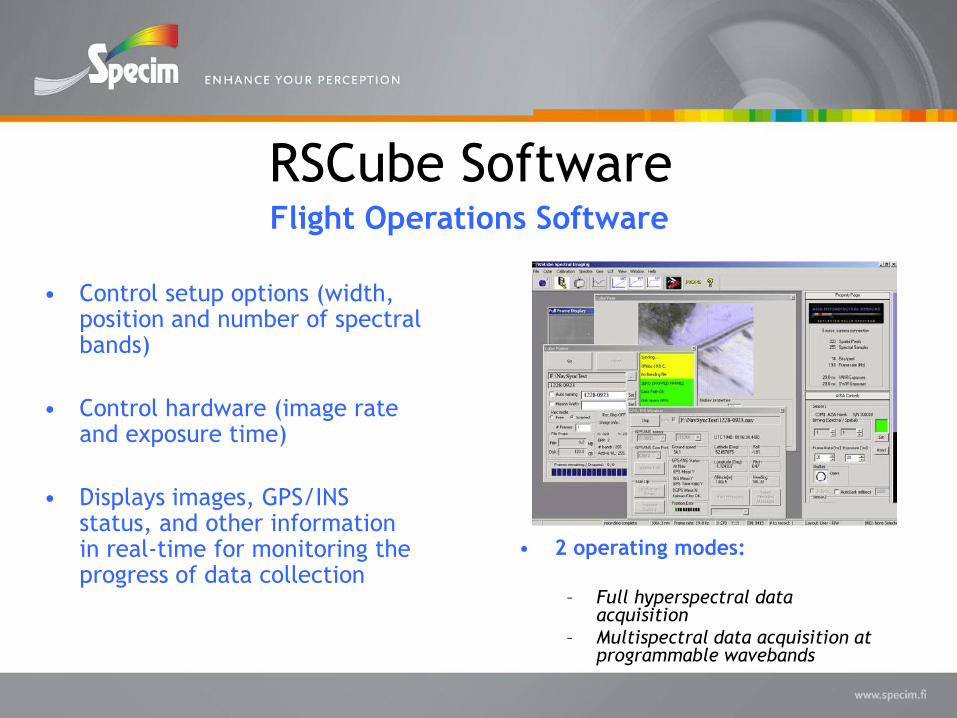
RSCube Software
• Control setup options (width, position and number of spectral bands)
• Control hardware (image rate and exposure time)
• Displays images, GPS/INS status, and other information in real-time for monitoring the progress of data collection
• 2 operating modes:
– Full hyperspectral data acquisition
– Multispectral data acquisition at programmable wavebands
Flight Operations Software
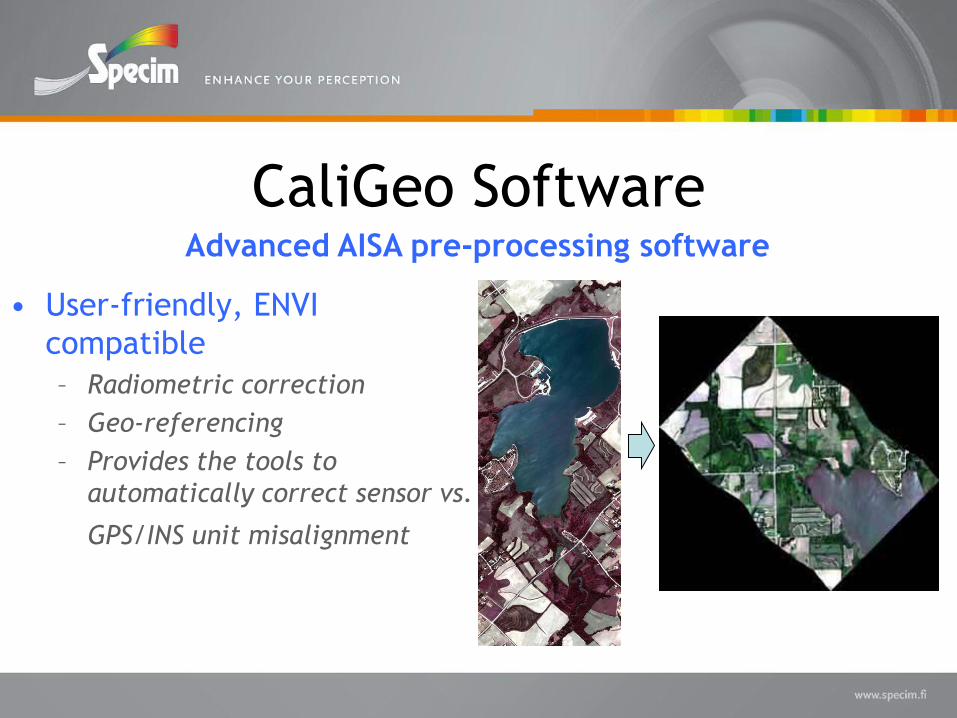
CaliGeo Software
• User-friendly, ENVI
compatible
– Radiometric correction
– Geo-referencing
– Provides the tools to
automatically correct sensor vs.
GPS/INS unit misalignment
Advanced AISA pre-processing software
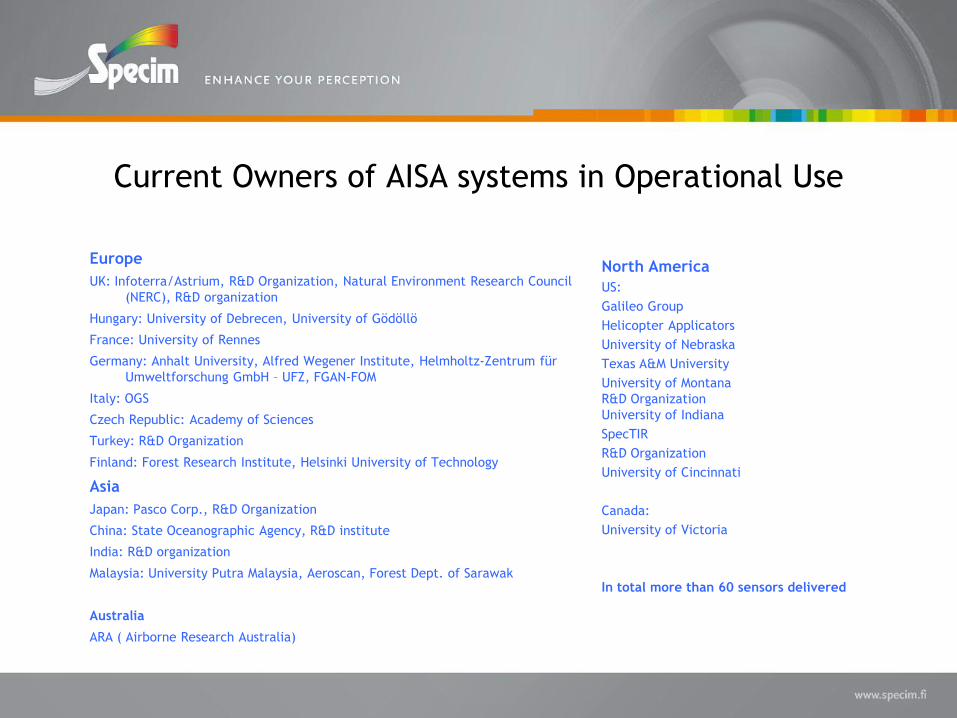
Current Owners of AISA systems in Operational Use
North America
US:
Galileo Group
Helicopter Applicators
University of Nebraska
Texas A&M University
University of Montana
R&D Organization
University of Indiana
SpecTIR
R&D Organization
University of Cincinnati
Canada:
University of Victoria
In total more than 60 sensors delivered
Europe
UK: Infoterra/Astrium, R&D Organization, Natural Environment Research Council
(NERC), R&D organization
Hungary: University of Debrecen, University of Gödöllö
France: University of Rennes
Germany: Anhalt University, Alfred Wegener Institute, Helmholtz-Zentrum für
Umweltforschung GmbH – UFZ, FGAN-FOM
Italy: OGS
Czech Republic: Academy of Sciences
Turkey: R&D Organization
Finland: Forest Research Institute, Helsinki University of Technology
Asia
Japan: Pasco Corp., R&D Organization
China: State Oceanographic Agency, R&D institute
India: R&D organization
Malaysia: University Putra Malaysia, Aeroscan, Forest Dept. of Sarawak
Australia
ARA ( Airborne Research Australia)

AISA applications
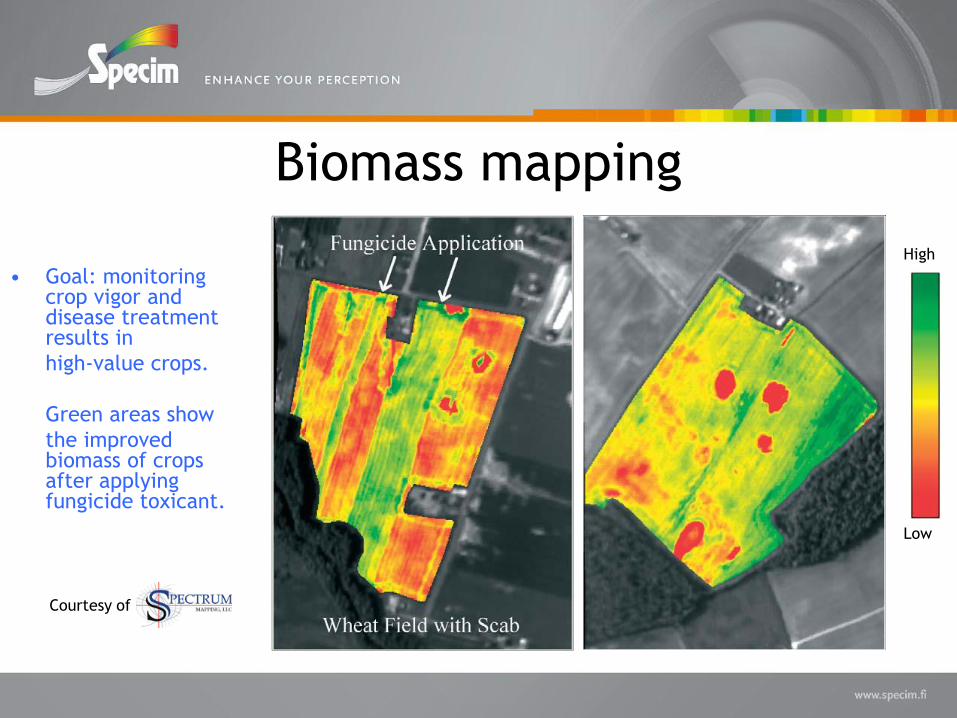
Biomass mapping
• Goal: monitoring crop vigor and disease treatment results in
high-value crops.
Green areas show
the improved biomass of crops after applying fungicide toxicant.
Courtesy of
High
Low
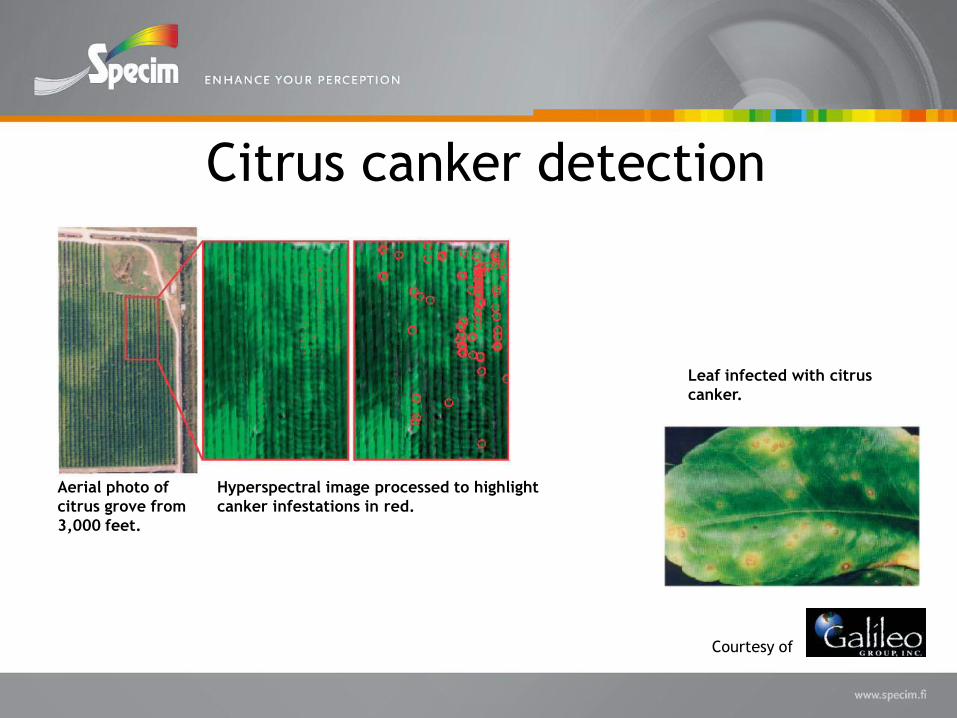
Citrus canker detection
Leaf infected with citrus
canker.
Aerial photo of
citrus grove from
3,000 feet.
Hyperspectral image processed to highlight
canker infestations in red.
Courtesy of
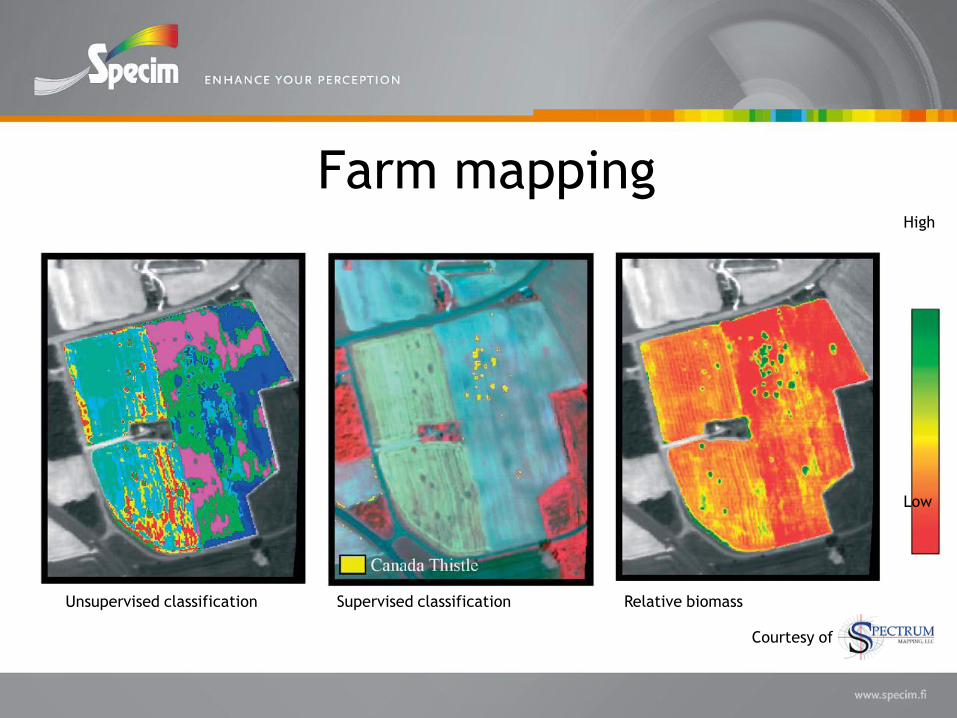
Farm mappingHigh
Low
Unsupervised classification Supervised classification Relative biomass
Courtesy of
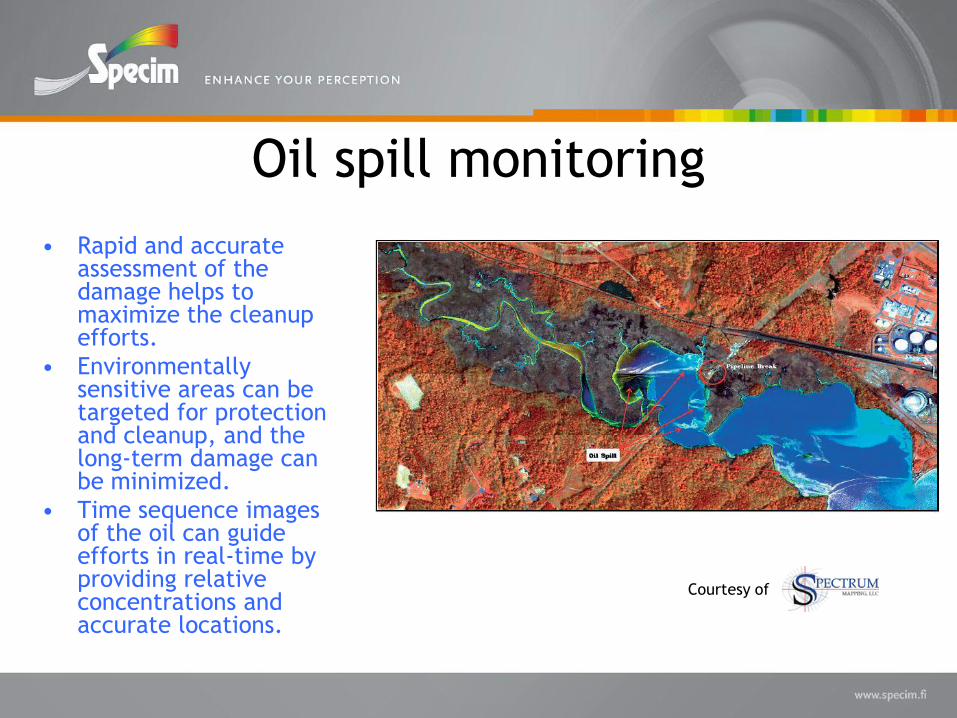
Oil spill monitoring
• Rapid and accurate assessment of the damage helps to maximize the cleanup efforts.
• Environmentally sensitive areas can be targeted for protection and cleanup, and the long-term damage can be minimized.
• Time sequence images of the oil can guide efforts in real-time by providing relative concentrations and accurate locations.
Courtesy of
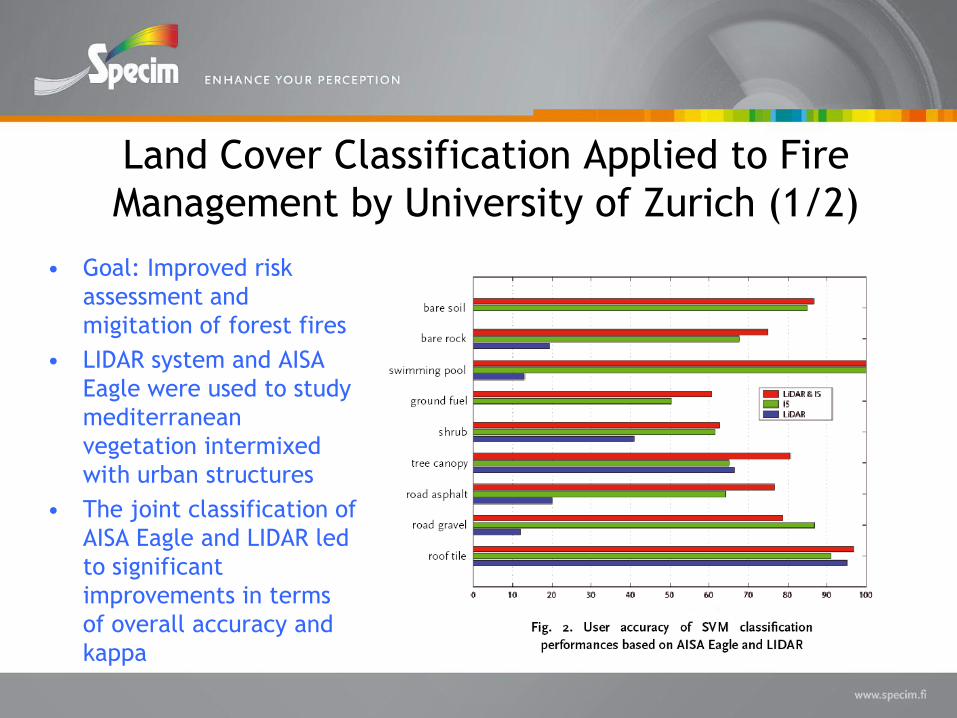
Land Cover Classification Applied to Fire
Management by University of Zurich (1/2)
• Goal: Improved risk
assessment and
migitation of forest fires
• LIDAR system and AISA
Eagle were used to study
mediterranean
vegetation intermixed
with urban structures
• The joint classification of
AISA Eagle and LIDAR led
to significant
improvements in terms
of overall accuracy and
kappa
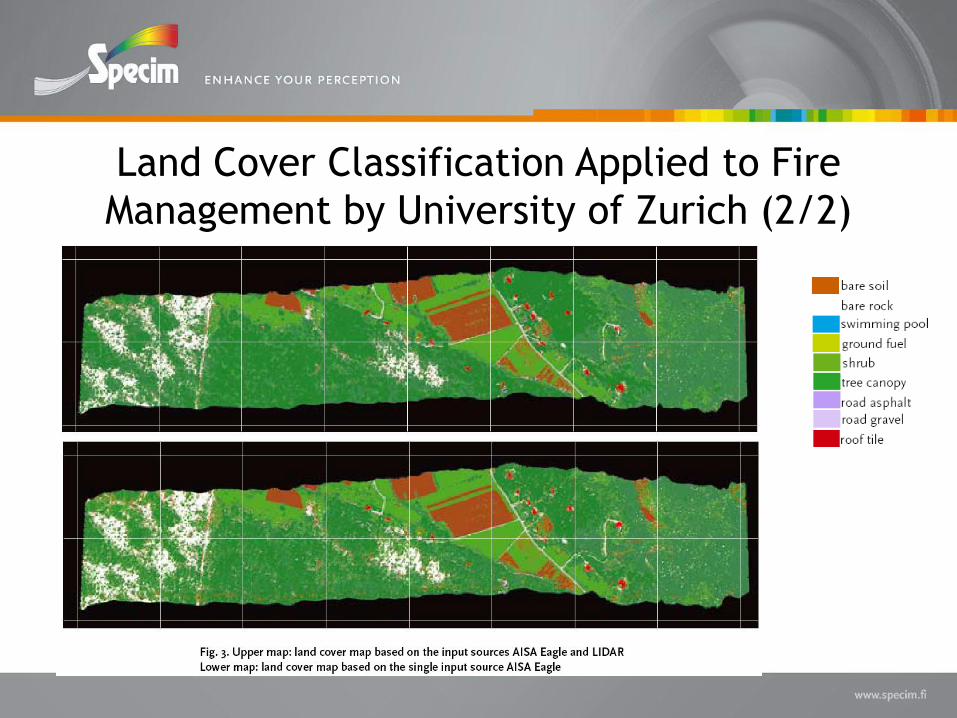
Land Cover Classification Applied to Fire
Management by University of Zurich (2/2)
Fusion of LIDAR and AISA Data in Forest Study by the
University of Victoria, Canada (1/2)
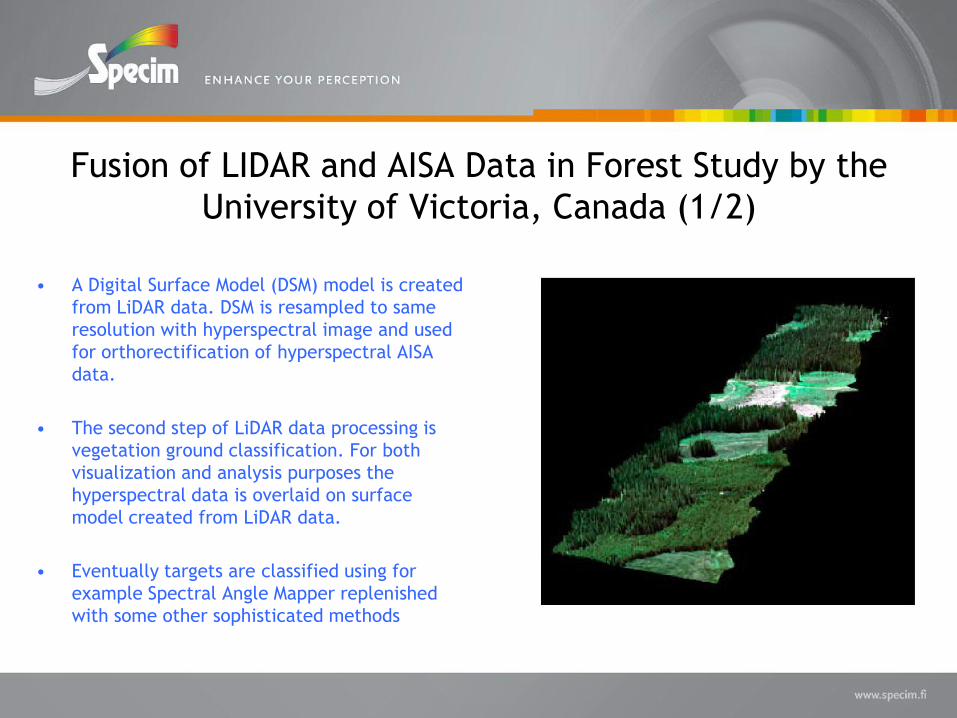
• A Digital Surface Model (DSM) model is created
from LiDAR data. DSM is resampled to same
resolution with hyperspectral image and used
for orthorectification of hyperspectral AISA
data.
• The second step of LiDAR data processing is
vegetation ground classification. For both
visualization and analysis purposes the
hyperspectral data is overlaid on surface
model created from LiDAR data.
• Eventually targets are classified using for
example Spectral Angle Mapper replenished
with some other sophisticated methods
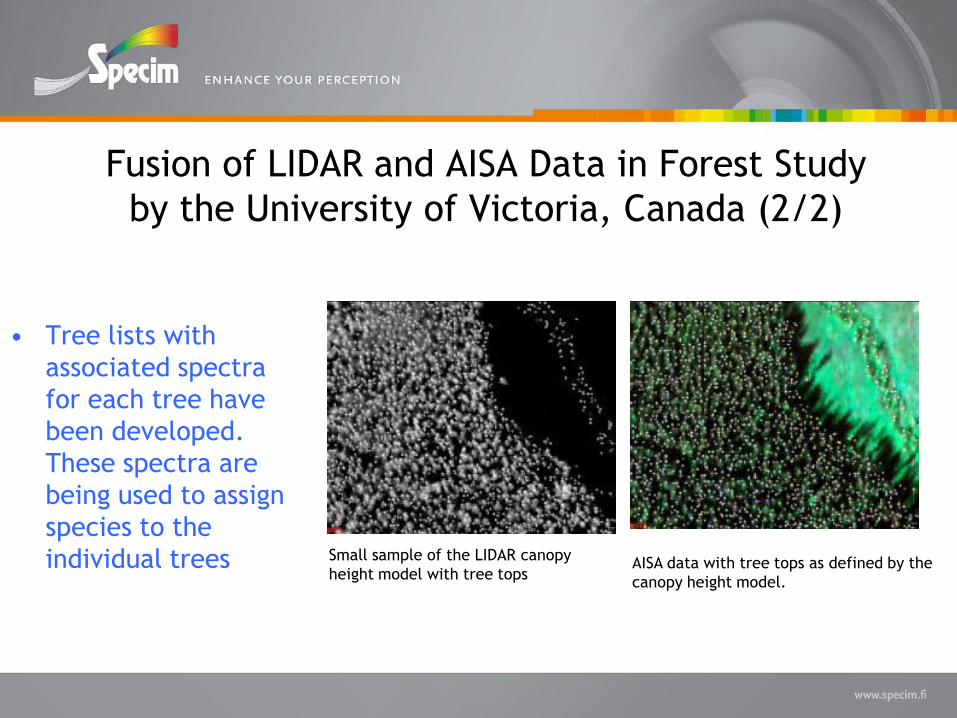
• Tree lists with
associated spectra
for each tree have
been developed.
These spectra are
being used to assign
species to the
individual trees Small sample of the LIDAR canopy
height model with tree topsAISA data with tree tops as defined by the
canopy height model.
Fusion of LIDAR and AISA Data in Forest Study
by the University of Victoria, Canada (2/2)
Mineral Exploration
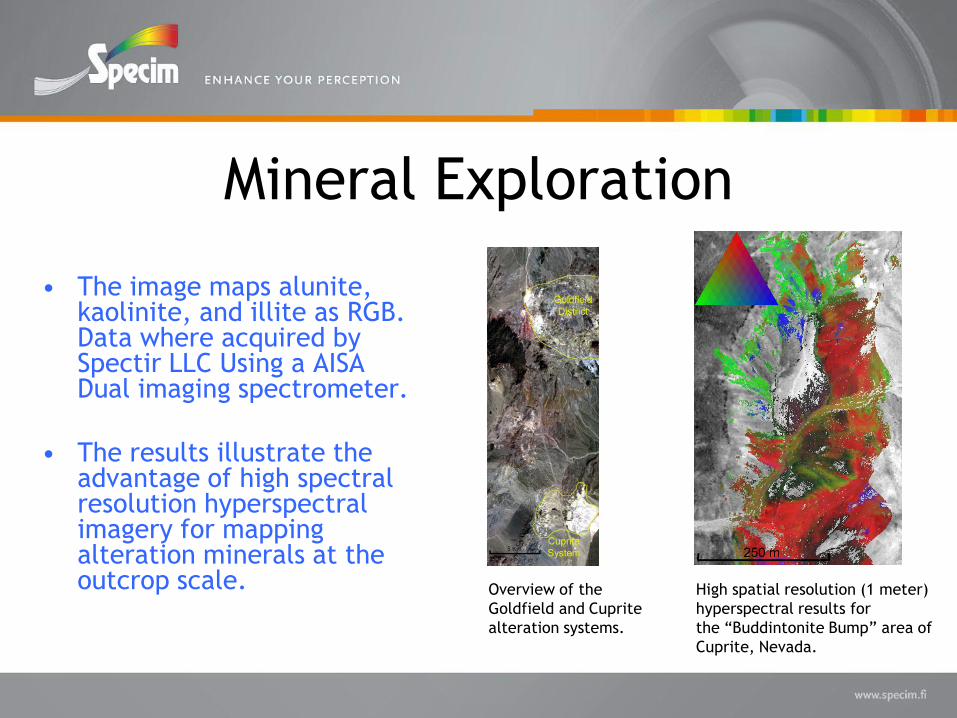
• The image maps alunite, kaolinite, and illite as RGB. Data where acquired by Spectir LLC Using a AISA Dual imaging spectrometer.
• The results illustrate the advantage of high spectral resolution hyperspectral imagery for mapping alteration minerals at the outcrop scale. Overview of the
Goldfield and Cuprite
alteration systems.
High spatial resolution (1 meter)
hyperspectral results for
the “Buddintonite Bump” area of
Cuprite, Nevada.
Automatic Classification of Sedimentary
Stratigraphy (Ragona et al.)
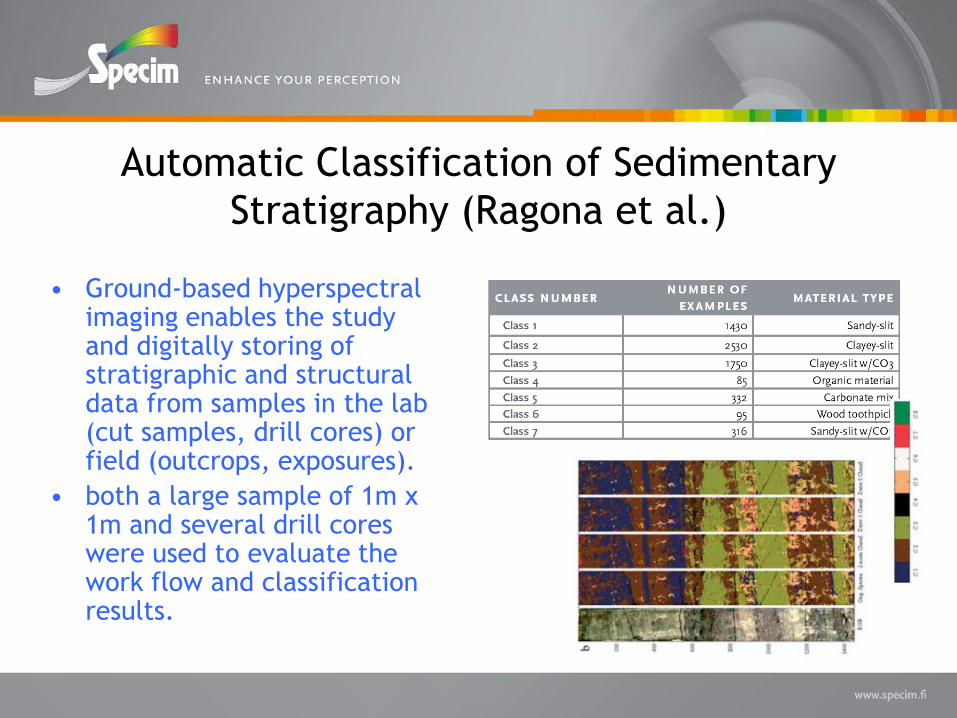
• Ground-based hyperspectral imaging enables the study and digitally storing of stratigraphic and structural data from samples in the lab (cut samples, drill cores) or field (outcrops, exposures).
• both a large sample of 1m x 1m and several drill cores were used to evaluate the work flow and classification results.
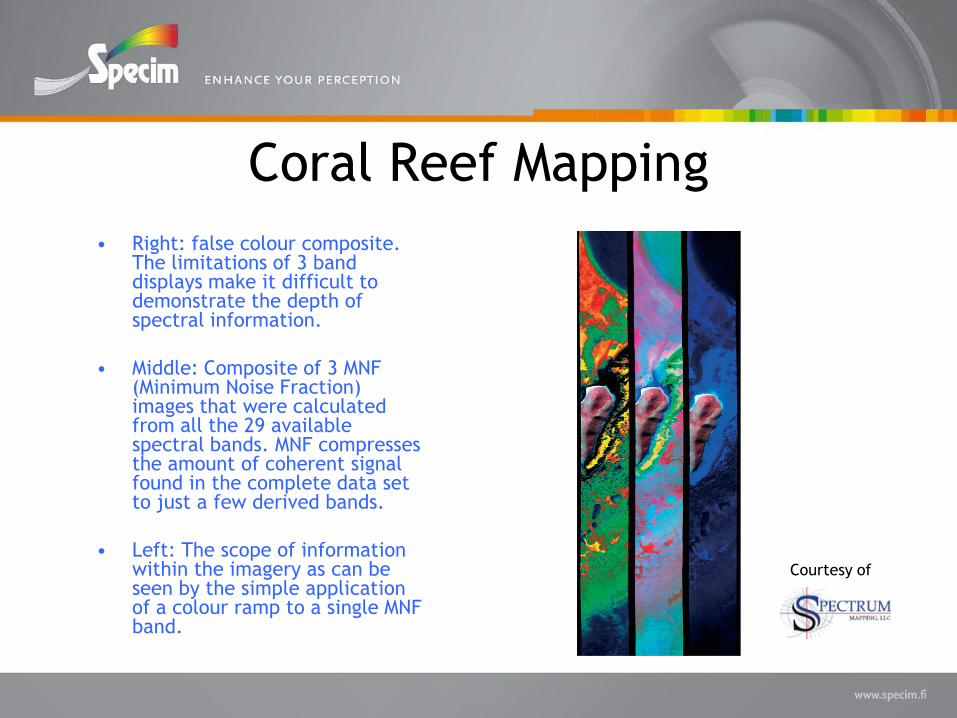
Coral Reef Mapping
• Right: false colour composite. The limitations of 3 band displays make it difficult to demonstrate the depth of spectral information.
• Middle: Composite of 3 MNF (Minimum Noise Fraction) images that were calculated from all the 29 available spectral bands. MNF compresses the amount of coherent signal found in the complete data set to just a few derived bands.
• Left: The scope of information within the imagery as can be seen by the simple application of a colour ramp to a single MNF band.
Courtesy of
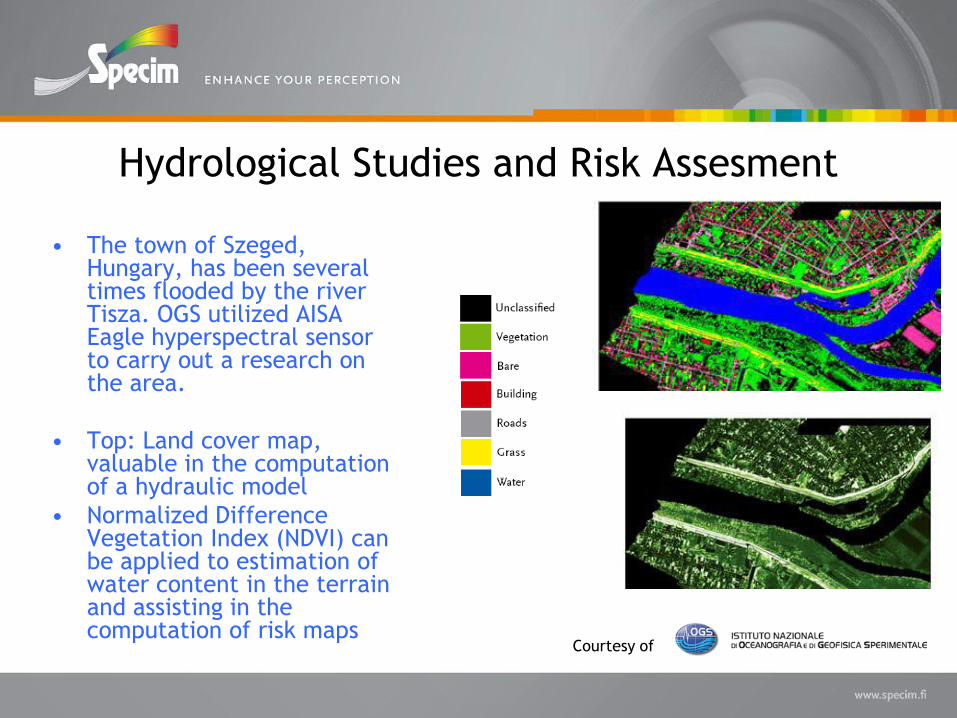
Hydrological Studies and Risk Assesment
• The town of Szeged, Hungary, has been several times flooded by the river Tisza. OGS utilized AISA Eagle hyperspectral sensor to carry out a research on the area.
• Top: Land cover map, valuable in the computation of a hydraulic model
• Normalized Difference Vegetation Index (NDVI) can be applied to estimation of water content in the terrain and assisting in the computation of risk maps
Courtesy of
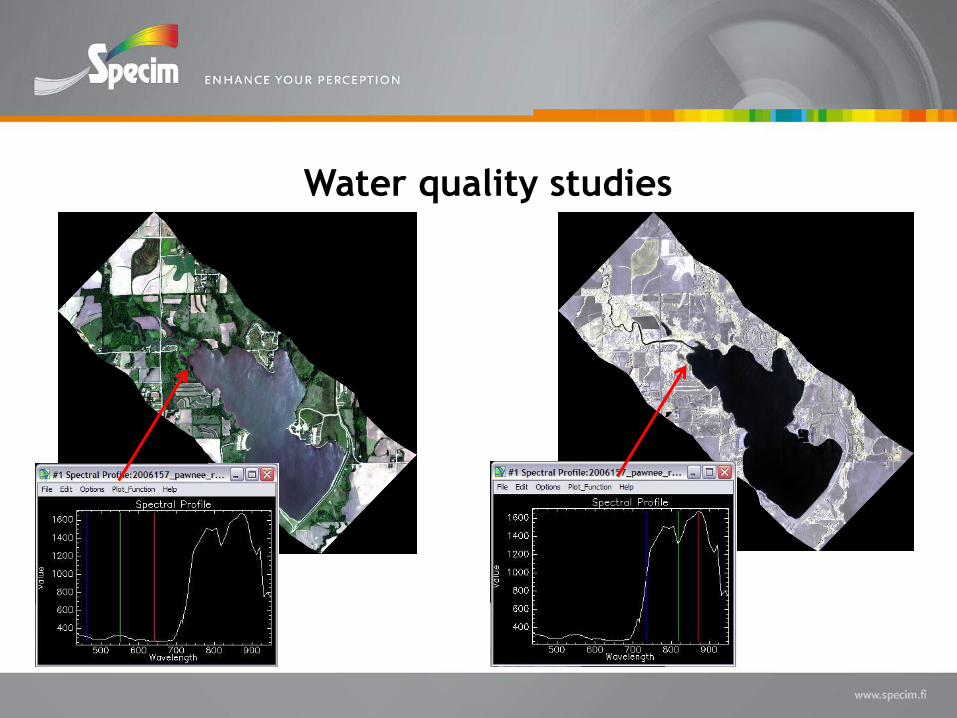
Water quality studies
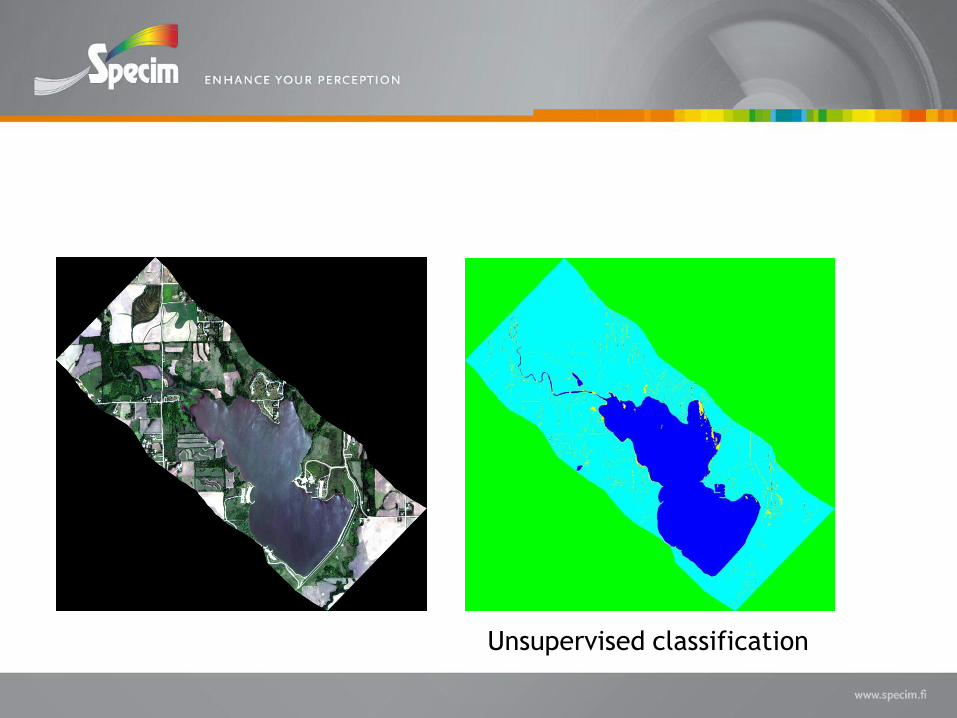
Unsupervised classification
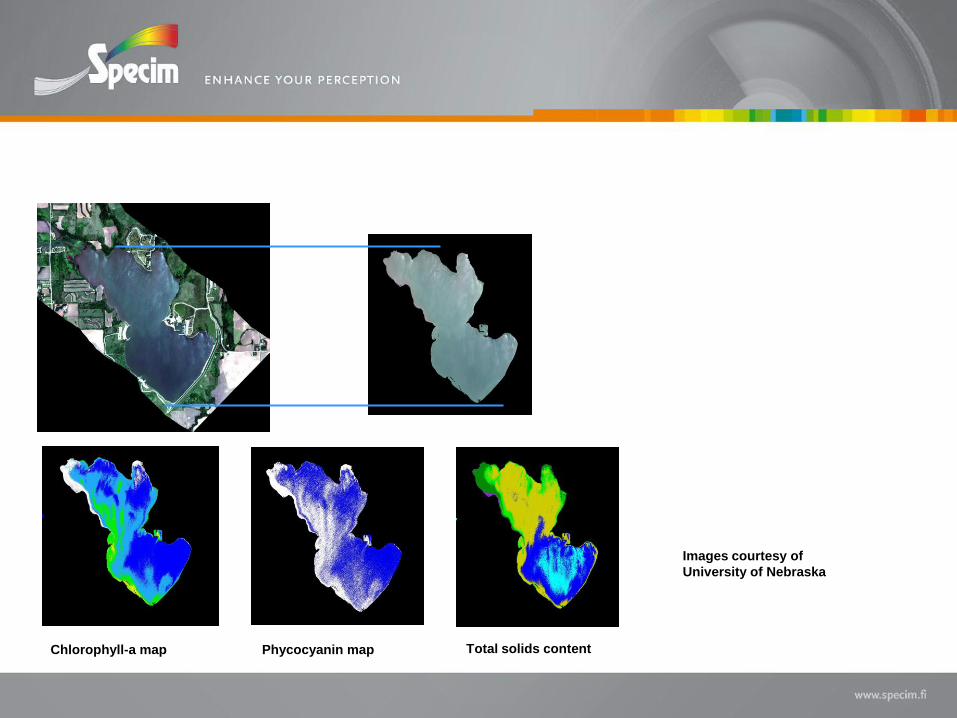
Chlorophyll-a map Phycocyanin map Total solids content
Images courtesy of
University of Nebraska
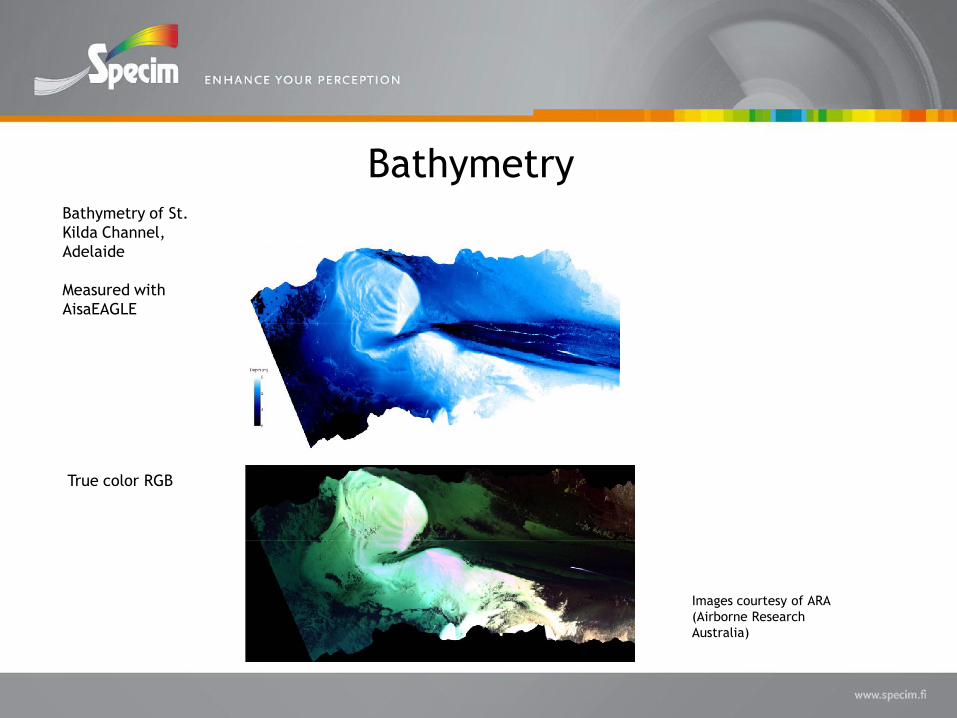
Bathymetry of St.
Kilda Channel,
Adelaide
Measured with
AisaEAGLE
True color RGB
Bathymetry
Images courtesy of ARA
(Airborne Research
Australia)
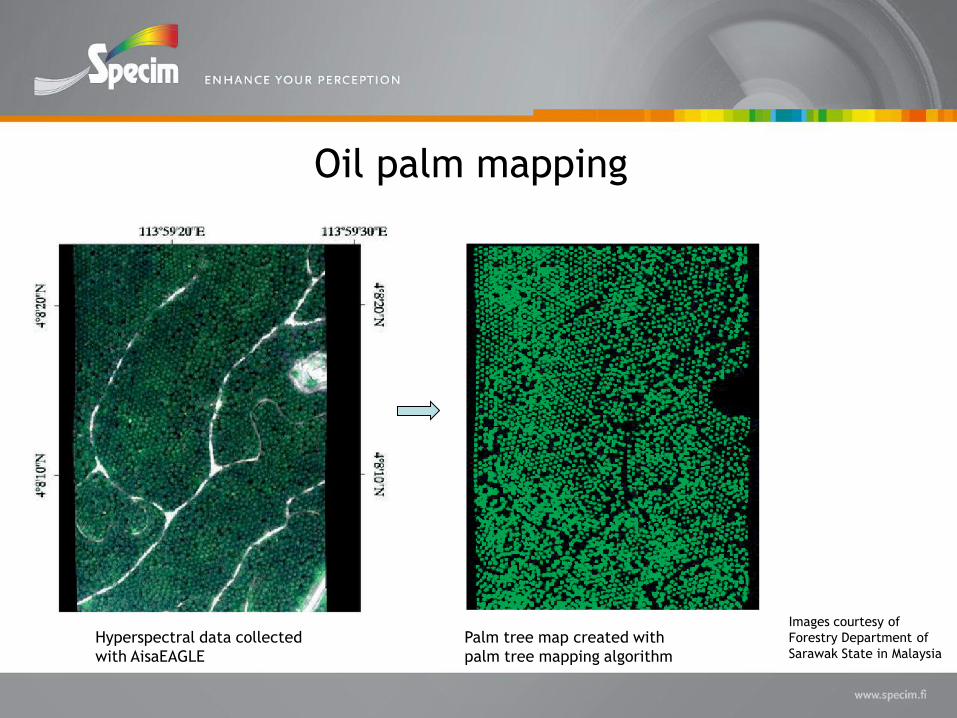
Oil palm mapping
Hyperspectral data collected
with AisaEAGLE
Palm tree map created with
palm tree mapping algorithm
Images courtesy of
Forestry Department of
Sarawak State in Malaysia
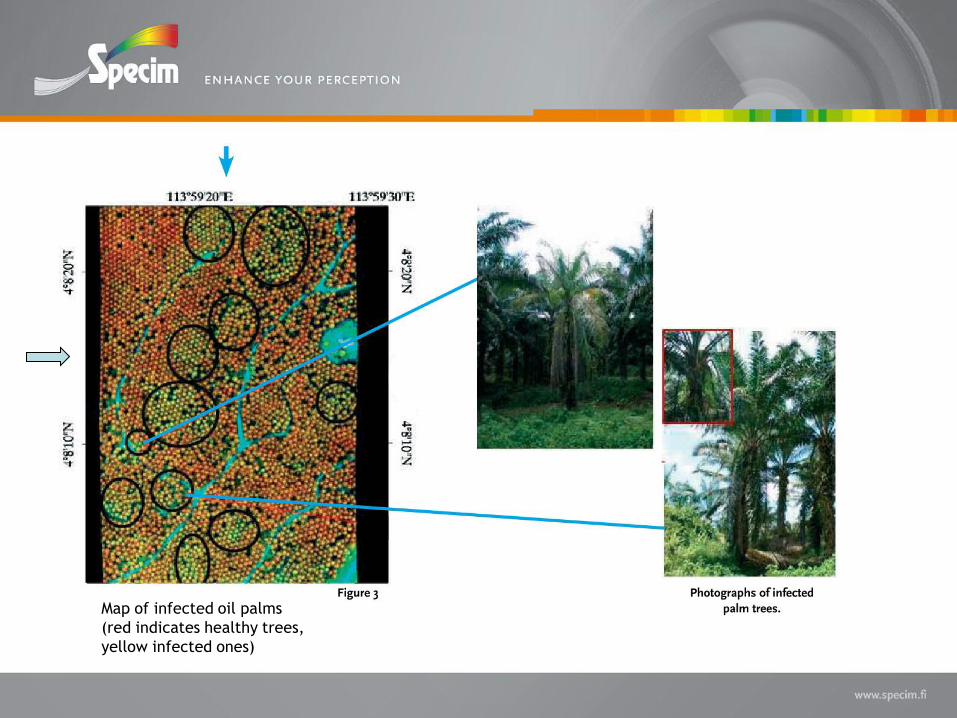
Map of infected oil palms
(red indicates healthy trees,
yellow infected ones)

Your partner in
hyperspectral imaging