
See, Like, Share, Remember: Adolescents’ Responses to ...
25
International Journal of Environmental Research and Public Health Article See, Like, Share, Remember: Adolescents’ Responses to Unhealthy-, Healthy- and Non-Food Advertising in Social Media Gráinne Murphy 1, † , Ciara Corcoran 1, † , Mimi Tatlow-Golden 2, * , Emma Boyland 3 and Brendan Rooney 1 1 Media and Entertainment Lab, School of Psychology, University College Dublin, Belfield, 4 Dublin, Ireland; [email protected] (G.M.); [email protected] (C.C.); [email protected] (B.R.) 2 Faculty of Wellbeing, Education and Language Studies, The Open University, Milton Keynes MK7 6AA, UK 3 Institute of Psychology, Health and Society, University of Liverpool, Liverpool L69 7ZA, UK; [email protected] * Correspondence: [email protected]; Tel.: +44-1908-652684 † Co-first authors who contributed equally to the work. Received: 29 February 2020; Accepted: 20 March 2020; Published: 25 March 2020 Abstract: Media-saturated digital environments seek to influence social media users’ behaviour, including through marketing. The World Health Organization has identified food marketing, including advertising for unhealthy items, as detrimental to health, and in many countries, regulation restricts such marketing and advertising to younger children. Yet regulation rarely addresses adolescents and few studies have examined their responses to social media advertising. In two studies, we examined adolescents’ attention, memory and social responses to advertising posts, including interactions between product types and source of posts. We hypothesized adolescents would respond more positively to unhealthy food advertising compared to healthy food or non-food advertising, and more positively to ads shared by peers or celebrities than to ads shared by a brand. Outcomes measured were (1a) social responses (likelihood to ‘share’, attitude to peer); (1b) brand memory (recall, recognition) and (2) attention (eye-tracking fixation duration and count). Participants were 151 adolescent social media users (Study 1: n = 72; 13–14 years; M = 13.56 years, SD = 0.5; Study 2: n = 79, 13–17 years, M = 15.37 years, SD = 1.351). They viewed 36 fictitious Facebook profile feeds created to show age-typical content. In a 3 × 3 factorial design, each contained an advertising post that varied by content (healthy/unhealthy/non-food) and source (peer/celebrity/company). Generalised linear mixed models showed that advertisements for unhealthy food evoked significantly more positive responses, compared to non-food and healthy food, on 5 of 6 measures: adolescents were more likely to wish to ‘share’ unhealthy posts; rated peers more positively when they had unhealthy posts in their feeds; recalled and recognised a greater number of unhealthy food brands; and viewed unhealthy advertising posts for longer. Interactions with sources (peers, celebrities and companies) were more complex but also favoured unhealthy food advertising. Implications are that regulation of unhealthy food advertising should address adolescents and digital media. Keywords: marketing; advertising; social media; adolescent; food; recall; attention; peers; sharing; obesity 1. Introduction The prevalence of overweight and obesity in young people is rising globally with consequences for long-term health [1,2]. There is strong evidence that marketing, including advertising, for unhealthy food (high in saturated fat, salt or sugar: HFSS) contributes to overweight and obesity [2–4], and a Int. J. Environ. Res. Public Health 2020, 17, 2181; doi:10.3390/ijerph17072181 www.mdpi.com/journal/ijerph
Transcript of See, Like, Share, Remember: Adolescents’ Responses to ...
International Journal of
Environmental Research
and Public Health
Article
See, Like, Share, Remember: Adolescents’ Responsesto Unhealthy-, Healthy- and Non-Food Advertising inSocial Media
Gráinne Murphy 1,†, Ciara Corcoran 1,†, Mimi Tatlow-Golden 2,* , Emma Boyland 3 andBrendan Rooney 1
1 Media and Entertainment Lab, School of Psychology, University College Dublin, Belfield, 4 Dublin, Ireland;[email protected] (G.M.); [email protected] (C.C.); [email protected] (B.R.)
2 Faculty of Wellbeing, Education and Language Studies, The Open University, Milton Keynes MK7 6AA, UK3 Institute of Psychology, Health and Society, University of Liverpool, Liverpool L69 7ZA, UK;
[email protected]* Correspondence: [email protected]; Tel.: +44-1908-652684† Co-first authors who contributed equally to the work.
Received: 29 February 2020; Accepted: 20 March 2020; Published: 25 March 2020�����������������
Abstract: Media-saturated digital environments seek to influence social media users’ behaviour,including through marketing. The World Health Organization has identified food marketing,including advertising for unhealthy items, as detrimental to health, and in many countries, regulationrestricts such marketing and advertising to younger children. Yet regulation rarely addressesadolescents and few studies have examined their responses to social media advertising. In twostudies, we examined adolescents’ attention, memory and social responses to advertising posts,including interactions between product types and source of posts. We hypothesized adolescentswould respond more positively to unhealthy food advertising compared to healthy food or non-foodadvertising, and more positively to ads shared by peers or celebrities than to ads shared by a brand.Outcomes measured were (1a) social responses (likelihood to ‘share’, attitude to peer); (1b) brand memory(recall, recognition) and (2) attention (eye-tracking fixation duration and count). Participants were 151adolescent social media users (Study 1: n = 72; 13–14 years; M = 13.56 years, SD = 0.5; Study 2: n = 79,13–17 years, M = 15.37 years, SD = 1.351). They viewed 36 fictitious Facebook profile feeds created toshow age-typical content. In a 3 × 3 factorial design, each contained an advertising post that variedby content (healthy/unhealthy/non-food) and source (peer/celebrity/company). Generalised linearmixed models showed that advertisements for unhealthy food evoked significantly more positiveresponses, compared to non-food and healthy food, on 5 of 6 measures: adolescents were more likelyto wish to ‘share’ unhealthy posts; rated peers more positively when they had unhealthy posts in theirfeeds; recalled and recognised a greater number of unhealthy food brands; and viewed unhealthyadvertising posts for longer. Interactions with sources (peers, celebrities and companies) were morecomplex but also favoured unhealthy food advertising. Implications are that regulation of unhealthyfood advertising should address adolescents and digital media.
Keywords: marketing; advertising; social media; adolescent; food; recall; attention; peers;sharing; obesity
1. Introduction
The prevalence of overweight and obesity in young people is rising globally with consequences forlong-term health [1,2]. There is strong evidence that marketing, including advertising, for unhealthyfood (high in saturated fat, salt or sugar: HFSS) contributes to overweight and obesity [2–4], and a
Int. J. Environ. Res. Public Health 2020, 17, 2181; doi:10.3390/ijerph17072181 www.mdpi.com/journal/ijerph
Int. J. Environ. Res. Public Health 2020, 17, 2181 2 of 25
consensus is increasingly developing that the persuasive actions marketers engage in, to influencechildren’s (including adolescents’) behaviour, infringes children’s rights, including rights to healthand not to be exploited [5,6]. However, much of the existing evidence for young people’s interactionswith marketing and its effects has been generated for television and for younger children rather thanadolescents [3]. Yet young people spend increasing amounts of time engaged in online activities [7–9].
Advertisers have extensive digital media presence including on social and media-sharing platformswhere they promote products and brands as exciting and interactive [6,10,11]. In digital media (asin traditional media), most food and beverage advertising is for unhealthy items: reports indicate65%–80% of food advertising online is for HFSS products or brands associated with these foods [12–14].Furthermore, as food and beverage companies have extensive followings online, including amongteens, their activities reach large audiences [15]; the food brands with the greatest potential reachamongst teens are almost all brands with many or mostly unhealthy products in their portfolios [16].Adolescents are at risk of exposure to unhealthy food advertising because of their very high levelsof Internet and social media usage. Diary, screen-recording and avatar studies indicate high levelsof exposure [12,14,17]. However, evidence for how young people engage with and respond to foodadvertising in digital media remains limited [4,6].
Although adolescents understand the persuasive intent of advertising, they are hypothesized tolack the motivation and ability to defend against its effects [6,18,19]. Alcohol and tobacco advertisingresearch suggests that moderation of advertising influence is dependent on viewers’ self-control [20], aquality often still developing in adolescence. Research also points to hypersensitivity to reward in theadolescent years [21]. Furthermore, specific features of digital media advertising may reduce cognitivedefences to effects of marketing [22]. Brands on social media regularly create interactive content notpresent in traditional media [6,11] which is highly integrated and often difficult to distinguish fromnon-marketing content [23]. Online marketing also engages with users’ social networks, insertingthemselves into adolescents’ social lives by presenting brands as ‘liked’ by friends and encouragingusers to interact with brands as if they were individuals [24,25]. Thus, despite being advertising-literate,adolescents are likely to be vulnerable to food advertising.
1.1. Adolescents and Peers Online
Adolescents are particularly susceptible to social effects as they are motivated to interact withtheir peers [26] and, in social media, to connect with and view friends’ profiles [8]. Sharing socialmedia content with friends serves a number of psychological incentives including self-expression andconnecting with others [27]. Adolescents give careful consideration to the image they present online,conveying a socially acceptable self-image to others by sharing content popular with friends [28].They place a great importance on peer norms and acceptance [29], identifying with their friends andgenerally with those of the same gender [30]. As social media sites allow users to connect with friendsextensively [31], they are a powerful means for transmitting norms, ideas and behaviours.
The normative model of eating indicates that eating is directed by situational norms, the eatingbehaviours of those present, and their social approval [32]. Compared to preadolescents, teen peersexert more influence on food choice [33,34]: adolescents describe eating more unhealthy foods atschool and with their friends than at home [35] and exchanges with peers stimulate unhealthy eatingbehaviours [36,37]: teens attempt to manage peers’ impressions of them through altering eating habitsin order to meet what they perceive as the social norm [38,39]. Presenting or ‘sharing’ pictures of foodis a popular activity in social media [40]. Peers are often thought to be more trustworthy than brands,and effects of online advertising are reported to be amplified when this is endorsed by a peer [6,41].
1.2. Celebrities
Social media allows users to interact not only with peers but view content posted by celebrities,who have role model status for young people [42]. Social media users can gain the illusion of a personalconnection with celebrities, following updates in a similar way that they do from friends and family
Int. J. Environ. Res. Public Health 2020, 17, 2181 3 of 25
and with whom they may develop ‘parasocial’ relationships: for example, a study of fans’ interactionwith the reality television personality Kim Kardashian’s online persona found they felt they were in areciprocal, parasocial friendship [43,44]. Sports stars, music celebrities and online influencers regularlypromote unhealthy food; up to one quarter of endorsements by music celebrities and athletes arepromotions of HFSS foods and beverages [45,46], which can lead to increased consumption [47], oftenover healthier options [48].
1.3. Recall, Recognition and Attention
The food advertising hierarchy of effects framework [49] indicates that brand recall and recognitioninfluence brand attitudes and eating behaviours, which lead to weight-related outcomes.
After advertising is viewed, it is retained in memory either explicitly (i.e., with consciousawareness) or implicitly [50,51]; and greater cognitive processing leads to easier recall [52].
As media use increases, however, and multiple-device viewing becomes the norm [7], it is reportedthat only 10% of all online advertisements are attended to [53] so it is important, rather than identifyingthe mere presence of marketing content in social media, to identify what is attended to. Eye-tracking isa widely used index of attentional selection [54] with longer and greater number of fixations associatedwith a more favourable opinion of the item [55]. Attention can lead to altered eating patterns in youngpeople [56], and unhealthy food items attract greater interest than healthy and non-food items [57,58].Social context is thought to play a significant role in ad recall, awareness and intent to purchase [41]but evidence is limited, particularly so for social context in the online space.
This study aimed to determine adolescents’ responses to healthy, unhealthy, and non-foodadvertising. The food advertising hierarchy of effects framework [49] synthesizes multiple theoriesand strands of empirical research to conclude that repeated exposure to advertising triggers recalland recognition, positive attitudes and normalization of promoted products, and subsequently, whenexposed to relevant cues, intent to purchase or consume. Theories of social norms of eating canbe nested within this model and these indicate that social groups establish norms for appropriatefoods [59]. In social media, social norms of food are displayed, disseminated and reinforced, as youngpeople do not just see food advertising but can also choose to share it with their ‘imagined audience’of peers [27], and in turn can also assess their peers based on such content. Thus, the identity andself-presentation-based normative goals of the adolescent years [27] are interwoven in social mediawith food advertising.
Given the networked and fluid nature of social media, where – in contrast to broadcastmedia—advertising is presented to users not only from companies themselves but also via multipleother sources, including peers and celebrities who may be considered more trustworthy than brands,the study also examined effects of the source of advertising posts viewed.
The study investigated adolescents’ responses to advertisements for three types of products in socialmedia: unhealthy food, healthier food, and non-food. It also measured effects of the source of thesesocial media advertising posts. It is novel owing to its inclusion of healthy, unhealthy and non-fooditems, the social contexts of advertising received by adolescents in social media, and in combiningobjective measures of attention using eye-tracking technology not only with brand memory but alsowith self-report of social responses: we are unaware of any previous study to do this.
Assessing social responses, memory and attention, we hypothesized that participants will respondmore positively to unhealthy food brands, compared to healthy food or non-food brands; and toadvertising posts whose source appeared to be a celebrity or a fictional peer, rather than a brandor company.
Int. J. Environ. Res. Public Health 2020, 17, 2181 4 of 25
2. Materials and Methods
2.1. Design
This mixed methods study involved two experimental studies (with outcome measures in threedomains) designed to replicate a social media viewing experience. Both studies involved repeatedmeasures true experiments with a 3 × 3 factorial design using a sequence of profile news feeds designedto mimic Facebook. In these, the content of target advertising posts varied systematically betweenhealthy food, unhealthy food, and non-food; the source varied systematically between peer, celebrity,and company. Each combination of factors appeared four times (i.e., four trials) with a different brandeach time (total 36 feeds). Adolescents’ responses to advertisements in social media were measuredthrough three modalities: social responses, memory for brands, and attention to advertising posts.Dependent variables were
Study 1a Social responses
(i) likelihood to ‘share’ advertising posts(ii) attitude to peer
Study1b: Memory for brands
(iii) free brand recall(iv) prompted brand recognition
Study 2: Attention to advertising
(v) mean fixation duration(vi) mean fixation count
2.2. Stimulus Material
Facebook ‘News Feed’. Facebook was the most widely used social media platform amongstadolescents in Ireland in the most comprehensive study available at the time of designing thematerials [8]. Ecologically valid stimuli were created to resemble Facebook News Feeds of fictitiousteen users (36 males and 36 females). To match Facebook’s design, each page contained a small profilepicture and owner’s name (See Figure 1). Profile usernames were generated using common first namesof the cohort identified in the Irish Central Statistics Office release for 2000 [60].
Each ‘profile view’ contained one advertising post (the target image), and two distractors. Eachadvertising post represented one content/source condition (e.g., unhealthy food ad, posted by a peer;or non-food ad, posted by a celebrity). For the two distractor posts, one was a full post with an imagee.g., quotations, cartoons, status updates and images of people, animals and places. The other wastext-only, shortened to give the impression that the feed continued below the screen.
In half the feeds, the advertising post appeared first. While the usernames and distractor imagesdiffered by gender, advertising images remained the same. To reduce potential confounds, the ‘like’,‘share’ and ‘comment’ buttons contained no additional information, as ‘likes’ have been found toinfluence adolescents’ attitudes toward content.
Int. J. Environ. Res. Public Health 2020, 17, 2181 5 of 25
Int. J. Environ. Res. Public Health 2020, 17, x 5 of 24
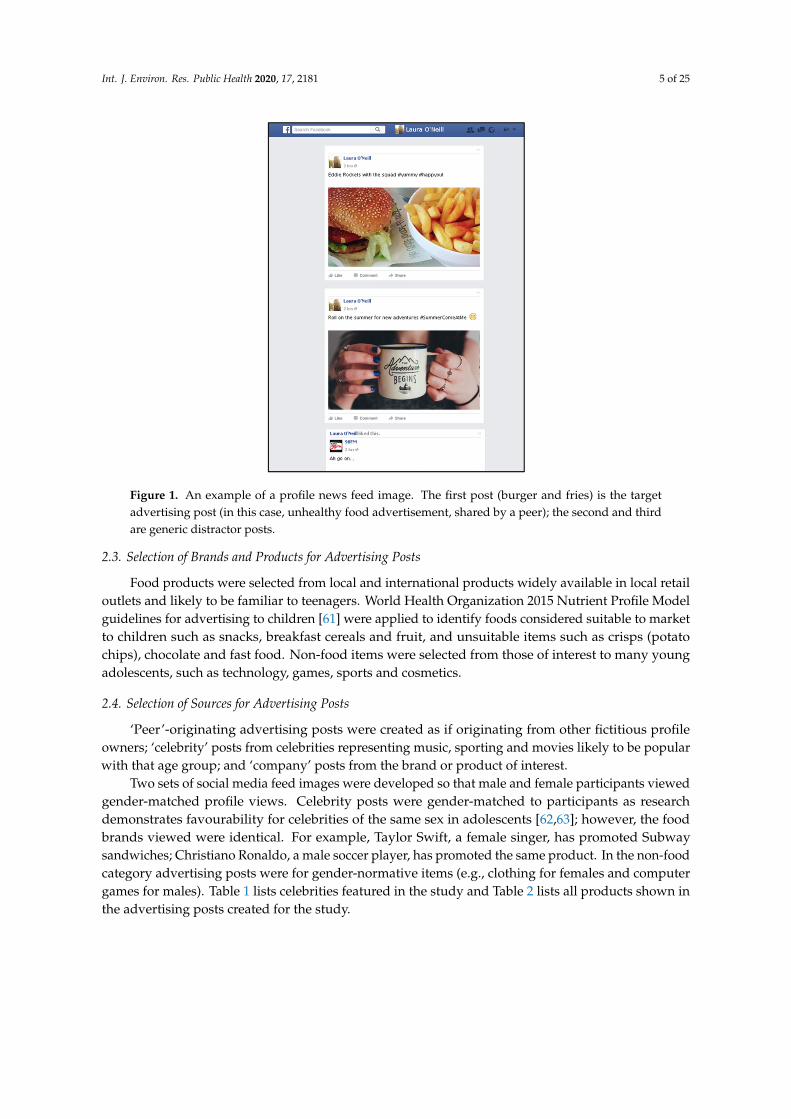
Figure 1. An example of a profile news feed image. The first post (burger and fries) is the target advertising post (in this case, unhealthy food advertisement, shared by a peer); the second and third are generic distractor posts.
In half the feeds, the advertising post appeared first. While the usernames and distractor images differed by gender, advertising images remained the same. To reduce potential confounds, the ‘like’, ‘share’ and ‘comment’ buttons contained no additional information, as ‘likes’ have been found to influence adolescents’ attitudes toward content.
2.3. Selection of Brands and Products for Advertising Posts
Food products were selected from local and international products widely available in local retail outlets and likely to be familiar to teenagers. World Health Organization 2015 Nutrient Profile Model guidelines for advertising to children [61] were applied to identify foods considered suitable to market to children such as snacks, breakfast cereals and fruit, and unsuitable items such as crisps (potato chips), chocolate and fast food. Non-food items were selected from those of interest to many young adolescents, such as technology, games, sports and cosmetics.
2.4. Selection of Sources for Advertising Posts
‘Peer’-originating advertising posts were created as if originating from other fictitious profile owners; ‘celebrity’ posts from celebrities representing music, sporting and movies likely to be popular with that age group; and ‘company’ posts from the brand or product of interest.
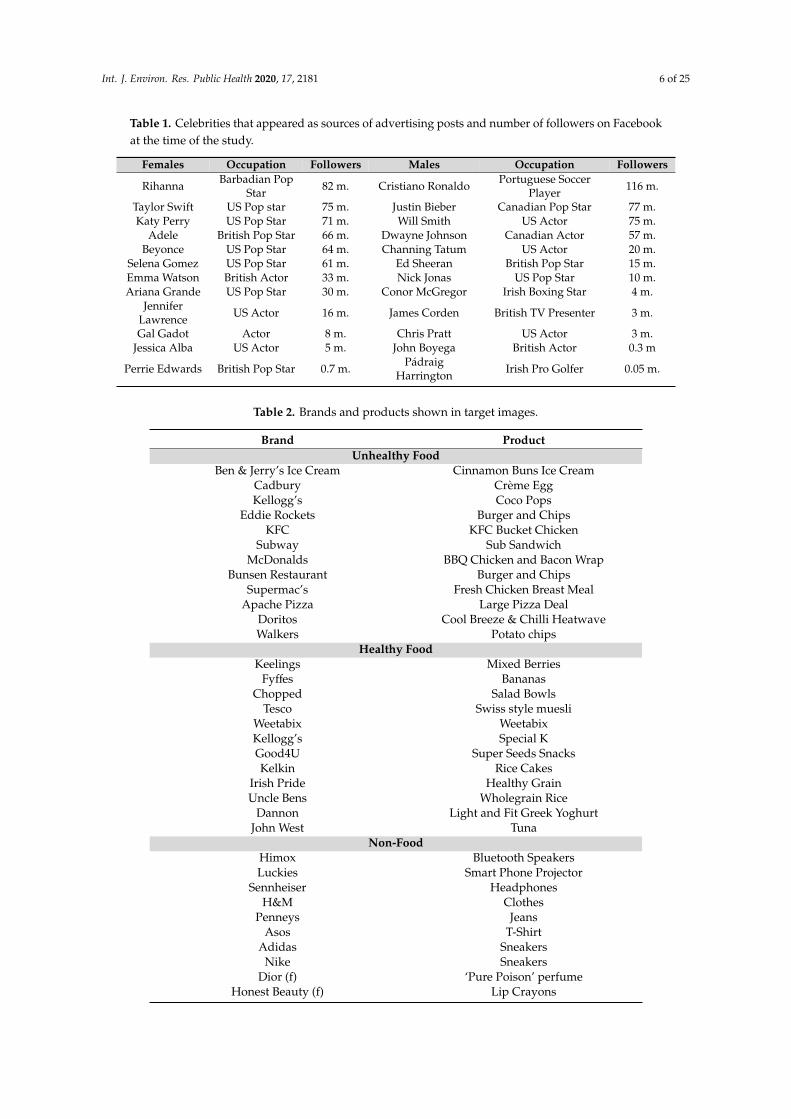
Two sets of social media feed images were developed so that male and female participants viewed gender-matched profile views. Celebrity posts were gender-matched to participants as research demonstrates favourability for celebrities of the same sex in adolescents [62,63]; however, the food brands viewed were identical. For example, Taylor Swift, a female singer, has promoted Subway sandwiches; Christiano Ronaldo, a male soccer player, has promoted the same product. In the non-food category advertising posts were for gender-normative items (e.g., clothing for females and computer games for males). Table 1 lists celebrities featured in the study and Table 2 lists all products shown in the advertising posts created for the study.
Table 1. Celebrities that appeared as sources of advertising posts and number of followers on Facebook at the time of the study.
Figure 1. An example of a profile news feed image. The first post (burger and fries) is the targetadvertising post (in this case, unhealthy food advertisement, shared by a peer); the second and thirdare generic distractor posts.
2.3. Selection of Brands and Products for Advertising Posts
Food products were selected from local and international products widely available in local retailoutlets and likely to be familiar to teenagers. World Health Organization 2015 Nutrient Profile Modelguidelines for advertising to children [61] were applied to identify foods considered suitable to marketto children such as snacks, breakfast cereals and fruit, and unsuitable items such as crisps (potatochips), chocolate and fast food. Non-food items were selected from those of interest to many youngadolescents, such as technology, games, sports and cosmetics.
2.4. Selection of Sources for Advertising Posts
‘Peer’-originating advertising posts were created as if originating from other fictitious profileowners; ‘celebrity’ posts from celebrities representing music, sporting and movies likely to be popularwith that age group; and ‘company’ posts from the brand or product of interest.
Two sets of social media feed images were developed so that male and female participants viewedgender-matched profile views. Celebrity posts were gender-matched to participants as researchdemonstrates favourability for celebrities of the same sex in adolescents [62,63]; however, the foodbrands viewed were identical. For example, Taylor Swift, a female singer, has promoted Subwaysandwiches; Christiano Ronaldo, a male soccer player, has promoted the same product. In the non-foodcategory advertising posts were for gender-normative items (e.g., clothing for females and computergames for males). Table 1 lists celebrities featured in the study and Table 2 lists all products shown inthe advertising posts created for the study.
Int. J. Environ. Res. Public Health 2020, 17, 2181 6 of 25
Table 1. Celebrities that appeared as sources of advertising posts and number of followers on Facebookat the time of the study.
Females Occupation Followers Males Occupation Followers
Rihanna Barbadian PopStar 82 m. Cristiano Ronaldo Portuguese Soccer
Player 116 m.
Taylor Swift US Pop star 75 m. Justin Bieber Canadian Pop Star 77 m.Katy Perry US Pop Star 71 m. Will Smith US Actor 75 m.
Adele British Pop Star 66 m. Dwayne Johnson Canadian Actor 57 m.Beyonce US Pop Star 64 m. Channing Tatum US Actor 20 m.
Selena Gomez US Pop Star 61 m. Ed Sheeran British Pop Star 15 m.Emma Watson British Actor 33 m. Nick Jonas US Pop Star 10 m.Ariana Grande US Pop Star 30 m. Conor McGregor Irish Boxing Star 4 m.
JenniferLawrence US Actor 16 m. James Corden British TV Presenter 3 m.
Gal Gadot Actor 8 m. Chris Pratt US Actor 3 m.Jessica Alba US Actor 5 m. John Boyega British Actor 0.3 m
Perrie Edwards British Pop Star 0.7 m. PádraigHarrington Irish Pro Golfer 0.05 m.
Table 2. Brands and products shown in target images.
Brand ProductUnhealthy Food
Ben & Jerry’s Ice Cream Cinnamon Buns Ice CreamCadbury Crème EggKellogg’s Coco Pops
Eddie Rockets Burger and ChipsKFC KFC Bucket Chicken
Subway Sub SandwichMcDonalds BBQ Chicken and Bacon Wrap
Bunsen Restaurant Burger and ChipsSupermac’s Fresh Chicken Breast Meal
Apache Pizza Large Pizza DealDoritos Cool Breeze & Chilli HeatwaveWalkers Potato chips
Healthy FoodKeelings Mixed Berries
Fyffes BananasChopped Salad Bowls
Tesco Swiss style muesliWeetabix WeetabixKellogg’s Special KGood4U Super Seeds SnacksKelkin Rice Cakes
Irish Pride Healthy GrainUncle Bens Wholegrain Rice
Dannon Light and Fit Greek YoghurtJohn West Tuna
Non-FoodHimox Bluetooth SpeakersLuckies Smart Phone Projector
Sennheiser HeadphonesH&M Clothes
Penneys JeansAsos T-Shirt
Adidas SneakersNike Sneakers
Dior (f) ‘Pure Poison’ perfumeHonest Beauty (f) Lip Crayons
Int. J. Environ. Res. Public Health 2020, 17, 2181 7 of 25
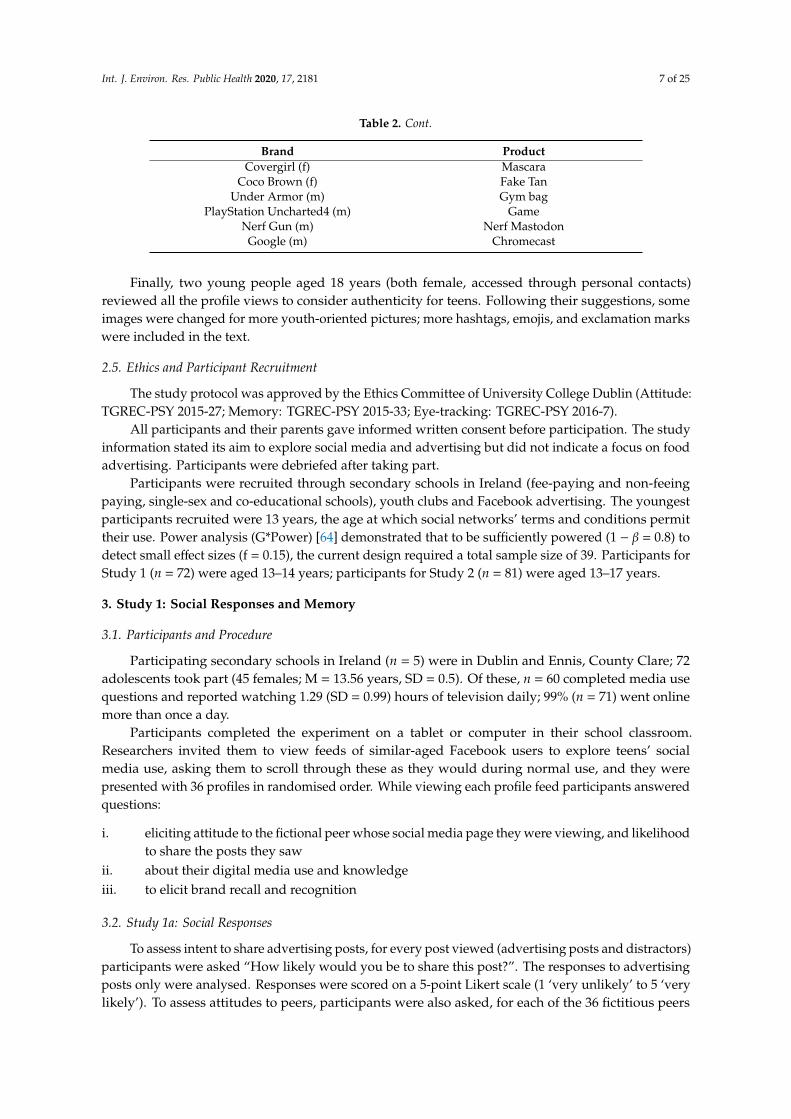
Table 2. Cont.
Brand ProductCovergirl (f) Mascara
Coco Brown (f) Fake TanUnder Armor (m) Gym bag
PlayStation Uncharted4 (m) GameNerf Gun (m) Nerf Mastodon
Google (m) Chromecast
Finally, two young people aged 18 years (both female, accessed through personal contacts)reviewed all the profile views to consider authenticity for teens. Following their suggestions, someimages were changed for more youth-oriented pictures; more hashtags, emojis, and exclamation markswere included in the text.
2.5. Ethics and Participant Recruitment
The study protocol was approved by the Ethics Committee of University College Dublin (Attitude:TGREC-PSY 2015-27; Memory: TGREC-PSY 2015-33; Eye-tracking: TGREC-PSY 2016-7).
All participants and their parents gave informed written consent before participation. The studyinformation stated its aim to explore social media and advertising but did not indicate a focus on foodadvertising. Participants were debriefed after taking part.
Participants were recruited through secondary schools in Ireland (fee-paying and non-feeingpaying, single-sex and co-educational schools), youth clubs and Facebook advertising. The youngestparticipants recruited were 13 years, the age at which social networks’ terms and conditions permittheir use. Power analysis (G*Power) [64] demonstrated that to be sufficiently powered (1 − β = 0.8) todetect small effect sizes (f = 0.15), the current design required a total sample size of 39. Participants forStudy 1 (n = 72) were aged 13–14 years; participants for Study 2 (n = 81) were aged 13–17 years.
3. Study 1: Social Responses and Memory
3.1. Participants and Procedure
Participating secondary schools in Ireland (n = 5) were in Dublin and Ennis, County Clare; 72adolescents took part (45 females; M = 13.56 years, SD = 0.5). Of these, n = 60 completed media usequestions and reported watching 1.29 (SD = 0.99) hours of television daily; 99% (n = 71) went onlinemore than once a day.
Participants completed the experiment on a tablet or computer in their school classroom.Researchers invited them to view feeds of similar-aged Facebook users to explore teens’ socialmedia use, asking them to scroll through these as they would during normal use, and they werepresented with 36 profiles in randomised order. While viewing each profile feed participants answeredquestions:
i. eliciting attitude to the fictional peer whose social media page they were viewing, and likelihoodto share the posts they saw
ii. about their digital media use and knowledgeiii. to elicit brand recall and recognition
3.2. Study 1a: Social Responses
To assess intent to share advertising posts, for every post viewed (advertising posts and distractors)participants were asked “How likely would you be to share this post?”. The responses to advertisingposts only were analysed. Responses were scored on a 5-point Likert scale (1 ‘very unlikely’ to 5 ‘verylikely’). To assess attitudes to peers, participants were also asked, for each of the 36 fictitious peers
Int. J. Environ. Res. Public Health 2020, 17, 2181 8 of 25
“What kind of impression do you have of this person?” (5-point Likert scale, 1 ‘very negative’to 5 ‘verypositive’).
3.2.1. Analysis
Data were cleaned: 8 of the 72 participants appeared not understand the recall question (withresponses such as ‘?’ or ‘X’) or chose not to answer it, and 4 did not attempt the recognition question;these were removed from the dataset. Trials were combined to produce average score within each ofthe 3 x 3 repeated categories. A generalised log linear mixed model was used to test the hypothesesand was separately generated for the two dependent variables of peer attitude and self-representation(likelihood of sharing). Ad content (Unhealthy food, Non-food, Healthy food) and Source of ad (Peer,Celebrity, Company) were the independent (predictor) variables. In both models, the product type,source type, gender, age, and internet use were fixed factors and participant ID as a random factor.Company-shared non-food brands were set as the baseline. This allowed for an exploration of howother forms of sharing compared to the condition that most closely resembled traditional advertising.Analyses explored these rates in conjunction with effects of the source of the advertising post.
3.2.2. Attitude to Peer
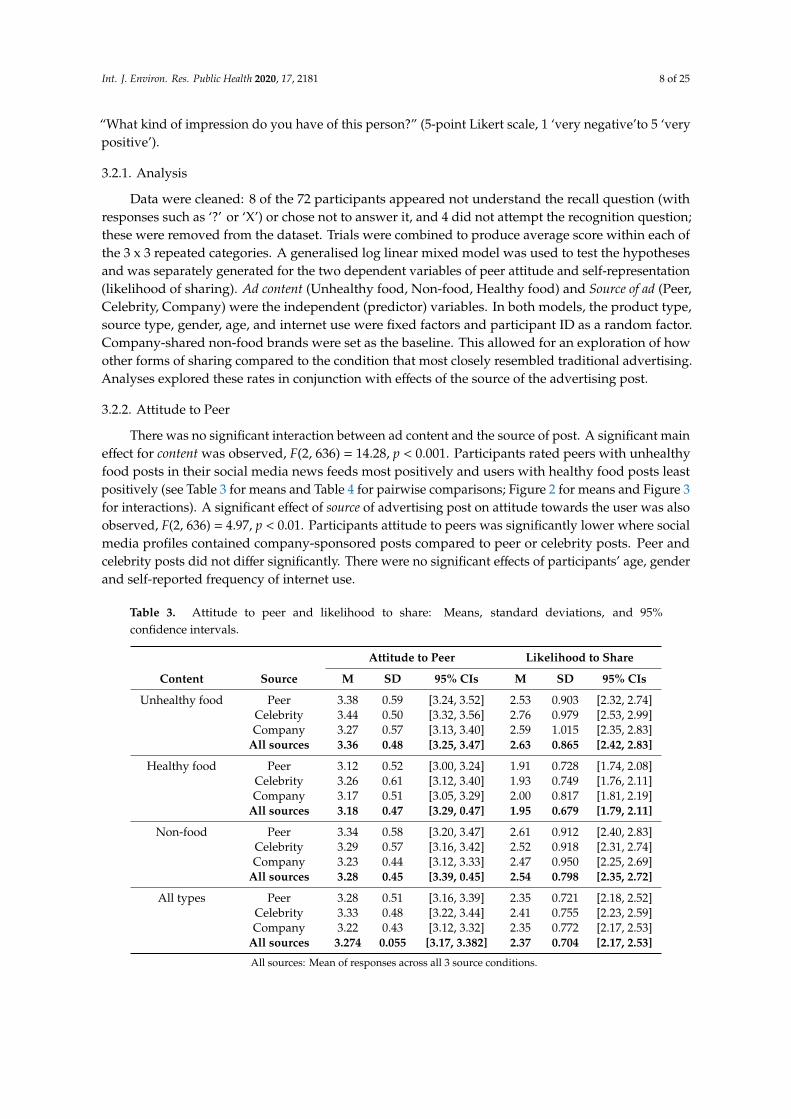
There was no significant interaction between ad content and the source of post. A significant maineffect for content was observed, F(2, 636) = 14.28, p < 0.001. Participants rated peers with unhealthyfood posts in their social media news feeds most positively and users with healthy food posts leastpositively (see Table 3 for means and Table 4 for pairwise comparisons; Figure 2 for means and Figure 3for interactions). A significant effect of source of advertising post on attitude towards the user was alsoobserved, F(2, 636) = 4.97, p < 0.01. Participants attitude to peers was significantly lower where socialmedia profiles contained company-sponsored posts compared to peer or celebrity posts. Peer andcelebrity posts did not differ significantly. There were no significant effects of participants’ age, genderand self-reported frequency of internet use.
Table 3. Attitude to peer and likelihood to share: Means, standard deviations, and 95%confidence intervals.
Attitude to Peer Likelihood to Share
Content Source M SD 95% CIs M SD 95% CIs
Unhealthy food Peer 3.38 0.59 [3.24, 3.52] 2.53 0.903 [2.32, 2.74]Celebrity 3.44 0.50 [3.32, 3.56] 2.76 0.979 [2.53, 2.99]Company 3.27 0.57 [3.13, 3.40] 2.59 1.015 [2.35, 2.83]
All sources 3.36 0.48 [3.25, 3.47] 2.63 0.865 [2.42, 2.83]
Healthy food Peer 3.12 0.52 [3.00, 3.24] 1.91 0.728 [1.74, 2.08]Celebrity 3.26 0.61 [3.12, 3.40] 1.93 0.749 [1.76, 2.11]Company 3.17 0.51 [3.05, 3.29] 2.00 0.817 [1.81, 2.19]
All sources 3.18 0.47 [3.29, 0.47] 1.95 0.679 [1.79, 2.11]
Non-food Peer 3.34 0.58 [3.20, 3.47] 2.61 0.912 [2.40, 2.83]Celebrity 3.29 0.57 [3.16, 3.42] 2.52 0.918 [2.31, 2.74]Company 3.23 0.44 [3.12, 3.33] 2.47 0.950 [2.25, 2.69]
All sources 3.28 0.45 [3.39, 0.45] 2.54 0.798 [2.35, 2.72]
All types Peer 3.28 0.51 [3.16, 3.39] 2.35 0.721 [2.18, 2.52]Celebrity 3.33 0.48 [3.22, 3.44] 2.41 0.755 [2.23, 2.59]Company 3.22 0.43 [3.12, 3.32] 2.35 0.772 [2.17, 2.53]
All sources 3.274 0.055 [3.17, 3.382] 2.37 0.704 [2.17, 2.53]
All sources: Mean of responses across all 3 source conditions.
Int. J. Environ. Res. Public Health 2020, 17, 2181 9 of 25
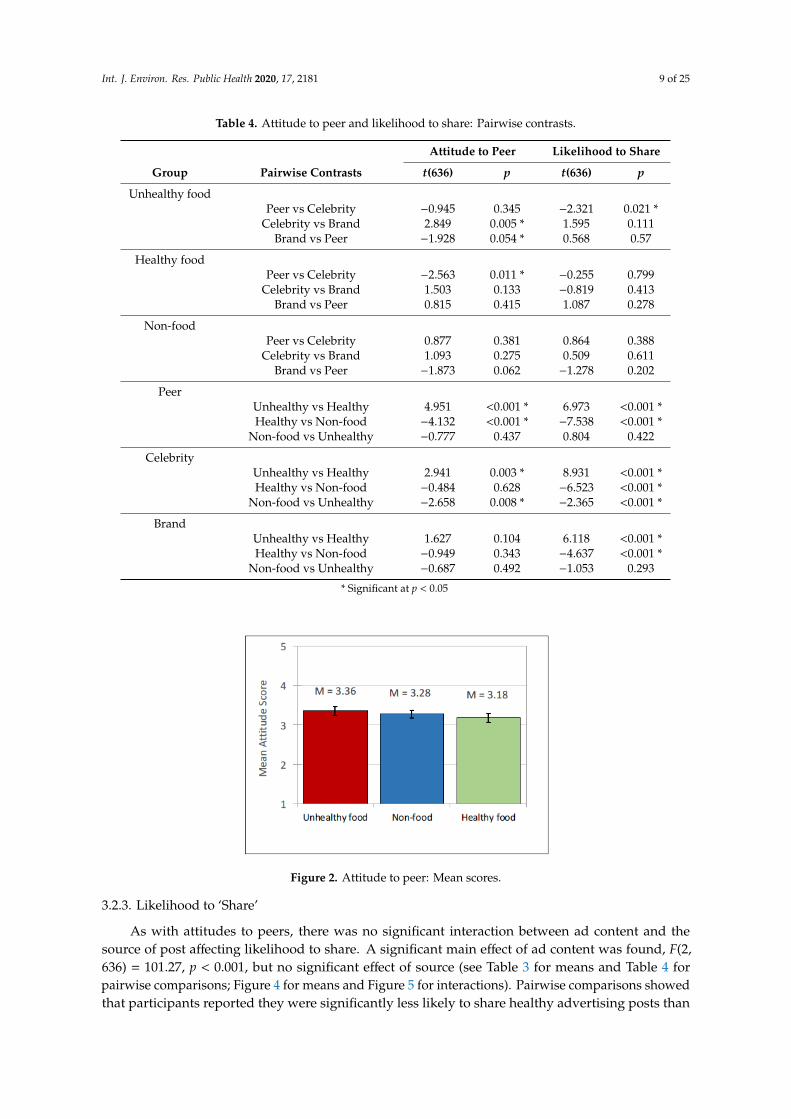
Table 4. Attitude to peer and likelihood to share: Pairwise contrasts.
Attitude to Peer Likelihood to Share
Group Pairwise Contrasts t(636) p t(636) p
Unhealthy foodPeer vs Celebrity −0.945 0.345 −2.321 0.021 *
Celebrity vs Brand 2.849 0.005 * 1.595 0.111Brand vs Peer −1.928 0.054 * 0.568 0.57
Healthy foodPeer vs Celebrity −2.563 0.011 * −0.255 0.799
Celebrity vs Brand 1.503 0.133 −0.819 0.413Brand vs Peer 0.815 0.415 1.087 0.278
Non-foodPeer vs Celebrity 0.877 0.381 0.864 0.388
Celebrity vs Brand 1.093 0.275 0.509 0.611Brand vs Peer −1.873 0.062 −1.278 0.202
PeerUnhealthy vs Healthy 4.951 <0.001 * 6.973 <0.001 *Healthy vs Non-food −4.132 <0.001 * −7.538 <0.001 *
Non-food vs Unhealthy −0.777 0.437 0.804 0.422
CelebrityUnhealthy vs Healthy 2.941 0.003 * 8.931 <0.001 *Healthy vs Non-food −0.484 0.628 −6.523 <0.001 *
Non-food vs Unhealthy −2.658 0.008 * −2.365 <0.001 *
BrandUnhealthy vs Healthy 1.627 0.104 6.118 <0.001 *Healthy vs Non-food −0.949 0.343 −4.637 <0.001 *
Non-food vs Unhealthy −0.687 0.492 −1.053 0.293
* Significant at p < 0.05
Int. J. Environ. Res. Public Health 2020, 17, x 8 of 24
Celebrity, Company) were the independent (predictor) variables. In both models, the product type, source type, gender, age, and internet use were fixed factors and participant ID as a random factor. Company-shared non-food brands were set as the baseline. This allowed for an exploration of how other forms of sharing compared to the condition that most closely resembled traditional advertising. Analyses explored these rates in conjunction with effects of the source of the advertising post.
3.2.2. Attitude to Peer
There was no significant interaction between ad content and the source of post. A significant main effect for content was observed, F(2, 636) = 14.28, p < 0.001. Participants rated peers with unhealthy food posts in their social media news feeds most positively and users with healthy food posts least positively (see Table 3 for means and Table 4 for pairwise comparisons; Figure 2 for means and Figure 3 for interactions). A significant effect of source of advertising post on attitude towards the user was also observed, F(2, 636) = 4.97, p < 0.01. Participants attitude to peers was significantly lower where social media profiles contained company-sponsored posts compared to peer or celebrity posts. Peer and celebrity posts did not differ significantly. There were no significant effects of participants’ age, gender and self-reported frequency of internet use.
3.2.3. Likelihood to ‘Share’
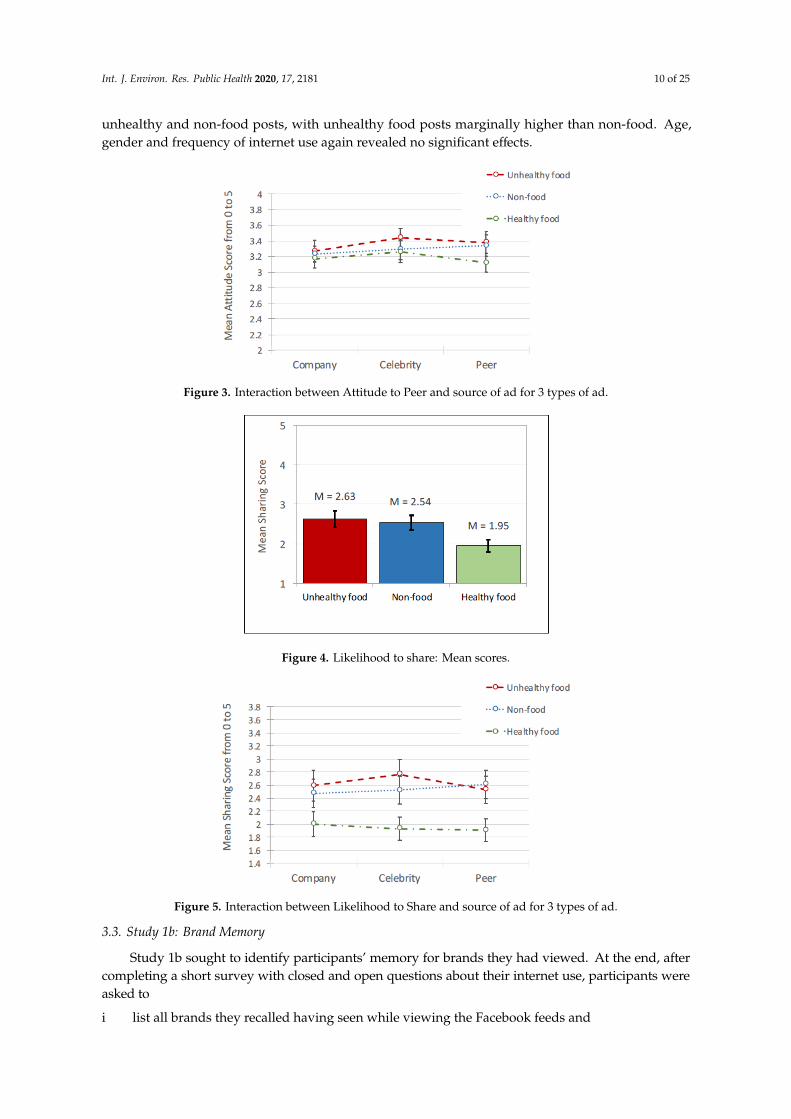
As with attitudes to peers, there was no significant interaction between ad content and the source of post affecting likelihood to share. A significant main effect of ad content was found, F(2, 636) = 101.27, p < 0.001, but no significant effect of source (see Table 3 for means and Table 4 for pairwise comparisons; Figure 4 for means and Figure 5 for interactions). Pairwise comparisons showed that participants reported they were significantly less likely to share healthy advertising posts than unhealthy and non-food posts, with unhealthy food posts marginally higher than non-food. Age, gender and frequency of internet use again revealed no significant effects.
Figure 2. Attitude to peer: Mean scores. Figure 2. Attitude to peer: Mean scores.
3.2.3. Likelihood to ‘Share’
As with attitudes to peers, there was no significant interaction between ad content and thesource of post affecting likelihood to share. A significant main effect of ad content was found, F(2,636) = 101.27, p < 0.001, but no significant effect of source (see Table 3 for means and Table 4 forpairwise comparisons; Figure 4 for means and Figure 5 for interactions). Pairwise comparisons showedthat participants reported they were significantly less likely to share healthy advertising posts than
Int. J. Environ. Res. Public Health 2020, 17, 2181 10 of 25
unhealthy and non-food posts, with unhealthy food posts marginally higher than non-food. Age,gender and frequency of internet use again revealed no significant effects.Int. J. Environ. Res. Public Health 2020, 17, x 9 of 24
Figure 3. Interaction between Attitude to Peer and source of ad for 3 types of ad.
Figure 4. Likelihood to share: Mean scores.
Figure 5. Interaction between Likelihood to Share and source of ad for 3 types of ad.
Figure 3. Interaction between Attitude to Peer and source of ad for 3 types of ad.
Int. J. Environ. Res. Public Health 2020, 17, x 9 of 24
Figure 3. Interaction between Attitude to Peer and source of ad for 3 types of ad.
Figure 4. Likelihood to share: Mean scores.
Figure 5. Interaction between Likelihood to Share and source of ad for 3 types of ad.
Figure 4. Likelihood to share: Mean scores.
Int. J. Environ. Res. Public Health 2020, 17, x 9 of 24
Figure 3. Interaction between Attitude to Peer and source of ad for 3 types of ad.
Figure 4. Likelihood to share: Mean scores.
Figure 5. Interaction between Likelihood to Share and source of ad for 3 types of ad.
Figure 5. Interaction between Likelihood to Share and source of ad for 3 types of ad.
3.3. Study 1b: Brand Memory
Study 1b sought to identify participants’ memory for brands they had viewed. At the end, aftercompleting a short survey with closed and open questions about their internet use, participants wereasked to
i list all brands they recalled having seen while viewing the Facebook feeds and
Int. J. Environ. Res. Public Health 2020, 17, 2181 11 of 25
ii select the brands they recalled having seen in the profiles they had just viewed, from a list of 56brands (the 36 target brands and 20 similar distractors not used in the study).
The dependent variables were therefore (i) free brand recall (ii) recognition.
3.3.1. Data Analysis
Data were managed as described for Study 1a. For Recall (n = 64), participants’ accurate recallwas M = 3.2 (SD = 1.9) of the 36 brands (of M = 4.14, SD = 2.19 brands they listed). For Recognition (n =
68), participants correctly recognised M = 15.84 (SD = 6.38) of the 36 brands (of M = 18.21, SD = 8.08responses). (see Table 5 for means). Of the 36 brands shown, the mean recall rate for unhealthy brands(1.75) was nearly five times that for healthy brands (0.36). It was also greater for non-food brands(1.09). Similarly, for prompted recognition, the mean number of unhealthy brands recognised (7.53) wasdouble that for healthy brands (3.87); non-food brands (4.44) were also recognised more than healthybrands. Analyses explored these rates in conjunction with effects of the source of the advertising post.The independent (predictor) variables were ad content (unhealthy food, healthy food, non-food) andsource of post (peer, celebrity, company). A generalized mixed model was generated separately forrecall and recognition. Both used product type, source type, gender, age, and internet use as fixedfactors and participant ID as a random factor. Non-food brands shown in company-source posts wereset as the baseline.
Table 5. Recall and recognition: Means, standard deviations, and 95% confidence intervals for recalledand recognised brands.
Recall Recognition
Content Source M SD 95% CIs M SD 95% CIs
Unhealthy food Peer 0.23 0.46 [0.12, 0.35] 2.28 1.08 [2.02, 2.54]Celebrity 0.67 0.71 [0.49, 0.85] 3.12 1.15 [2.84, 3.40]Company 0.84 0.84 [0.63. 1.05] 2.13 1.17 [1.85, 2.42]
All sources 1.75 1.35 [1.41, 2.09] 7.53 2.63 [6.89, 8.17]
Healthy food Peer 0.16 0.41 [0.05, 0.26] 2.18 1.20 [1.89, 2.47]Celebrity 0.05 0.23 [0, 0.10] 0.74 0.86 [0.53, 0.94]Company 0.16 0.37 [0.06, 0.25] 0.96 0.95 [0.73, 1.19]
All sources 0.36 0.60 [0.21, 0.51] 3.87 2.39 [3.29, 4.45]
Non-food Peer 0.28 0.55 [0.14, 0.42] 1.24 0.96 [1.00, 1.47]Celebrity 0.23 0.53 [0.10, 0.37] 1.56 1.10 [1.29, 1.82]Company 0.58 0.81 [0.38, 0.78] 1.65 1.12 [1.38, 1.92]
All sources 1.09 1.15 [0.81, 1.38] 4.44 2.48 [3.84, 5.04]
All types Peer 0.67 0.76 [0.48, 0.86] 5.69 2.35 [5.12, 6.26]Celebrity 0.95 0.90 [0.73, 1.18] 5.41 2.33 [4.85, 5.98]Company 1.58 1.28 [1.26, 1.90] 4.74 2.45 [4.14, 5.33]
All sources 3.20 1.90 [2.73, 3.68] 15.84 6.38 [14.30, 17.38]
All sources: Mean of responses across all 3 source conditions.
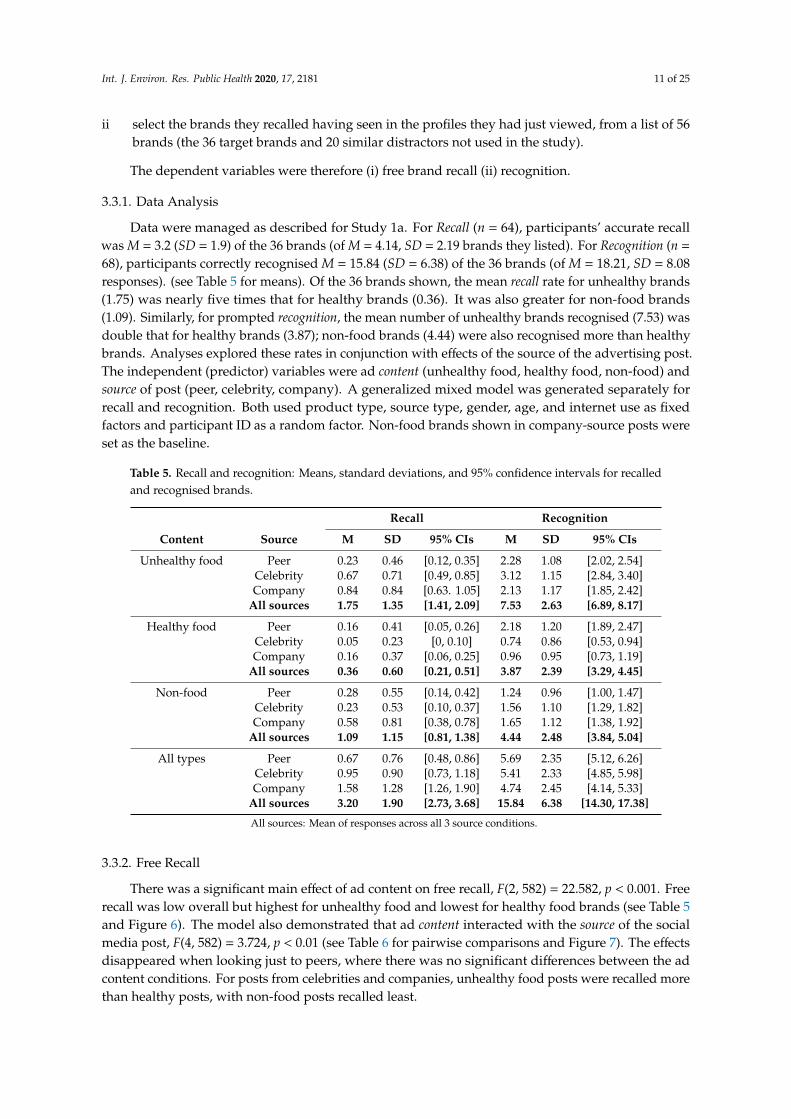
3.3.2. Free Recall
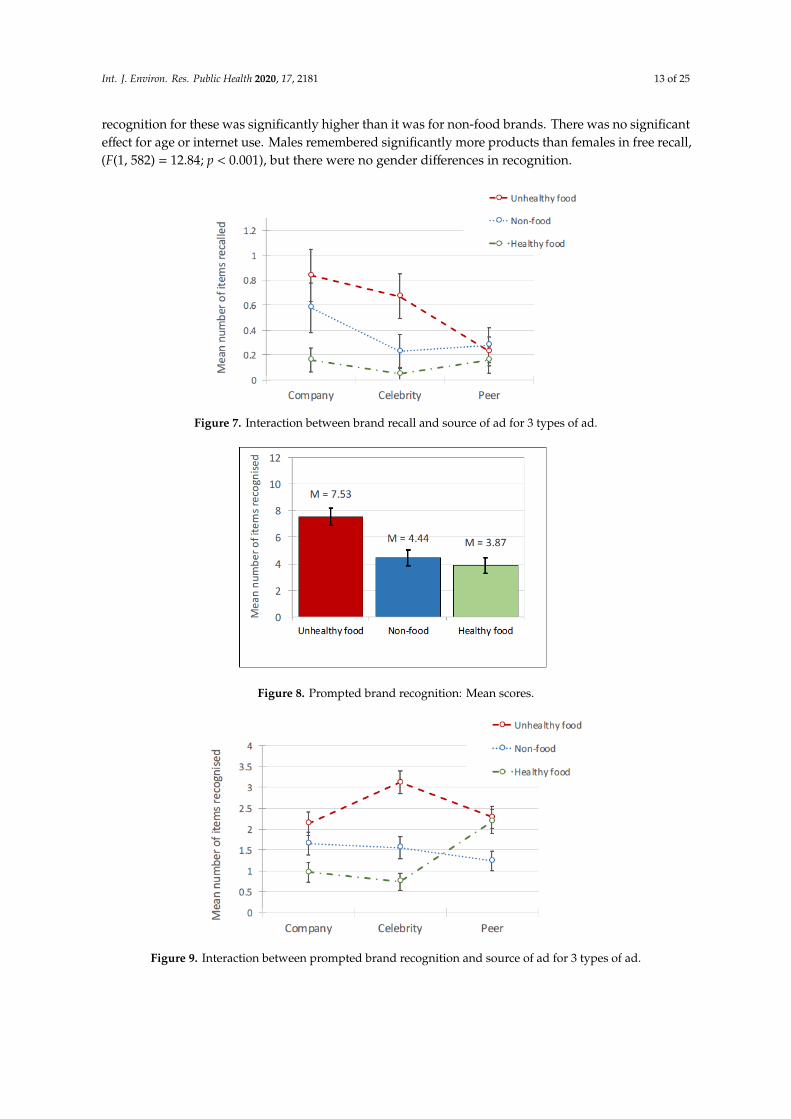
There was a significant main effect of ad content on free recall, F(2, 582) = 22.582, p < 0.001. Freerecall was low overall but highest for unhealthy food and lowest for healthy food brands (see Table 5and Figure 6). The model also demonstrated that ad content interacted with the source of the socialmedia post, F(4, 582) = 3.724, p < 0.01 (see Table 6 for pairwise comparisons and Figure 7). The effectsdisappeared when looking just to peers, where there was no significant differences between the adcontent conditions. For posts from celebrities and companies, unhealthy food posts were recalled morethan healthy posts, with non-food posts recalled least.
Int. J. Environ. Res. Public Health 2020, 17, 2181 12 of 25
Int. J. Environ. Res. Public Health 2020, 17, x 11 of 24
i list all brands they recalled having seen while viewing the Facebook feeds and ii select the brands they recalled having seen in the profiles they had just viewed, from a list of
56 brands (the 36 target brands and 20 similar distractors not used in the study). The dependent variables were therefore (i) free brand recall (ii) recognition.
3.3.1. Data Analysis
Data were managed as described for Study 1a. For Recall (n = 64), participants’ accurate recall was M = 3.2 (SD = 1.9) of the 36 brands (of M = 4.14, SD = 2.19 brands they listed). For Recognition (n = 68), participants correctly recognised M = 15.84 (SD = 6.38) of the 36 brands (of M = 18.21, SD = 8.08 responses). (see Table 5 for means). Of the 36 brands shown, the mean recall rate for unhealthy brands (1.75) was nearly five times that for healthy brands (0.36). It was also greater for non-food brands (1.09). Similarly, for prompted recognition, the mean number of unhealthy brands recognised (7.53) was double that for healthy brands (3.87); non-food brands (4.44) were also recognised more than healthy brands. Analyses explored these rates in conjunction with effects of the source of the advertising post. The independent (predictor) variables were ad content (unhealthy food, healthy food, non-food) and source of post (peer, celebrity, company). A generalized mixed model was generated separately for recall and recognition. Both used product type, source type, gender, age, and internet use as fixed factors and participant ID as a random factor. Non-food brands shown in company-source posts were set as the baseline.
3.3.2. Free Recall
There was a significant main effect of ad content on free recall, F(2, 582) = 22.582, p < 0.001. Free recall was low overall but highest for unhealthy food and lowest for healthy food brands (see Table 5 and Figure 6). The model also demonstrated that ad content interacted with the source of the social media post, F(4, 582) = 3.724, p < 0.01 (see Table 6 for pairwise comparisons and Figure 7). The effects disappeared when looking just to peers, where there was no significant differences between the ad content conditions. For posts from celebrities and companies, unhealthy food posts were recalled more than healthy posts, with non-food posts recalled least.
Figure 6. Free brand recall: Mean scores. Figure 6. Free brand recall: Mean scores.
Table 6. Recall and recognition: Results of pairwise contrasts.
Recall Recognition
Group Pairwise Contrasts t(582) p t(600) p
Unhealthy foodPeer vs Celebrity −3.63 <0.001 * −4.99 <0.001 *
Celebrity vs. Brand −1.18 0.239 5.74 <0.001 *Brand vs. Peer 4.66 <0.001 * −0.89 0.377
Healthy foodPeer vs. Celebrity 2.06 0.04 * 8.76 <0.001 *
Celebrity vs. Brand −2.22 0.027 * −1.7 0.091Brand vs. Peer 0.22 0.826 −7.43 <0.001 *
Non-foodPeer vs. Celebrity 0.49 0.623 −2.17 0.03 *
Celebrity vs. Brand −2.77 0.006 * −0.59 0.558Brand vs. Peer 2.38 0.018 * 2.7 0.007 *
PeerUnhealthy vs. Healthy 1.32 0.189 0.62 0.534Healthy vs. Non-food −1.74 0.083 5.7 <0.001 *
Non-food vs. Unhealthy 0.53 0.595 −6.3 <0.001 *
CelebrityUnhealthy vs. Healthy 6.18 <0.001 * 12.62 <0.001 *Healthy vs. Non−food −2.66 0.008 * −5.78 <0.001 *
Non- food vs. Unhealthy −3.43 0.001 * −8.98 <0.001 *
BrandUnhealthy vs. Healthy 5.59 <0.001 * 7.17 <0.001 *Healthy vs. Non-food −3.71 <0.001 * −4.64 <0.001 *
Non-food vs. Unhealthy −1.34 0.18 −2.98 0.003 *
* Significant at p < 0.05
Recognition. As for recall, a significant main effect of ad content was found, F(2, 600) = 104.54, p< 0.001, with brand recognition highest for unhealthy food and lowest for healthy food (See Table 5for means and Figure 8). Similarly, the ad content interacted with the source of the social media post,F(4, 600) = 32.67, p < 0.001 (Table 6 for pairwise comparisons and Figure 9 for interaction). For postsfrom celebrities and companies, unhealthy food brands were most frequently recognised, followedby non-food, with healthy food recognised least. As for recall, this effect was not observed for socialmedia posts shared by peers: brand recognition of unhealthy and healthy food did not differ, and
Int. J. Environ. Res. Public Health 2020, 17, 2181 13 of 25
recognition for these was significantly higher than it was for non-food brands. There was no significanteffect for age or internet use. Males remembered significantly more products than females in free recall,(F(1, 582) = 12.84; p < 0.001), but there were no gender differences in recognition.Int. J. Environ. Res. Public Health 2020, 17, x 12 of 24
Figure 7. Interaction between brand recall and source of ad for 3 types of ad.
Table 5. Recall and recognition: Means, standard deviations, and 95% confidence intervals for recalled and recognised brands.
Recall Recognition Content Source M SD 95% CIs M SD 95% CIs
Unhealthy food Peer 0.23 0.46 [0.12, 0.35] 2.28 1.08 [2.02, 2.54]
Celebrity 0.67 0.71 [0.49, 0.85] 3.12 1.15 [2.84, 3.40] Company 0.84 0.84 [0.63. 1.05] 2.13 1.17 [1.85, 2.42] All sources 1.75 1.35 [1.41, 2.09] 7.53 2.63 [6.89, 8.17]
Healthy food Peer 0.16 0.41 [0.05, 0.26] 2.18 1.20 [1.89, 2.47] Celebrity 0.05 0.23 [0, 0.10] 0.74 0.86 [0.53, 0.94] Company 0.16 0.37 [0.06, 0.25] 0.96 0.95 [0.73, 1.19] All sources 0.36 0.60 [0.21, 0.51] 3.87 2.39 [3.29, 4.45]
Non-food Peer 0.28 0.55 [0.14, 0.42] 1.24 0.96 [1.00, 1.47] Celebrity 0.23 0.53 [0.10, 0.37] 1.56 1.10 [1.29, 1.82] Company 0.58 0.81 [0.38, 0.78] 1.65 1.12 [1.38, 1.92] All sources 1.09 1.15 [0.81, 1.38] 4.44 2.48 [3.84, 5.04]
All types Peer 0.67 0.76 [0.48, 0.86] 5.69 2.35 [5.12, 6.26] Celebrity 0.95 0.90 [0.73, 1.18] 5.41 2.33 [4.85, 5.98] Company 1.58 1.28 [1.26, 1.90] 4.74 2.45 [4.14, 5.33] All sources 3.20 1.90 [2.73, 3.68] 15.84 6.38 [14.30, 17.38]
All sources: Mean of responses across all 3 source conditions.
Table 6. Recall and recognition: Results of pairwise contrasts.
Recall Recognition Group Pairwise Contrasts t(582) p t(600) p
Unhealthy food
Peer vs Celebrity −3.63 <0.001 * −4.99 <0.001 * Celebrity vs. Brand −1.18 0.239 5.74 <0.001 * Brand vs. Peer 4.66 <0.001 * −0.89 0.377
Healthy food Peer vs. Celebrity 2.06 0.04 * 8.76 <0.001 * Celebrity vs. Brand −2.22 0.027 * −1.7 0.091 Brand vs. Peer 0.22 0.826 −7.43 <0.001 *
Non-food Peer vs. Celebrity 0.49 0.623 −2.17 0.03 * Celebrity vs. Brand −2.77 0.006 * −0.59 0.558 Brand vs. Peer 2.38 0.018 * 2.7 0.007 *
Peer Unhealthy vs. Healthy 1.32 0.189 0.62 0.534
Figure 7. Interaction between brand recall and source of ad for 3 types of ad.
Int. J. Environ. Res. Public Health 2020, 17, x 13 of 24
Healthy vs. Non-food −1.74 0.083 5.7 <0.001 * Non-food vs. Unhealthy 0.53 0.595 −6.3 <0.001 *
Celebrity Unhealthy vs. Healthy 6.18 <0.001 * 12.62 <0.001 * Healthy vs. Non−food −2.66 0.008 * −5.78 <0.001 * Non- food vs. Unhealthy −3.43 0.001 * −8.98 <0.001 *
Brand Unhealthy vs. Healthy 5.59 <0.001 * 7.17 <0.001 * Healthy vs. Non-food −3.71 <0.001 * −4.64 <0.001 * Non-food vs. Unhealthy −1.34 0.18 −2.98 0.003 *
* Significant at p < 0.05
Recognition. As for recall, a significant main effect of ad content was found, F(2, 600) = 104.54, p < 0.001, with brand recognition highest for unhealthy food and lowest for healthy food (See Table 5 for means and Figure 8). Similarly, the ad content interacted with the source of the social media post, F(4, 600) = 32.67, p < 0.001 (Table 6 for pairwise comparisons and Figure 9 for interaction). For posts from celebrities and companies, unhealthy food brands were most frequently recognised, followed by non-food, with healthy food recognised least. As for recall, this effect was not observed for social media posts shared by peers: brand recognition of unhealthy and healthy food did not differ, and recognition for these was significantly higher than it was for non-food brands. There was no significant effect for age or internet use. Males remembered significantly more products than females in free recall, (F(1, 582) = 12.84; p < 0.001), but there were no gender differences in recognition.
Figure 8. Prompted brand recognition: Mean scores.
Figure 9. Interaction between prompted brand recognition and source of ad for 3 types of ad.
Figure 8. Prompted brand recognition: Mean scores.
Int. J. Environ. Res. Public Health 2020, 17, x 13 of 24
Healthy vs. Non-food −1.74 0.083 5.7 <0.001 * Non-food vs. Unhealthy 0.53 0.595 −6.3 <0.001 *
Celebrity Unhealthy vs. Healthy 6.18 <0.001 * 12.62 <0.001 * Healthy vs. Non−food −2.66 0.008 * −5.78 <0.001 * Non- food vs. Unhealthy −3.43 0.001 * −8.98 <0.001 *
Brand Unhealthy vs. Healthy 5.59 <0.001 * 7.17 <0.001 * Healthy vs. Non-food −3.71 <0.001 * −4.64 <0.001 * Non-food vs. Unhealthy −1.34 0.18 −2.98 0.003 *
* Significant at p < 0.05
Recognition. As for recall, a significant main effect of ad content was found, F(2, 600) = 104.54, p < 0.001, with brand recognition highest for unhealthy food and lowest for healthy food (See Table 5 for means and Figure 8). Similarly, the ad content interacted with the source of the social media post, F(4, 600) = 32.67, p < 0.001 (Table 6 for pairwise comparisons and Figure 9 for interaction). For posts from celebrities and companies, unhealthy food brands were most frequently recognised, followed by non-food, with healthy food recognised least. As for recall, this effect was not observed for social media posts shared by peers: brand recognition of unhealthy and healthy food did not differ, and recognition for these was significantly higher than it was for non-food brands. There was no significant effect for age or internet use. Males remembered significantly more products than females in free recall, (F(1, 582) = 12.84; p < 0.001), but there were no gender differences in recognition.
Figure 8. Prompted brand recognition: Mean scores.
Figure 9. Interaction between prompted brand recognition and source of ad for 3 types of ad.
Figure 9. Interaction between prompted brand recognition and source of ad for 3 types of ad.
Int. J. Environ. Res. Public Health 2020, 17, 2181 14 of 25
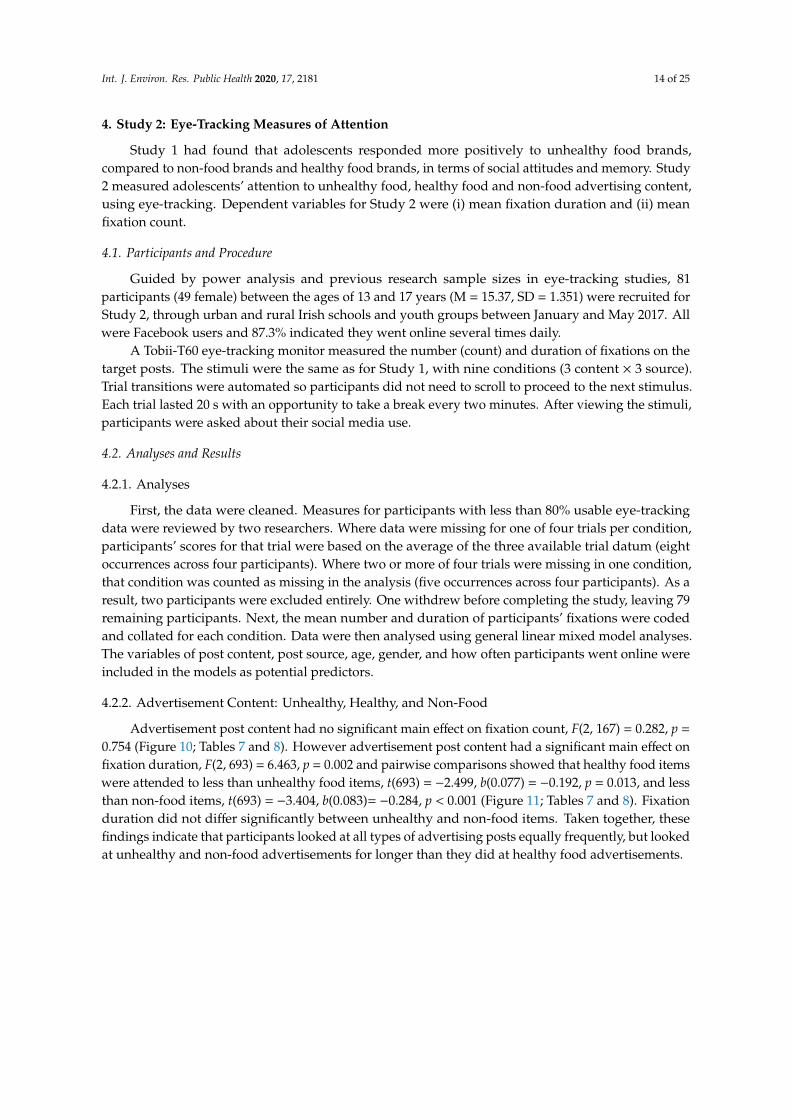
4. Study 2: Eye-Tracking Measures of Attention
Study 1 had found that adolescents responded more positively to unhealthy food brands,compared to non-food brands and healthy food brands, in terms of social attitudes and memory. Study2 measured adolescents’ attention to unhealthy food, healthy food and non-food advertising content,using eye-tracking. Dependent variables for Study 2 were (i) mean fixation duration and (ii) meanfixation count.
4.1. Participants and Procedure
Guided by power analysis and previous research sample sizes in eye-tracking studies, 81participants (49 female) between the ages of 13 and 17 years (M = 15.37, SD = 1.351) were recruited forStudy 2, through urban and rural Irish schools and youth groups between January and May 2017. Allwere Facebook users and 87.3% indicated they went online several times daily.
A Tobii-T60 eye-tracking monitor measured the number (count) and duration of fixations on thetarget posts. The stimuli were the same as for Study 1, with nine conditions (3 content × 3 source).Trial transitions were automated so participants did not need to scroll to proceed to the next stimulus.Each trial lasted 20 s with an opportunity to take a break every two minutes. After viewing the stimuli,participants were asked about their social media use.
4.2. Analyses and Results
4.2.1. Analyses
First, the data were cleaned. Measures for participants with less than 80% usable eye-trackingdata were reviewed by two researchers. Where data were missing for one of four trials per condition,participants’ scores for that trial were based on the average of the three available trial datum (eightoccurrences across four participants). Where two or more of four trials were missing in one condition,that condition was counted as missing in the analysis (five occurrences across four participants). As aresult, two participants were excluded entirely. One withdrew before completing the study, leaving 79remaining participants. Next, the mean number and duration of participants’ fixations were codedand collated for each condition. Data were then analysed using general linear mixed model analyses.The variables of post content, post source, age, gender, and how often participants went online wereincluded in the models as potential predictors.
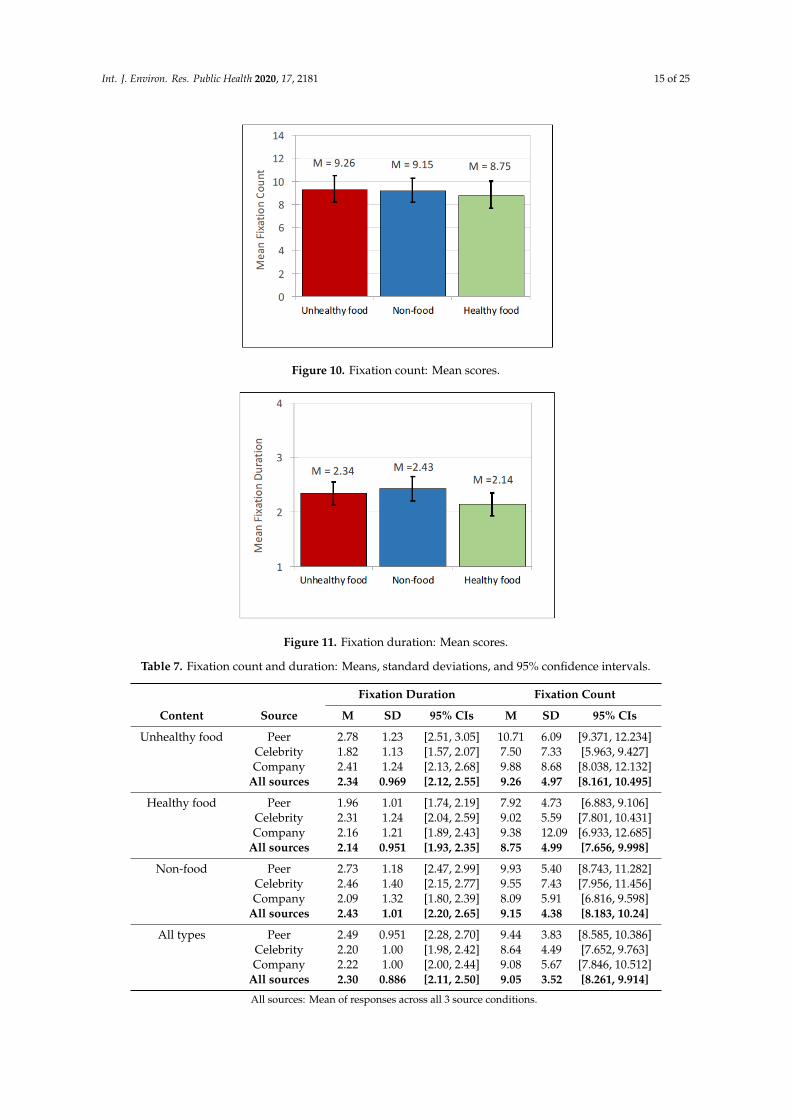
4.2.2. Advertisement Content: Unhealthy, Healthy, and Non-Food
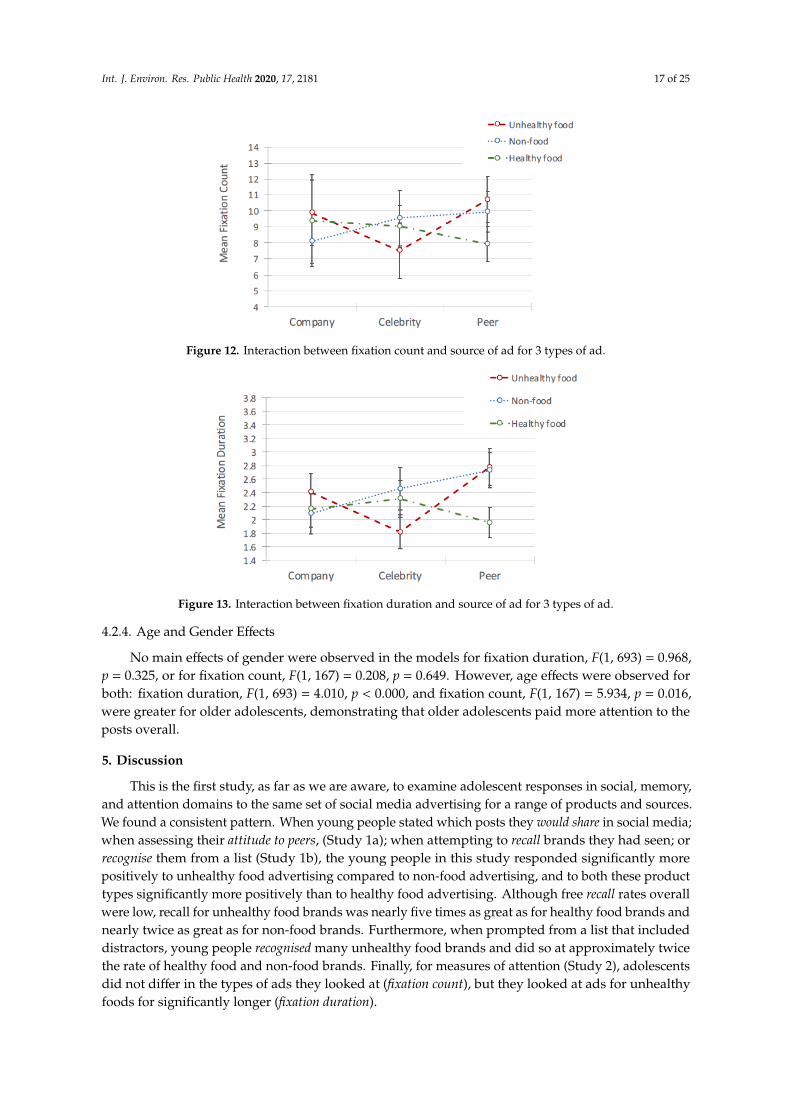
Advertisement post content had no significant main effect on fixation count, F(2, 167) = 0.282, p =
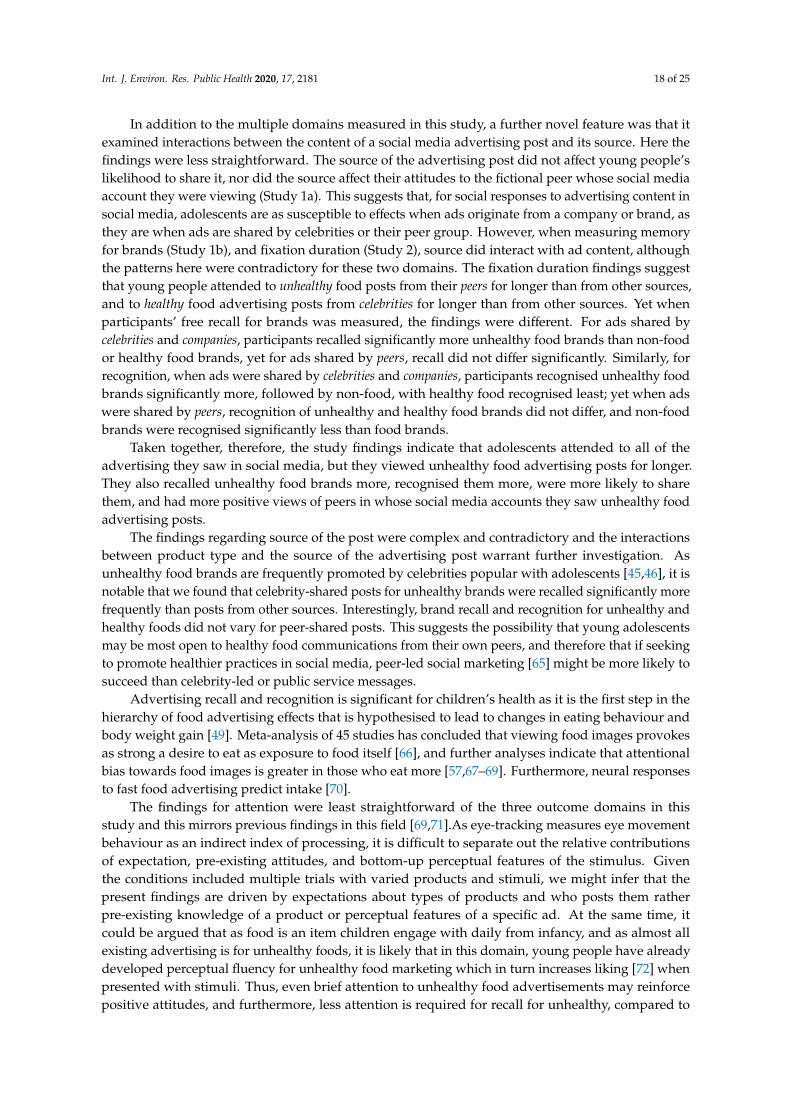
0.754 (Figure 10; Tables 7 and 8). However advertisement post content had a significant main effect onfixation duration, F(2, 693) = 6.463, p = 0.002 and pairwise comparisons showed that healthy food itemswere attended to less than unhealthy food items, t(693) = −2.499, b(0.077) = −0.192, p = 0.013, and lessthan non-food items, t(693) = −3.404, b(0.083)= −0.284, p < 0.001 (Figure 11; Tables 7 and 8). Fixationduration did not differ significantly between unhealthy and non-food items. Taken together, thesefindings indicate that participants looked at all types of advertising posts equally frequently, but lookedat unhealthy and non-food advertisements for longer than they did at healthy food advertisements.
Int. J. Environ. Res. Public Health 2020, 17, 2181 15 of 25
Int. J. Environ. Res. Public Health 2020, 17, x 16 of 24
Unhealthy vs. Healthy 1.746 0.081 0.291 0.771 Healthy vs. Non-food 0.43 0.667 0.837 0.404 Non-food vs. Unhealthy −2.029 0.043 * −1.557 0.121
* Significant at p < 0.05.
Figure 10. Fixation count: Mean scores.
Figure 11. Fixation duration: Mean scores.
Figure 12. Interaction between fixation count and source of ad for 3 types of ad.
Figure 10. Fixation count: Mean scores.
Int. J. Environ. Res. Public Health 2020, 17, x 16 of 24
Unhealthy vs. Healthy 1.746 0.081 0.291 0.771 Healthy vs. Non-food 0.43 0.667 0.837 0.404 Non-food vs. Unhealthy −2.029 0.043 * −1.557 0.121
* Significant at p < 0.05.
Figure 10. Fixation count: Mean scores.
Figure 11. Fixation duration: Mean scores.
Figure 12. Interaction between fixation count and source of ad for 3 types of ad.
Figure 11. Fixation duration: Mean scores.
Table 7. Fixation count and duration: Means, standard deviations, and 95% confidence intervals.
Fixation Duration Fixation Count
Content Source M SD 95% CIs M SD 95% CIs
Unhealthy food Peer 2.78 1.23 [2.51, 3.05] 10.71 6.09 [9.371, 12.234]Celebrity 1.82 1.13 [1.57, 2.07] 7.50 7.33 [5.963, 9.427]Company 2.41 1.24 [2.13, 2.68] 9.88 8.68 [8.038, 12.132]
All sources 2.34 0.969 [2.12, 2.55] 9.26 4.97 [8.161, 10.495]
Healthy food Peer 1.96 1.01 [1.74, 2.19] 7.92 4.73 [6.883, 9.106]Celebrity 2.31 1.24 [2.04, 2.59] 9.02 5.59 [7.801, 10.431]Company 2.16 1.21 [1.89, 2.43] 9.38 12.09 [6.933, 12.685]
All sources 2.14 0.951 [1.93, 2.35] 8.75 4.99 [7.656, 9.998]
Non-food Peer 2.73 1.18 [2.47, 2.99] 9.93 5.40 [8.743, 11.282]Celebrity 2.46 1.40 [2.15, 2.77] 9.55 7.43 [7.956, 11.456]Company 2.09 1.32 [1.80, 2.39] 8.09 5.91 [6.816, 9.598]
All sources 2.43 1.01 [2.20, 2.65] 9.15 4.38 [8.183, 10.24]
All types Peer 2.49 0.951 [2.28, 2.70] 9.44 3.83 [8.585, 10.386]Celebrity 2.20 1.00 [1.98, 2.42] 8.64 4.49 [7.652, 9.763]Company 2.22 1.00 [2.00, 2.44] 9.08 5.67 [7.846, 10.512]
All sources 2.30 0.886 [2.11, 2.50] 9.05 3.52 [8.261, 9.914]
All sources: Mean of responses across all 3 source conditions.
Int. J. Environ. Res. Public Health 2020, 17, 2181 16 of 25
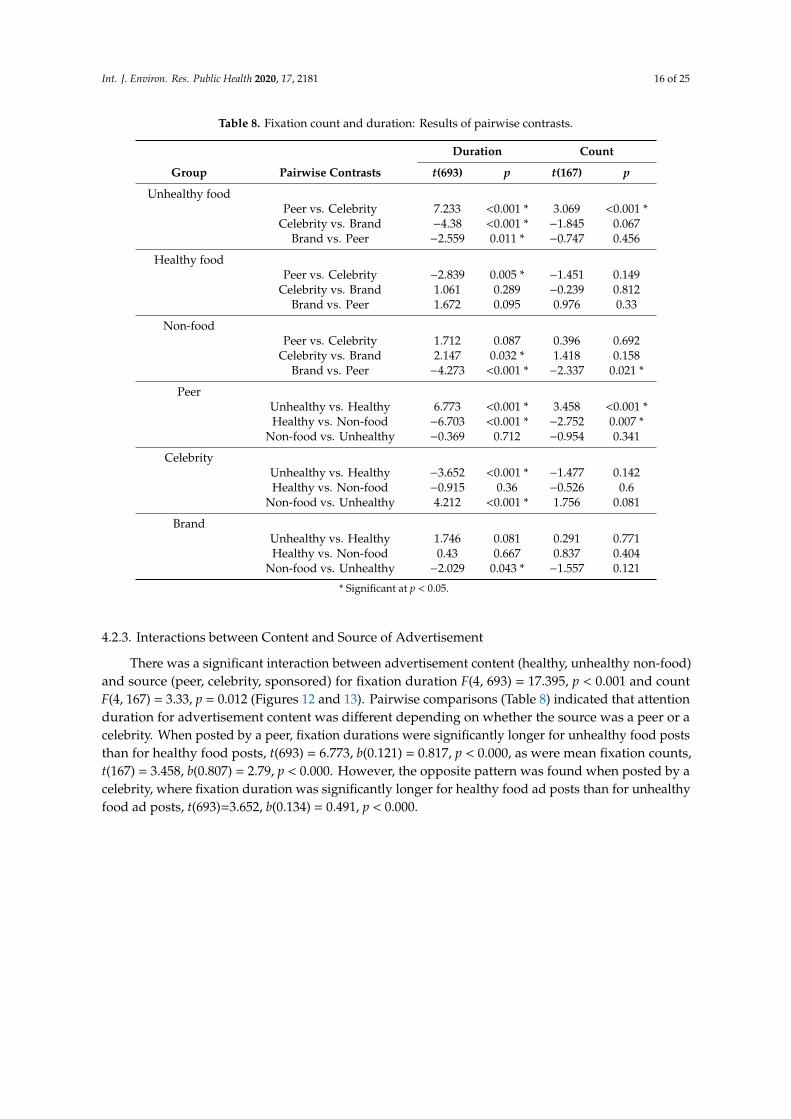
Table 8. Fixation count and duration: Results of pairwise contrasts.
Duration Count
Group Pairwise Contrasts t(693) p t(167) p
Unhealthy foodPeer vs. Celebrity 7.233 <0.001 * 3.069 <0.001 *
Celebrity vs. Brand −4.38 <0.001 * −1.845 0.067Brand vs. Peer −2.559 0.011 * −0.747 0.456
Healthy foodPeer vs. Celebrity −2.839 0.005 * −1.451 0.149
Celebrity vs. Brand 1.061 0.289 −0.239 0.812Brand vs. Peer 1.672 0.095 0.976 0.33
Non-foodPeer vs. Celebrity 1.712 0.087 0.396 0.692
Celebrity vs. Brand 2.147 0.032 * 1.418 0.158Brand vs. Peer −4.273 <0.001 * −2.337 0.021 *
PeerUnhealthy vs. Healthy 6.773 <0.001 * 3.458 <0.001 *Healthy vs. Non-food −6.703 <0.001 * −2.752 0.007 *
Non-food vs. Unhealthy −0.369 0.712 −0.954 0.341
CelebrityUnhealthy vs. Healthy −3.652 <0.001 * −1.477 0.142Healthy vs. Non-food −0.915 0.36 −0.526 0.6
Non-food vs. Unhealthy 4.212 <0.001 * 1.756 0.081
BrandUnhealthy vs. Healthy 1.746 0.081 0.291 0.771Healthy vs. Non-food 0.43 0.667 0.837 0.404
Non-food vs. Unhealthy −2.029 0.043 * −1.557 0.121
* Significant at p < 0.05.
4.2.3. Interactions between Content and Source of Advertisement
There was a significant interaction between advertisement content (healthy, unhealthy non-food)and source (peer, celebrity, sponsored) for fixation duration F(4, 693) = 17.395, p < 0.001 and countF(4, 167) = 3.33, p = 0.012 (Figures 12 and 13). Pairwise comparisons (Table 8) indicated that attentionduration for advertisement content was different depending on whether the source was a peer or acelebrity. When posted by a peer, fixation durations were significantly longer for unhealthy food poststhan for healthy food posts, t(693) = 6.773, b(0.121) = 0.817, p < 0.000, as were mean fixation counts,t(167) = 3.458, b(0.807) = 2.79, p < 0.000. However, the opposite pattern was found when posted by acelebrity, where fixation duration was significantly longer for healthy food ad posts than for unhealthyfood ad posts, t(693)=3.652, b(0.134) = 0.491, p < 0.000.
Int. J. Environ. Res. Public Health 2020, 17, 2181 17 of 25
Int. J. Environ. Res. Public Health 2020, 17, x 16 of 24
Unhealthy vs. Healthy 1.746 0.081 0.291 0.771 Healthy vs. Non-food 0.43 0.667 0.837 0.404 Non-food vs. Unhealthy −2.029 0.043 * −1.557 0.121
* Significant at p < 0.05.
Figure 10. Fixation count: Mean scores.
Figure 11. Fixation duration: Mean scores.
Figure 12. Interaction between fixation count and source of ad for 3 types of ad. Figure 12. Interaction between fixation count and source of ad for 3 types of ad.
Int. J. Environ. Res. Public Health 2020, 17, x 17 of 24
Figure 13. Interaction between fixation duration and source of ad for 3 types of ad.
5. Discussion
This is the first study, as far as we are aware, to examine adolescent responses in social, memory, and attention domains to the same set of social media advertising for a range of products and sources. We found a consistent pattern. When young people stated which posts they would share in social media; when assessing their attitude to peers, (Study 1a); when attempting to recall brands they had seen; or recognise them from a list (Study 1b), the young people in this study responded significantly more positively to unhealthy food advertising compared to non-food advertising, and to both these product types significantly more positively than to healthy food advertising. Although free recall rates overall were low, recall for unhealthy food brands was nearly five times as great as for healthy food brands and nearly twice as great as for non-food brands. Furthermore, when prompted from a list that included distractors, young people recognised many unhealthy food brands and did so at approximately twice the rate of healthy food and non-food brands. Finally, for measures of attention (Study 2), adolescents did not differ in the types of ads they looked at (fixation count), but they looked at ads for unhealthy foods for significantly longer (fixation duration).
In addition to the multiple domains measured in this study, a further novel feature was that it examined interactions between the content of a social media advertising post and its source. Here the findings were less straightforward. The source of the advertising post did not affect young people’s likelihood to share it, nor did the source affect their attitudes to the fictional peer whose social media account they were viewing (Study 1a). This suggests that, for social responses to advertising content in social media, adolescents are as susceptible to effects when ads originate from a company or brand, as they are when ads are shared by celebrities or their peer group. However, when measuring memory for brands (Study 1b), and fixation duration (Study 2), source did interact with ad content, although the patterns here were contradictory for these two domains. The fixation duration findings suggest that young people attended to unhealthy food posts from their peers for longer than from other sources, and to healthy food advertising posts from celebrities for longer than from other sources. Yet when participants’ free recall for brands was measured, the findings were different. For ads shared by celebrities and companies, participants recalled significantly more unhealthy food brands than non-food or healthy food brands, yet for ads shared by peers, recall did not differ significantly. Similarly, for recognition, when ads were shared by celebrities and companies, participants recognised unhealthy food brands significantly more, followed by non-food, with healthy food recognised least; yet when ads were shared by peers, recognition of unhealthy and healthy food brands did not differ, and non-food brands were recognised significantly less than food brands.
Taken together, therefore, the study findings indicate that adolescents attended to all of the advertising they saw in social media, but they viewed unhealthy food advertising posts for longer. They also recalled unhealthy food brands more, recognised them more, were more likely to share them, and had more positive views of peers in whose social media accounts they saw unhealthy food advertising posts.
Figure 13. Interaction between fixation duration and source of ad for 3 types of ad.
4.2.4. Age and Gender Effects
No main effects of gender were observed in the models for fixation duration, F(1, 693) = 0.968,p = 0.325, or for fixation count, F(1, 167) = 0.208, p = 0.649. However, age effects were observed forboth: fixation duration, F(1, 693) = 4.010, p < 0.000, and fixation count, F(1, 167) = 5.934, p = 0.016,were greater for older adolescents, demonstrating that older adolescents paid more attention to theposts overall.
5. Discussion
This is the first study, as far as we are aware, to examine adolescent responses in social, memory,and attention domains to the same set of social media advertising for a range of products and sources.We found a consistent pattern. When young people stated which posts they would share in social media;when assessing their attitude to peers, (Study 1a); when attempting to recall brands they had seen; orrecognise them from a list (Study 1b), the young people in this study responded significantly morepositively to unhealthy food advertising compared to non-food advertising, and to both these producttypes significantly more positively than to healthy food advertising. Although free recall rates overallwere low, recall for unhealthy food brands was nearly five times as great as for healthy food brands andnearly twice as great as for non-food brands. Furthermore, when prompted from a list that includeddistractors, young people recognised many unhealthy food brands and did so at approximately twicethe rate of healthy food and non-food brands. Finally, for measures of attention (Study 2), adolescentsdid not differ in the types of ads they looked at (fixation count), but they looked at ads for unhealthyfoods for significantly longer (fixation duration).
Int. J. Environ. Res. Public Health 2020, 17, 2181 18 of 25
In addition to the multiple domains measured in this study, a further novel feature was that itexamined interactions between the content of a social media advertising post and its source. Here thefindings were less straightforward. The source of the advertising post did not affect young people’slikelihood to share it, nor did the source affect their attitudes to the fictional peer whose social mediaaccount they were viewing (Study 1a). This suggests that, for social responses to advertising content insocial media, adolescents are as susceptible to effects when ads originate from a company or brand, asthey are when ads are shared by celebrities or their peer group. However, when measuring memoryfor brands (Study 1b), and fixation duration (Study 2), source did interact with ad content, althoughthe patterns here were contradictory for these two domains. The fixation duration findings suggestthat young people attended to unhealthy food posts from their peers for longer than from other sources,and to healthy food advertising posts from celebrities for longer than from other sources. Yet whenparticipants’ free recall for brands was measured, the findings were different. For ads shared bycelebrities and companies, participants recalled significantly more unhealthy food brands than non-foodor healthy food brands, yet for ads shared by peers, recall did not differ significantly. Similarly, forrecognition, when ads were shared by celebrities and companies, participants recognised unhealthy foodbrands significantly more, followed by non-food, with healthy food recognised least; yet when adswere shared by peers, recognition of unhealthy and healthy food brands did not differ, and non-foodbrands were recognised significantly less than food brands.
Taken together, therefore, the study findings indicate that adolescents attended to all of theadvertising they saw in social media, but they viewed unhealthy food advertising posts for longer.They also recalled unhealthy food brands more, recognised them more, were more likely to sharethem, and had more positive views of peers in whose social media accounts they saw unhealthy foodadvertising posts.
The findings regarding source of the post were complex and contradictory and the interactionsbetween product type and the source of the advertising post warrant further investigation. Asunhealthy food brands are frequently promoted by celebrities popular with adolescents [45,46], it isnotable that we found that celebrity-shared posts for unhealthy brands were recalled significantly morefrequently than posts from other sources. Interestingly, brand recall and recognition for unhealthy andhealthy foods did not vary for peer-shared posts. This suggests the possibility that young adolescentsmay be most open to healthy food communications from their own peers, and therefore that if seekingto promote healthier practices in social media, peer-led social marketing [65] might be more likely tosucceed than celebrity-led or public service messages.
Advertising recall and recognition is significant for children’s health as it is the first step in thehierarchy of food advertising effects that is hypothesised to lead to changes in eating behaviour andbody weight gain [49]. Meta-analysis of 45 studies has concluded that viewing food images provokesas strong a desire to eat as exposure to food itself [66], and further analyses indicate that attentionalbias towards food images is greater in those who eat more [57,67–69]. Furthermore, neural responsesto fast food advertising predict intake [70].
The findings for attention were least straightforward of the three outcome domains in thisstudy and this mirrors previous findings in this field [69,71].As eye-tracking measures eye movementbehaviour as an indirect index of processing, it is difficult to separate out the relative contributionsof expectation, pre-existing attitudes, and bottom-up perceptual features of the stimulus. Giventhe conditions included multiple trials with varied products and stimuli, we might infer that thepresent findings are driven by expectations about types of products and who posts them ratherpre-existing knowledge of a product or perceptual features of a specific ad. At the same time, itcould be argued that as food is an item children engage with daily from infancy, and as almost allexisting advertising is for unhealthy foods, it is likely that in this domain, young people have alreadydeveloped perceptual fluency for unhealthy food marketing which in turn increases liking [72] whenpresented with stimuli. Thus, even brief attention to unhealthy food advertisements may reinforcepositive attitudes, and furthermore, less attention is required for recall for unhealthy, compared to
Int. J. Environ. Res. Public Health 2020, 17, 2181 19 of 25
healthy and non-food advertising [73]. The exact role and relationships of visual attention, perceptualfluency, existing implicit attitudes and subsequent behaviours remain to be clarified and offer richpotential for future research.
The findings for peer attitudes echo studies of young people’s views of unhealthy food in othercontexts. For example, Swedish 14-year-olds, when creating their own images on Instagram, includedsignificantly more images of unhealthy food on their online profiles than healthier options [40]; 13 to15-year-olds at school in the UK believed healthy eating was ‘uncool’ and damaged the self-imagethey wanted to convey to peers [74]. As school friends’ Body Mass Indices (BMI) in Australian andAmerican adolescents were related, with those of higher BMIs being most similar [75], participants’greatest likelihood to share posts for unhealthy food is a concern as it indicates that unhealthy foodmarketing is the type young people are most likely to spread among networks.
Age was also pertinent to adolescents’ attention as older participants looked more and for longerat the advertising posts. The development of control systems as adolescents age allows them to retainattention for longer than younger adolescents [76]. They also spend more time viewing social medialater in adolescence [7]. Although it is often posited that cognitive capacity to recognise advertising andits persuasive intent is fully developed by adolescence (see discussion in WHO, 2016 [6]), the findingsof the present study indicate that attention paid to advertising posts increases with age, suggestingpotential greater vulnerability.
Participants’ positive attitudes to peers with unhealthy food advertising content in social media,and their greater willingness to ‘share’ it, indicates that this form of advertising likely contributesto adolescent identity expression online [77]. Social identity theories describe how people come todevelop a sense of self, or ‘who I am’, based on features of the social groups to which they belong; groupidentities are essential parts of the self-concept that “form a socially constructed sense of who and what‘we’ are and also who and what ‘we’ are not” [78]. One of the ways in which adolescents establish anidentity as distinct from older generations is through eating and identifying with widely marketed‘junk’ foods, a form of adolescent identity expression that reflects marketing campaigns and that hasbeen found in multiple cultures over decades [77]. As social media are sites in which adolescentsengage in the central developmental task of identity formation [79], unhealthy food marketing is likelyto become enmeshed in this process.
Adolescents’ attention to unhealthy food advertising, their recall of this advertising and theirevaluation of peers and likelihood to share this content through their networks, all constitute importantfacets of their responses to advertising content in a media-saturated environment. These early findingsfor social media effects on young adolescents’ recall and recognition of food and other brands haveimplications for future research and policy action to protect and promote health. Before consideringthese, we address strengths and limitations of the study.
5.1. Limitations
Researchers examining digital media practices and effects face substantial design challenges. Incontrast to broadcast media, users’ experiences in social media (including the advertising they see) arepersonalized, yet accessing young people’s actual social media accounts for research is particularlyethically challenging [6,80]. This study therefore featured fictional peers, and celebrities that arepopular with participants’ age group. How this impacts on the ecological validity of the study isuncertain, although it seems reasonable to infer that effects might be greater for actual friends andcelebrities they personally follow.
Furthermore, young people’s digital platforms preferences can change rapidly. Facebook was themost-used social media platform among Irish teens when the study was designed [8]; by the time itwas carried out, Snapchat and Instagram had become increasingly popular [81], and at the time ofwriting, Snapchat had become less of a focus with the rise of TikTok [82]. Still, Facebook continues tobe a widely used platform [7]. We are unaware of any studies comparing advertising effects across
Int. J. Environ. Res. Public Health 2020, 17, 2181 20 of 25
platforms. However, as the effects found in this study mirror those identified in television, it suggeststhat they are likely to transfer to other digital platforms as well.
5.2. Strengths
The study is the first we know of that examines young adolescents’ social responses, memory andattention of social media advertising posts for healthy, unhealthy and non-food brands in multiplesocial contexts. It benefits from integrating theory of social norms of food and social media with foodmarketing effects. The stimuli were designed with the input of young people, to closely simulate socialmedia accounts. This feature, together with the fact that participants were blind to the aim of the studywhen viewing the feeds, was a major strength in the experiment, achieving a combination of ecologicalvalidity and levels of experimental control that are typically subjected to trade-off in research studies.
5.3. Implications for Research and Policy
This study adds to a nascent body of evidence indicating that food marketing in digital media islikely to contribute to adverse effects on adolescents’ health [83]. Of interest for research in advertisingeffects is the contrast between the free and prompted recall rates found. Reflecting findings for muchyounger children [84], this indicates that even when memory is more developed in adolescence, freerecall remains a poor measure of advertising exposure compared to prompted recognition. Futureareas of exploration are links between social responses to food marketing (sharing and peer assessment)and consumption patterns.
For policy, the findings indicate the likely vulnerability of young adolescents to food marketing.Engagement with food and beverage brands in social media is widespread: in the US, millions ofadolescents follow these accounts [15] and 70% of 1564 adolescents surveyed reported engaging withat least one brand and 35% with five or more [85]. They will therefore receive food and beveragemarketing, and the present study shows they are likely to share this with their networks. Furthermore,the impact of shared advertising for unhealthy products can be predicted to be disproportionatelypowerful, as adolescent social norms of eating and perception of others’ consumption skews towardsunhealthy foods, and this in turn disproportionately affects adolescents’ eating [38].
Adolescents are under-represented in research regarding food marketing and are typicallyneglected by regulatory measures aimed at protecting children from the negative health effects ofunhealthy food marketing [6]. This study indicates that the present global focus on protecting childrenup to 12 years old may leave a substantial proportion of young people, at the age when their socialmedia use rises rapidly [7], unprotected from digital food marketing [86] and thus in a position wheretheir rights to health, privacy and freedom from exploitation are infringed [87].
6. Conclusions
In conclusion, in social media, young people’s responses to unhealthy food advertising posts weresignificantly greater than their responses to unhealthy and non-food posts, whether measured by theirattention, memory, positive assessment of peers, or likelihood to ‘share’. Given adolescents’ extensiveuse of social media, these findings are important in considering regulation of marketing beyond theage of 13 (currently the upper limit in many countries) and even beyond 15 (as in Ireland and theUK), as attention to advertising increased between 13 and 17 years. The study provides evidence thatexisting restrictions aiming to protect children from unhealthy food advertising in television should beextended to digital advertising seen by young adolescents in social media.
Author Contributions: Conceptualization, M.T.-G., B.R., E.B.; Methodology, M.T.-G., B.R., E.B.; Materials design,M.T.-G., B.R., B.S., G.M.; Data collection, B.S., G.M., C.C.; Data Curation, B.R., B.S., G.M., C.C.; Formal Analysis,B.S., G.M., C.C., M.T.-G., B.R.; Writing—Original Draft Preparation B.S., G.M., C.C., M.T.-G., B.R.; Writing—Review& Editing, M.T.-G., B.R., E.B.; Supervision, M.T.-G., B.R.; Funding Acquisition n/a. All authors have read andagreed to the published version of the manuscript.
Funding: This research received no external funding.
Int. J. Environ. Res. Public Health 2020, 17, 2181 21 of 25
Acknowledgments: This study was carried out in partial fulfilment of the degree of M Psych Science at UniversityCollege Dublin by Grainne Murphy and Ciara Corcoran, as well as by Barry Sheppard who also contributedto materials design, data curation, analysis and original draft. It was conceptualised by Mimi Tatlow-Golden,Brendan Rooney and Emma Boyland. We thank Jennifer Harris for her constructive comments on an earlierversion of this paper.
Conflicts of Interest: The authors declare no conflict of interest.
References
1. UNICEF. The State of the World’s Children 2019. Growing Well in a Changing World. Children, Food and Nutrition;UNICEF: Geneva, Switzerland, 2019; Available online: https://www.unicef.org/reports/state-of-worlds-children-2019 (accessed on 17 March 2020).
2. World Health Organization. Report of the Commission on Ending Childhood Obesity; World Health Organization:Geneva, Switzerland, 2016; Available online: https://www.who.int/end-childhood-obesity/publications/echo-report/en/ (accessed on 17 March 2020).
3. Boyland, E.; Tatlow-Golden, M. Exposure, power and impact of food marketing on children: Evidencesupports strong restrictions. Eur. J. Risk Regul. 2017, 8, 224–236. [CrossRef]
4. Boyland, E.J.; Nolan, S.; Kelly, B.; Tudor-Smith, C.; Jones, A.; Halford, J.C.G.; Robinson, E. Advertising as acue to consume: A systematic review and meta-analysis of the effects of acute exposure to unhealthy foodand nonalcoholic beverage advertising on intake in children and adults. Am. J. Clin. Nutr. 2016, 103, 519–533.[CrossRef] [PubMed]
5. World Health Organization Regional Office for Europe. Tackling Food Marketing to Children in a Digital World:Trans-Disciplinary Perspectives. Children’s Rights, Evidence of Impact, Methodological Challenges, Regulatory Optionsand Policy Implications for the WHO European Region; World Health Organization: Geneva, Switzerland, 2016;Available online: http://www.euro.who.int/__data/assets/pdf_file/0017/322226/Tackling-food-marketing-children-digital-world-trans-disciplinary-perspectives-en.pdf?ua=1 (accessed on 17 March 2020).
6. Garde, A.; Byrne, S.; Gokani, N.; Murphy, B. A Child Rights-Based Approach to Food Marketing: A Guide forPolicy Makers; UNICEF: Geneva, Switzerland, 2018; Available online: https://www.unicef.org/csr/files/A_Child_Rights-Based_Approach_to_Food_Marketing_Report.pdf (accessed on 17 March 2020).
7. Ofcom. Children and Parents: Media Use and Attitudes Report 2019; Ofcom: London, UK, 2020;Available online: https://www.ofcom.org.uk/research-and-data/media-literacy-research/childrens/children-and-parents-media-use-and-attitudes-report-2019 (accessed on 17 March 2020).
8. O’Neill, B.; Dinh, T. Net Children Go Mobile. Full Findings from Ireland; Dublin Institute of Technology: Dublin,Ireland, 2015; Available online: http://netchildrengomobile.eu/reports/ (accessed on 17 March 2020).
9. Smahel, D.; Machackova, H.; Mascheroni, G.; Dedkova, L.; Staksrud, E.; Ólafsson, K.; Livingstone, S.;Hasebrink, U. EU Kids Online 2020: Survey Results from 19 Countries; EU Kids Online, London School ofEconomics: London, UK, 2020; Available online: http://www.lse.ac.uk/media-and-communications/research/
research-projects/eu-kids-online/eu-kids-online-2020 (accessed on 17 March 2020).10. Montgomery, K.; Chester, J. Interactive Food and Beverage Marketing: Targeting Adolescents in the Digital
Age. J. Adolesc. Health 2009, 45, S18–S29. [CrossRef] [PubMed]11. Montgomery, K. Youth and surveillance in the Facebook era: Policy interventions and social implications.
Telecomm Policy 2015, 39, 771–786. [CrossRef]12. Qutteinq, Y.; Hallez, L.; Mennes, N.; De Backer, C.; Smits, T. What Do Adolescents See on Social Media? A
Diary Study of Food Marketing Images on Social Media. Front. Psychol. 2019, 10, 2637. [CrossRef] [PubMed]13. Advertising Standards Authority. ASA Monitoring Report on Online HFSS Ads. 2019. Available online:
https://www.asa.org.uk/uploads/assets/uploaded/14be798d-bd30-49d6-bcfbc9ed7e66e565.pdf (accessed on17 March 2020).
14. Potvin Kent, M.; Pauze, E.; Roy, E.-A.; De Billy, N.; Czoli, C. Children and adolescents’ exposure to food andbeverage marketing in social media apps. Pediatr. Obes. 2019, 14, e12508. [CrossRef] [PubMed]
15. Rummo, P.D.; Cassidy, O.; Wells, I.; Coffino, J.A.; Bragg, M.A. Examining the Relationship betweenYouth-Targeted Food Marketing Expenditures and the Demographics of Social Media Followers. Int. J.Environ. Res. Public Health 2020, 17, 1631. [CrossRef]
Int. J. Environ. Res. Public Health 2020, 17, 2181 22 of 25
16. Tatlow-Golden, M.; Tracey, L.; Dolphin, L. Who’s Feeding the Kids Online? Digital Food Marketing to Childrenin Ireland: Advertisers’ Tactics, Children’s Exposure and Parents’ Awareness; Irish Heart Foundation: Dublin,Ireland, 2016; Available online: https://irishheart.ie/wp-content/uploads/2016/12/web__whos_feeding_the_kids_online_report_2016.compressed.pdf (accessed on 17 March 2020).
17. Harris, J.L.; Heard, A.; Kunkel, D. Marketing unhealthy foods to children on Facebook. In ConsumerPsychology in a Social Media World; Dimofte, C.V., Haugtvedt, C.P., Yalch, R.F., Eds.; Routledge: New York, NY,USA, 2016; pp. 239–253.
18. Rozendaal, E.; Buijzen, M.; Valkenburg, P. Children’s understanding of advertisers’ persuasive tactics. Int. J.Advert. 2011, 30, 329–350. [CrossRef]
19. Pechmann, C.; Levine, L.; Loughlin, S.; Leslie, F. Impulsive and Self-Conscious: Adolescents’ Vulnerability toAdvertising and Promotion. J. Public Policy Mark. 2005, 24, 202–221. [CrossRef]
20. Wills, T.A.; Gibbons, F.X.; Sargent, J.D.; Gerrard, M.; Lee, H.-R.; Dal Cin, S. Good self-control moderates theeffect of mass media on adolescent tobacco and alcohol use: Tests with studies of children and adolescents.Health Psychol. 2010, 29, 539–549. [CrossRef]
21. Van Leijenhorst, L.; Zanolie, K.; Van Meel, C.S.; Westenberg, P.M.; Rombouts, S.A.R.B.; Crone, E.A. WhatMotivates the Adolescent? Brain Regions Mediating Reward Sensitivity across Adolescence. Cereb Cortex2010, 20, 61–69. [CrossRef] [PubMed]
22. Folkvord, F.; Anschütz, D.J.; Boyland, E.; Kelly, B.; Buijzen, M. Food advertising and eating behavior inchildren. Curr. Opin. Behav. Sci. 2016, 9, 26–31. [CrossRef]
23. Ali, M.; Blades, M.; Oates, C.; Blumberg, F. Young children’s ability to recognize advertisements in web pagedesigns. Br. J. Dev. Psychol. 2009, 27, 71–83. [CrossRef] [PubMed]
24. Confos, N.; Davis, T. Young consumer-brand relationship building potential using digital marketing. Eur. J.Mark. 2016, 50, 1993–2017. [CrossRef]
25. Kelly, B.; Vandevijvere, S.; Freeman, B.; Jenkin, G. New Media but Same Old Tricks: Food Marketing toChildren in the Digital Age. Curr. Obes. Rep. 2015, 4, 37–45. [CrossRef]
26. Anderson, M.; Jiang, J. Teens’ Social Media Habits and Experiences; Pew Research Center, 2016. Available online:https://www.pewresearch.org/internet/2018/11/28/teens-and-their-experiences-on-social-media/ (accessedon 17 March 2020).
27. Yau, J.C.; Reich, S.M. “It’s Just a Lot of Work”: Adolescents’ Self-Presentation Norms and Practices onFacebook and Instagram. J. Res. Adolesc. 2018, 29, 196–209. [CrossRef]
28. Rosenberg, J.; Egbert, N. Online Impression Management: Personality Traits and Concerns for SecondaryGoals as Predictors of Self-Presentation Tactics on Facebook. J. Comput. Mediat. Commun. 2011, 17, 1–18.[CrossRef]
29. Llyod, B.T.N. A Conceptual Framework for Examining Adolescents Identity, Media Influence, and SocialDevelopment. Rev. Gen. Psychol. 2002, 6, 73–91. [CrossRef]
30. Drury, K.; Bukowski, W.M.; Velásquez, A.M.; Stella-Lopez, L. Victimization and Gender Identity in Single-Sexand Mixed-Sex Schools: Examining Contextual Variations in Pressure to Conform to Gender Norms. SexRoles 2013, 69, 442–454. [CrossRef]
31. Davis, K. Friendship 2.0: Adolescents’ experiences of belong and self disclosure online. J. Adolesc. 2012, 35,1527–1536. [CrossRef]
32. Houldcroft, L.; Haycraft, E.; Farrow, C. Peer and Friends Influences on Children’s Eating. Soc. Dev. 2014, 23,19–40. [CrossRef]
33. Hemar-Nicolas, V.; Gollety, M.; Damay, C.; Ezan, P. “What brands do you eat?” The influence of food brandswithin children’s peer groups. Young Consum. 2015, 16, 316–331. [CrossRef]
34. Roper, S.; La Niece, C. The importance of brands in the lunch-box choices of low-income British schoolchildren. J. Consum. Behav. 2009, 8, 84–99. [CrossRef]
35. Fitzgerald, A.; Heary, C.; Nixon, E.; Kelly, C. Factors influencing the food choices of Irish children andadolescents: A qualitative investigation. Health Promot. Int. 2010, 25, 289–298. [CrossRef]
36. Bevelander, K.E.; Anschütz, D.J.; Creemers, D.H.M.; Kleinjan, M.; Engles, R.C.M.E. The Role of Explicit andImplicit Self-Esteem in Peer Modelling of Palatable Food Intake: A Study on Social Media Interaction amongYoungsters. PLoS ONE 2013, 8, e72481. [CrossRef]
37. Kinard, B.R.; Webster, C. Factors influencing unhealthy eating behaviour in US adolescents. Int. J. Consum.Stud. 2012, 36, 23–29. [CrossRef]
Int. J. Environ. Res. Public Health 2020, 17, 2181 23 of 25
38. Lally, P.; Bartle, N.; Wardle, J. Social norms and diet in adolescents. Appetite 2011, 57, 623–627. [CrossRef]39. Salvy, S.-J.; de la Haye, K.; Bowker, J.C.; Hermans, R.C.J. Influence of peers and friends on children’s and
adolescents’ eating and activity behaviors. Physiol. Behav. 2012, 106, 369–378. [CrossRef]40. Holmberg, N. Adolescents’ presentation of food in social media: An explorative study. Appetite 2016, 99,
121–129. [CrossRef]41. Gibs, J.; Bruich, S. Advertising Effectiveness: Understanding the Value of a Social Media Impression. A
Nielsen/Facebook Report; Nielsen: New York, NY, USA, 2010; Available online: http://www.nielsen.com/us/en/
insights/news/2010/nielsenfacebook-ad-report.html (accessed on 17 March 2020).42. Couldry, N.; Markham, T. Celebrity culture and public connection: Bridge or chasm? Int. J. Cult. Stud. 2007,
10, 403–421. [CrossRef]43. Lueck, J.A. Friend-zone with benefits: The parasocial advertising of Kim Kardashian. J. Mark. Commun.
2012, 21, 91–109. [CrossRef]44. Horton, D.; Wohl, R.R. Mass Communication and Para-Social Interaction. Psychiatry 1956, 19, 215–229.
[CrossRef] [PubMed]45. Bragg, M.A.; Miller, A.N.; Elizee, J.; Dighe, S.; Elbel, B.D. Popular Music Celebrity Endorsements in Food
and Nonalcoholic Beverage Marketing. Pediatrics 2016, 138, 1–11. [CrossRef] [PubMed]46. Bragg, M.A.; Yanamadala, S.; Roberto, C.A.; Harris, J.L.; Brownell, K.D. Athlete Endorsements in Food
Marketing. Pediatrics 2013, 132, 805–810. [CrossRef]47. Boyland, E.J.; Harrold, J.A.; Dovey, T.M.; Allison, M.; Dobson, M.; Jacobs, M.C.; Halford, J.C. Food choice and
overconsumption: Effect of premium sports celebrity endorser. J. Paediatr. 2013, 163, 339–343. [CrossRef]48. Dixon, H.; Scully, M.; Niven, P.; Kelly, B.; Chapman, K.; Donovan, J.; Martin, J.; Baur, L.A.; Crawford, D.;
Wakefield, M. Effects of Nutrient content claims, sports celebrity endorsement and premium offers onpre-adolescent children’s food preferences: Experimental research. Paediatr. Obes. 2013, 9, e47–e57.[CrossRef]
49. Kelly, B.; King, L.; Chapman, K.; Boyland, E.; Bauman, A.E.; Baur, L.A. A Hierarchy of Unhealthy FoodPromotion Effects: Identifying Methodological Approaches and Knowledge Gaps. Am. J. Public Health 2015,105, e86–e95. [CrossRef]
50. Schacter, D.L. Implicit memory: History and current status. J. Exp. Psychol. Learn. Mem. Cogn. 1987, 13, 501.[CrossRef]
51. Tulving, E. How many memory systems are there? Am. Psychol. 1985, 40, 385–398. [CrossRef]52. Staresina, B.P.; Davachi, L. Differential Encoding Mechanisms for Subsequent Associative Recognition and
Free Recall. J. Neurosci. 2006, 26, 9162–9172. [CrossRef]53. Gidlof, K.; Holmberg, N.; Sandberg, H. The use of eye-tracking and retrospective interviews to study
teenagers’ exposure to online advertising. Vis. Commun. 2012, 11, 329–345. [CrossRef]54. Jacob, R.J.K.; Karn, K.S. Eye Tracking in Human–Computer Interaction and Usability Research: Ready to
Deliver the Promises. In The Mind’s Eye: Cognitive and Applied Aspects of Eye Movement Research; Hyona, R.D.,Ed.; Elsevier Science BV: Amsterdam, The Netherlands, 2009; pp. 573–605.
55. Maughan, L.; Gutnikov, S.; Stevens, R. Like more, look more. Look more, like more: The evidence fromeye-tracking. J. Brand. Manag. 2007, 14, 335–342. [CrossRef]
56. Folkvord, F.; Anschütz, D.J.; Wiers, R.W.; Buijzen, M. The role of attentional bias in the effect of foodadvertising on actual food intake among children. Appetite 2015, 84, 251–258. [CrossRef]
57. Doolan, K.J.; Breslin, G.; Hanna, D.; Murphy, K.; Gallagher, A.M. Visual attention to food cues in obesity: Aneye-tracking study. Obesity 2014, 22, 2501–2507. [CrossRef] [PubMed]
58. Werthmann, J.; Roefs, A.; Nederkoorn, C.; Mogg, K.; Bradley, B.P.; Jansen, A. Attention bias for food isindependent of restraint in healthy weight individuals—An eye tracking study. Eat Behav. 2013, 14, 397–400.[CrossRef] [PubMed]
59. Higgs, S. Social norms and their influence on eating behaviours. Appetite 2015, 86, 38–44. [CrossRef]60. Central Statistics Office. Irish Babies’ Names 2000. Available online: http://www.cso.ie/en/media/csoie/
releasespublications/documents/birthsdm/2000/babiesnames_2000.pdf (accessed on 17 March 2020).61. World Health Organization Regional Office for Europe. Nutrient Profile Model; World Health Organization:
Geneva, Switzerland, 2015; Available online: http://www.euro.who.int/__data/assets/pdf_file/0005/270716/
Nutrient-children_web-new.pdf (accessed on 17 March 2020).
Int. J. Environ. Res. Public Health 2020, 17, 2181 24 of 25
62. Adriaanse, J.A.; Crosswhite, J.J. David or Mia? The influence of gender on adolescent girls’ choice of sportrole models. Women’s Stud. Int. Forum 2008, 31, 383–389. [CrossRef]
63. Klaus, N.; Bailey, A.A. Celebrity endorsements: An examination of gender and consumers’ attitudes. J. Bus.2008, 23, 53–61. [CrossRef]
64. Faul, F.; Erdfelder, E.; Buchner, A.; Lang, A.G. Statistical power analyses using G*Power 3.1: Tests forcorrelation and regression analyses. Behav. Res. Methods 2009, 41, 1149–1160. [CrossRef]
65. Llauradó, E.; Aceves-Martins, M.; Tarro, L.; Papell-Garcia, I.; Puiggròs, F.; Arola, L.; Prades-Tena, J.;Montagut, M.; Moragas-Fernández, C.M.; Solà, R.; et al. A youth-led social marketing intervention toencourage healthy lifestyles, the EYTO (European Youth Tackling Obesity) project: A cluster randomisedcontrolled0 trial in Catalonia, Spain. BMC Public Health 2015, 15, 607. [CrossRef]
66. Boswell, R.G.; Kober, H. Food cue reactivity and craving predict eating and weight gain: A meta-analyticreview. Obes. Rev. 2015, 17, 159–177. [CrossRef] [PubMed]
67. Popien, A.; Frayn, M.; von Ranson, K.M.; Sears, C.R. Eye gaze tracking reveals heightened attention to foodin adults with binge eating when viewing images of real-world scenes. Appetite 2015, 91, 233–240. [CrossRef]
68. Yokum, S.; Ng, J.; Stice, E. Attentional Bias to Food Images Associated with Elevated Weight and FutureWeight Gain: An fMRI Study. Obesity 2011, 19, 1775–1783. [CrossRef] [PubMed]
69. Velazquez, C.E.; Pasch, K.E. Attention to Food and Beverage Advertisements as Measured by Eye-TrackingTechnology and the Food Preferences and Choices of Youth. J. Acad. Nutr. Diet. 2014, 114, 578–582. [CrossRef][PubMed]
70. Gearhardt, A.N.; Yokum, S.; Harris, J.L.; Epstein, L.H.; Lumeng, J.C. Neural response to fast food commercialsin adolescents predicts intake. Am. J. Clin. Nutr. 2020, 111, 493–502. [CrossRef] [PubMed]
71. Spielvogel, I.; Matthes, J.; Naderer, B.; Karsay, K. A treat for the eyes. An eye-tracking study on children’sattention to unhealthy and healthy food cues in media content. Appetite 2018, 125, 63–71. [CrossRef][PubMed]
72. Reber, R.; Winkielman, P.; Schwarz, N. Effects of Perceptual Fluency on Affective Judgments. Psychol. Sci.1998, 9, 45–48. [CrossRef]
73. Naderer, B.; Binder, A.; Matthes, J.; Spielvogel, I.; Forrai, M. Food as an eye-catcher. An eye-tracking study onChildren’s attention to healthy and unhealthy food presentations as well as non-edible objects in audiovisualmedia. Pediatr. Obes. 2020, 15, e12591. [CrossRef]
74. Stead, M.; McDermott, L.; MacKintosh, A.M.; Adamson, A. Why healthy eating is bad for young people’shealth: Identity, belonging and food. Soc. Sci. Med. 2011, 72, 1131–1139. [CrossRef]
75. Fletcher, A.; Bonell, C.; Sorhaindo, A. You are what your friends eat: A systematic review of social networkanalyses of young people’s eating behaviours and bodyweight. J. Epidemiol. Community Health 2011, 65,548–555. [CrossRef]
76. Carriere, J.S.A.; Cheyne, J.A.; Solman, G.J.F.; Smilek, D. Age trends for failures of sustained attention. Psychol.Aging 2010, 25, 569–574. [CrossRef] [PubMed]
77. Tatlow-Golden, M. ‘Food, eating and identities’. In Exploring Childhood and Youth; Cooper, V., Holford, N.,Eds.; Routledge: London, UK, 2020.
78. Oyserman, D.; Fryberg, S.A.; Yoder, N. Identity-Based Motivation and Health. J. Personal. Soc. Psychol. 2007,93, 1011–1027. [CrossRef] [PubMed]
79. Michikyan, M.; Suárez-Orozco, C. Adolescent Media and Social Media Use: Implications for Development. J.Adolesc. Res. 2016, 31, 411–414. [CrossRef]
80. Tatlow-Golden, M.; Verdoodt, V.; Oates, J.; Jewell, J.; Breda, J.; Boyland, E. A safe glimpse within the blackbox? Ethical and legal principles in assessing digital marketing of food and drink to children. WHO PublicHealth Panor. 2017, 3, 613–621.
81. Jaffray, P. Taking Stock with Teens. 2016. Available online: http://www.politico.com/f/?id=00000157-c525-d9f3-a3d7-f565d9d20000 (accessed on 2 October 2017).
82. Perez, S. TikTok surpassed Facebook, Instagram, Snapchat and YouTube in downloads last month.TechCrunch. 3 November 2018. Available online: https://techcrunch.com/2018/11/02/tiktok-surpassed-facebook-instagram-snapchat-youtube-in-downloads-last-month/ (accessed on 17 March 2020).
83. Smith, R.; Kelly, B.; Yeatman, H.; Boyland, E. Food marketing influences children’s attitudes, preferences andconsumption: A systematic critical review. Nutrients 2019, 11, 875. [CrossRef] [PubMed]
Int. J. Environ. Res. Public Health 2020, 17, 2181 25 of 25
84. Tatlow-Golden, M.; Hennessy, E.; Hollywood, L.; Dean, M. Young children’s food brand knowledge.Early development and associations with television viewing and parent’s diet. Appetite 2014, 80, 197–203.[CrossRef]
85. Fleming-Milici, F.; Harris, J.L. Adolescents’ engagement with unhealthy food and beverage brands on socialmedia. Appetite 2020, 146, 104501. [CrossRef]
86. The World Health Organization Regional Office for Europe. Evaluating Implementation of the WHO Set ofRecommendations on the Marketing of Foods and Non-Alcoholic Beverages to Children. Progress, Challenges andGuidance for Next Steps in the WHO European Region; World Health Organization: Geneva, Switzerland, 2018;Available online: http://www.euro.who.int/__data/assets/pdf_file/0003/384015/food-marketing-kids-eng.pdf(accessed on 17 March 2020).
87. Tatlow-Golden, M.; Garde, A. Digital food marketing to children: Exploitation, surveillance and rightsviolations. Glob. Food Secur. 2020. forthcoming.
© 2020 by the authors. Licensee MDPI, Basel, Switzerland. This article is an open accessarticle distributed under the terms and conditions of the Creative Commons Attribution(CC BY) license (http://creativecommons.org/licenses/by/4.0/).