SEE 2021 Third Quarter Earnings - ir.sealedair.com
25
SEE 2021 Third Quarter Earnings November 2, 2021 Conference Call Supplement (Unaudited Results) Ted Doheny, President & CEO Chris Stephens, SVP & CFO Lori Chaitman, VP Investor Relations
Transcript of SEE 2021 Third Quarter Earnings - ir.sealedair.com

SEE 2021 Third Quarter EarningsNovember 2, 2021Conference Call Supplement (Unaudited Results)
Ted Doheny, President & CEOChris Stephens, SVP & CFOLori Chaitman, VP Investor Relations

Safe Harbor and Regulation G StatementForward-looking StatementsThis presentation contains “forward-looking statements” within the meaning of the safe harbor provisions of the Private Securities Litigation Reform Act of 1995. All statements other thanstatements of historical facts included in this presentation regarding our strategies, prospects, financial condition, operations, costs, plans and objectives are forward-looking statements.Examples of forward-looking statements include, among others, statements we make regarding expected future operating results (including the SEE Operating Model), expectationsregarding the results of restructuring and other programs, expectations regarding the results of business strategies and transformations, anticipated levels of capital expenditures andexpectations of the effect on our financial condition of claims, litigation, environmental costs, contingent liabilities and governmental and regulatory investigations and proceedings.Forward-looking statements are subject to risks and uncertainties, many of which are outside our control, which could cause actual results to differ materially from these statements. Forinformation about some of those risks and uncertainties, see the “Risk Factors” section appearing in our most recent Annual Report on Form 10-K, and as revised and updated by ourQuarterly Reports on Form 10-Q and Current Reports on Form 8-K. Any forward-looking statement speaks only as of the date on which it is made, and we undertake no obligation topublicly update such statement.
Non-U.S. GAAP Financial MeasuresOur management uses non-U.S. GAAP financial measures to evaluate the Company’s performance, which exclude items we consider unusual or special items. We believe that the useof non-U.S. GAAP measures helps investors to gain a better understanding of core operating results and future prospects, consistent with how management measures and forecasts theCompany's performance, especially when comparing such results to previous periods or forecasts. Please see Sealed Air’s November 2, 2021 earnings press release and the appendixof this presentation for important information about the use of non-U.S. GAAP financial measures relevant to this presentation, including applicable reconciliations to U.S. GAAP financialmeasures. Information reconciling forward-looking U.S. GAAP measures to non-U.S. GAAP measures is not available without unreasonable effort. Values in this presentation areapproximate due to rounding. Additionally, the individual components of bridges or the individual quarterly components presented in the current or prior quarter earnings presentationmay not sum to the full year amount due to rounding.
Website Information - Please visit our website Sealedair.comWe routinely post important information for investors on our website, www.sealedair.com, in the "Investors" section. We use this website as a means of disclosing material, non-publicinformation and for complying with our disclosure obligations under Regulation FD. Accordingly, investors should monitor the Investors section of our website, in addition to following ourpress releases, SEC filings, public conference calls, presentations and webcasts. The information contained on, or that may be accessed through, our website is not incorporated byreference into, and is not a part of, this document.
© 2021 SEE | 2


Q3 2021 Financial Results
© 2021 SEE | 4
Strong sales & earnings against inflationary pressures & supply challenges
Net Sales $1.4B; +14%, +13% constant dollar
Adjusted EBITDA $271M; +4%
Adjusted EPS $0.86; +5%
Free Cash Flow $223M vs $292M in Sept YTD 2020
SEE Operating Engine is PerformingSEE Touchless Automation™ & Sustainable Solutions driving demand, growth & productivity

SEE Operating Model
© 2021 SEE | 5
833 890
965
1,051
2017 2018 2019 2020 2021E 2024E
Adjusted EBITDA ($M)
1,120 – 1,140
Automation, Digital & Sustainability Driving 2021 Growth & BeyondSEE Operating Engine generating earnings power to fuel growth
Adjusted EPS >10% growth
3 - 5% growth
Adjusted EBITDA 5 - 7% growthOperating Leverage 1 >30%
>50% Free Cash Flow conversion 2
ROIC > WACC
Organic Sales
Cash Generation
Earnings
Earnings per Share
2024E
2 FCF Conversion: Free Cash Flow / Adj EBITDA
Zero Harm, SEE Touchless Automation™, Digital, and Sustainability for growth
1 Operating Leverage (Earnings / Growth) YoY change in Adj EBITDA / YoY change in Net Sales

22%63% 15%Americas Europe, Middle East & Africa Asia Pacific
Liquids & Fluids 4%
Industrials 11%eComm Retail 14%
Medical, Life Sciences 5% Seafood 2%
Poultry 7% Electronics 7%Cheese 7%Smoked & Processed 9%Red Meat 22%
Transportation & Other 5% Logistics 2%Other Foods 5%
Sept YTD 2021 Sales
Market driven solutions: SEE Touchless Automation™, digital and sustainability powering global growth
SEE Solutions for Critical Packaging Challenges
6

Gaining momentum, solution multipliers drive growth opportunity over life cycle $5B+ SEE Automation: Equipment & System • Service • Materials
Solving for Customer Savings & ChallengesBest solutions • Right price • Make them sustainable
Solving Customers’ Automation Needs Major protein producers committing to SEE Touchless Automation™ futureCreating multi-million $ customer savingsAutomation, Service and Materials accelerate payback < 3 years
SEE Touchless AutomationTM Branded SolutionsYTD 2021 Equipment, Systems & Services up ~20% YoY, on track to >$425MLTM Bookings up significantly, pandemic accelerated automation demand
Autobag equipment annual bookings >$70M, up >60% since LTM Dec 2019Generating customer savings and building strategic partnershipsInvesting in innovation and capacity expansion
Pull-through High Performance Materials & Advanced Services
© 2021 SEE | 7
3x+ Solutions Multiple over Equipment Life Cycle
Sales ($M)
COVID Start
Sept ‘21
>60%
Dec ‘19
up to 7x
Future materialsPull-through
Autobag® Equipment Bookings TrendLTM Dec 2019 to LTM Sept 2021

SEE Automation, Digital & Sustainability Fueling Earnings Growth
© 2021 SEE | 8
Eliminate Waste → Simplify the Process → Zero Harm → Touchless Automation™
Environmental Goals 2025 Sustainability Pledge
High Performance • Food Safety • Waste Reduction • Renewable Materials • Recycled Content • Freight Savings
1 Across SEE operations (Scopes 1 & 2) 2 Zero waste to landfill and incineration from SEE manufacturing operations
100% of solutions designed for recyclability or reusability50% recycled or renewable contentCollaborate to enable development of recycling infrastructure
Net Zero Carbon (CO2) Emissions1 by 2040Zero waste by 20302
GHG, water & energy intensity improvements
SEE Mark™ Smart Packaging Patent Pending
Best Solutions, Right Price, Make them Sustainable
Autobag loading, robotics, vision & digital printing technologies
SEE Operations Consumer Store/HomeCustomer Operations
Customers SEE the future
Significantly reducing touchpoints, eliminating thousands of boxes Driving packaging digitalization through supply chain
efficiency, sustainability & brand engagement
Recycling Streams

Q3 2021 YoY Sales Performance
© 2021 SEE | 9
$797
13%
12%
57%
($M)
Strong Growth Execution Despite Supply Challenges
Sales
As Reported Change
Constant Dollar Change
% of Sales
$609
14%
13%
43%
$907
14%
14%
64%
$295
15%
13%
21%
$204
9%
6%
15%
EMEA Asia Pacific
$1,407
14%
13%
100%
AmericasProtectiveFoodSEESegments Regions
*
* Americas includes North and South America

YoY Sales Trends
© 2021 SEE | 10
Q3 growth in Food & Protective, led by Americas & EMEA
Q3 Q4 Q1 Q2 Q3 Q3 Q4 Q1 Q2 Q3 Q3 Q4 Q1 Q2 Q3 Q3 Q4 Q1 Q2 Q3
Food (3) - 2 9 13 (1) - - 6 12 (2) - - 4 6 1 - 1 1 7
Protective 9 8 17 24 14 8 7 14 20 13 4 7 13 15 4 (1) (1) 1 5 10
SEE 2 3 8 15 14 3 3 6 11 13 1 3 5 9 5 - - 1 3 8
Americas 1 1 3 13 14 4 4 4 13 14 1 4 3 9 3 - (1) 1 3 11
EMEA 2 5 14 26 15 - 1 7 16 13 (2) - 7 15 10 - 1 - 1 4
APAC 4 9 23 9 9 1 4 12 - 6 1 4 13 (2) 6 - - (1) 1 1
SEE 2 3 8 15 14 3 3 6 11 13 1 3 5 9 5 - - 1 3 8
Volume % Excluding Acquisitions
Growth % As Reported
Growth % Constant Dollar
Price %Excluding Acquisitions2021
2020
Volume growth driven by Food, Automation & Industrial

SEE Net Sales & Adjusted EBITDA
© 2021 SEE | 11
Top line growth & productivity gains mitigating inflationary pressures & supply challenges
6097 12 1,407
Q3 2020 Volume Price FX Q3 2021
1,237
14% Net Sales
Constant Dollar 13%
24
3 3
FX
270
Q3 2020 P/C *Volume
-18
Op. Q3 2021
259
4% Adj EBITDA
Constant Dollar 3%
21.0% Margin
259
19.2% Margin
271
Op. Costs *
($M)
222135 83
YTD 2020 Volume FXPrice YTD 2021
3,562
4,002
12% Net Sales
Constant Dollar 10%
86
16
YTD 2020
-73
Volume P/C **
0 801
Op. FX YTD 2021
772
4% Adj EBITDA
Constant Dollar 2%
Op. Costs **
21.7% Margin
772
20.0% Margin
802
YTD 2020 YTD 2021
Q3 2021 YTD 2021
* Q3 Reinvent SEE benefits $15M: $1M Price Cost Spread (P/C); $14M Operating Costs, including $4M Restructuring Savings** YTD Reinvent SEE benefits $43M: $3M Price Cost Spread (P/C); $40M Operating Costs, including $16M Restructuring Savings

Reinvent SEE Solid Foundation for SEE Operating Engine
© 2021 SEE | 12
Growth workstream accelerating innovation & penetrating adjacent markets
172118
65
355
-416111621263136414651566166717681869196101106111116121126131136141146151156161166171176181186191196201206211216221226231236241246251256261266271276281286291296301306311316321326331336341346351356
'18 & '19 '20 '21E Total
Reinvent SEE Benefits
Price / Cost Spread YoY Benefits
Restructuring YoY Savings
Total YoY Benefits
Logistics rate improvementsStrategic value captureNon-market price movementsProcurement savings
2020 ’18 & ‘19
Operating Costs YoY Benefits
Total Operating CostsYoY Benefits 104
91 7440
205
05101520253035404550556065707580859095100105110115120125130135140145150155160165170175180185190195200205210215220225
'18 & '19 '20 '21E Total
SG&A efficiency and savings on indirect spendManufacturing network efficienciesYield improvements and gauge optimizationMaterial substitution & alternate raw materialDelayering & simplifying organization
Reinvent SEE Cash Payments~
2021 Reinvent SEE Benefits ~$65MOne SEE Operating Engine to drive productivity net of inflation beyond 2021
($M)
Reinventing how we innovate to solve
135
7164
3371
1437
118172
YTD ‘21
40
24
16
3
43
~(Adj EBITDA, $M)
~
~
($M)

Food Net Sales & Adjusted EBITDA
© 2021 SEE | 13
Strength in food service
4046 6
Q3 2020 Q3 2021FXVolume Price
705
797
13% Net Sales
Constant Dollar 12%
($M)
6659
43
FXYTD 2020 Volume Price
2,068
YTD 2021
2,236
8% Net Sales
Constant Dollar 6%
17 14 2
Op.Q3 2020 Volume
-16
P/C FX Q3 2021
152
169
11% Adj EBITDA
Constant Dollar 10%
21.6% Margin
152
21.2% Margin
169
Op. Costs *
27
19 9
YTD 2020
484
Volume Op.
-49
P/C ** FX YTD 2021
478
1% Adj EBITDA
Constant Dollar -1%
Op. Costs **
23.1% Margin
47821.7% Margin
484
YTD 2020 YTD 2021
* Q3 Reinvent SEE benefits $13M: $13M Operating Costs, including $2M Restructuring Savings** YTD Reinvent SEE benefits $31M: $2M Price Cost Spread (P/C); $30M Operating Costs, including $8M Restructuring Savings
Q3 2021 YTD 2021

Protective Net Sales & Adjusted EBITDA
© 2021 SEE | 14
Strength in automation & industrials
20
51 6
Q3 2020
609
Volume Price FX Q3 2021
533
14% Net Sales
Constant Dollar 13%
($M)
15676 40
YTD 2020 Volume Price FX YTD 2021
1,494
1,766
18% Net Sales
Constant Dollar 15%
7
1
Op.Q3 2020 Volume
-2
P/C
-11
FX Q3 2021
109104
-5% Adj EBITDA
Constant Dollar -5%
20.4% Margin
109 16.9% Margin
103
Op. Costs *
598
Op. FXYTD 2020 Volume
-24
P/C **
-16
YTD 2021
293320
9% Adj EBITDA
Constant Dollar 7%
Op. Costs **
19.6% Margin
293
18.1% Margin
320
YTD 2020 YTD 2021
* Q3 Reinvent SEE benefits $2M of Restructuring Savings** YTD Reinvent SEE benefits $12M: $1M Price Cost Spread (P/C); $10M Operating Costs, including $9M Restructuring Savings
Q3 2021 YTD 2021

Free Cash Flow
© 2021 SEE | 15
2021 2020 Adjusted EBITDA 802 772
Interest payments, net of interest income (132) (132)Income tax payments, net of refunds (75) (53)
Reinvent SEE, restructuring & assoc. payments (16) (59)Change in trade working capital, net 1 (105) (119)
Change in other assets/liabilities (96) 1Cash flow provided by operating activities 378 410
Capital expenditures (155) (118)Free Cash Flow 223 292
Nine Months Ended Sept 30,
2021 Free Cash Flow Outlook $520 to $540M
($M)
1 Includes cash from trade receivables, inventory, customer advance payments, and accounts payable net

Purpose Driven Capital Allocation to Create Economic Value
© 2021 SEE | 16
SEE Touchless Automation™, equipment & systems and serviceSmart packaging and digital printing, eCommerceExpand position in attractive markets & geographiesProduct portfolio management discipline
2021 Capital Expenditures ~$210M SEE Touchless Automation™, digital, sustainability
Investing ~25% in circularity & net-zero carbon emission goals~40% growth ~45% maintenance ~15% cost/productivity
Share RepurchaseSept YTD repurchased 6.6M shares for $329M$970M remaining under current authorization
Returning Capital to Shareholders:
DividendsQ3 2021 Cash dividend $30M or $0.20 per shareDividend payout ratio 2 22%
Q3 2021 Net Debt / LTM Adj EBITDA 3.2x2021 FCF Conversion1 Outlook ~47%
Invest & Acquire to Accelerate Growth:Net Leverage, FCF Conversion
SEE Ventures … Entrepreneurial MindsetInnovate faster with disruptive technologies and business modelsAccelerating advancements in sustainable & circular solutions~$40M capital deployed since 2018, creating value
1 FCF Conversion: Free Cash Flow / Adj EBITDA 2 Dividend payout ratio: annual dividend per share / Adj EPS 3 LTM ROIC ~15%, calculation in appendix
Delivering ROIC 3 above cost of capital fueling SEE Operating Engine for EVA

2021 Outlook
© 2021 SEE | 17
Free Cash Flow
Net Sales
~$5.5BAs Reported ~12%
Favorable Currency ~1.5%
Constant Dollar ~11%Food ~8%, Protective ~15%
Adj EBITDA
$1.12 to $1.14BAs Reported 6.5 – 8.5%
Favorable Currency ~1.5%
Margin ~20.5%
Adj EPS
$3.50 to $3.60As Reported 10 – 13%
D&A ~$230MInt Exp, Net ~$167MAdj Tax Rate ~26%
Free Cash Flow
$520 to $540MCapex ~$210M
Restructuring Payments ~$40M
$5.4 to $5.5BAs Reported 10 – 12%
Favorable Currency ~2%
Constant Dollar 8 – 10%Food 5 – 7%; Protective 13 – 15%
Previous Guidance (Aug 2021)
$1.12 to $1.15BAs Reported 7 – 9%
Favorable Currency ~2%
Margin ~20.8%
$3.45 to $3.60As Reported 8 – 13%
D&A ~$235MInt Exp, Net ~$170MAdj. Tax Rate ~26%
$520 to $570M
Capex ~$210M
Restructuring Payments ~$40M
Share gains in markets & geographiesEquipment & systems, eComm, industrial, food strength SEE Operating Engine outperforms
Outlook RangeDramatic inflation continuesSupply disruptions continue
++–
–
+
Net Sales Adj EBITDA Adj EPS


AppendixU.S. GAAP Summary & Reconciliations
© 2021 SEE | 19
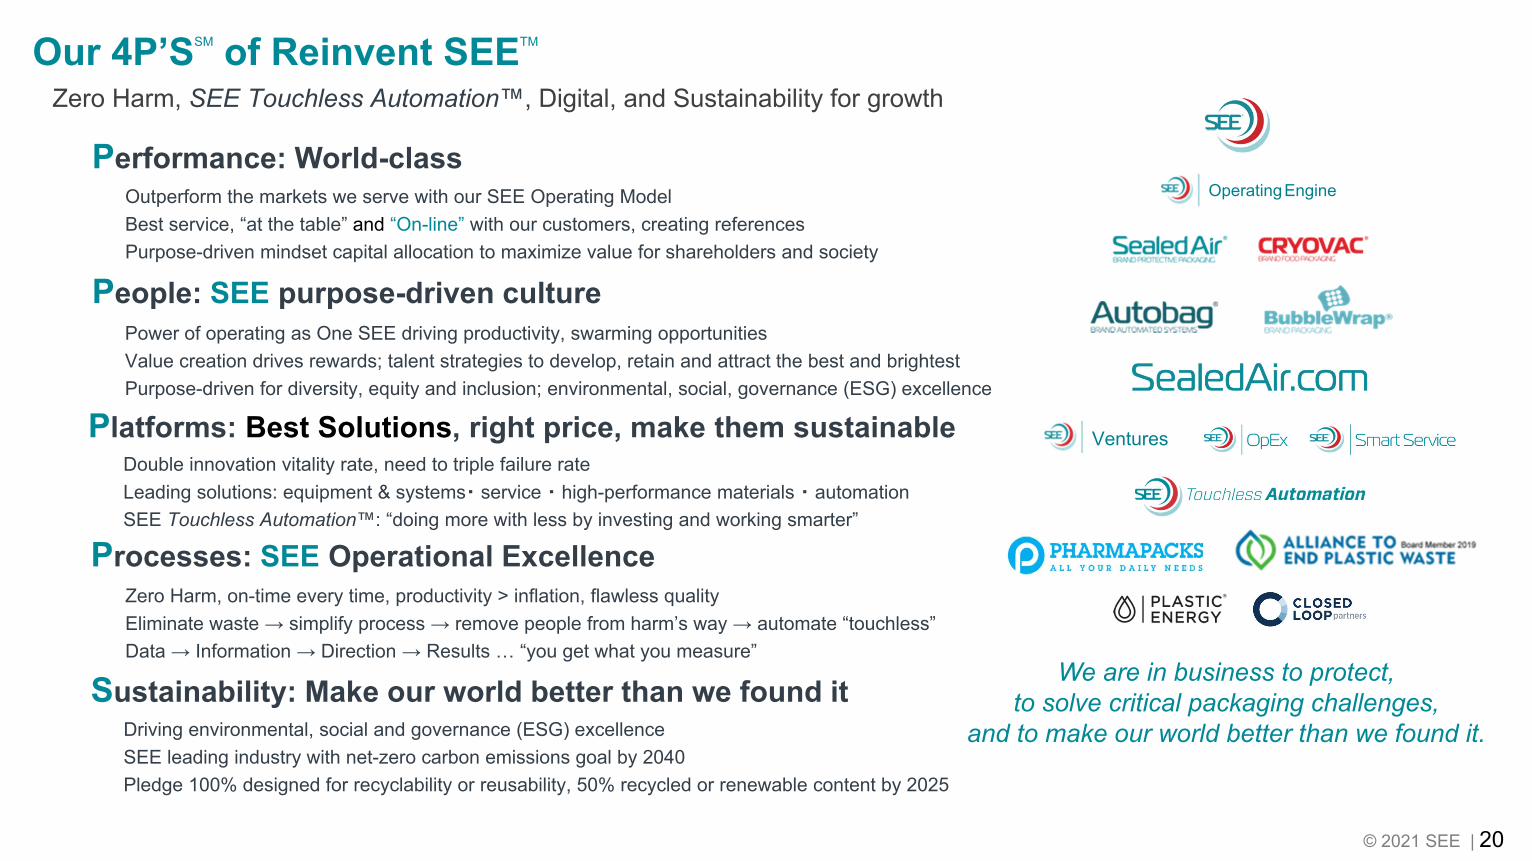
Performance: World-class
Platforms: Best Solutions, right price, make them sustainable
Processes: SEE Operational Excellence
People: SEE purpose-driven culture
Sustainability: Make our world better than we found it
Outperform the markets we serve with our SEE Operating ModelBest service, “at the table” and “On-line” with our customers, creating references Purpose-driven mindset capital allocation to maximize value for shareholders and society
Power of operating as One SEE driving productivity, swarming opportunitiesValue creation drives rewards; talent strategies to develop, retain and attract the best and brightestPurpose-driven for diversity, equity and inclusion; environmental, social, governance (ESG) excellence
Double innovation vitality rate, need to triple failure rateLeading solutions: equipment & systems・ service ・ high-performance materials ・ automationSEE Touchless Automation™: “doing more with less by investing and working smarter”
Zero Harm, on-time every time, productivity > inflation, flawless qualityEliminate waste → simplify process → remove people from harm’s way → automate “touchless” Data → Information → Direction → Results … “you get what you measure”
Driving environmental, social and governance (ESG) excellenceSEE leading industry with net-zero carbon emissions goal by 2040Pledge 100% designed for recyclability or reusability, 50% recycled or renewable content by 2025
Zero Harm, SEE Touchless Automation™, Digital, and Sustainability for growth Our 4P’SSM of Reinvent SEETM
© 2021 SEE | 20
OperatingEngine
Ventures
We are in business to protect, to solve critical packaging challenges,
and to make our world better than we found it.

U.S. GAAP Summary & Reconciliations
© 2021 SEE | 21
Three Months Ended September 30,2021 2020
($M, except tax rate and per share data)Net Sales $ 1,406.7 $ 1,237.2
Pre-tax Earnings from Continuing Operations 154.4 149.2 Net Earnings from Continuing Operations 107.8 131.8
EPS from Continuing Operations (Diluted) $ 0.71 $ 0.85 Effective Tax Rate 30.2% 11.7%
Operating Cash Flow $ 178.0 $ 197.2
Q3 '21 Net Debt / Adjusted EBITDA($M)Non-U.S. GAAP Total Company Adj EBITDA (LTM) $ 1,081 Total Debt $ 3,804 Less: cash and cash equivalents 394
Net Debt $ 3,410 Net Debt / Adjusted EBITDA 3.2
Nine Months Ended September 30,2021 2020
$ 4,002.3 $ 3,562.3 469.2 441.3 322.2 346.6
$ 2.10 $ 2.22 31.3% 21.5%
$ 377.5 $ 410.2
Three Months Ended September 30,2021 2020
($M, except per share data) Net Earnings Diluted EPS Net Earnings Diluted EPS
U.S. GAAP net earnings and diluted EPS from cont. operations $ 107.8 $ 0.71 $ 131.8 $ 0.85
Special Items 22.1 0.15 (4.7) (0.03)
Non-U.S. GAAP Adjusted net earnings and adjusted diluted EPS $ 129.9 $ 0.86 $ 127.1 $ 0.82
Weighted average number of common shares outstanding - Diluted 151.4 156.1
Nine Months Ended September 30,2021 2020
Net Earnings Diluted EPS Net Earnings Diluted EPS
$ 322.2 $ 2.10 $ 346.6 $ 2.22
50.7 0.33 12.2 0.08
$ 372.9 $ 2.43 $ 258.8 $ 2.30
153.2 155.8
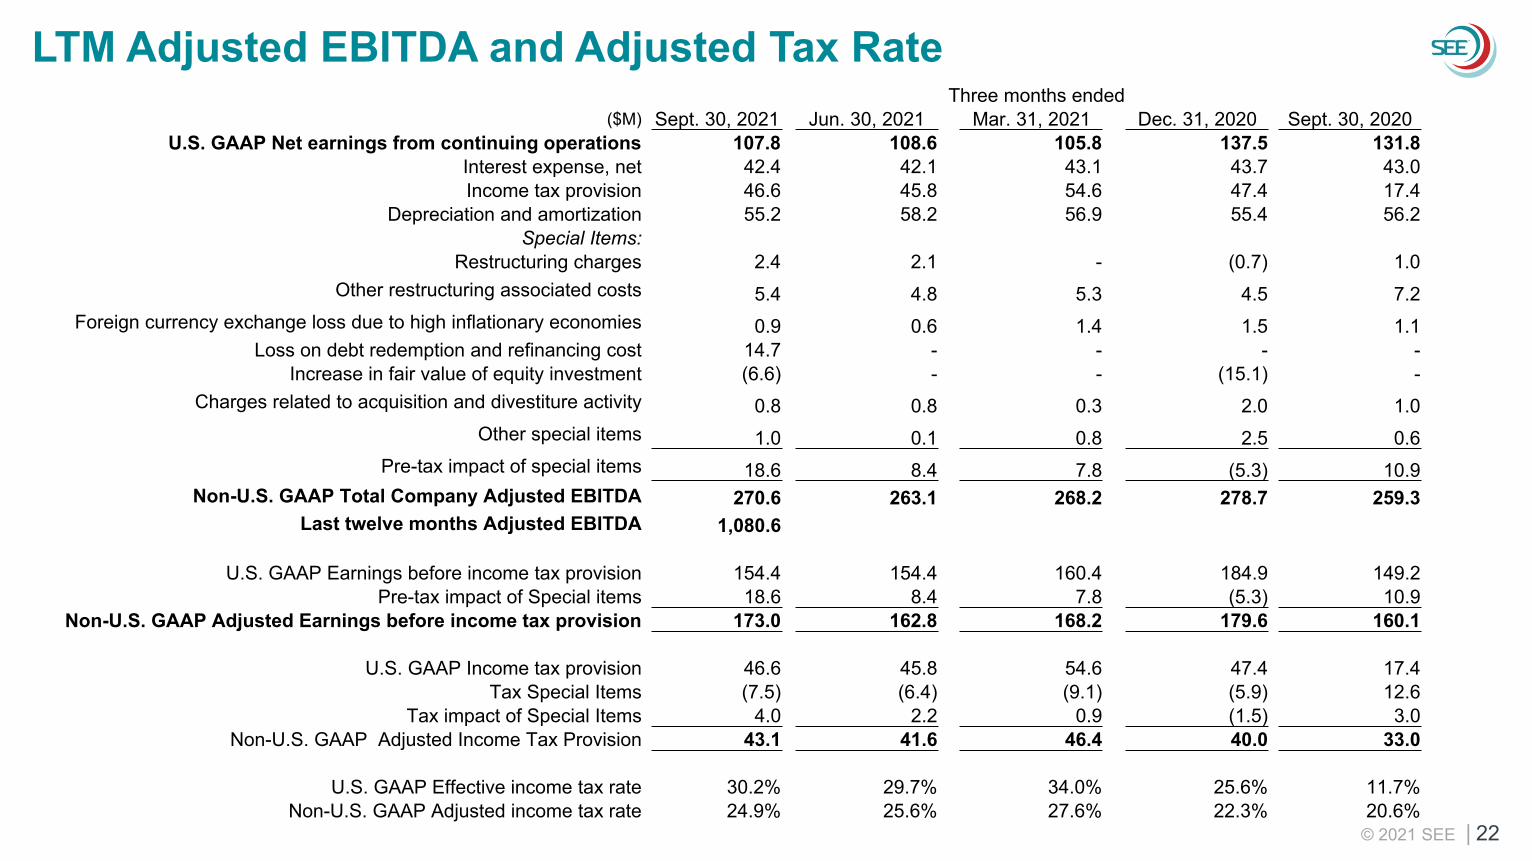
LTM Adjusted EBITDA and Adjusted Tax Rate
© 2021 SEE | 22
Three months ended($M) Sept. 30, 2021 Jun. 30, 2021 Mar. 31, 2021 Dec. 31, 2020 Sept. 30, 2020
U.S. GAAP Net earnings from continuing operations 107.8 108.6 105.8 137.5 131.8 Interest expense, net 42.4 42.1 43.1 43.7 43.0 Income tax provision 46.6 45.8 54.6 47.4 17.4
Depreciation and amortization 55.2 58.2 56.9 55.4 56.2 Special Items:
Restructuring charges 2.4 2.1 - (0.7) 1.0 Other restructuring associated costs 5.4 4.8 5.3 4.5 7.2
Foreign currency exchange loss due to high inflationary economies 0.9 0.6 1.4 1.5 1.1 Loss on debt redemption and refinancing cost 14.7 - - - -
Increase in fair value of equity investment (6.6) - - (15.1) -Charges related to acquisition and divestiture activity 0.8 0.8 0.3 2.0 1.0
Other special items 1.0 0.1 0.8 2.5 0.6 Pre-tax impact of special items 18.6 8.4 7.8 (5.3) 10.9
Non-U.S. GAAP Total Company Adjusted EBITDA 270.6 263.1 268.2 278.7 259.3 Last twelve months Adjusted EBITDA 1,080.6
U.S. GAAP Earnings before income tax provision 154.4 154.4 160.4 184.9 149.2Pre-tax impact of Special items 18.6 8.4 7.8 (5.3) 10.9
Non-U.S. GAAP Adjusted Earnings before income tax provision 173.0 162.8 168.2 179.6 160.1
U.S. GAAP Income tax provision 46.6 45.8 54.6 47.4 17.4Tax Special Items (7.5) (6.4) (9.1) (5.9) 12.6
Tax impact of Special Items 4.0 2.2 0.9 (1.5) 3.0Non-U.S. GAAP Adjusted Income Tax Provision 43.1 41.6 46.4 40.0 33.0
U.S. GAAP Effective income tax rate 30.2% 29.7% 34.0% 25.6% 11.7%Non-U.S. GAAP Adjusted income tax rate 24.9% 25.6% 27.6% 22.3% 20.6%

© 2021 SEE | 23
ROIC Calculation LTM September 30, 2021
1 Adjusted Tax Rate represents blended average over last 12 months; refer to previous slide for Adjusted Tax Rate reconciliation by quarter2 Short-term borrowings, Long-term Debt (Current and non-current); and Operating Lease Liabilities (Current and Non-current)
Q3 2021 Trailing Twelve Months
($M, except tax rate data)
Adjusted EBITDA (Non-GAAP) 1,081 Less: Depreciation and Amortization (226)
Adjusted Operating Profit 855
Adjusted Tax Rate (Non-GAAP)1 25%Tax on Adjusted Operating Profit (214)
Net Adjusted Operating Profit After Tax 641
Q3 '20 Q3 '21 Avg: '20 & '21
Book value of Equity 25 128 76 (Total Stockholders' (Deficit) Equity
Current and Long-Term Debt and Operating Leases2 3,818 3,874 3,846
Other Long-Term Liabilities 726 744 735 (Deferred taxes; Other non-current liabilities)
Less: Non-Operating Assets (318) (397) (357)(Cash/equivalents; Marketable Securities; Current Assets Held for Sale)
Total Capital 4,251 4,349 4,300
Returned on Invested Capital 15%

© 2021 SEE | 24
U.S. GAAP Summary & ReconciliationsFull Year Historical Performance
Twelve Months Ended Dec. 31,2020 2019 2018 2017
($M, except tax rate and per share data)Net Sales $ 4,903.2 $ 4,791.1 $ 4,732.7 $ 4,461.6
Pre-tax Earnings from Continuing Operations 626.2 370.3 457.8 393.3 Net Earnings from Cont. Ops. 484.1 293.7 150.3 62.8 EPS from Cont. Ops. (Diluted) $ 3.10 $ 1.89 $ 0.94 $ 0.33
Effective Tax Rate 22.7% 20.7% 67.2% 84.0%Operating Cash Flow $ 737.0 $ 511.1 $ 428.0 $ 424.4
U.S. GAAP Net earnings from Cont. Ops. $ 484.1 $ 293.7 $ 150.3 $ 62.8 Interest expense, net 174.4 184.1 177.9 184.2 Income tax provision 142.1 76.6 307.5 330.5
Depreciation and amortization, net of adjustments 216.5 184.5 159.0 158.3 Special items
Restructuring charges 11.0 41.9 47.8 12.1 Other restructuring associated costs 19.5 60.3 15.8 14.3
FX loss on high inflationary economies 4.7 4.6 2.5 -Loss on debt redemption and refinancing activities - 16.1 1.9 -
Increase in fair value of equity investments (15.1) - - -Novipax settlement agreement - 59.0 - -
Acquisitions and divestitures charges 7.1 14.9 34.2 84.1 Other Special Items 6.8 29.1 (7.4) (13.0)
Pre-tax impact of Special Items 34.0 225.9 94.8 97.5 Non-U.S. GAAP Adj EBITDA from Cont. Ops. $ 1,051.1 $ 964.8 $ 889.5 $ 833.3

© 2021 SEE | 25
Components of Change in Net Sales by Segment & Region
Three Months Ended September 30,($M) Food Protective Total Company2020 Net Sales $ 704.6 57.0% $ 532.6 43.0% $ 1,237.2 100.0%
Price 46.3 6.6% 50.7 9.5% 97.0 7.8%Volume1 40.2 5.7% 20.1 3.8% 60.3 4.9%Total constant dollar change
(non-U.S. GAAP) 86.5 12.3% 70.8 13.3% 157.3 12.7%Foreign currency translation 6.3 0.9% 5.9 1.1% 12.2 1.0%Total change (U.S. GAAP) 92.8 13.2% 76.7 14.4% 169.5 13.7%2021 Net Sales $ 797.4 56.7% $ 609.3 43.3% $ 1,406.7 100.0%
Three Months Ended September 30,($M) Americas EMEA APAC Total2020 Net Sales $ 794.2 64.2% $ 255.7 20.7% $ 187.3 15.1% $ 1,237.2 100.0%
Price 86.6 10.9% 9.3 3.6% 1.1 0.6% 97.0 7.8%Volume1 24.7 3.1% 24.8 9.7% 10.8 5.8% 60.3 4.9%Total constant dollar change (non-U.S. GAAP) 111.3 14.0% 34.1 13.3% 11.9 6.4% 157.3 12.7%Foreign currency translation 1.9 0.3% 5.2 2.1% 5.1 2.7% 12.2 1.0%Total change (U.S. GAAP) 113.2 14.3% 39.3 15.4% 17.0 9.1% 169.5 13.7%
2021 Net Sales $ 907.4 64.5% $ 295.0 21.0% $ 204.3 14.5% $ 1,406.7 100.0%
1 Volume includes the net impact of changes in unit volume as well as the period-to-period change in the mix of products sold
Q3 2021